1. Introduction
Large-scale battery applications like electric vehicles (EV) have to meet high power and energy demands, which is mostly realized by the parallel-connection of lithium-ion cells, e.g., Tesla Model S (74p96s (The abbreviation xpys corresponds to a cell configuration with x cells in parallel and y cells in serial connection)), Tesla Model 3 (46p96s), VW eGolf (3p88s), Nissan Leaf (2p96s), BAIC EU260 (3p90s), Renault Zoe (2p96s) and Audi etron (4p108s) [
1,
2]. Caused by production-induced distributions of cell resistances and capacities [
3,
4], inhomogeneous cell currents arise within these parallel cell configurations [
5], further leading to State of Charge (SoC) [
6,
7], Open Circuit Voltage (OCV) [
8,
9] and temperature gaps [
6,
10] within the parallel cells. Since the cell currents must be maintained in their corresponding operating window and cannot be measured for space and cost considerations, correlations of the current distribution to cell parameters and cell states are essential for an optimal and safe battery operation.
There is a variety of articles focusing on modeling [
11,
12,
13,
14,
15], aging [
16,
17,
18], safety [
19,
20,
21], state estimation [
22,
23] and measurement [
24,
25,
26] of parallel-connected cells. Mostly qualitative effects like OCV [
27], SoC [
13], temperature [
13,
26,
28,
29] and current differences [
13] are demonstrated but quantitative relationships are missing, especially with regard to the thermal connection of the cells to neighboring cells and cooling. The cell temperature, as well as the temperature difference between parallel cells, can have a high influence on the current distribution both due to the high sensitivity of the cell resistance to the temperature [
30,
31] and due to the correlation of heat dissipation to the cell current [
32].
Therefore, in
Section 2, a test bench with a flexibly adjustable thermal connection of the individual cells to their neighboring cells and cooling is presented. Thus, both the formation of temperature gradients due to the current distribution and the impacts of design-induced temperature gradients in a battery module on the current distribution can be investigated. In
Section 3, an extended dual polarization Equivalent Circuit Model (ECM) is introduced and compared to measurements. This simulation model takes into account the influences of the test bench on the current distribution and the parallel-connected cell layers within the cells. In
Section 4, the influence of temperature gradients induced by inhomogeneous thermal connections of the cells to neighboring cells and cooling on the current distribution of two parallel-connected cells are investigated. At the end, a conclusion is given.
2. The Test Bench
In this section, the test bench is discussed. First, the interactions and functions of all subsystems are explained and afterwards the temperature control system is presented in more detail. Finally, the possible impacts of the test bench on the current distribution are demonstrated.
2.1. Interactions and Communication of the Subsystems
Figure 1 shows the test bench for one cell with view-optimized modifications (a), a schematic view of the temperature control system (b), a detailed view of the position and orientation of the temperature sensors (c), as well as a detailed view of the electrical connection of the cells to the cell tester highlighting the voltage and current measurement of each cell (d).
The test bench for each cell (10) consists of two Peltier Elements (11), two aluminum plates (3), two CPU coolers (1), two speed controllers (2), a measurement device (4), one micro-controller (6) and a power supply unit (7). The housing is electrically grounded and consists of aluminum profiles (5). The cell tabs are connected to the load cable via a screwed aluminum union joint (13). The cell temperature is captured by two Pt100 sensors (12) of each cell side,
and
see
Figure 1c. The temperature of the adjacent aluminum plates is measured with one Pt100 sensor
. The cell voltage
is measured at the cell tabs, the cell current
is calculated via the voltage drop at the load cable (14) of each cell, see
Figure 1d. The load cables of the cells are connected to a cell tester. This setup enables one to investigate any cell topology; the number of parallel-connected cells is only limited by the size of the climate chamber. The communication and interaction of these subsystems are presented in
Figure 2.
The measurements are conducted in a temperature controlled climate chamber and the battery load is controlled by a cell tester. The temperatures of the lithium-ion cells are regulated by Peltier Elements. One side of the Peltier Elements is thermally coupled to the CPU coolers to keep the temperature of this side constant at ambient temperature. In order to ensure temperature homogeneity at the cells, the Peltier Elements are embedded in aluminum plates. In addition, the plates and the cells are isolated by Polystyrene (9). The assembly of these subsystems is presented in
Figure 1b. The voltages of the Peltier Elements are adjusted by speed controllers, which in turn are controlled by micro-controllers. These are regulated by a PI controller implemented in Matlab.
Measurement data, including six Pt100 temperature sensors (12), three for each cell side, as well as two voltage signals, are recorded with a frequency of Hz. The signals are transferred by an interface via CAN to a PC and real time processed in Matlab. The power for the speed controllers, the measurement device and CPU coolers is provided by a power supply unit.
In addition, the pressure on the cells is kept constant by a spring construction and the mobility of one aluminum plate. A fluctuation of the pressure due to the correlations of the cell’s thickness to SoC [
33,
34] and temperature [
35] as well as the continuous increase of the cell thickness caused by lithium plating and gassing [
36] could otherwise have a negative effect on cell aging [
37]. The manufacturers and the corresponding types of the individual components are summarized in
Table 1.
The functionality of the temperature control system, temperature homogeneity of the aluminum plates and the heating rate are explained in more detail in
Section 2.2.
2.2. Temperature Control System
The control of the cell temperature as well as the temperature homogeneity at the cells were decisive tasks for the test bench in order to fulfill reliable and trustful measurements. In order to validate these requirements, nine temperature sensors were fixed on the cell adjacent subarea of the aluminum plate,
Figure 3a, and an exemplary regulation from
C to
C and further to
C,
Figure 3b, was conducted.
Figure 3f–h demonstrates the temperature homogeneity of the aluminum plate. The temperature distribution on the plate was determined by weighting each temperature sensor depending on their distance to the respective point. In the stationary state, the maximum temperature difference within the plate was about
C. The differences can be caused, on the one hand, by the smaller area of the Peltier Element compared to the aluminum plate and, on the other hand, by the energy exchange with the environment.
Another important requirement of the temperature control system is to realize a higher heating rate of the aluminum plates
compared to the maximum heating rate of the cells
caused by dissipation
, which can be estimated by
with the maximum cell resistance
, the cell current
, the cell’s heat capacity
and the cell mass
. The cell’s resistance was determined by pulse tests as described in
Section 3.2 and ranges between
m
and
m
, depending on the SoC, temperature and time. With a maximum cell current of
, the required heating rate can be calculated with Equation (
2) from
mK
to
mK
. However, as the maximum currents of
C are only permitted at cell temperatures above
C and the voltage limits are reached at about
for these high currents, the practical limit can be set to
mK
.
The heating rate of the aluminum plate is approximately limited to
mK
, as shown in
Figure 3c–e. This enables a precise temperature adjustment of the cells and the reconstruction of temperature gradients within a battery module due to varying thermal connections of the cells to neighboring cells and cooling.
2.3. Impacts of the Test Bench on the Current Distribution
The ratios of the resistances and capacities of the parallel-connected cells have one of the main influences on the current distribution. This was shown qualitatively by measurements and simulations in [
1], the quantitative influences of these parameters were mathematically proven in previous work [
8,
9].
For this reason, additional resistors induced by the test bench can significantly influence the current distribution. Due to the electrical connection of the cell tester and the lithium-ion cells, additional resistances arise in series with the cells, which are demonstrated in
Figure 4.
The contact resistances at the cell tabs as well as the cable resistances must on the one hand be well-known and on the other hand be kept low, at least their difference. As a result of the first Kirchhoff’s law the following is valid
with the cell voltage
, the positive
and negative tab voltages
as well as the voltages of the positive
and negative load cable
of cell
i. In order to keep these disturbing values of the test bench on the current distribution low, the following conditions must be fulfilled
The contact resistance at the tabs were examined and the cable resistances were varied in order to validate their impacts on the current distribution.
2.3.1. Contact Resistance at the Tabs
In order to keep the contact resistance at the cell tabs low, different influences on these resistances were investigated. The contact resistances were calculated by a four terminal measurement using a micro ohmmeter (MPK, 2000e). The influences of surface cleaning, torque and air insulation were researched. Therefore the tabs were treated with a non-woven abrasive cloth and then cleaned with an oxide-dissolving spray (CRC-Kontaktchemie, Kontakt 60). In addition, tests with varied contact pressure and conductive epoxy resin were conducted in order to isolate the tabs. For the investigation of the contact pressure, the resistances of twelve cathode and anode tabs were examined. To research the impacts of air seal, six of the cathode tabs were treated with conductive epoxy resin. The other six cathode tabs and the twelve anode tabs were not sealed with epoxy resin. The results are presented in
Figure 5, whereby for each point the mean, minimum and maximum value is shown.
The influences of surface cleaning and contact pressure, as presented in
Figure 5a,b, have already been investigated in [
38,
39] with the same findings.
Figure 5c shows the influence of the air seal. While the contact resistances at the cathode tabs with air seal remained almost constant over the test period of 51 days, the resistances without air seal increased 2.5 times from
to
. It is assumed that oxidation on the tabs will lead to this increase. A relaxation of the surface pressure during the test period could additionally have led to an increasing contact resistance. However, since the resistances at the anode tabs remained unchanged, this effect should be not that significant. The anode tabs do not require an air seal due to their nickel coating, which shows up in an unchanged resistance over the test period. Furthermore, the contact resistances at the tabs and therefore the corresponding disturbing voltage drops
and
are low compared to the cell resistance with
which should lead to no significant impacts on the current distribution.
2.3.2. Cable Resistance
In addition to the requirement of low resistance, the load cables were also used as a shunt to determine the cell currents, which were calculated via the voltage drop at the cables. Since this drop correlates to the cable resistance, a trade off between the measurement accuracy and the influence on the current distribution arise. Therefore different cable resistances and their impacts on the current distribution were investigated by measurements with two parallel-connected cells. The cable resistances were examined by four terminal measurements using a multimeter (Keithley, DMM7510) and are given in
Table 2.
In relation to the cell resistance, the cable resistances of the first type range from to depending on the SoC and cell temperature and should have no significant influence on the current distribution. Type 3 uses the complete measuring range of the measuring device, which should lead to the highest measurement accuracy. Type 2 offers a trade off.
The current distribution of two parallel-connected cells with the discussed cables are presented in
Figure 6. The temperature of the aluminum plates were kept constant at
C. The cells were discharged with a current load of
A, which corresponds to a C-rate of 1C. The discharge started with a
and lasted until the cell voltage reaches the voltage limit of
V. After a break of 30 min, the cells were charged with a C-rate of 1C until the cell voltage reached the voltage limit of
V. Thereafter the cells were relaxed for 30 min.
The current distribution is qualitatively the same for the three different cables with a shift to higher current differences within the parallel-connected cells with increasing cable resistance. However, this may also be due to the higher difference between the cable resistances. The differences are most obvious at the current rest and at the end of the discharge phase. This can be caused by the correlation of the time constant to the cell’s resistance, as mathematically shown in previous work [
8,
9].
3. Simulation
In this section the used ECM is presented and the parametrization of the cells is discussed. At the end simulations are compared to measurements of two parallel-connected cells.
3.1. Equivalent Circuit Model
In
Figure 7 the implemented dual polarization model is demonstrated. The model considers the mentioned resistances due to the connection of the cells to the cell tester and the parallel-connection of
L cell layers within the lithium-ion cell. ECMs with RC-pairs are widely used for the simulation of the current distribution within parallel-connected cells [
1,
2,
40,
41,
42,
43].
This ECM was connected in parallel and solved as described in previous work [
8,
9].
3.2. Parametrization
The model was parameterized by Constant-Current Constant-Voltage (CCCV) measurements to estimate the cell’s capacity. With a constant current of 1C until
V for charging, respectively
V for discharging. The voltage was kept constant until the cell current reached
C. The serial resistor and the parameters of the RC-pairs were determined by 2C charge and discharge current pulses at 34 different SoCs. The cells were relaxed one hour after each pulse to estimate the OCV and guarantee same start conditions for each pulse. The measurements were repeated at different cell temperatures (The current pulses were reduced to
C at cell temperatures
C in order to keep the cells in their operating window.)
, 5, 10, 20, 30 and
C. The parametrization process as well as the results of the ECM parameters are presented in more detail in previous work [
2].
3.3. Validation
In order to validate the discussed ECM, simulations are compared to measurements in
Figure 8. Each of the used cells consists of 40 cell layers, whose resistances and capacities were randomly drawn from Gauss distributions. With the related standard deviations of the cell’s resistance and the cell’s capacity
with the standard deviation of the cell’s resistance
and the cell’s capacity
, the mean value of the cell’s resistance
and the cell’s capacity
as well as the number of parallel-connected cell layers
L. The standard deviations of the parameters were multiplied by the square root of
L to consider the statistical averaging due to the parallel cell layers. The related standard deviations
and
were set to
and
, which are typical parameter distributions caused by manufacturing tolerances as found in [
3,
4]. The expected values
and
were adjusted according to the parametrization results of each cell. The load cable resistances
were set according to the values of
Table 2. For the tab resistances
, the average values of the measurements in
Figure 5c were used.
The results of the simulation in
Figure 8 agree well with those of the measurement with an RMSD of
A. The highest differences appeared at the end of discharge and at the first current rest. The simulated layer currents,
Figure 8a, within the cells show a similar distribution with an shift depending on the cell parameters.
4. Impacts of the Module Design
Due to the cell packaging, inhomogeneities in terms of cooling and thermal connection of the cells to their neighbor cells arise within a battery module. The influence of the ambient temperature depends on the cell position in the module, whereby the cells at the edge of the module are mainly affected. This leads to inhomogeneous cell cooling resulting in temperature gradients. Existing tension mats, which thermally isolate the cells, can further intensify arising temperature gradients. Possible scenarios are presented in
Figure 9.
In order to investigate the influence of the cell position and thermal connection of cells, the tension mats were modeled as heat impermeable and the module housing was assumed to be isotherm with a constant temperature at ambient temperature. For each scenario, which considers the effects of the border cell, two measurements were conducted to switch the border position of the two parallel-connected cells. The reference represents conditions at a constant cell temperature, which rather corresponds to most publications.
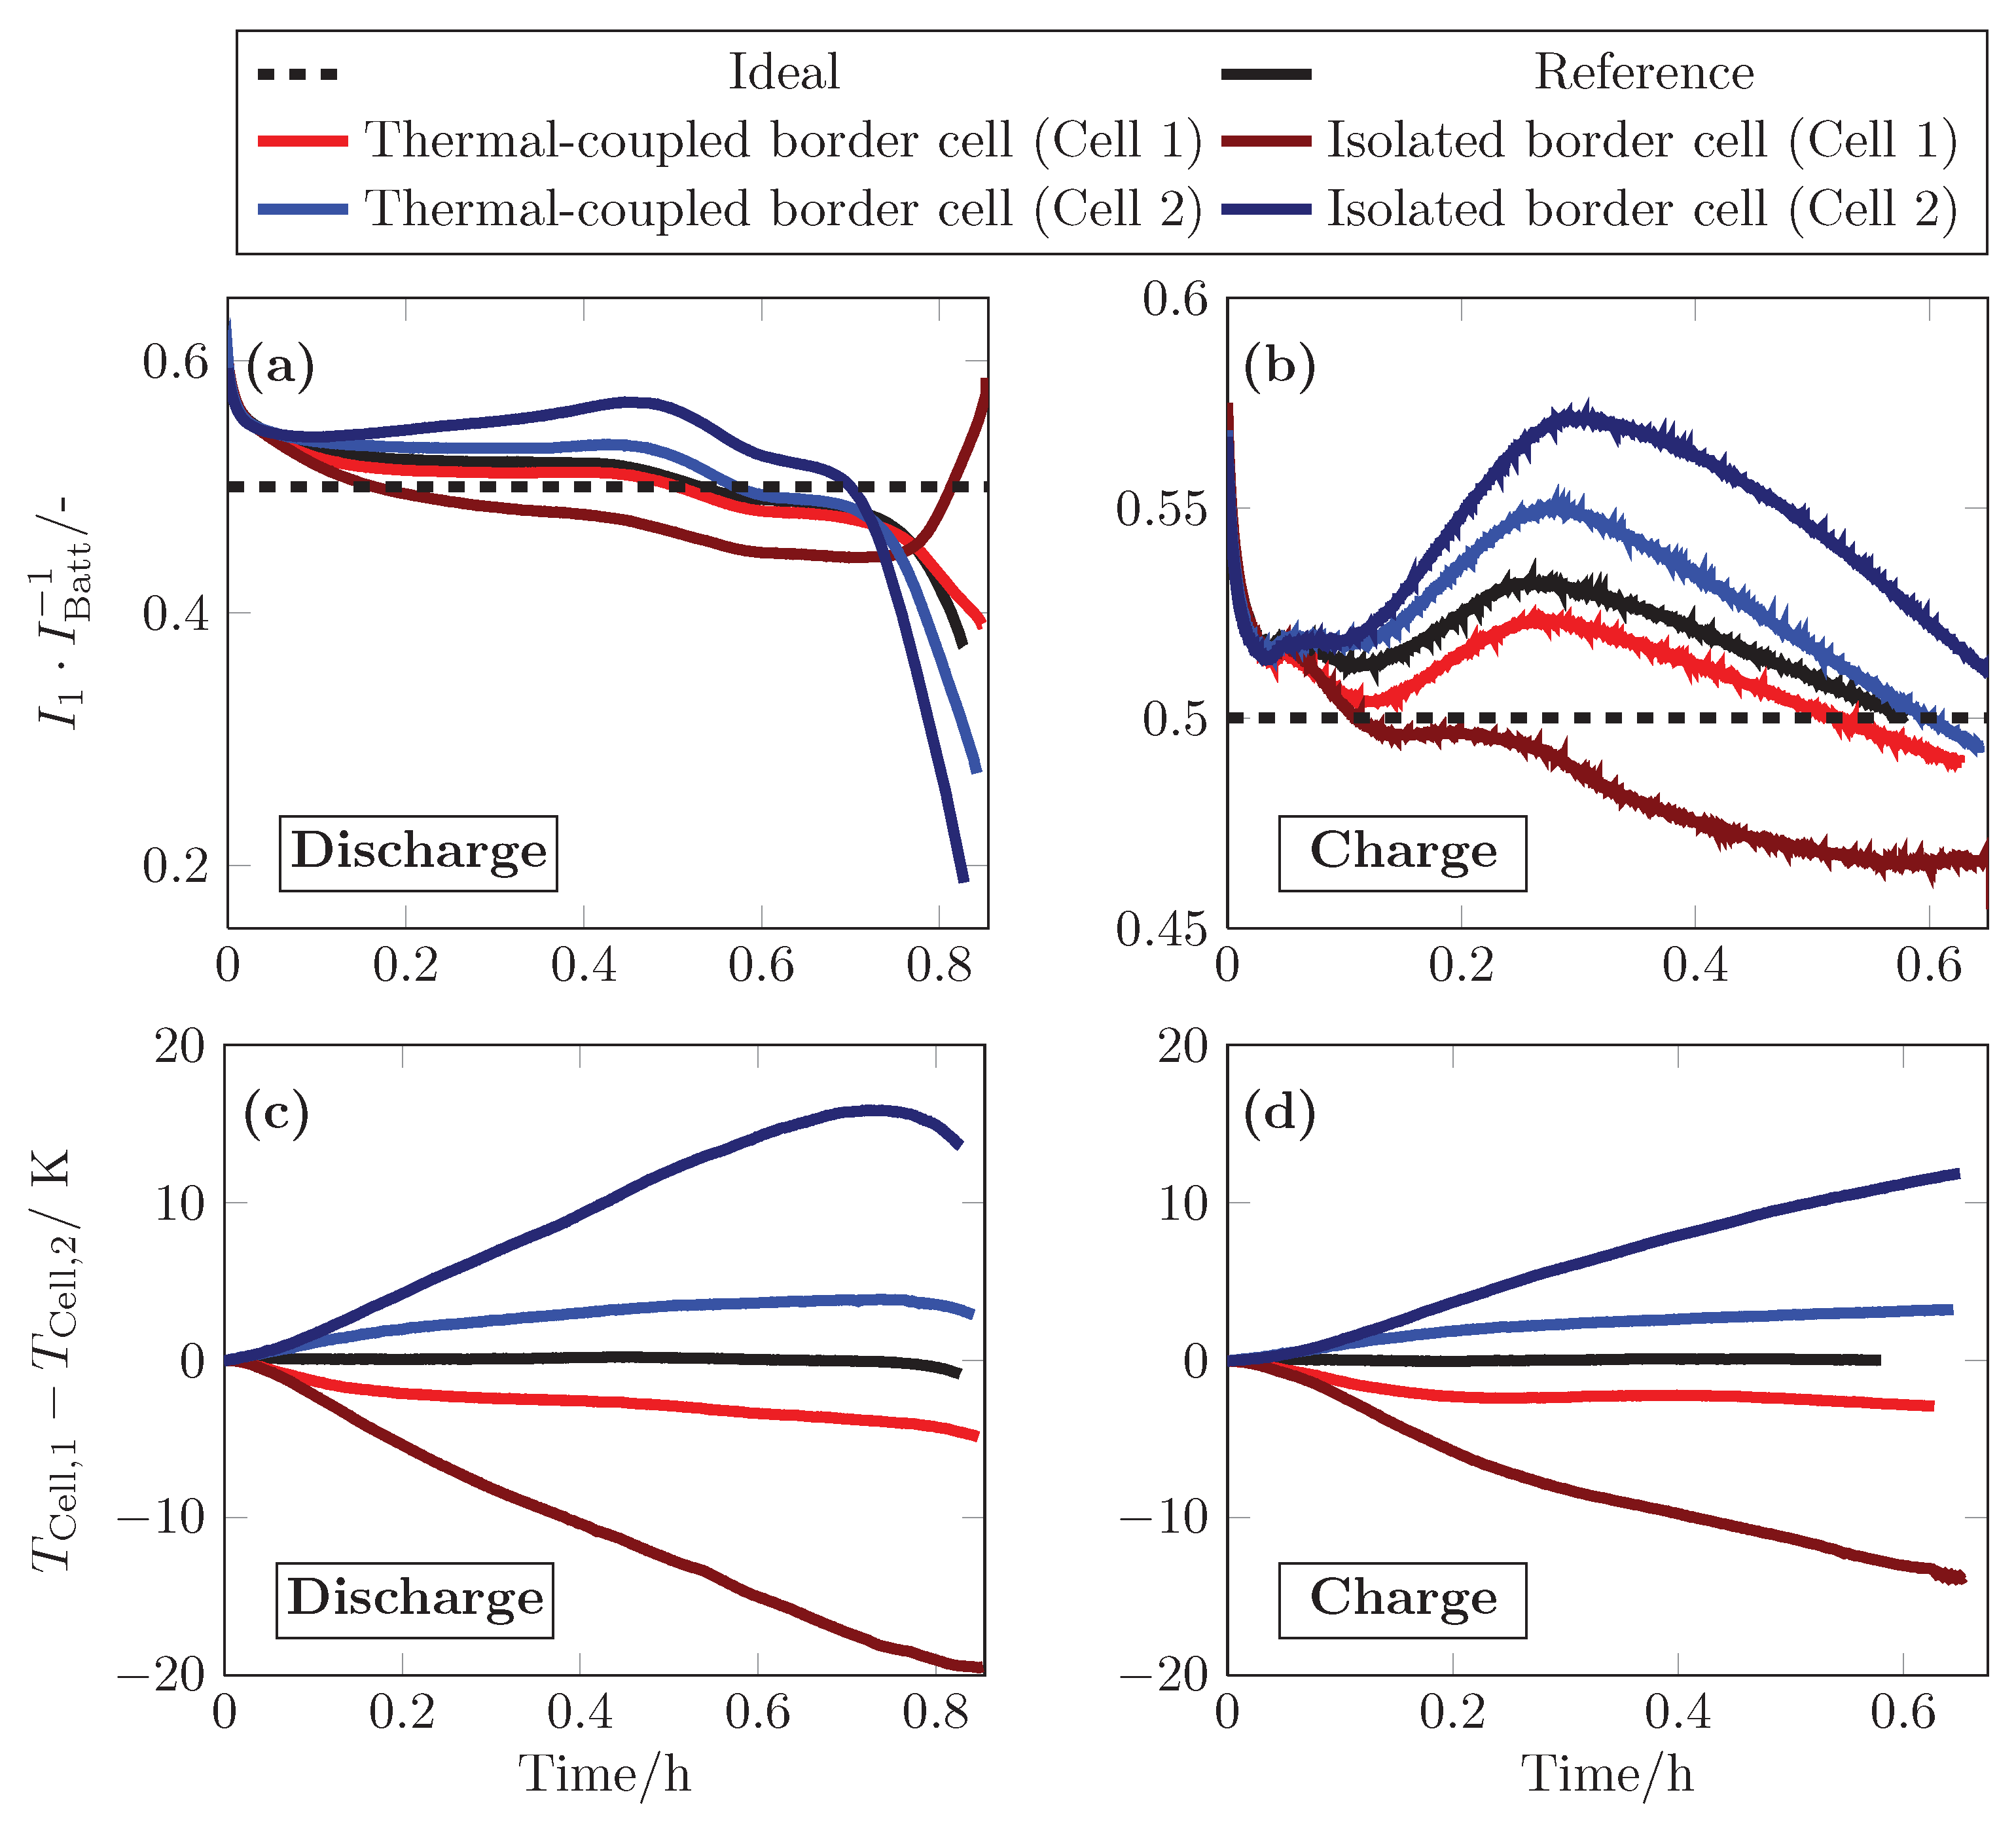
The current and temperature distribution of these scenarios for two parallel-connected cells are displayed in
Figure 10. The cells were fully discharged with
C until the cell pack reached the lower voltage limit of
V. Thereafter, the cells were further discharged at constant voltage of
V until the battery current decreased to
. After a relaxation of
h, the parallel-connected cells were charged with
C until the upper voltage limit of
V was reached. The ambient temperature and the initial temperature of the aluminum plates were set to
C.
The scenarios show significant differences of the current and temperature distribution of the parallel-connected cells. In the following the scenarios will be separately discussed.
Cell 2—Border Cell
With cell two as border cell, temperature gaps of C for the thermal-coupled and of C for the thermal isolated cells raised at discharge. This caused higher current differences and delayed crossing points of the cell currents and resulted in increasing SoC gaps within the parallel cells. For discharging this significantly influenced the current distribution after the crossing point. The OCV bending at low SoC led to a rapid voltage drop of cell one, which resulted in a current peak of cell two. This effect is more distinct with increasing SoC difference, which shows up in an increasing current gap from to comparing the thermal-coupled and the isolated scenario. For charging similar effects can be seen. As the current load starts at the point of the highest OCV bending and therefore no distinct SoC gaps have been raised, the rapid current decrease is not seen for charging.
Cell 1—Border Cell
In this scenario the temperature difference showed the same affects on the current distribution, but considering the current of cell one in opposite direction. The temperature difference led to a lower current of cell one and an earlier starting of the crossing point, even compared to the reference measurement. The temperature gap in the thermal-coupled scenario affect more balanced cell currents compared to the reference. This led also to a lower SoC gap, which in turn reduced the current peak of cell two to . The isolation further decreases the current of cell one , which caused a higher discharge and charge rate of cell two compared to cell one.
5. Conclusions
In this article a test bench was presented, which enables the individual temperature control of each cell connected in parallel. This allows to reconstruct arising temperature gradients in a battery module due and to investigate their impacts on the dynamic of the current distribution. The aluminum plates adjacent to the cells can be heated and cooled with a rate of about mK, which exceeds the maximum heating rate of the cells due to dissipation with mK. The influence of the test bench on the current distribution caused by induced additional resistors was determined and minimized. The contact resistance at the cathode tab was reduced from to by treating with a non-woven abrasive cloth, cleaning with an oxide-dissolving spray and increasing the pressure from to . In addition, an increase of the contact resistance during the test period is prevented by air seal of the contact. Without air sealing, the resistance increased from to within 51 days at room temperature. The contact resistance at the anode tab was reduced by the same treatments from to . Due to their nickel coating an air seal was not necessary.
Measurements of two parallel-connected cells with load cable resistances of m, m and m showed qualitatively the same dynamic of the current distribution with decreasing current differences within the parallel-connected cells with decreasing cable resistance. An ECM considering the current distribution within the cells as well as the impacts of the induced resistances by the test bench was introduced, parameterized and compared to measurements. The model fitted well to measurements with an RMSD of A. Measurements simulating different cell positions in a battery and thermal connections of cells to their neighbor cells were conducted. The consideration of a cell at the module edge showed increasing temperature differences of C for thermal-coupled cells and of for thermal isolated cells. This temperature difference further increased the initial cell parameter difference and led to higher current and SoC gaps within the parallel-connected cells. The crossing point of the cell current was delayed with increasing , which in turn caused an increasing current peak of cell two from to comparing the thermal-coupled and isolated scenarios.
Author Contributions
A.F., T.M., T.S. and R.L. conceived and designed the test bench. A.F., T.M. and T.S. conducted the experiments and analyzed the data. A.F. designed the simulations and wrote the article. K.P.B. and T.S. contributed to the manuscript design and revised the article. All authors have read and agreed to the published version of the manuscript.
Funding
This research received no external funding.
Acknowledgments
The authors want to thank Björn Mulder for reviewing the article.
Conflicts of Interest
The authors declare no conflict of interest.
Abbreviations
The following abbreviations are used in this manuscript:
| RMSD | Root Mean Square Deviation |
| ECM | Equivalent Circuit Model |
| SoC | State of Charge |
| OCV | Open Circuit Voltage |
| CPU | Central Processing Unit |
| CAN | Controller Area Network |
References
- Brand, M.J.; Hofmann, M.H.; Steinhardt, M.; Schuster, S.F. Current distribution within parallel-connected battery cells. J. Power Sources 2016, 334, 202–212. [Google Scholar] [CrossRef]
- Fill, A.; Birke, K.P. Impacts of cell topology, parameter distributions and current profile on the usable power and energy of lithium-ion batteries. In Proceedings of the 2019 International Conference on Smart Energy Systems and Technologies (SEST), Porto, Portugal, 9–11 September 2019; pp. 1–6. [Google Scholar]
- Rumpf, K.; Naumann, M.; Jossen, A. Experimental investigation of parametric cell-to-cell variation and correlation based on 1100 commercial lithium-ion cells. J. Energy Storage 2017, 14, 224–243. [Google Scholar] [CrossRef]
- Devie, A.; Baure, G.; Dubarry, M. Intrinsic Variability in the Degradation of a Batch of Commercial 18650 Lithium-Ion Cells. Energies 2018, 11, 1031. [Google Scholar] [CrossRef] [Green Version]
- Pastor-Fernandez, C.; Bruen, T.; Widanage, W.; Gama-Valdez, M.; Marco, J. A Study of Cell-to-Cell Interactions and Degradation in Parallel Strings:Implications for the Battery managment System. J. Power Sources 2016, 329, 574–585. [Google Scholar] [CrossRef] [Green Version]
- Baumann, M.; Wildfeuer, L.; Rohr, S.; Lienkamp, M. Parameter variations within Li-Ion battery packs—Theoretical investigations and experimental quantification. J. Energy Storage 2018, 18, 295–307. [Google Scholar] [CrossRef]
- Hofmann, M.H.; Czyrka, K.; Brand, M.J.; Steinhardt, M.; Noel, A.; Spingler, F.B.; Jossen, A. Dynamics of current distribution within battery cells connected in parallel. J. Energy Storage 2018, 20, 120–133. [Google Scholar] [CrossRef]
- Fill, A.; Koch, S.; Pott, A.; Birke, K.P. Current distribution of parallel-connected cells in dependence of cell resistance, capacity, energy density and number of parallel cells. J. Power Sources 2018, 407, 147–152. [Google Scholar] [CrossRef]
- Fill, A.; Koch, S.; Birke, K.P. Analytical model of the current distribution of parallel-connected battery cells and strings. J. Energy Storage 2019, 23, 37–43. [Google Scholar] [CrossRef]
- Yang, N.; Zhang, X.; Shang, B.; Lia, G. Unbalanced discharging and aging due to temperature differences among the cells in a lithium-ion battery pack with parallel combination. J. Energy Storage 2016, 306, 733–741. [Google Scholar] [CrossRef]
- Yang, N.; Zhang, X.; Shang, B.; Lia, G. A Novel Dynamic Performance Analysis and Evaluation Model of Series-Parallel Connected Battery Pack for Electric Vehicles. IEEE Access 2019, 7, 14256–14265. [Google Scholar]
- Liu, X.; Ai, W.; Marlow, M.N.; Patel, Y.; Wu, B. The effect of cell-to-cell variations and thermal gradients on the performance and degradation of lithium-ion battery packs. Appl. Energy 2019, 248, 489–499. [Google Scholar] [CrossRef]
- Hosseinzadeh, E.; Marco, J.; Jennings, P. Combined electrical and electrochemical-thermal model of parallel connected large format pouch cells. J. Energy Storage 2019, 22, 194–207. [Google Scholar] [CrossRef]
- Dubarry, M.; Pastor-Fernández, C.; Baure, G.; Yu, T.F.; Widanage, W.D.; Marco, J. Battery energy storage system modeling: Investigation of intrinsic cell to cell variations. J. Energy Storage 2019, 23, 19–28. [Google Scholar] [CrossRef]
- Kakimoto, N.; Goto, K. Capacity-Fading Model of Lithium-Ion Battery Applicable to Multicell Storage Systems. IEEE Trans. Sustain. Energy 2016, 7, 108–117. [Google Scholar] [CrossRef]
- Gogoana, R.; Pinson, M.B.; Bazant, M.Z.; Sarma, S.E. Internal resistance matching for parallel-connected lithium-ion cells and impacts on battery pack cycle life. J. Power Sources 2014, 252, 8–13. [Google Scholar] [CrossRef]
- Shi, W.; Hu, X.; Chao, J.; Jiang, J.; Zhang, Y.; Yip, T. Effects of imbalanced currents on large-format LiFePO4/graphite batteries systems connected in parallel. J. Power Sources 2016, 313, 198–204. [Google Scholar] [CrossRef]
- Wang, X.; Wang, Z.; Wang, L.; Wang, Z.; Guo, H. Dependency analysis and degradation process-dependent modeling of lithium-ion battery packs. J. Power Sources 2019, 414, 318–326. [Google Scholar] [CrossRef]
- Fill, A.; Koch, S.; Birke, K.P. Algorithm for the detection of a single cell contact loss within parallel-connected cells based on continuous resistance ratio estimation. J. Energy Storage 2020, 27, 101049. [Google Scholar] [CrossRef]
- Wang, L.; Cheng, Y.; Zhao, X. A LiFePO4 battery pack capacity estimation approach considering in-parallel cell safety in electric vehicles. Appl. Energy 2015, 142, 293–302. [Google Scholar] [CrossRef]
- Koch, S.; Fill, A.; Birke, K.P. Discharge by Short Circuit Currents of Parallel-Connected Lithium-Ion Cells in Thermal Propagation. Batteries 2019, 5, 18. [Google Scholar] [CrossRef] [Green Version]
- Barai, A.; Ashwin, T.; Iraklis, C.; McGordon, A.; Jennings, P. Scale-up of lithium-ion battery model parameters from cell level to module level—Identification of current issues. Energy Procedia 2017, 138, 223–228. [Google Scholar] [CrossRef]
- Li, J.; Greye, B.; Buchholz, M.; Danzer, M.A. Interval method for an efficient state of charge and capacity estimation of multicell batteries. J. Energy Storage 2017, 13, 1–9. [Google Scholar] [CrossRef]
- Hunt, I.; Zhang, T.; Patel, Y.; Marinescu, M.; Purkayastha, R.; Kovacik, P.; Walus, S.; Swiatek, A.; Offer, G. The Effect of Current Inhomogeneity on the Performance and Degradation of Li-S Batteries. J. Electrochem. Soc. 2018, 165, 6073–6080. [Google Scholar] [CrossRef] [Green Version]
- Gong, X.; Xoing, R.; Mi, C. Study of the Characteristics of Battery Packs in Electric Vehicles with Parallel-Connected Lithium-Ion Battery Cells. IEEE Trans. Ind. Appl. 2014, 51, 1872–1879. [Google Scholar] [CrossRef]
- Klein, M.P.; Park, J.W. Current Distribution Measurements in Parallel-Connected Lithium-Ion Cylindrical Cells under Non-Uniform Temperature Conditions. J. Electrochem. Soc. 2017, 164, 1893–1906. [Google Scholar] [CrossRef]
- Dubarry, M.; Devie, A.; Liaw, B.Y. Cell-balancing currents in parallel strings of a battery system. J. Power Sources 2016, 321, 36–46. [Google Scholar] [CrossRef] [Green Version]
- Zhao, C.; Cao, W.; Dong, T.; Jiang, F. Thermal behavior study of discharging/charging cylindrical lithium-ion battery module cooled by channeled liquid flow. Int. J. Heat Mass Transf. 2018, 120, 751–762. [Google Scholar] [CrossRef]
- LeBel, F.A.; Wilke, S.; Schweitzer, B.; Roux, M.A.; Al-Hallaj, S.; Trovao, J. A Lithium-Ion Battery Electro-Thermal Model of Parallellized Cells. In Proceedings of the 2016 IEEE 84th Vehicular Technology Conference (VTC-Fall), Montreal, QC, Canada, 18–21 September 2016. [Google Scholar]
- Zhang, C.; Li, K.; Song, J.D.S. Improved Realtime State-of-Charge Estimation of LiFePO4 Battery Based on a Novel Thermoelectric Model. IEEE Trans. Ind. Electron. 2017, 64, 654–663. [Google Scholar] [CrossRef] [Green Version]
- Widanage, W.; Barai, A.; Chouchelamane, G.; Uddin, K.; McGordon, A.; Marco, J.; Jennings, P. Design and use of multisine signals for Li ion battery equivalent circuit modeling. Part 2: Model Estimation. J. Power Sources 2016, 324, 61–69. [Google Scholar]
- Chacko, S.; Chung, Y.M. Thermal modelling of Li-ion polymer battery for electric vehicle drive cycles. J. Power Sources 2012, 213, 296–303. [Google Scholar] [CrossRef]
- Oh, K.Y.; Siegel, J.B.; Secondo, L.; Kim, S.U.; Samad, N.A.; Qin, J.; Anderson, D.; Garikipati, K.; Knobloch, A.; Epureanu, B.I.; et al. Rate dependence of swelling in lithium-ion cells. J. Power Sources 2014, 267, 197–202. [Google Scholar] [CrossRef]
- Grimsmann, F.; Brauchle, F.; Gerbert, T.; Gruhle, A.; Knipper, M.; Parisi, J. Hysteresis and current dependence of the thickness change of lithium-ion cells with graphite anode. J. Energy Storage 2017, 12, 132–137. [Google Scholar] [CrossRef]
- Oh, K.Y.; Epureanu, B.I. A novel thermal swelling model for a rechargeable lithium-ion battery cell. J. Power Sources 2016, 303, 86–96. [Google Scholar] [CrossRef] [Green Version]
- Grimsmann, F.; Brauchle, F.; Gerbert, T.; Gruhle, A.; Knipper, M.; Parisi, J.; Knipper, M. Impact of different aging mechanisms on the thickness change and the quick-charge capability of lithium-ion cells. J. Energy Storage 2017, 14, 158–162. [Google Scholar] [CrossRef]
- Cannarella, J.; Arnold, C.B. Stress evolution and capacity fade in constrained lithium-ion pouch cells. J. Power Sources 2014, 245, 745–751. [Google Scholar] [CrossRef]
- Brand, M.J.; Berg, P.; Kolp, E.I.; Bachb, T.; Schmidt, P.; Jossen, A. Detachable electrical connection of battery cells by press contacts. J. Energy Storage 2016, 8, 69–77. [Google Scholar] [CrossRef]
- Bolsinger, C.; Zorn, M.; Birke, K.P. Electrical contact resistance measurements of clamped battery cell connectors for cylindrical 18650 battery cells. J. Energy Storage 2017, 12, 29–36. [Google Scholar] [CrossRef]
- Bruen, T.; James, M. Modelling and experimental evaluation of parallel connected lithium ion cells for an electric vehicle battery system. J. Power Sources 2016, 310, 91–101. [Google Scholar] [CrossRef]
- Zhang, J.; Ci, S.; Sharif, H.; Alahmad, M. Modeling Discharge Behavior of Multicell Battery. IEEE Trans. Energy Convers. 2010, 25, 1133–1141. [Google Scholar] [CrossRef]
- Grün, T.; Stella, K.; Wollersheim, O. Influence of circuit design on load distribution and performance of parallel-connected Lithium ion cells for photovoltaic home storage systems. J. Energy Storage 2018, 17, 367–382. [Google Scholar] [CrossRef]
- Cordoba-Arenas, A.; Onori, S.; Rizzoni, G. A control-oriented lithium-ion battery pack model for plug-in hybrid electric vehicle cycle-life studies and system design with consideration of health management. J. Power Sources 2015, 279, 791–808. [Google Scholar] [CrossRef] [Green Version]
Figure 1.
Setup of the test bench. View-optimized modifications of the test bench with removed cooling tubes, cables and one aluminum profile (a). Schematic view of the temperature control system including the positions of the Pt100 sensors (12) (b). Detailed view of the position and orientation of the temperature sensors (c) and a detailed view of the electrical connection of the cells to the cell tester (d).
Figure 2.
Schematic view of the communication and interactions of all subsystems.
Figure 2.
Schematic view of the communication and interactions of all subsystems.
Figure 3.
Investigation of the temperature homogeneity and the heating rate of the aluminum plate with the position of the Pt100 sensors and the PE (gray box) in (a), the time curve of the Pt100 sensors with an exemplary regulation from C to C and further to C (b), the heating rate of the aluminum plate (c–e) and the temperature homogeneity of the aluminum plate (f–h).
Figure 4.
Possible induced resistances by the test bench influencing the current distribution of p parallel-connected cells, with the contact resistances at the positive and negative tab , the positive and negative cable resistances as well as the cell resistance .
Figure 4.
Possible induced resistances by the test bench influencing the current distribution of p parallel-connected cells, with the contact resistances at the positive and negative tab , the positive and negative cable resistances as well as the cell resistance .
Figure 5.
Impacts of tab treatment, with the influences of surface cleaning and pressure (a,b) as well as the effects of air sealing (c) on the contact resistance at the cathode (aluminum) and anode (nickel-plated copper) tab.
Figure 5.
Impacts of tab treatment, with the influences of surface cleaning and pressure (a,b) as well as the effects of air sealing (c) on the contact resistance at the cathode (aluminum) and anode (nickel-plated copper) tab.
Figure 6.
Influence of the cable resistances on the current distribution of two parallel-connected cells. With the current load (
a), the cell and plate temperature (
b) and the separated phases: Discharging (
c), the first rest (
d), charging (
e) and the second rest (
f). The relations of the cable resistances are
, with the exact values in
Table 2.
Figure 7.
Extended dual polarization model—Resolution of the cell layers within the cell and consideration of the contact resistance of the tabs and cable resistances due to the connection of the cell to the cell tester.
Figure 7.
Extended dual polarization model—Resolution of the cell layers within the cell and consideration of the contact resistance of the tabs and cable resistances due to the connection of the cell to the cell tester.
Figure 8.
Comparison of measurement and simulation, with the simulated cell layer currents and within cell one and two in (a) and the simulated cell currents as well as the measurement results of cable type 1 in (b).
Figure 8.
Comparison of measurement and simulation, with the simulated cell layer currents and within cell one and two in (a) and the simulated cell currents as well as the measurement results of cable type 1 in (b).
Figure 9.
Impacts of the cell position and isolating tension mats on temperature gradients within a battery module (a). Considered scenarios: Reference (b), thermal-coupled border cell (c) and isolated border cell (d).
Figure 9.
Impacts of the cell position and isolating tension mats on temperature gradients within a battery module (a). Considered scenarios: Reference (b), thermal-coupled border cell (c) and isolated border cell (d).
Figure 10.
Measurements simulating different cell positions in a battery and thermal connections of cells to their neighbor cells of two parallel-connected cells. With the current (a) and temperature distribution (c) at discharge with C as well as the current (b) and temperature distribution (d) at charge with C.
Table 1.
Manufacturers and corresponding types of the used components.
Table 1.
Manufacturers and corresponding types of the used components.
| Designation | Manufacturer | Type |
|---|
| Lithium-ion cell | Kokam | SLPB776495 |
| Peltier element | Quick Cool | QC-127-2.0-15.0M |
| CPU cooler | be quiet! | SL 240 |
| Speed controller | EPH-Elektronik | DLR 24/20 |
| Measurement device | imc CANSAS | L-HCI8 |
| Micro-controller | Arduino | Mega 2560 |
| Power supply unit | Thermaltake | TR2 S700 |
| Aluminum profiles | ITEM | Profiltyp 5 |
| CAN interface | Vector | Vn1640 A |
| Climate chamber | Vötsch | 4100/S |
| Cell tester | BasyTec | HPC |
Table 2.
Investigated cable resistances.
Table 2.
Investigated cable resistances.
| Cell | /m | /m | /m |
|---|
| 1 | 0.28 | 1.48 | 4.20 |
| 2 | 0.3 | 1.59 | 4.52 |
© 2019 by the authors. Licensee MDPI, Basel, Switzerland. This article is an open access article distributed under the terms and conditions of the Creative Commons Attribution (CC BY) license (http://creativecommons.org/licenses/by/4.0/).


