Article

SOC Estimation of a Rechargeable Li-Ion Battery Used in Fuel-Cell Hybrid Electric Vehicles—Comparative Study of Accuracy and Robustness Performance Based on Statistical Criteria. Part I: Equivalent Models

by
Roxana-Elena Tudoroiu
1,
Mohammed Zaheeruddin
2,
Nicolae Tudoroiu
3,* and
Sorin-Mihai Radu
4
1
Department of Mathematics and Informatics, University of Petrosani, 332006 Petrosani, Romania
2
Department of Building, Civil and Environmental Engineering, University Concordia from Montreal, Montreal, QC H3G 1M8, Canada
3
Department of Engineering Technologies, John Abbott College, Saint-Anne-de-Bellevue, QC H9X 3L9, Canada
4
Department of Electrical and Power Engineering, University of Petrosani, 332006 Petrosani, Romania
*
Author to whom correspondence should be addressed.
Batteries 2020, 6(3), 42; https://doi.org/10.3390/batteries6030042
Submission received: 15 July 2020 / Revised: 10 August 2020 / Accepted: 13 August 2020 / Published: 14 August 2020
(This article belongs to the Special Issue Battery Management Systems of Electric and Hybrid Electric Vehicles)

Abstract

:
Battery state of charge (SOC) accuracy plays a vital role in a hybrid electric vehicle (HEV), as it ensures battery safety in a harsh operating environment, prolongs life, lowers the cost of energy consumption, and improves driving mileage. Therefore, accurate SOC battery estimation is the central idea of the approach in this research, which is of great interest to readers and increases the value of its application. Moreover, an accurate SOC battery estimate relies on the accuracy of the battery model parameters and its capacity. Thus, the purpose of this paper is to design, implement and analyze the SOC estimation accuracy of two battery models, which capture the dynamics of a rechargeable SAFT Li-ion battery. The first is a resistor capacitor (RC) equivalent circuit model, and the second is a generic Simscape model. The model validation is based on the generation and evaluation of the SOC residual error. The SOC reference value required for the calculation of residual errors is the value estimated by an ADVISOR 3.2 simulator, one of the software tools most used in automotive applications. Both battery models are of real interest as a valuable support for SOC battery estimation by using three model based Kalman state estimators developed in Part 2. MATLAB simulations results prove the effectiveness of both models and reveal an excellent accuracy.

1. Introduction

1.1. Literature Review

Nowadays the new technologies applied in batteries manufacturing industry “often demand more compact, higher capacity, safe and rechargeable batteries” [1]. The batteries vary by different chemistries and “generate the basic cell voltages typically in the 1.0 to 3.6 V range” [1]. The required voltages and the currents of a battery pack are obtained by adding up the number of the cells in a series connection to increase the voltage and parallel connection to enhance the current. It is important to note that when driving on the road, electric car batteries “need to be recharged relatively quickly”, which is one of the key requirements for a Li-ion battery [2]. The maximum power required by a Li-ion battery pack for charging is calculated by using the following formula [2]:
P m a x = V b a t , m a x × N c e l l s × I b a t , m a x
where Vbat,max is the maximum terminal voltage of the cell, Ncells is the number of cells in the pack and Ibat,max is the maximum charging current allowed per cell.
In contrast to other electric vehicles, “the fuel cell electric vehicles (FCEVs) produce, cleanly and efficiently, electricity using the chemical energy of a fuel cell powered by hydrogen, rather than drawing electricity from only a battery” [3,4]. A hybrid FCEV (HFCEV) can be designed “with plug-in capabilities to charge the battery”, since “most HFCEVs today use the battery for recapturing braking energy, providing extra power during short acceleration events, and to smooth out the power delivered from the fuel cell” [3]. Compared to “conventional internal combustion engine vehicles”, the HFCEVs “are more efficient and produce no harmful tailpipe emissions” [3].
Fuel cells (FC) “work like batteries, but they do not run down or need recharging; they produce electricity and heat as long as fuel is supplied” [4]. Among “the most common types of fuel cell for vehicle applications is the polymer electrolyte membrane (PEM) [3,4]. The most recent HFCEVs “are equipped with advanced technologies to increase efficiency, such as regenerative braking systems, which capture the energy lost during braking and store it in a battery” [3]. In the case study of a small hybrid electric vehicle (HEV) car (HEV-SMCAR), the fuel cell battery is “designed to meet the average load power, while batteries and supercapacitors provide extra power during transients and overload” [5]. This reduces drastically “the size of the fuel cell system” and also “improve the dynamic response of hybrid power system” [5]. As a new improvement of HEV performance it is more appropriate to consider a “hybridization of the on-board energy source, i.e., to combine the Li-ion battery, and energy source, with a component that is more power dense” [6].
The supercapacitor (SC) is used in this combination, since it is “able to provide high power for short periods of time without damaging their internal structure” and also works for a long life-cycle with a high efficiency, which exceeds the Li-ion battery performance [6,7,8,9,10]. Also, the SC keeps the discharging Li-ion battery current within battery limits given in specifications, such that to “extend the Li-ion battery life cycle by compensating “the high current of the load” [6]. To reach this objective an energy management system (EMS) is required [5,6,7,8,9,10,11]. In [5,6], the EMS is conceived as an algorithmic procedure for developing five EMS techniques, to optimize the hydrogen consumption, and to assure a high overall system efficiency, as well as a long-life cycle. In [7,11] a detailed diagram of an EMS system is presented, for an FC, UC, and Li-ion battery hybrid energy storage, to rationalize both power density and energy density, which can be adapted such that to be useful for a small hybrid electric car (SMCAR) proposed in our case study. To simplify the Simulink diagram of the EMS, the authors use Simscape components such as Li-ion battery, supercapacitor, and FCPEM [8]. The battery state of charge (SOC) is an essential internal parameter of the battery and SC/UC that is under observation constantly by a battery management system (BMS) to “prevent hazardous situations and to improve battery and SC/UC performance” [12,13,14]. Typically, for calculation, SOC is “tracking according to the discharging current” [14,15,16].

1.2. Li-Ion Battery Models Reported in the Literature—Brief Presentation

In the absence of a measurement sensor, the SOC cannot be measured directly, thus its estimation using Kalman filter estimation techniques is required [17,18,19,20,21,22,23,24,25,26,27,28,29], a topic that is detailed in Part 2 [30]. Furthermore, an accurate Li-ion battery model is essential in SOC estimation of the model-based BMS in electric vehicles (EVs)/HEVs. A complete analysis of the current state of the SOC estimation of the Li-ion battery for EVs is presented in [28]. In the paper it is stated that for EV/HEVs battery systems, “an accurate SOC can prevent battery discharge and charging, thus ensuring the safety of the battery system, more efficiently using limited energy and extending battery life”. It can also “support the accurate calculation of the driving range of the vehicle, provide a better discharge or charging strategy, improve the efficiency of other energy sources and make balancing strategies work more efficiently”. The same research paper [28] emphasizes that the design of the Li-ion battery model and the real-time implementation of adequate SOC estimation in EV/HEVs applications is a challenging task due to the “complexity of electrochemical reactions and performance degradation caused by various factors”. Design and implementation in real time of stable, accurate and robust SOC estimation algorithms encounter some critical issues, such as hysteresis and the flat aspect of the open-circuit controlled voltage (OCV) = f(SOC) characteristic curve, Li-ion battery model, ageing, choice of estimation algorithm and imbalance cell [28]. Therefore, these issues require a comprehensive analysis to consider their impact on solving the correct and accurate battery SOC estimation. At the end of this section, a brief review is given of some linear and non-linear analytic battery models of different chemistries reported in the literature well-suited for “battery design, performance estimation, prediction for real-time power management, and circuit simulation”, such as is done in [17,18,28]. These models can be categorized into five categories: electrochemical models, computational intelligence-based models, analytical models, stochastic models, and electrical circuit models, as is mentioned [17].

1.2.1. Electrochemical Battery Models

The electrochemical models or distributed physics-based models excel by their accuracy concerning the prediction of battery terminal output voltage, achieved by these models, but they require detailed knowledge of the battery chemical processes, which makes them difficult to configure [21,29].
Furthermore, these models can capture the electrochemical reactions using partial differential equations (PDE) “that links physical parameters to internal electrochemical dynamics of the battery cell allowing trade off analysis and high accuracy”, as is stated in [19]. A well-known early model with a high accuracy of 2% was originally developed by Doyle, Fuller and Newman, as mentioned in [3]. A big advantage of these models is that the PDE equations deal with numerous unknown parameters, are more complicated computationally expensive, as well as they are almost impractical in real-time BMS applications.

1.2.2. Computational Intelligence-Based Battery Models

The second category of models are the computational intelligence-based models. These models describe the non-linear relationships between SOC, battery terminal voltage, input current, and battery internal temperature, and specifically use artificial neural network (ANN)-based models and support vector regression models, and mixed models. Also, mixed models have been used to estimate the battery non-linear behaviors. An interesting “recurrent neural network (RNN) has been used to build an SOC observer estimator and battery terminal voltage estimator”, as is mentioned in [29].

1.2.3. Analytical Battery Models

The third category of models, namely the analytical models are simplified version of electrochemical models, such as those based on the Pucker’s law, the kinetic battery models, and the diffusion models, as are detailed in [29]. These models could capture nonlinear capacity effects and to predict runtime of the batteries with reduced order of equations and perform well for battery SOC tracking and runtime prediction under specific discharge profiles [29].

1.2.4. Stochastic Battery Models

The fourth category describe the stochastic models that emphasize on “modeling recovery effect and describes battery behavior as a Markov process with probabilities in terms of parameters that are related to the physical characteristics of an electrochemical cell” [29]. They give a “good qualitative description for the behavior of a Li-Ion battery under pulsed discharge, for which the recovery effect is modeled as a decreasing exponential function of the SOC and discharge capacity” [29].

1.2.5. Linear Equivalent Electric Circuits and Simscape Battery Models

Finally, the last category of models is that of the linear equivalent electric circuit models (ECM), such as those discussed in the next section, Much details on these category of the models can be found in [21] for a Li-ion polymer (LiPb). The last category of models are Simscape models, described also in the next section of the present research work. The weakness and the strengths of ECM and Simscape models concerning the SOC accuracy and robustness are discussed in detail in next section.
In conclusion, this article focuses on the design and implementation of two accurate SAFT Li-ion battery models, suitable for HEV applications. For each Li-ion battery model are implemented in Part 2 three real-time SOC estimators on a MATLAB R2020a platform. The remaining sections of this paper are structured as follows. Section 2 describes the first RC ECM model attached to a SAFT Li-ion battery. Section 3 describes the second Li-ion battery model, a Simscape nonlinear model. Section 4 analyzes the SOC performance through six statistical criteria. Section 5 details the authors’ contributions to this research paper.

2. Li-Ion RC Battery Equivalent Circuit Model—Case Study and ADVISOR Setup

The purpose of this section is to present the case study of a small urban hypothetic car (SMCAR) which is set up using the ADVISOR 3.2 version software package, one of the most used in the automotive industry. Then, in next subsections is developed and validate an accurate Li-ion battery model that describes the dynamics of a SAFT Li-ion battery with a rated capacity of 6Ah and a nominal voltage of 3.6 V. This model is a third-order RC equivalent circuit model (3RC ECM), one of the most used in HEV applications due to its simplicity, high accuracy, and fast real-time implementation [14,17,18,19,20,21,22,23].

2.1. Li-Ion SAFT Battery and ADVISOR Small Hybrid Electric Car (SMCAR) Setup

SAFT is one of the most prestigious research companies in the US, among the most famous battery players on the commercial market in the world. It operates “under the auspices of the United States Advanced Battery Consortium (USABC) and the New Generation Vehicle Partnership (PNGV),” developing high-power lithium-ion (Li-ion) batteries over the past two decades. These batteries currently equip most HEVs and EVs [14,15,16,17,18,19]. The Li-ion battery together with other key components of a Hydrogen fuel cell electric vehicle are distributed on the car chassis as shown in Figure 1.
The key components of a Hydrogen fuel cell electric car shown in Figure 1 are described in [2] as follows:
(1)
The battery (auxiliary): this “powers vehicle accessories” and “provides electricity to start the car when traction battery is engaged”.
(2)
Battery pack: this “stores energy generated from regenerative braking and provides supplemental power to the electric traction motor”.
(3)
Direct current–direct current (DC–DC) converter: this is an electronic device that “converts higher-voltage DC power from the traction battery pack to the lower-voltage DC power needed to run vehicle accessories and recharge the auxiliary battery”.
(4)
Electric traction motor (FCEV): this is powered by the fuel cell and traction battery pack to drive the vehicle’s wheels. It is also possible that “some of vehicles use motor generators that perform both the drive and regeneration functions”.
(5)
Fuel-cell stack: it is “an assembly of individual membrane electrodes that use hydrogen and oxygen to produce electricity”.
(6)
Fuel filter: this is “a nozzle from a high-pressure dispenser attaches to the receptacle on the vehicle to fill the tank”.
(7)
Fuel hydrogen tank-it “stores the hydrogen gas on board the vehicle until it is required by the fuel cell”.
(8)
Power electronics controller (FCEV): this is a unit that “manages the flow of electrical energy delivered by the fuel cell and the traction battery, controlling the speed of the electric traction motor and the torque it produces”.
(9)
Thermal system (cooling) (FCEV): this “maintains a proper operating temperature range of the fuel cell, electric motor, power electronics, and other components”.
(10)
Transmission (electric): this “transfers mechanical power from the electric traction motor to drive the wheels”.
Among the Li-ion batteries of an HEV, the one with a capacity and a nominal voltage of 6 Ah and 3.6 V respectively is used for experimental validation tests, using an advanced simulator (ADVISOR) created in November 1994 by the US National Renewable Energy Laboratory (NREL). ADVISOR has so far proved to be the most suitable tools used in the design of HEV and EV systems, very well documented in [4,5,6,7]. Thanks to a wide variety of HEVs and EVs and the multitude of “real-world” driving conditions, it has gradually improved the performance until it reached version 2003-00, as well as the latest version r0116 of 24 April 2013, as mentioned in [14,15,16,17,18]. After proper installation, the ADVISOR graphical user interface (GUI) is running by typing “advisor” at the command prompt in MATLAB [14,15,16,17,18]. The ADVISOR GUI file menu has “help buttons which will either access the MATLAB help window or open a web page with appropriate context information” [15,16]. By using the ADVISOR GUI software package for design the following steps are requested:
Step 1. Define a vehicle.
Step 1.1. Define the input HEV page setup shown in Figure 2, based on a large collection of HEVs types and characteristics contained by software.
As a case study we consider a hypothetical SMCAR, powertrain control hybrid (hydrogen fuel cell electric vehicle) with the following characteristics [16]:
  • Fuel converter ANL Model 50 kW (net) ambient pressure hydrogen fuel-cell system.
  • Transmission—5-speed manual transmission.
  • Motor—Westinghouse 75 kW (continuous) alternating current (AC) induction motor/inverter.
  • Accessory—type constant, i.e., 700 W constant electrical load, based on data from the SMCAR tests.
  • Wheel/axle—wheel/axle assembly for small car SMCAR.
  • Powertrain control—hybrid/adaptive control.
  • Battery: rint (internal resistance)—type SAFT Li-ion battery 6 Ah-rated capacity and 3.6 V-nominal voltage. The characteristics of the SAFT battery are presented in Table 1 and Table 2 [14,15,17,18,19]. Within a pack 84 cells are connected in series, with a nominal voltage capable of driving the PMDCM at approximately 300 V.
The Simulink block diagram of the transmission system and Li-ion battery storage is shown in Figure 3.
Step 1.2. Drivetrain selection—selects the drivetrain configuration of the vehicle (Series, Parallel, etc.).
Step 1.3. Selecting components.
Step 1.4. Editing variables.
Step 1.5. Loading and saving vehicle configuration.
Step 2. Running simulation.
Step 2.1. Select the drive cycle—in the case study we chose the Federal Test Procedure (FTP) driving cycle used by US Environmental Protection Agency (EPA) for emissions certifications of passengers’ vehicles in USA. The FTP-75 shown in Figure 4 and converted in current profile charging and discharging cycle in Figure 5 is the standard federal exhaust emissions driving cycle, which uses an Urban Dynamometer Driving Schedule (UDDS [14,15,16,17,18]). The FTP cycle has three separate phases: one cold-start phase (505 s), followed by a hot transient phase (870 s) and a hot-start phase (505 s) [14,16,18]. For a 10 min cool-down period between second phase and the third phase the engine is turned off. The first and third phase are identical. The total test time length for the FTP is 2457 s (40.95 min). The top speed is 91.25 km/h and the average speed is 25.82 km/h. The distance driven is approx. 17.7 km [14,16].
Step 2.2. Select a trip builder for a repeated cycle (if the case).
Step 2.3. Select a SOC correct options (linear or zero delta).
Step 2.4. Select interactive simulation a real-time interactive simulation interface to activate while the simulation is running.
Step 2.5. Select multiple cycles to speed up the process of running many different cycles with the same initial conditions using this functionality.
Step 2.6. Choose a test procedure to select what kind of test to run.
Step 2.7. Save Simulink setup.
Step 2.8. Run the simulation and wait for the results figure to popup, as shown in Figure 4 and Figure 5.
Step 3. Looking for the simulation results.
The first graph at the top of the Simulink configuration page, shown in Figure 4 and Figure 5 (the first graph at the top), shows the ADVISOR FTP-75 driving cycle speed profile as the input variable. In Figure 5, the second graph at the top shows the estimated ADVISOR SOC value required to validate both models of Li-ion batteries attached to the SAFT Li-ion battery. The last chart at the bottom of Figure 5 shows the conversion of the FTP-75 driving cycle speed profile to a driving cycle current profile, required in MATLAB simulations for model validation and SOC estimators, as an input variable.
The SAFT Li-ion battery electrical characteristics specifications are given in Table 1, and Table 2.

2.2. Li-Ion-RC Equivalent Circuit Model

The 3RC ECM Li-ion battery model, as shown in Figure 6, consists of an OCV source in series with the internal Rin resistance of the battery and three parallel RC bias cells. RC cells are introduced into the circuit to capture the dynamic electrochemical behaviour of the battery and to increase the accuracy of the model. The first RC polarization cell captures the fast transient of the battery cell, and the last two RC cells capture the slow variation of the steady-state and increase the accuracy of the model. As the new technologies are largely dependent on batteries, it is important to develop accurate battery models that can be conveniently used with on-board power simulators and electronic on-board power systems, as mentioned in [14,17,18,19,20,21,22,23].
For simulation purpose, a specific setup for the 3RC ECM Li-ion battery model parameters, shown in Table 1 or directly on the electrical scheme from Figure 1, is available to prove the effectiveness of the proposed SOC estimation strategies. This setup is achieved from a generic ECM by changing only the values of the model parameters in state-space equations.
The Li-ion battery 3RC ECM model parameters are given in Table 3, and the OCV nonlinear model coefficients are shown in Table 4.

2.2.1. RC ECM Li-Ion Battery Model-Continuous Time State Space Representation

In a state-space representation, the continuous time 3RC ECM nonlinear model of SAFT Li-ion battery shown in Figure 6 is given by following Equations:
d x 1 d t = 1 R 1 C 1 x 2 + 1 C 1 u ( t )   ,   u ( τ ) 0
  d x 2 d t = 1 R 2 C 2 x 2 + 1 C 2 u ( t )
  d x 3 d t = 1 R 3 C 3 x 3 + 1 C 3 u ( t )  
  d x 4 d t = η u ( t ) C n o m   ,   u ( τ ) 0  
  O C V ( t ) = K 0 K 2 x 4 K 1 x 4 + K 3 ln ( x 4 ) + K 4 ln ( 1 x 4 )  
  y ( t ) = O C V ( t ) x 1 x 2 x 3 R i n u ( t )
where the components of the state vector are: x 4 = S O C is the state of charge of Li-ion battery, x 1 = V 1 is the voltage across first R 1 | | C 1 polarization cell, x 2 = V 2 denotes the voltage across the second R 2 | | C 2 polarization cell, x 3 = V 3 represents the third R 3 | | C 3 polarization cell u ( t ) = i ( t ) is the input discharging current ( u ( t ) 0 ) or charging current ( u ( t ) 0 ), O C V ( t ) represents the open-circuit voltage of Li-ion battery, and finally y ( t ) designates the terminal voltage of the battery. The open-circuit voltage of Li-ion battery O C V ( t ) given in (6) is a non-linear function of battery SOC, and contains a combination of the following three well-known generic battery models [17,19,20,21,25]:
(1)
Shepherd model
y ( t ) = K 0   R i n u ( t ) K 1 x 4
(2)
Unnewehr universal model
y ( t ) = K 0 R i n R u ( t ) K 2 x 4
(3)
Nernst model
y ( t ) = K 0 R i n u ( t ) + K 3 ln ( x 4 ) + K 4 ln ( 1 x 4 )
The performance of the generic models in terms of voltage prediction and SOC estimation is analysed in [24], and the simulations result show that the Unnewehr and Nernst models compared to the Shepherd model, criticized in literature, increase significantly the accuracy of linear ECMs, more specifically, Nernst model “showed the best performance among the three mathematical models” due to its flexibility by using two parameters (correction factors instead of one). Last, the combination of all three mathematical models in (7) and their introduction in the terminal voltage relationship (8) increases considerable the Li-ion ECM accuracy. Also, the ECM combined model proved until now that it is “amongst the most accurate formulations seen in literature from EVs/HVs field” [17,21].
Since the parameters of 3 RC ECM Li-ion model strongly depend on temperature and SOC, the combined model is beneficial due to its simplicity, accuracy, and development of BMS SOC estimators for HEVs as a “proof concept” and fast real-time implementation.
It is important to underline that the values of coefficients K 0 , K 1 , K 2 , K 3 , and K 4   , provided in Table 2, are chosen to fit the Li-ion battery model accurately according to the manufacturers’ data by using a least squares curve fitting estimation method, as is suggested in [17,18,19,20,21,22,23]. The values of the resistances R 1 , R 2 and the capacitors C 1 , C 2   , as well the value of the battery nominal capacity C n o m and its internal resistance are given in Table 1. The Simulink diagram of third order 3RC EMC–Li-Ion battery model that implements the Equations (3)–(8) is shown in Figure 7.

2.2.2. RC Electric Circuit Model (ECM)–Li-Ion Battery Model—Discrete Time State Space Representation

For the design and implementation of SOC estimators it is necessary to discretize over time the continuous model of the Li-ion battery. The discrete model of 3RC ECM Li-ion model is described in a compact state space matrix representation, as:
x ( k + 1 ) = A x ( k ) + b u ( k )   ,   u ( k ) 0
  O C V ( k ) = K 0 K 2 x 4 ( k ) K 1 x 4 ( k ) + K 3 ln ( x 4 ( k ) ) + K 4 ln ( 1 x 4 ( k ) )  
  y ( k ) = O C V ( k ) x 1 ( k ) x 2 ( k ) x 3 ( k ) R i n u ( k )
where x ( k ) = [ x 1 ( k ) x 2 ( k ) x 3 ( k ) x 4 ( k ) ] x ( k T s )   is the state vector with 4 components A = [ 1 T s T 1 0 0 0 0 1 T s T 2 0 0 0 0 1 T s T 3 0 0 0 0 1 ] denotes the state matrix, b = [ T s C 1 T s C 2 T s C 3 η C n o m ] is a vector of the input coefficients (input excitation terms), u ( k ) u ( k T s )   ,   O C V ( k ) O C V ( k T s ) ,   and y ( k ) y ( k T s )   denotes the input, respectively the OCV and the terminal output voltage at discrete time instants { k T s | k Z + }   . In our MATLAB simulations, the sampling time is set to T s   = 1 s, without any solver convergence problems.

2.2.3. Li-Ion Battery Thermal Model

Following the development in [14] the dynamics of Li-ion battery thermal model block is described by the following equations:
m c p d T c d t = h S ( T 0 T c ) + R i n u 2
  T c ( s ) = R t h P l o s s + T 0 T t h s + 1   ,   P l o s s = R i n u 2  
  R i n ( T ) = R i n | T 0 + exp ( ( 1 T c 1 T 0 ) ) , = E R T  
  K p ( T ) = K p | T 0 + exp ( β ( 1 T c 1 T 0 ) ) , β = E R T  
where, the variables and the coefficients have the following significance and values:
  • m the mass of the battery cell [kg]
  • c p   the specific heat capacity [J/molK]
  • S—the surface area for heat exchange [ m 2 ]
  • T c   the variable temperature of the battery cell [K]
  • T 0 the ambient or reference temperature [K]
  • R i n ( T ) the value of internal resistance of the battery cell dependent on temperature [ Ω ]
  • K p ( T ) ppolarization constant of Li-ion Battery [V]
  • u the input charging and discharging profile current [A]
  • T c ( s ) the internal temperature of the cell [°K] in complex s–domain (the Laplace transform)
  • R t h   thermal resistance, cell to ambient (°C/W), R t h = 6   [ ° C ] .
  • T t h the thermal time constant, T t h = 2000   [ s ]  
  • P l o s s the overall heat generated (W) during the charge or discharge process [w]
  • , β Arrhenius rate constant
  • E —the activation energy, E = 20   [ kJ / mol ]  
  • R Boltzmann constant, R = 8.314   [ J / molK ]
In MATLAB simulations, the battery temperature profile, and the robustness of the proposed SOC battery estimators are tested for the following approximate values, closed to a commercial battery type ICP 18,650 series [14]:
S = 15.4 E 3   [ m 2 ] , m = 0.0375   [ k g ] ,   c p = 925   [ J / k g K ] ,   h = 5 [ w ] ,   t 0 = 20   [ ]
An accurate simplified thermal model is provided in MATLAB R2019b library, at MATLAB/Simulink/Simscape/Battery, for a Li-ion generic battery model, implemented in Simulink Simscape as is shown in Figure 8, as is developed in [14]. The Equations (17) and (18) reveal a strong dependence of the internal resistance R i n ( T )   and the polarization constant K p ( T ) of the Li-ion battery Simscape model.
Since the internal resistance of the Li-ion battery is the most sensitive to temperature developed inside the Li-ion battery, an overall Simulink model diagram block is designed that also integrates the Li-ion battery models such as is shown in Figure 9. It is essential to emphasize the fact that for performance comparison purpose, the overall Simulink model diagram shown in Figure 9, is sharing the same simplified thermal model to have an identical profile temperature and values of internal resistance R i n ( T ) and polarization K p ( T )   .
It is important to remark that in Figure 9 the second block from the top of the Simulink diagram is introduced only to investigate the SOC and temperature profile evolutions delivered by the first block from the bottom side in comparison to SOC and the temperature profile delivered by the top side block. The ambient temperature profile and the output temperature of the Simulink Simscape thermal model described by Equations (15)–(18) are shown in Figure 10a,b respectively.
The evolution of the battery internal resistance R i n ( T ) and polarization constant K p ( T ) at room temperature t0 = 20 °C, is shown in Figure 11a,b.
The output temperature profile of the Simulink Simscape thermal model for changes in ambient temperature is shown in Figure 12a, and the effects on internal battery resistance R i n ( T ) and polarization K p ( T ) are presented in Figure 12b,c.

2.2.4. RC ECM Li-ion Battery Model—MATLAB Simulink Simulations Result

The MATLAB simulations result of 3RC ECM Li-ion battery model implementation is shown in the Figure 13 and Figure 14. In Figure 13a,b are depicted the FTP current profile test (a), and the value of 3RC ECM Li-ion model SOC versus ADVISOR SOC estimate to the FTP current profile test (b) obtained on NREL ADVISOR MATLAB platform as shown in Figure 5.
Using a MATLAB magnification tool on two portions of the graph, the visibility of both curves shown in Figure 13b increases considerably [26]. The Li-ion battery terminal voltage for an FTP-75 current charging and discharging profile test, the following three, namely OCV = f(SOC) curve, battery terminal voltage and its SOC, all of these three simulated for a constant discharge current at 1C-rate (6A), it can see in the Figure 14a–d.
The simulation results from last three Figure 14b–d reveal that all three battery characteristics are quite close to the manufacturing specifications. It should also be noted that the OCV = f(SOC) curve from Figure 14b is almost flat on a large portion. Therefore, the Coulomb counting method is not accurate for direct SOC measurement for Li-ion batteries. Thus, its estimation is necessary using one of the best known Kalman filtration techniques.

2.2.5. RC ECM Li-Ion Battery Model—MATLAB Model Validation

For validation of 3RC ECM Li-ion battery model, in the first stage is calculated the model SOC residue as a difference between the SOC values of the 3RC ECM model and the estimated values of ADVISOR SOC estimator. The SOC accuracy performance of 3RC ECM Li-ion battery model is analyzed by evaluating the SOC residual error. The residual percentage error is depictured in Figure 15.
The results of the MATLAB simulations shown in Figure 13b for a current FTP-75 driving cycle profile test reveal excellent SOC accuracy of the 3RC ECM compared to the estimated SOC value obtained by the ADVISOR simulator. From a quantitative point of view, this confirms the information extracted by evaluating the SOC residues generated in MATLAB and presented in Figure 15. From Figure 15 it can be seen that the SOC residue is in the range [−1.1, 0, 4], and the SOC error rate is less than 1.2%, which is an excellent result, comparable to those reported in the literature, even better. This result reveals that the 3RC ECM Li-ion battery model is very accurate in terms of SOC calculation, and the model is undoubtedly validated based on available information about its behaviour.

3. Li-Ion Battery Simscape Generic Model

A full representation of the generic battery model, dependent on the temperature and ageing effects, is developed by MathWorks team, as shown in the MATLAB R2019b/Simulink/Simscape/Power Systems/Extra Sources Library-Documentation.

3.1. Li-Ion Battery Simscape Generic Model—Description and Parameters’ Specifications

Li-ion battery cell specifications for a Simscape model are shown in Figure 16a–c. The Li-ion battery Simscape model is more realistic and suitable to operate safely in different conditions. Also, this model is beneficial for an appropriate choice of battery chemistry and for different parameters specifications. The Simscape generic model developed by MathWorks team takes into consideration the thermal model of the battery (internal and environmental temperatures) and its ageing effects. The battery terminal voltage, current and SOC “can be visualized to monitor and control the battery SOH condition” [14].
The nominal current discharge characteristics according to a choice of a Li-ion battery which has a rated capacity of 6 Ah and a nominal voltage of 3.6 V for different x-scales (time, Ah) are shown in the Figure 17 and Figure 18.
The Simscape model of a generic 6 Ah and 3.6 V Li-ion battery SAFT-type without temperature and ageing effects is shown in Figure 19, the same shown in [14], p. 12.
A significant advantage of the Simscape model of Li-ion battery is the simplicity with which the model parameters for different chemistry and specifications are extracted as if we had access to the specifications of the battery manufacturers. The parameters of Li-ion battery choice extracted from the discharge characteristics shown in Figure 17 or Figure 18 have the following values:
E 0 = 4.5646   [ V ] , R i n = 0.006   [ ] ,   K p = 0.0054929   [ V ] ,   A =   0.00029416 ,   B = 10.1771
where
  • E 0     denotes the battery constant voltage [V].
  • R i n designates the internal resistance of the battery [Ω].
  • K p is the polarization battery voltage constant [V].
  • A represents the exponential zone amplitude [V].
  • B means the exponential zone time constant inverse [1/(Ah)].

3.2. Li-Ion Battery Simscape Model—Discrete Time in State Space Representation

The Simscape model parameters suggested in Figure 16, Figure 17 and Figure 18 fit the following adopted model represented in discrete time in a unidimensional state space, like the model developed in [14], p. 21:
x 1 ( k + 1 ) = x 1 ( k ) T s ( η Q n o m ) × u ( k )
  y ( k ) = E 0 K p T s x 1 ( k ) × u ( k ) + A e x p ( B Q n o m η ( 1 x 1 ( k ) ) ) R i n u ( k )  
where x 1 ( k ) x 1 ( k T s ) = S O C ( k T s )   , u ( k ) ,   y ( k )   , Q n o m   , η and T s   have the same meaning as the variables and parameters that describe the 3RC ECM Li-ion battery model given by Equations (12)–(14). It is essential to emphasize a great advantage of the adopted Simulink Simscape model, presented in (21) and (22), consisting of a considerable model simplification and dependence only on SOC. Also, the dynamics of this model is described by the first Equation (21) which is linear and the second Equation (22) is a highly nonlinear static representation.
The Simulink Simscape model of Li-ion battery that implements Equations (21) and (22) is shown in Figure 20.

3.3. Li-Ion Battery Simscape Generic Model—MATLAB Simulations Results and Model Validation

The MATLAB simulations result is shown in Figure 21a,c.
In Figure 21a, the simulation result reveals an excellent SOC accuracy of the Simscape model of the Li-ion battery. This result is also supported by a small SOC residue, recorded in Figure 21b, which falls in the range [−1.4, 1]. Like the 3RC ECM Li-ion battery model, the Simscape model of the Li-ion battery based on the available information extracted from Figure 21a,b also works very well, because the SOC error percentage is less than 1.4%, compared to the typical value of 2% reported in the literature for similar applications. These results also validate this model, which is suitable to use it in the second part for real-time design and implementation on an attractive MATLAB 2020Ra environment.

3.4. Simulink Simscape Graphic Models Integrated in Fuel Cell HEV Applications—Energy Management System

This section presents some HEV applications that operate with graphic Simscape models. In this description, the Simscape “blocks language” allows much faster models of physical systems to be created within the Simulink environment, “based on physical connections that directly integrate with block diagrams and other modeling paradigms” [8]. In Simscape, the models can be parametrized using MATLAB variables and expressions and can be designed and implemented control systems for any physical system in Simulink”. Users can easily integrate physical object icons into the design of Simulink diagrams or combine object models with the symbols of different physical objects. Indeed, behind each image is encapsulated the dynamic pattern of physical objects. However, it significantly eliminates the user’s effort to write a lot of equations for modelling the dynamics of objects, which takes a long time, and the diagrams become much more complicated [8].

3.4.1. Hybrid Energy Storage of Energy Management System (EMS)—Simulink and Simscape Components Description

The hybrid energy storage (HES) of an EMS, shown in Figure 22, is a hybrid combination of three power sources, such as a fuel cell, Li-ion battery, and supercapacitor [5,7]. The control strategy of HES is implemented in Simulink Simscape to “manage the energy consumption of the hydrogen fuel, and at the same time the pulsed or transient power required (load profile) by the load should be supplied.” [11]. To simplify the Simulink diagram of the EMS, are used Simscape components such as Li-ion battery, supercapacitor and FCPM that also encapsulates a hydrogen fuel stack cell Simscape model, provided by MATLAB Simulink Toolbox/Simscape. In this section, a brief presentation of this topic is given, since is only emphasized the fact that using a single power source such as Li-ion battery in driving HEV powertrains applications “has certain disadvantages such as recharging, longevity, poor power density, etc.” [24].
In this diagram other Simscape components are integrated such as three DC–DC boost/buck converters blocks to interface with all three sources. The first is a 12.5 kW fuel cell DC/DC boost converter, with regulated output voltage and input current limitation, and the other are two DC/DC converters for discharging (4 kW boost converter) and respectively for charging (1.2 kW buck converter) the battery system. Normally, a “single bidirectional DC/DC converter can also be used to reduce the weight of the power system” [7]. The FC is controlled by a DC–DC boost converter, an electronic device controlled also by a signal sent by one of five control strategies conceived for this purpose inside the EMS block, as is described in [5]. Similarly, the Li-ion battery and the supercapacitor are controlled by a bidirectional DC-DC buck-boost converters, since during operation they are charging and discharging. The topology configuration and the electronic circuits are well described in [11]. The charging and the discharging cycles of the bidirectional DC-DC converters are controlled by a voltage signal provided by EMS block that adjusts the duty cycles (D) of both DC–DC converters, based on the following relationship [11]:
D = V o u t V o u t V i n
where D is the duty cycle, V o u t   designates the output voltage of the converter, and V i n denotes the input voltage. In this section is presented only briefly the most relevant MATLAB simulation results for EMS techniques to have a better insight of the behavior of all three Simscape components of hybrid power sources, i.e., FC, Li-ion battery, and SC (UC). In the Simulink Simscape diagram of fuel-cell hybrid power generation (FCHPG) shown in Figure 22, the inverter DC/AC that supplies the load is rated at 270 V DC in input, and 200 V AC, 400 Hz, 15 kVA in output.
A three-phase load profile is “emulated to consider variations in power at the different timings and simulations to see the behavior of the hybrid energy storage system (HESS) as a whole and the response of each storage system” [11]. Also, a Simscape “15 kW protecting resistor is integrated in the Simulink diagram to avoid overcharging the supercapacitor and battery systems” [7].

3.4.2. Hybrid Energy Storage of EMS—Simulink Simscape Applications

As a practical application, the following three scenarios are implemented to reveal the behavior of HESS components:
  • Scenario 1: DC grid interfaces only the AC Grid and AC load, such in [7,11].
The HESS distributes the power among the energy sources according to a given energy management strategy. The MATLAB simulation results of EMS techniques are shown only for three setups, such as the state machine control strategy (SMCS), classical PI control strategy (PICS), and the equivalent consumption minimization strategy (ECMS) [5,7,25]. To obtain a sound theoretical background on the EMS design and implementation in a real-time MATLAB simulation environment, the following sources [5,7,11,24] provide valuable information. For EMS-SMCS setup shown in Figure 23, the MATLAB simulations result is presented in the Figure 24.
In Figure 24 is depictured the powers’ distribution for FC, Li-ion battery, UC, and Load profile for a hypothetical SMCAR HEV case study. The balance equation is given by:
P F C + P B a t t + P U C = P L ,
where P F C is the power provided by FC, P B a t t is the power delivered by Li-ion battery, P U C is the power delivered by the UC to manage power peaks for vehicle acceleration and regeneration, and P L is the load profile (demand, total power required). From Figure 24 it is straightforward to check that Equation (23) is satisfied for each time moment. Also, it is obvious that for load power profile pecks the power delivered by UC is very sharp to cover the power demanded ( P L ).
In the 
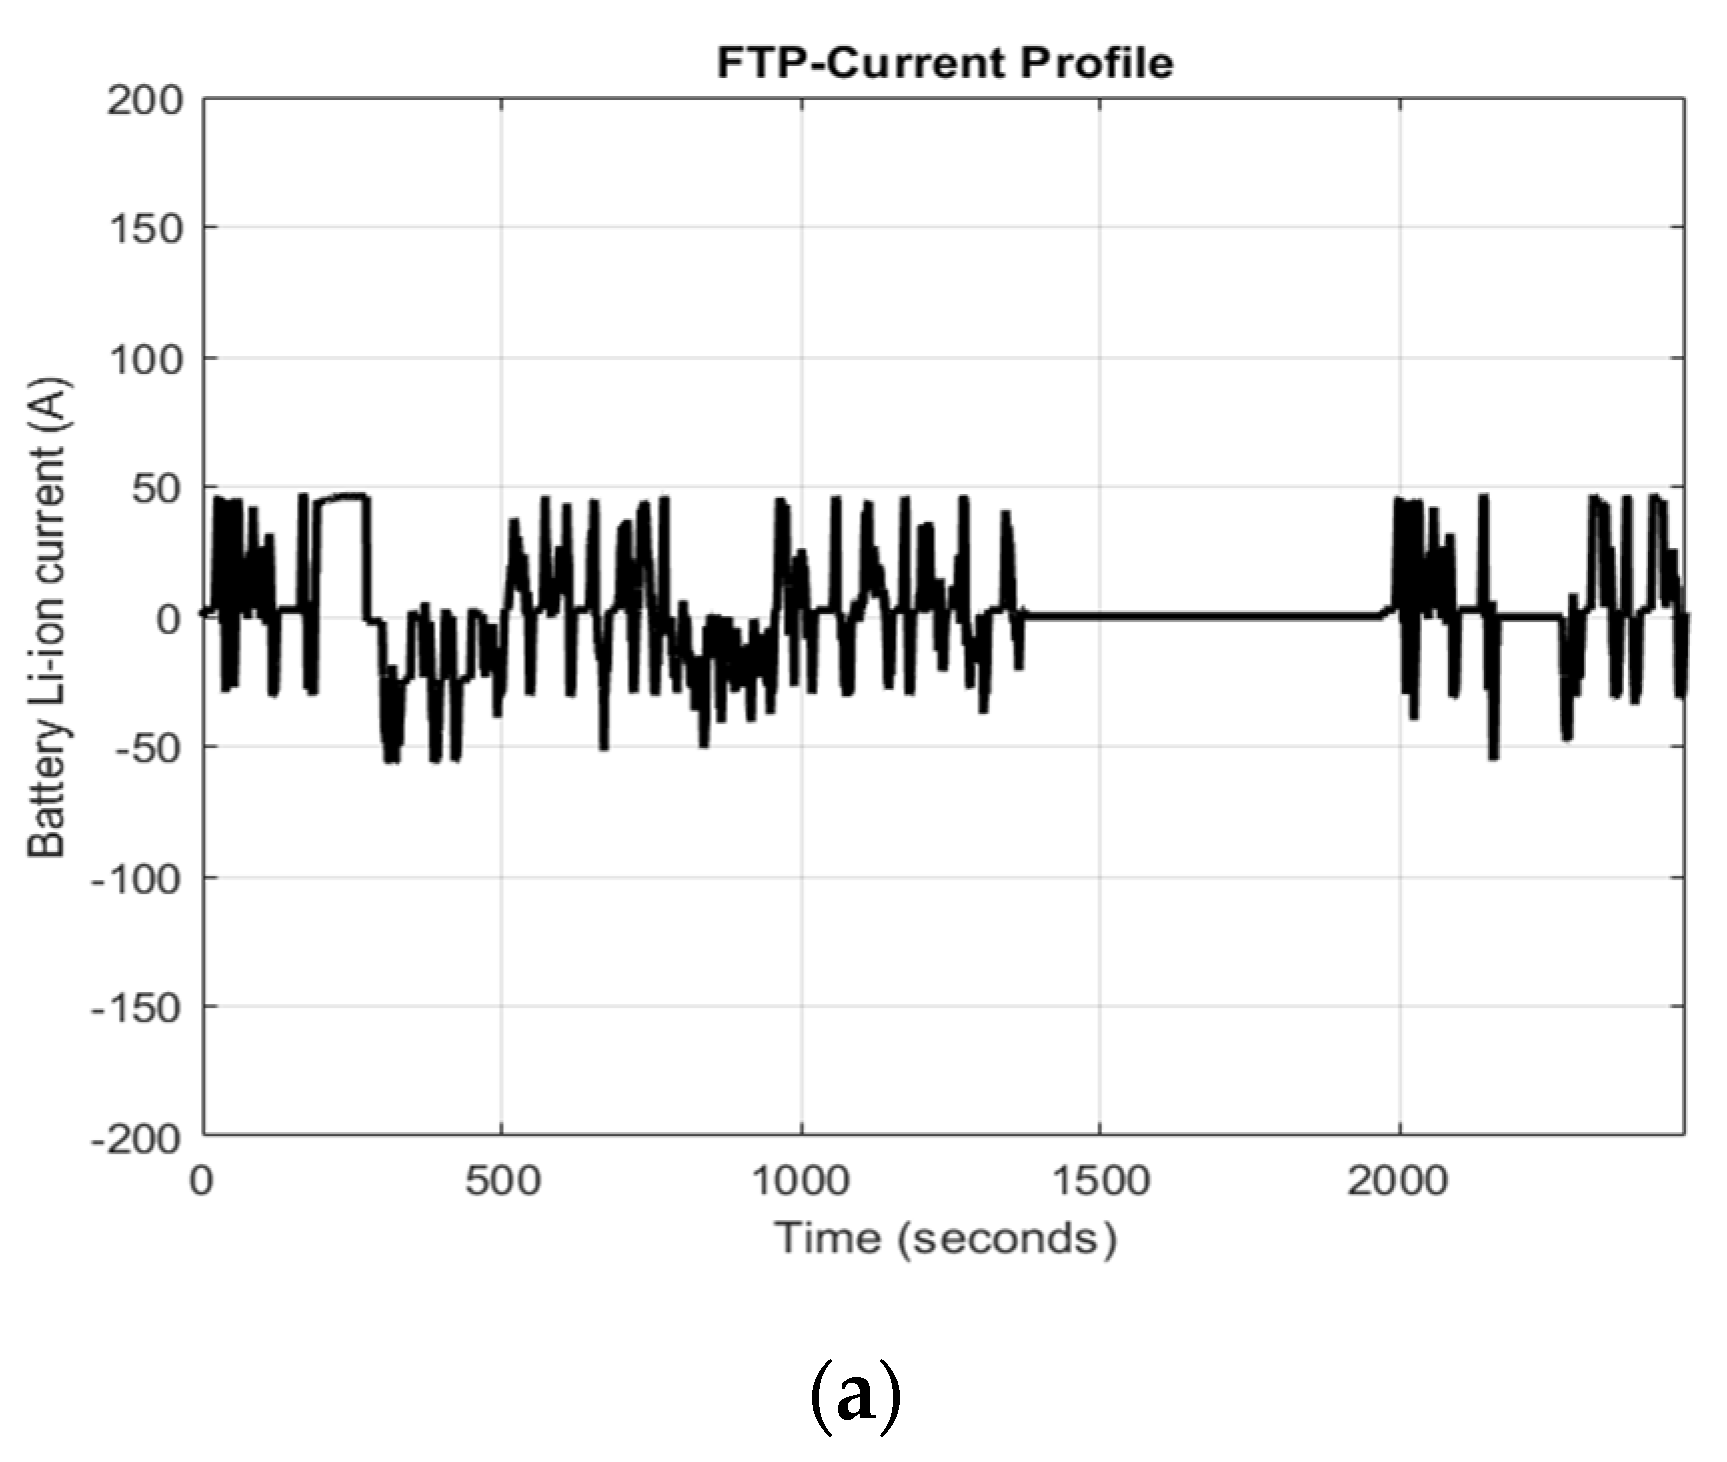
Figure 25a–d are shown the load profile (a), fuel cell voltage (b), fuel current (c) and hydrogen consumption respectively (d), according to the load profile.
The simulation results in Figure 25 show a decrease in FC battery voltage from 56 V at t = 0 [s] to 42 V at t = 70 [s] and remain almost constant until t = 250 [s], followed by an increase to 48 V at t = 350 [s]. The FC current has the same evolution trend as the FC power, increasing from 0 [A}, to t = 0, at approximately 210 [A] at t = 70 [s]. Inside the window [70, 250] [s] the FC current remains almost constant, and at t = 250 [s] it decreases to 80 [A] at t = 350 [s]. FC fuel consumption follows the same trend as FC current. The amount of fuel increases at the beginning of the simulation to 100 [lpm], then remains almost constant inside the window [70, 250] [s] when it delivers maximum power to the DC network, because in this interval the load power profile reaches some peaks of maximum value between 8 kW and 10 kW.
In the Figure 26a,b are depicted the UC current (a) and UC voltage variation (b) respectively, according to the load profile.
Matlab simulation results reveal an evolution with sharp peaks for UC current and UC voltage when Li-ion battery needs to provide much more power to the DC network or during sudden acceleration and regeneration.
In the Figure 27a–c are presented the Li-ion battery current (a), battery terminal voltage (b) and battery SOC (c) respectively, according to power required.
Figure 27a,b show several peaks (positive and negative) in the evolution of the current of the Li-ion battery, which correspond to the charging and discharging cycles of the battery, as can be seen from the evolution of SOC in Figure 27c. The terminal voltage of the Li-ion battery also has a lot of variations in its growth, decreasing from 83 V to t = 0 V to 60 V around t = 125 [s], followed by an increase to 83V when t = 83V.MATLAB simulation results analysis for Scenario 1
In this application, it is important to analyze the power distribution shown in Figure 24. The result of the analysis provides a better perspective on how EMS works in real-time simulations. In this figure, the red colour curve represents the profile of the power load, i.e., a variable power required for the AC load in the first 350 s of real-time simulation. The blue colour curve designates the main power generated by FC source, which is the dominant source, i.e., the one that delivers the most considerable amount of power to a DC grid and is almost constant inside the 150 s window length (75,225) [s]. The brown curve refers to the second power supply source, which is a Li-ion battery that delivers power to the DC grid in a smaller and variable amount during charging and discharging cycles, compared to FC. Finally, the green colour curve refers to the third power supply source that delivers the smallest amount of power to the DC grid only during the short periods of sharp acceleration and regeneration. The power distribution balance can be easily checked for enough moments because the MATLAB Data Tips measurement tool can help to mark several points on each curve. For example, at time t = 70 s, the power delivered by each source of power supply has the following values:
PFC = 6.985 kW, PBatt = 3.041 kW, PUC = 0 kW, and PL = 10.07kW
The power distribution evaluated at t = 70 s verifies with enough accuracy Equation (23), since:
PFC + PBatt + PUC = 10.026 kW, so close to PL = 10.07 kW
As Equation (23) is satisfied for each moment, it is easy to observe the behavior of all three power supply sources. The MATLAB simulation results shown in Figure 25c, Figure 26a and Figure 27a reveal the same trend of current evolution as that of each corresponding power supply.
As in the case of the EMS-SMCS setup, similar graphs with the same meaning are presented in Appendix A, Figure A1, Figure A2, Figure A3, Figure A4, Figure A5, Figure A6, Figure A7, Figure A8, Figure A9 and Figure A10 for second EMS-PICS setup, and in the ([30], Figures A11–A20) for third EMS-ECMS setup. The theory and all the Simulink diagrams behind the five EMS techniques are fully documented in [5]. In our research, these EMS techniques are presented only as complementary information for interested readers, such as to give a clue, motivation and to open new research directions for future HEV developments. Nonetheless, the topic is beyond the scope of this paper, which is focused only on the modeling aspects and Li-ion battery SOC estimation techniques.
  • Scenario 2: A 100 HP, 1750 RPM asynchronous induction motor (squirrel cage) is connected to AC grid as is shown in Figure 28.
In this scenario is shown only the MATLAB simulations result related to the evolution of asynchronous induction motor speed, as can be seen in Figure 29.
From Figure 29, it is easy to observe that the speed of induction motor connected to AC grid is not controlled, but it is quite close to 1750 RPM in steady state, for a torque load of 375 Nm.
  • Scenario 3: A 2 HP 1750 permanent magnet DC motor connected to DC side of the grid, as is shown in Figure 22 (the right topside block).
Since the block from Figure 22 encapsulates the PMDCM Simscape model, for clarity, Figure 30 shows the PMDCM Simscape model with all the details of electrical connections.
Unlike the uncontrolled speed of the asynchronous induction motor (ASM), the PMDCM is connected by a negative feedback in a closed-loop to a block of proportional-integral-derivative (PID) controller, to control its speed, as is shown in Figure 31, and developed in [12].
The MATLAB PMDCM RPM speed step response is shown in Figure 32. A big advantage of the PID controller is that the PMDCM speed response converges quickly and reaches the target speed of 1500 RPM in almost 1.8 s.
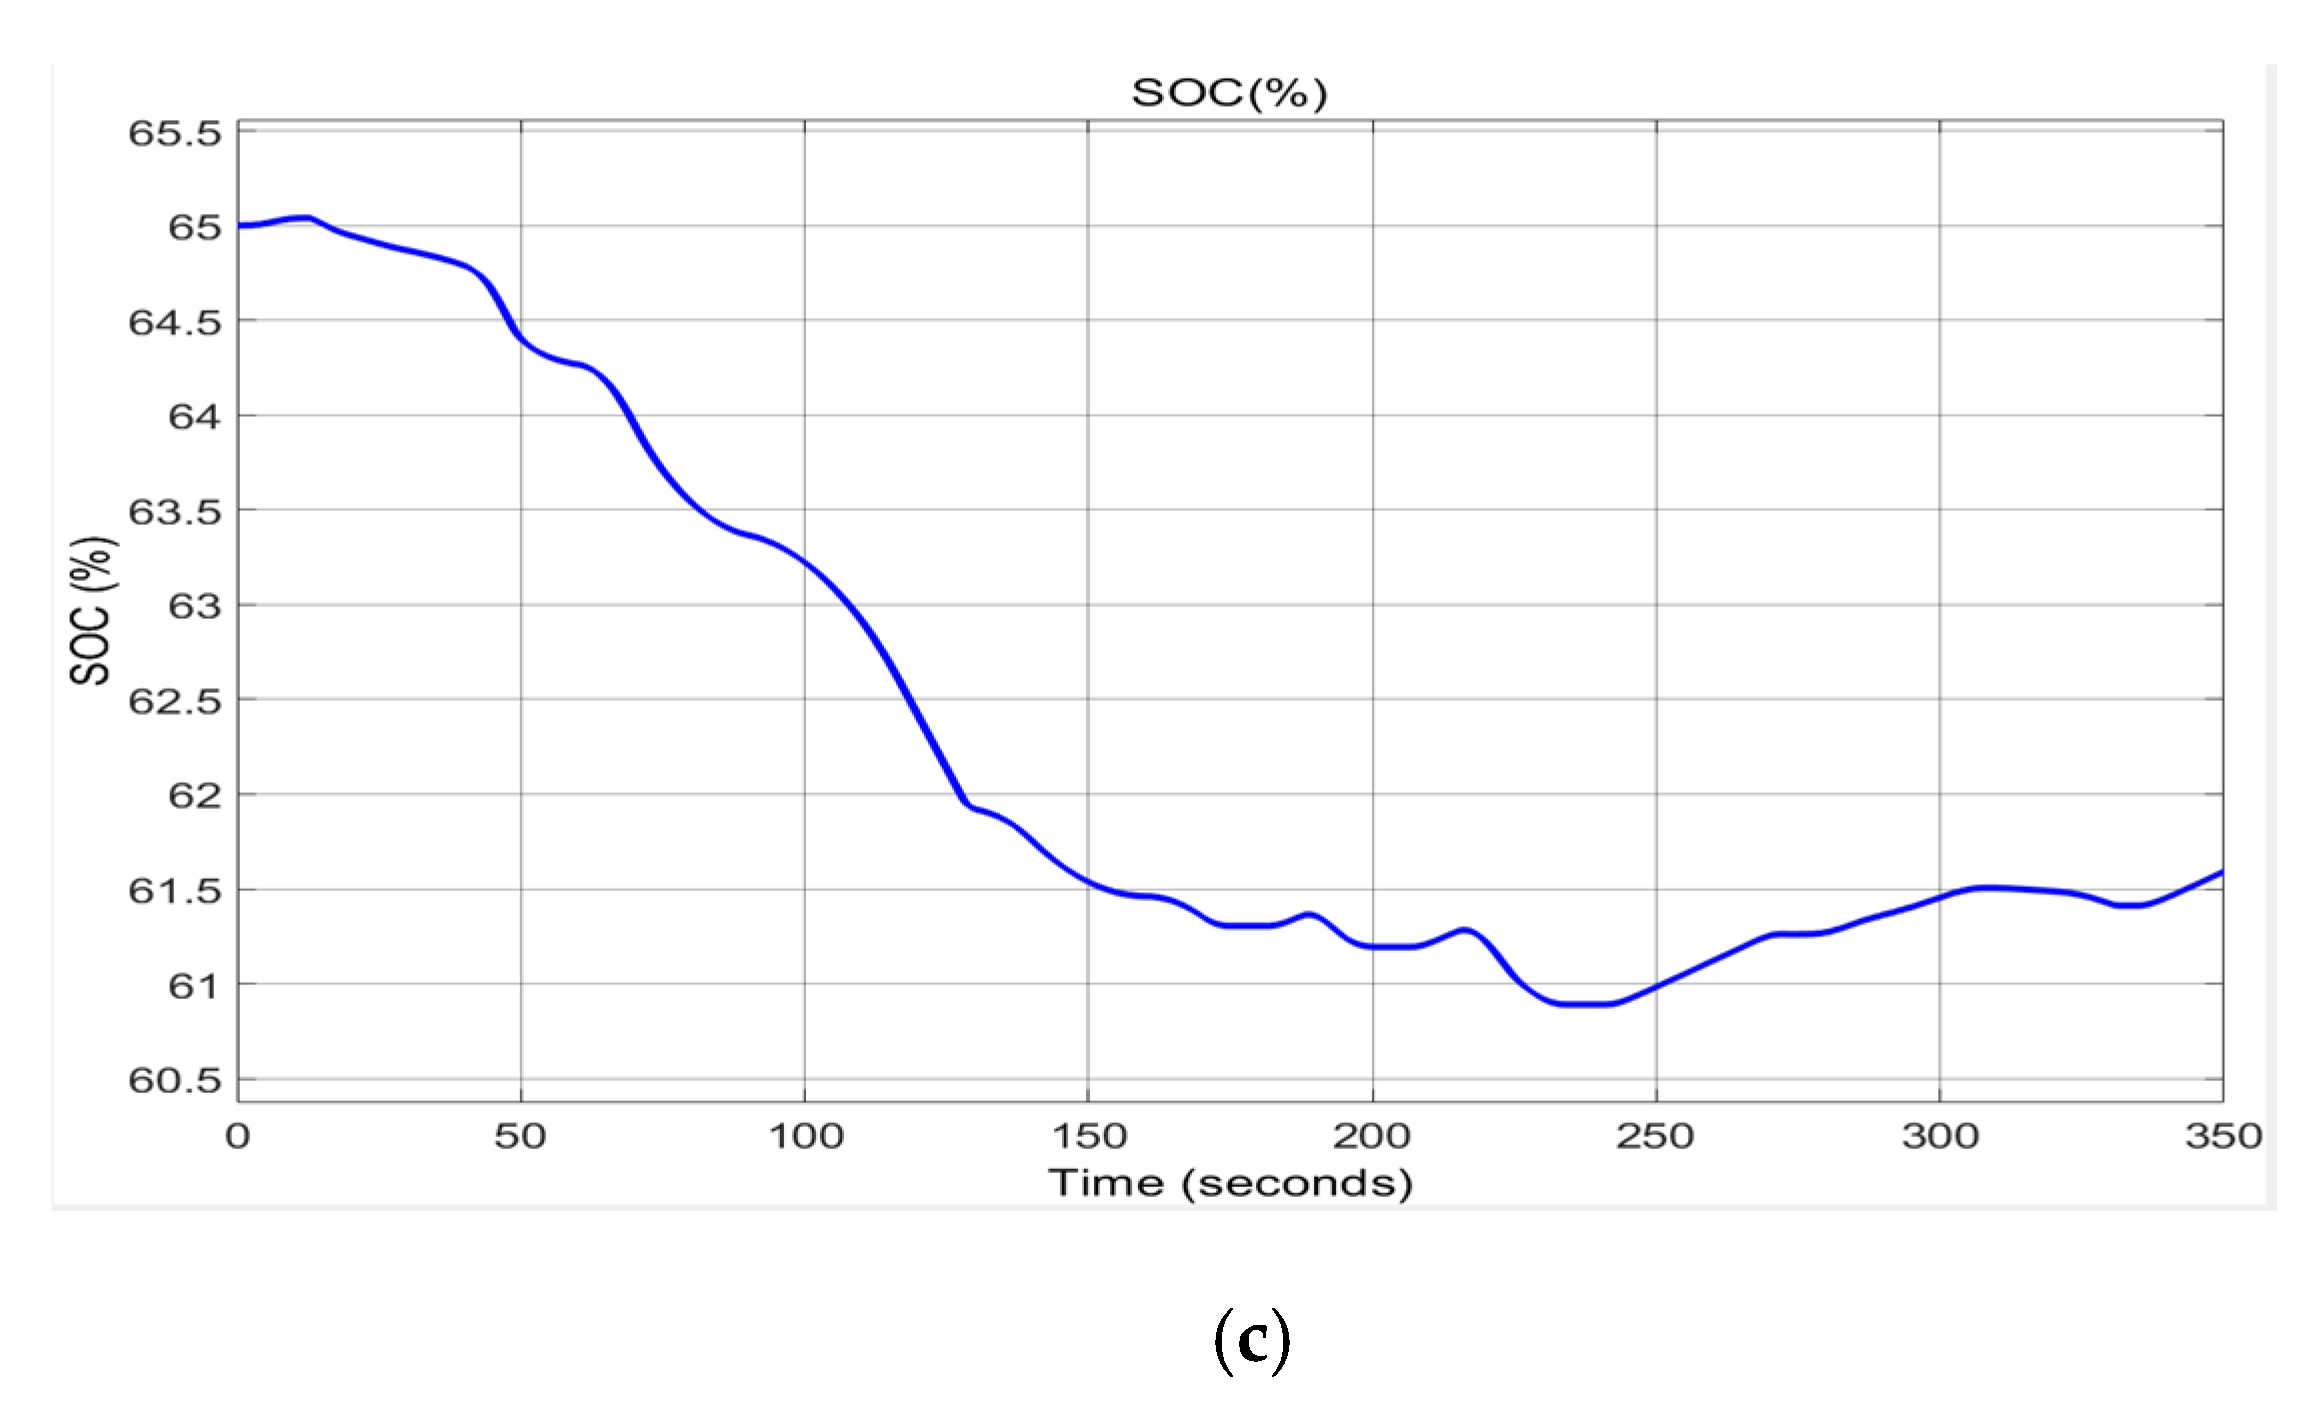
The characteristics curves of a Li-ion battery connected to PMDCM as a DC load are shown in Figure 33a–c, namely the battery SOC (a), a sequence of discharging and charging current cycles (b), and the battery terminal output voltage changes during battery operation (c). The SOC of the Li-ion battery remains almost constant during PMDCM operation. The battery current increases to almost 15 A at the beginning of the first transient and remains constant for a short period of time during steady state. However, at the beginning of the second transient it rises sharply to 60 A for a short time, then slowly decreases to −15 A at the end of steady state. The battery output voltage, shown in Figure 33c, decreases slightly during the first transient from 62.4 V to 62.2 V, and at the beginning of the second transient falls slowly for a short time and then increases linearly. At the end of steady state, it reaches 62.4 V. Therefore, the evolution of the battery output voltage is smooth, keeping an almost constant value during PMDCM operation.
The behaviour of the SC connected to the DC grid to supply power to the PMDCM during sudden changes in the load torque is described in Figure 34a for the SC current and in Figure 34b for the SC voltage. The SC current, during the first transient, decreases from 2000 A to 900 A at the end of the first steady-state period, and then at the beginning of the second transient continues the fall to −1000 A for which t = 2 [s]. After that the SC current increases to almost −300 A at t = 5 [s] which coincides with the end of steady-state. The SC voltage increases during the first transient from 0 [V] to almost 10 [V] at t = 1.8 [s], when PMDCM suddenly changes speed from 100 RPM to 1500 RPM, absorbing much more power. This justifies the presence of the SC to provide much more energy at this switching time. Therefore, the SC voltage suddenly increases from 10 V to 350 V in the time window (2, 2.5) [s] and then decreases to 200 V until the end of the steady-state. During this time, the SC protects the Li-ion battery so that it works smoothly, maintaining a constant SOC value.
The PMDCM behavior during the operation is shown in Figure 35a–d.
Figure 35a shows the linear evolution of the load torque with its PMDCM speed (scaling factor 0.011). Graph 35b describes the input power that changes abruptly in the step moment from 0 to 7 kW at t = 2 [s], followed by a decrease to 2.5 kW during steady state. Figure 35c shows the armature current absorbed by the PMDCM with a similar evolution trend as for the absorbed PMDCM power. Figure 35d shows the supplied armature voltage which is the same as the SC voltage, which justifies its presence to provide a large amount of energy, again protecting the Li-ion battery to make this effort. SC ensures the required voltage absorbed by PMDCM to achieve excellent speed profile tracking performance.

4. Li-Ion Battery Models Accuracy Performance—Battery Selection

4.1. Statistical Criteria to Asses the Accuracy of the Models

In a general formulation, for a better understanding of how to select an accurate Li-ion battery model, as well as a high-precision SOC state estimator and an excellent prediction of the selected battery output voltage, it can use some statistical criteria performance to compute the fitting errors between a set of candidates models reported in the literature [14,17,26,27]. Selection of Li-ion battery models and Kalman filter SOC estimators can be made by using the performance criteria developed in the “recent years in statistical learning, machine learning, and big data analytics” [27]. It is essential to emphasize the fact that now there are several criteria reported in the literature for models and estimators’ selection, that “receives much attention due to growing areas in machine learning, data mining and data science” [27]. Among them, the mean squared error (MSE), root mean squared error (RMSE), R2-squared, mean absolute squared error (MAE), standard deviation σ, the mean absolute percentage error (MAPE) [27], Adjusted R2, Akaike’s information criterion (AIC), Bayesian information criterion (BIC), AICc are “the most common criteria that have been used to measure model performance and select the best model from a set of potential models” [27].
Both models, i.e., the 3RC ECM and Simscape, are already validated by the available information extracted for each of them from the results of MATLAB simulations shown in Figure 13b, Figure 15, Figure 21a,b, that reveal an excellent accuracy due to SOC residual percentage errors being very low. A baseline for comparison is used the estimated value of ADVISOR SOC, as mentioned in the previous sections. The accuracy of both models is better compared to SOC residual error of 2%, usually reported in the literature for similar applications. The first model records a residual error of 1.2% (Figure 15) and the second one of 1.4% (Figure 21b).
Furthermore, to make a better delimitation between them, additional information is required. The values provided by all six statistical criteria, such as root mean squared error (RMSE), mean squared error (MSE), mean absolute error (MAE), standard deviation (std), mean absolute percentage error (MAPE) and squared, coefficient of determination (R2-squared), as are defined in [26,27], is valuable information that makes the difference when two models perform close in terms of accuracy. These values are presented in Table 5, for the 3RC ECM, respectively Table 6, for Simscape Li-ion battery models. All these performance criteria have lower values thus validate, without any doubt, the both models. Moreover, because for both RMSE, MSE, std, MAPE models are very close and R2-squared = 0.959 and 0.951, respectively, very close to 1, this is valuable information that indicates how close the values of the data set of the models are and of estimated values ADVISOR SOC. Thus, the overall performance is quite close, with a slight superiority of the 3RC ECR battery model, but the difference is still negligible..

4.2. Battery Selection Model

The lower values of all statistical performance criteria from Table 6, quite close to those from Table 5, justifies without doubts the validity of Simscape model. Based on the information collected from both Table 5 and Table 6, a rigorous analysis reveals that the both models perform similarly and are suitable for building highly efficient and accurate SOC estimatiors in Part 2. However, an appropriate criterion to compare several candidate models is a hard task for any analyst since some criteria can be disadvantaged by the “model size of estimated parameters while the others could emphasis more on the sample size of a given data” [27]. As a general remark, it can be said that the Simscape Li-ion battery model excels in the following features: simplicity, friendly user-interface, and being fast to implement in real-time.
Also, the battery parameters can be extracted very easily for different chemistry and specifications, and the model is much more realistic in terms of the values of physical model parameters. However, a comparison of SOC performance, more relevant for highlighting the strengths and weaknesses of both models, is provided by the validation results of the MATLAB simulations shown in Figure 13b and Figure 21a,b for the same FTP-75 driving cycle profile and equal SOC value estimated by the ADVISOR simulator 3.2. Following this test, excellent SOC accuracy is observed for both models. Valuable information on SOC accuracy is extracted from residual SOC errors generated in MATLAB and analyzed in Figure 15 and Figure 21b. The results of the MATLAB simulations show a residual SOC error in the case of the 3RC ECM Li-ion battery model in the range [−1, 1, 0, 4], and the percentage of residual SOC error is below 1.2%. In contrast, for the Simscape model, the percentage of residual SOC error is less than 1.4%, compared to the typical value of 2% reported in the literature for similar applications. The features mentioned above and in addition to the SOC percentage of excellent residual error, much lower than the typical value of 2% reported in the literature, are sometimes even better, strongly recommending the choice of the Simscape model for a wide variety of HEV and EVs applications. In conclusion, these results are encouraging for the next step to develop the most suitable SOC estimators in Part 2. The results of the MATLAB simulations will confirm that all three SOC estimators work better for a design based on choosing the Simulink model, rather than adopting 3RC ECM battery mode, even if the accuracy performance of both battery models is equally sensitive.

5. Conclusions

In the current research paper, the following most relevant contributions of the authors can be highlighted:
  • Selection for the same SAFT Li-ion battery of two models, the first model being a 3RC ECM and the second a highly non-linear MATLAB Simscape model, well known for its simplicity, excellent accuracy, practical value and suitable for real-time implementation.
  • Model development in continuous and discrete-time state space representation.
  • Validation of both models based on same FTP-75 driving cycle current profile test, using ADVISOR 3.2 software tool.
  • Thermal model design and Simulink implementation.
  • Opening of new research topics directions related to energy management systems, optimization techniques and HEV applications.
Based on six statistical criteria values for all three SOC estimators, as a behavior response to an FTP-75 driving cycle profile test, it was possible to decide based on SOC accuracy performance if both models are suitable to be used in Part 2 [30], for adaptive Kalman filter SOC estimators design and implementation. Furthermore, the overall performance analysis indicates that both models are accurate and suitable to be used in Part 2 [30]. In future work, our investigations will continue an improved modelling approach, by integrating the effect of degradation, temperature and SOC effects. New directions of research in energy management systems to develop power optimization techniques and for possible extensions to learning machine SOC estimation techniques will be a great challenge.

Author Contributions

R.-E.T., has contributed for, algorithm conceptualization, software, original draft preparation and writing it; N.T., has contributed for battery models investigation and validation, performed MATLAB simulations and formal analysis of the results; M.Z., has contributed for project administration, supervision, and results visualization; S.-M.R. has contributed for methodology, data curation and supervision. All authors have read and agreed to the published version of the manuscript.

Funding

This research received no external funding.

Acknowledgments

Research funding (discovery grant) for this project from the Natural Sciences and Engineering Research Council of Canada (NSERC) is gratefully acknowledged.

Conflicts of Interest

The authors declare no conflict of interest. This research received no external funding.

Abbreviations

EVelectric vehicle
HEVhybrid electric vehicle
FCEVfuel cell electric vehicle
HFCEVhybrid fuel cell electric vehicle
PEMpolymer electrolyte membrane
SMACARsmall car
FCfuel cell
UCultracapacitor
SCsupercapacitor
FCPEMfuel cell polymer electrolyte membrane
EMSenergy management system
BMSbattery management system
ADVISORadvanced vehicle simulator
EPAenvironmental protection agency
UDDSurban dynamometer driving schedule
FTP-75Federal test procedure at 75 [degrees F]
RMSEroot mean squared error
MSEmean squared error
MAEmean absolute error
MAPEmean absolute percentage error
R2/Rsquared, coefficient of determination
std (σ)standard deviation
OCVopen-circuit voltage
SOCstate of charge
NRELNational Renewable Energy Laboratory

Appendix A

Figure A1. EMS—classical PI control strategy setup.
Batteries 06 00042 g0a1
Figure A2. SMCAR HEV Powers—classical PI control EMS.
Batteries 06 00042 g0a2
Figure A3. Fuel cell (FC). (a) FC current; (b) FC voltage; (c) FC consumption.
Batteries 06 00042 g0a3
Figure A4. Li-ion battery specific variables. (a) Battery current; (b) battery voltage; (c) battery SOC.
Batteries 06 00042 g0a4
Figure A5. SC specific variables. (a) SC current variation; (b) SC voltage.
Batteries 06 00042 g0a5
Figure A6. EMS-equivalent consumption minimization strategy setup.
Batteries 06 00042 g0a6
Figure A7. SMCAR HEV power-equivalent consumption minimization EMS.
Batteries 06 00042 g0a7
Figure A8. Fuel cell. (a) FC current; (b) FC voltage; (c) FC consumption.
Batteries 06 00042 g0a8
Figure A9. Li-ion battery specific variables. (a) Battery current; (b) battery voltage; (c) battery SOC.
Batteries 06 00042 g0a9
Figure A10. SC specific variables. (a) SC current variation; (b) SC voltage.
Batteries 06 00042 g0a10

References

  1. Alarco, J.; Talbot, P. The History and Development of Batteries. Phys.org. 30 April 2015. Available online: https://phys.org/news/2015-04-history-batteries.html (accessed on 28 June 2020).
  2. Pressman, M. Understanding Tesla’s Lithium Batteries. Blog Post: Tesla News. Available online: https://evannex.com/blogs/news/understanding-teslas-lithium-ion-batteries (accessed on 28 June 2020).
  3. US Department of Energy. Energy Efficiency and Renewable Energy. Available online: https://afdc.energy.gov/vehicles/how-do-fuel-cell-electric-cars-work (accessed on 17 June 2020).
  4. Energy.gov. Office of Energy Efficiency and Renewable Energy Fuel Cells. Available online: https://www.energy.gov/eere/fuelcells/fuel-cells (accessed on 28 June 2020).
  5. Njoya, S.M. Design and Simulation of a Fuel Cell Hybrid Emergency Power System for a More Electric Aircraft: Evaluation of Energy Management Schemes. Ph.D. Thesis, University of Quebec from Montreal, Montreal, QC, Canada, 27 March 2013. [Google Scholar]
  6. Jarushi, A.; Schofield, N. Modelling and Analysis of Energy Source Combinations for Electric Vehicles. EVS24 International Battery, Hybrid and Fuel Cell Electric Vehicle Symposium, Stavanger, Norway, May 13–16, 2009. World Electr. Veh. J. 2009, 3, 0796–0802. [Google Scholar] [CrossRef] [Green Version]
  7. Njoya, S.M.; Dessaint, L.-A.; Liscouet-Hanke, S. Energy management Systems for a Hybrid Electric Source (Application for a More Electric Aircraft). MathWorks-MATLAB R2020a, Documentation. Available online: https://www.mathworks.com/help/physmod/sps/examples/energy-management-systems-for-a-hybrid-electric-source-application-for-a-more-electric-aircraft.html (accessed on 28 June 2020).
  8. MathWorks-MATLAB R2020a, Documentation. Available online: https://www.mathworks.com/help/physmod/simscape/getting-started-with-simscape.html (accessed on 30 June 2020).
  9. Burke, A.; Zhao, H. Applications of Supercapacitors in Electric and Hybrid Vehicles; Research Report-UCD-ITS-RR-15-09; Institute of Transportation Studies, University of California: Davis, CA, USA, 2015. [Google Scholar]
  10. King, A. Power-Hungry Tesla Picks up Supercapacitor Maker. Royal Society of Chemistry, Chemistry World. 11 March 2019. Available online: https://www.chemistryworld.com/news/power-hungry-tesla-picks-up-supercapacitor-maker-/3010215.article (accessed on 29 June 2020).
  11. Tejwani, V.; Suthar, B. Energy Management System in Fuel Cell, Ultracapacitor, Battery Hybrid Energy Storage. World Acad. Sci. Eng. Technol. Int. J. Electr. Commun. Eng. 2015, 9, 1492–1500. [Google Scholar]
  12. Tudoroiu, R.-E.; Zaheeruddin, M.; Tudoroiu, N.; Budescu, D.D. Fuzzy Logic PID Control of a PMDCM Speed Connected to a 10-kW DC PV Array Microgrid—Case Study. In Proceedings of the Federated Conference on Computer Science and Information Systems (ACSIS), Berlin, Germany, 1–3 September 2019; Volume 18, pp. 359–362. [Google Scholar] [CrossRef]
  13. Tudoroiu, R.-E.; Zaheeruddin, M.; Radu, S.-M.; Tudoroiu, N. A FLCPID RPM Hybrid Strategy for Speed Control-Case Study and Performance Comparison. In Proceedings of the 2020 2nd International Conference on Innovative Mechanisms for Industry Applications (ICIMIA), Bangalore, India, 5–7 March 2020. [Google Scholar] [CrossRef]
  14. Tudoroiu, N.; Zaheeruddin, M.; Tudoroiu, R.-E. Real Time Design and Implementation of State of Charge Estimators for a Rechargeable Li-ion Cobalt Battery with Applicability in HEVs/EVs-A comparative Study. Energies 2020, 13, 2749. [Google Scholar] [CrossRef]
  15. Keyser, M.A.; Pesaran, A.; Oweis, S.; Chagnon, G.; Ashtiani, C. Thermal Evaluation and Performance of High-Power Lithium-Ion Cells. Reprint. In Proceedings of the 16th Electric Vehicle Conference, Beijing, China, 1–3 October 1999; NREL: Golden, CO, USA. Available online: https://www.researchgate.net/publication/228834724 (accessed on 15 June 2020).
  16. Brooker, A.; Haraldsson, K.; Hendricks, T.; Johnson, V.; Kelly, K.; Kramer, B.; Markel, T.; O’Keefe, M.; Sprik, S.; Wipke, K.; et al. ADVISOR Advanced Vehicle Simulator; Version 2003; Documentation-March 26, 2013; NREL: Golden, CO, USA, 10 October 2003. Available online: http://adv-vehicle-sim.sourceforge.net/ (accessed on 15 June 2020).
  17. Tudoroiu, R.-E.; Zaheeruddin, M.; Radu, S.-M.; Tudoroiu, N. Real-Time Implementation of an Extended Kalman Filter and a PI Observer for State Estimation of Rechargeable Li-Ion Batteries in Hybrid Electric Vehicle Applications—A Case Study. Batteries 2018, 4, 19. [Google Scholar] [CrossRef] [Green Version]
  18. Tudoroiu, R.-E.; Zaheeruddin, M.; Radu, S.M.; Tudoroiu, N. New Trends in Electrical Vehicle Powertrains; Martinez, L.R., Prieto, M.D., Eds.; BoD–Books on Demand: Norderstedt, Germany, 2019; Chapter 4. [Google Scholar] [CrossRef]
  19. Farag, M. Lithium-Ion Batteries, Modeling and State of Charge Estimation. Master’s Thesis, University of Hamilton, Hamilton, ON, Canada, 2013. [Google Scholar]
  20. Plett, G.L. Extended Kalman filtering for battery management systems of LiPB-based HEV battery packs: Part 1. Background. J. Power Sources 2004, 134, 252–261. [Google Scholar] [CrossRef]
  21. Plett, G.L. Extended Kalman filtering for battery management systems of LiPB-based HEV battery packs: Part 2. Modeling and identification. J. Power Sources 2004, 134, 262–276. [Google Scholar] [CrossRef]
  22. Plett, G.L. Extended Kalman filtering for battery management systems of LiPB-based HEV battery packs: Part 3. State and parameter estimation. J. Power Sources 2004, 134, 277–292. [Google Scholar] [CrossRef]
  23. Tudoroiu, N.; Radu, S.M.; Tudoroiu, R.-E. Improving Nonlinear State Estimation Techniques by Hybrid. Structures, 1st ed.; LAMBERT Academic Publishing: Saarbrucken, Germany, 2017; p. 56. ISBN 978-3-330-04418-0. [Google Scholar]
  24. Hussein, A.A.; Batarseh, I. An overview of generic battery models. In Proceedings of the 2011 IEEE Power and Energy Society General Meeting Conference, Detroit, MI, USA, 24–28 July 2011. [Google Scholar] [CrossRef]
  25. Geetha, A.; Subramani, C. A significant energy management control strategy for a hybrid source EV. Int. J. Electr. Comput. Eng. 2019, 9, 4580. [Google Scholar] [CrossRef]
  26. Wikipedia. Mean Absolute Percentage Error. Available online: https://en.wikipedia.org/wiki/Mean_absolute_percentage_error (accessed on 6 July 2020).
  27. Pham, H. A New Criterion for Model Selection. Mathematics 2019, 7, 1215. [Google Scholar] [CrossRef] [Green Version]
  28. Zhang, R.; Xia, B.; Li, B.; Cao, L.; Lai, Y.; Zheng, W.; Wang, H.; Wang, W. State of the Art of Li-ion Battery SOC Estimation for Electrical Vehicles. Energies 2018, 11, 1820. [Google Scholar] [CrossRef] [Green Version]
  29. Kim, T. A Hybrid Battery Model Capable of Capturing Dynamic Circuit Characteristics and Nonlinear Capacity Effects. Master’s Thesis, University of Nebraska-Lincoln, Lincoln, NE, USA, 2012. [Google Scholar]
  30. Tudoroiu, R.-E.; Zaheeruddin, M.; Tudoroiu, N.; Radu, S.M. SOC Estimation of a Rechargeable Li-Ion Battery in fuel-Cell Hybrid Electric Vehicles-Comparative Study of Accuracy and Robustness performance Based on Statistical Criteria. Part II: SOC Estimators. Batteries 2020, 6. in press. [Google Scholar]
Figure 1. The distribution of the components on the car chassis (see [3], NREL).
Batteries 06 00042 g001
Figure 2. Vehicle input page setup.
Batteries 06 00042 g002
Figure 3. Simulink diagram of the small hybrid electric vehicle (HEV SMCAR) transmission system.
Batteries 06 00042 g003
Figure 4. Simulink setup page.
Batteries 06 00042 g004
Figure 5. The Simulink simulation results.
Batteries 06 00042 g005
Figure 6. The third order 3RC electric circuit model (ECM)–Li-Ion battery represented in NI Multisim 14.1 editor (see [19]).
Batteries 06 00042 g006
Figure 7. The Simulink diagram of third order 3RC ECM–Li-Ion battery model.
Batteries 06 00042 g007
Figure 8. The detailed Simulink diagram of the Simulink Simscape thermal model block (see [14]).
Batteries 06 00042 g008
Figure 9. Simulink Simscape model diagram setup that integrates two main blocks. Legend: First block from bottom side encapsulates the Li-ion battery model and Simulink thermal model block; Second block from the top side is a Simscape block with two Li-ion batteries, first one from the top simulate the temperature effects and second one from the bottom of first one doesn’t take into consideration the temperature effects.
Batteries 06 00042 g009
Figure 10. (a) The input ambient temperature profile; (b) the output temperature as response to input ambient temperature of the thermal model block.
Batteries 06 00042 g010
Figure 11. (a) The internal battery R i n ( T ) at ambient temperature (20 °C); (b) The polarization constant at ambient temperature Kp(T) (20 °C).
Batteries 06 00042 g011
Figure 12. (a) The effect of changes in ambient temperature, shown in Figure 10a, on output temperature profile; (b) The effect of changes in ambient temperature on the internal resistance R i n ( T ) ; (c) The effect of changes in ambient temperature on the polarization constant K p ( T )   .
Batteries 06 00042 g012
Figure 13. 3RC ECM Li-ion battery model (a) The Federal Test Procedure (FTP)-75 current profile test; (b) The corresponding 3RC ECM SOC true value versus ADVISOR state of charge (SOC) estimate (Li-ion battery model validation).
Batteries 06 00042 g013aBatteries 06 00042 g013b
Figure 14. (a) Li-ion battery terminal voltage; (b) the OCV = f(SOC) curve for a discharging constant current at 1C-rate (6A); (c) the Li-ion battery voltage; (d) the Li-ion battery SOC for a discharging constant current at 1C-rate (6A).
Batteries 06 00042 g014
Figure 15. The Li-ion battery SOC accuracy performance assessment–SOC residual.
Batteries 06 00042 g015
Figure 16. SAFT Li-ion battery specification—Simscape model; (a) Simscape model graphic representation (icon); (b) block parameters and battery type; (c) block parameters’ battery specification for a discharging constant current.
Batteries 06 00042 g016
Figure 17. SAFT Li-ion battery nominal current discharge characteristic @1C (6A) (top side view); @6.5A, 13A and 32.5A (bottom view)—Simscape non-linear model (x-scale is the time in minutes).
Batteries 06 00042 g017
Figure 18. SAFT Li-ion battery nominal current discharge characteristic @1C (6A) (top side view); @6.5A, 13A and 32.5A (bottom view)—Simscape nonlinear model (x-scale is the capacity in Ampere-hour (Ah)).
Batteries 06 00042 g018
Figure 19. The Simscape model of a generic 6 Ah and 3.2 V Li-ion battery (without temperature and aging effects (see [14], p. 12) connected to FTP-75 input current profile.
Batteries 06 00042 g019
Figure 20. Simulink Simscape Diagram of Li-ion model. The values of the parameters from Simulink diagram are allocated in a MATLAB script that runs first for initialization, and then is running the Simulink model to extract these values from MATLAB workspace.
Batteries 06 00042 g020
Figure 21. Simscape model Li-ion battery SOC accuracy assessment (a) Li-ion battery Simscape model SOC versus ADVISOR SOC estimate; (b) SOC residual; (c) terminal output voltage.
Batteries 06 00042 g021
Figure 22. The adapted EMS of HEV SMCAR—Simulink Simscape diagram (adapted from Noya, [5,7]).
Batteries 06 00042 g022
Figure 23. The EMS—state machine control strategy setup.
Batteries 06 00042 g023
Figure 24. SMCAR HEV power–EMS state machine control strategy setup.
Batteries 06 00042 g024
Figure 25. (a) Load profile; (b) fuel-cell voltage; (c) fuel-cell current; (d) fuel hydrogen consumption.
Batteries 06 00042 g025aBatteries 06 00042 g025b
Figure 26. (a) UC current; (b) UC voltage.
Batteries 06 00042 g026
Figure 27. (a) Li-ion battery current; (b) battery terminal voltage; (c) battery SOC.
Batteries 06 00042 g027aBatteries 06 00042 g027b
Figure 28. The 100 HP, 1750 RPM speed asynchronous induction motor (squirrel cage) connected to the output of a direct current/alternating current (DC/AC) converter (inverter).
Batteries 06 00042 g028
Figure 29. The MATLAB simulation result of unregulated RPM speed of induction motor.
Batteries 06 00042 g029
Figure 30. A 2HP 1750 RPM PMDCM—Simscape model (see [12]).
Batteries 06 00042 g030
Figure 31. Closed-loop PMDCM-proportional-integral-derivative (PID) RPM speed control.
Batteries 06 00042 g031
Figure 32. PMDCM RPM speed step response.
Batteries 06 00042 g032
Figure 33. Li-ion battery supplying the PMDCM; (a) Li-ion battery SOC; (b) Li-ion battery current; (c) Li-ion battery terminal voltage.
Batteries 06 00042 g033
Figure 34. Supercapacitor (SC) supplying the PMDCM during sharp changes in the load torque; (a) SC current; (b) SC voltage.
Batteries 06 00042 g034
Figure 35. PMDCM—DC load. (a) PMDCM load torque; (b) PMDCM input absorbed power; (c) PMDCM armature current; (d) PMDCM armature voltage.
Batteries 06 00042 g035
Table 1. Li-ion electrical characteristics for a SAFT battery of 6 Ah, 3.6 V [16].
Parameter/CoefficientSymbolValueUnit Measure
Nominal VoltageVnom3.6V (volt)
Max charge voltageVmax3.9V
Min discharge voltageVmin2.1V
Nominal CapacityCnom6Ah (Ampere-hour)
Specify energyη64
Energy densityηch135Wh/kg
Coulombic coefficientηdsch0.98Wh/dm3
-for charging current 0.86
-for discharging current
Table 2. Li-ion mechanical and thermal characteristics SAFT battery of 6 Ah, 3.6 V (cylindrical shape) [16].
Parameter/CoefficientSymbolValueUnit Measure
1.
Diameter
D0.047m (meter)
2.
Height
h0.104m
3.
Weight
G0.375kg
4.
Volume
V0.000018m3
5.
Operating temperature range
t(−10) (+45)°C (degree Celsius)
6.
Ambient temperature
t020°C
7.
Heat capacity
cp925J/kg K ***
8.
Heat transfer coefficient
hc125W/(m2K)
9.
Constanta perfect gas
R8.314J/(mol K)
10.
Thermal resistance
Rth6°C/W
11.
Power losses
Ploss1.9W (watts)
12.
Thermal time constant
Tc2000s
13.
Activation energy
E20,000J/mol **
* J is the unit measure for mechanical energy (Joule), ** mol stands for number of molecules, *** K-stands for Kelvin degree.
Table 3. The RC ECM parameters [17,18,19,20,21,22,23].
Item MeasureParameters/CoefficientsSymbolValueUnit
Li-ion battery ECM parameters
1Internal ohmic resistanceRin6mΩ (milliohm
2First cell polarization resistanceR10.65mΩ
3Second cell polarization resistanceR21.06mΩ
4Third cell polarization resistanceR30.2mΩ
5First cell polarization capacitanceC15847.08F (Farad)
6Second cell polarization capacitanceC247,719.07F
7Third cell polarization capacitanceC38.99 × 109F
Table 4. RC ECM Li-ion battery open-circuit controlled voltage (OCV) coefficients.
Parameter/CoefficientSymbolValue
K04.23
K10.000038
OCV coefficientsK20.24
K30.22
K4−0.04
Table 5. Statistical errors root mean squared error (RMSE), mean squared error (MSE), AMSE—Li-ion 3RC ECM SOC values versus ADVISOR SOC estimates.
RMSEMSEMAEStandard Deviation (σ) MAPE (%)R2-Squared
0.00750.000050.0070.03841.120.959
Table 6. Statistical errors RMSE, MSE, MAE, std, MAPE and R2 for Simscape Li-ion model validation versus ADVISOR estimate.
RMSEMSEMAEStandard Deviation (σ)MAPE (%)R2
0.00790.00006360.0070.0384   1.19   0.951

