Article

The Physical Manifestation of Side Reactions in the Electrolyte of Lithium-Ion Batteries and Its Impact on the Terminal Voltage Response

Department of Electrical & Computer Engineering, North Carolina State University, Raleigh, NC 27606, USA
*
Author to whom correspondence should be addressed.
Batteries 2020, 6(4), 53; https://doi.org/10.3390/batteries6040053
Submission received: 28 August 2020 / Revised: 28 September 2020 / Accepted: 21 October 2020 / Published: 31 October 2020
(This article belongs to the Special Issue Lithium-Ion Batteries: Latest Advances and Prospects)

Abstract

:
Batteries as a multi-disciplinary field have been analyzed from the electrical, material science and electrochemical engineering perspectives. The first principle-based four-dimensional degradation model (4DM) of the battery is used in the article to connect the interdisciplinary sciences that deal with batteries. The 4DM is utilized to identify the physical manifestation that electrolyte degradation has on the battery and the response observed in the terminal voltage. This paper relates the different kinds of side reactions in the electrolyte and the material properties affected due to these side reactions. It goes on to explain the impact the material property changes has on the electrochemical reactions in the battery. This paper discusses how these electrochemical reactions affect the voltage across the terminals of the battery. We determine the relationship the change in the terminal voltage has due to the change in the design properties of the electrolyte. We also determine the impact the changes in the electrolyte material property have on the terminal voltage. In this paper, the lithium ion concentration and the transference number of the electrolyte are analyzed and the impact of their degradation is studied.

1. Introduction

Lithium-based batteries are dominating the battery market because of their high energy density and rapidly decreasing manufacturing cost per kWh. While these batteries have many advantages, they also have disadvantages such as safety and recycling. Recycling of lithium ion batteries is a threefold process that involves pyrometallurgy (treatment with heat), hydrometallurgy (treatment with acid/liquid) and recycling through physical processes such as separation by weight. Recycling was mainly performed to recover the rare-earth metals that are hard or expensive to find and mine and hazardous materials that are toxic for the environment [1]. By recycling the used or spent lithium ion batteries, it is possible to recover up to 70% of the cathode material that is made up of rare earth metals [2]. However, the cost of recycling lithium ion batteries is increasing because of the increase in the complexity of lithium ion battery chemistries to ensure stability and improved tolerance to charging rates and temperatures [3]. Safety is a major concern in lithium ion batteries because they are designed to have highly combustible agents (such as organic solvents in electrolytes) and combustion inducing agents (electrochemical reactions that generate heat) in a sealed container. When operating normally, the electrochemical reactions generate very little heat and therefore prevent any kind of combustion or explosion. However, if subjected to extreme operating conditions (e.g., high charging/discharging currents, high temperatures, etc.) these agents can react violently and result in explosions [4]. Inappropriate operation can also lead to dendrite formations that can cause an internal short between the cathode and the anode and result in explosive reactions [5]. The electrolyte is one of the important components in the battery where heat or gas generation can cause problems. This is because most electrolytes in lithium ion batteries are dissolved in organic solvents that are highly flammable [6]. To ensure that these batteries operate as they are designed to, battery management/monitoring systems (BMS) are developed to continuously monitor the states of the battery such as the State of Charge (SOC), State of Health (SOH), Remaining Useful Life (RUL), State of Function (SOF) and temperature of operation. The BMS also monitors the charging and discharging operations of the battery to ensure that the operating currents are within the rated specifications of the battery and that the upper and lower cut-off voltage limits are not exceeded [7]. The temperature of operation of the battery also has a very important role in its operation and performance. When the battery is operated at higher temperatures, the electrolytic resistance decreases initially and then begins to dissociate resulting in an increase in the resistance between the electrodes. Similarly, when the temperature of the battery drops below the operating range, the electrolyte begins to coagulate, resulting in an increase in the resistance to the flow of lithium ions between the electrodes [8]. The C-rate or charging/discharging rate plays a crucial role in the degradation of the battery as well. Using very high C-rates can lead to deposition of lithium ions instead of intercalation. Deposition of the lithium ions will result in loss of active material and lithium inventory and cause the battery to degrade faster [9]. To better understand the operation of lithium ion batteries, a physics-based modeling approach is used to represent the lithium ion battery and its components [9]. Most batteries have four major components—electrodes, electrolytes, separators and current collectors. The electrodes, positive and negative, are the regions where electrochemical reactions take place that generate electrons. The electrolyte acts as a charge transportation medium between the positive and negative electrode and vice versa based on the mode of operation (i.e., charging or discharging) [10]. The electrolyte in lithium ion batteries is often lithium salts such as lithium hexafluorophosphate (LiPF 6 ) dissolved in an organic solvents usually ethylene carbonate (EC) and di-methyl carbonate (DMC) [11]. The ratio of the EC and DMC is determined by the dielectric property and the viscosity requirements of the electrolyte. EC contributes to the dielectric property while DMC makes the electrolyte less viscous [12]. The dielectric property contributes to the charge holding capability and the viscosity determines the resistance to the flow of ions between the electrodes. The separator provides electrical isolation between the electrodes and is doused in the electrolyte to enable movement of ions through the separator. To reduce the effect of self-discharge, the electrolyte is designed to have very high ionic conductivity and minimal electronic conductivity, which means the electrolyte offers low resistance to lithium ion movement and very high resistance to the flow of electrons. This high ionic conductivity and low electronic conductivity is achieved by dissolving the LiPF 6 in an organic solvent—the EC and DMC combination. The organic solvent ensures that the electrolyte offers high impedance to electron flow, and the dissolved LiPF 6 ensures that it offers a low resistance to lithium ion flow. The electrolyte of the battery in this paper is LiPF 6 dissolved in a 2:1 EC:DMC solution [13].
This paper discusses the physical manifestations of side reactions that happen in the electrolyte and the impact these manifestations have on the terminal voltage of the battery. It simulates degradation of the electrolyte through degradation of the salt diffusion coefficient and the transference number and generates the voltage profile when the battery model is subjected to a constant discharge current of 0.4C for a fixed duration of 4500 s or until the lower limit of the terminal voltage (3.5 V) is reached. The degradation of the electrolyte parameters was simulated in intervals of 10% so as to determine the sensitivity of the terminal voltage to the degradation of the parameter in consideration.
This article is organized as follows: Section 2 discusses the side reactions that take place in the battery, Section 3 presents the electrolyte salt diffusion coefficient degradation and the impact it has on the terminal voltage of the battery, Section 4 describes the impact of electrolyte transference number degradation on the voltage across the terminals of the battery and Section 5 concludes the paper and provides a discussion on the future work planned for this research area. The abbreviations, units and initial values of all the parameters used in the simulation are described in Table A1.

2. Side Reactions

The side reactions in a battery are highly reliant on the battery’s operating parameters. Based on operating conditions such as temperature and charging and discharging C-rates, there are three areas where side reactions can occur—at the electrode–electrolyte interface [14], at the electrode–current collector interface and in the electrolyte itself.

2.1. Electrode–Electrolyte Interface

At the electrode–electrolyte interface, the side reaction causes an increase in the thickness of a solid electrolyte interface. The solid electrolyte interface (SEI) is a passivation layer that is designed by the manufacturer during the creation of the battery to isolate the electrode from the electrolyte as shown in Figure 1 [15]. If the battery is exposed to temperatures outside it’s nominal operating range (higher or lower) or high charging/discharging rates, there is a significant rise in the loss of lithium inventory because of changes in the electrochemical reactions inside the battery. When operated under high charging/discharging rates, the lithium ions react with the SEI and cause a chemical reaction that results in the depletion of the SEI. Upon undergoing this kind of reaction, the anode is exposed to the electrolyte. The anode exposure to the electrolyte causes chemical reactions that produce compounds that inhibit the charge-producing electrochemical reactions [16]. The battery also undergoes different kinds of stress: charging/discharging stress, mechanical stress, temperature-based stress, etc. [17,18,19]. This paper focuses on the mechanical stress that the battery’s electrodes undergo and the resulting side reactions. This kind of stress can cause the battery’s electrode to separate from the current collector and cause a barrier to the current flow between the current collector and the electrode. This phenomenon is electrically represented as a growth in the internal resistance of the battery [20]. Exceeding the upper and lower cut-off voltage by forcing the battery to charge or discharge beyond the manufacturer’s specification results in a chemical reaction between the current collectors, the electrode and the electrolyte. This corrosive reaction causes a passivation layer to form between the electrode and current collector. The passivation layer hinders the transfer of electrons from the electrode to the current collector and thus causes the resistance of the battery to increase [21].

2.2. Electrode–Current Collector Interface

The electrode–current collector interface is where the battery is able to accept the electrons from the external circuit to complete the electrochemical reaction. During the design of the battery, the electrode is deposited on the current collector, made of highly conductive metals such as aluminum and copper, to prevent any loss of contact. However, either due to improper design or wear and tear of the electrode or current collector, there may be loss of contact between the current collector and the electrode. This loss of contact between the two surfaces can result in an increase in the internal impedance because of the gap between the surfaces and thus cause energy loss [22].

2.3. Electrolyte

The ideal electrolyte of the battery is a transport medium to enable lithium ions to move without resistance between electrodes. The electrolyte forms a temporary chemical bond with the lithium ions as they move from one electrode to the other. When the lithium ion reaches the other electrode, the SEI acts as a filter, removing the electrolyte surrounding the lithium ion and permitting only the lithium ion to flow through the SEI and into the cathode or anode [23]. This phenomenon is particularly important at the anode because when the lithium ion is bonded with the electrolyte, it has a much bigger size than the expansion capability of the graphite electrode. If the lithium ion with the electrolyte intercalate into the anode, then it results in uneven expansion and cracking of the anode. This cracking of the anode exposes it to the electrolyte and results in a growth of SEI and irreversible compounds. Figure 1 shows the temporary bond that the lithium ion makes with the electrolyte as it moves through the electrolyte and the SEI filtering the electrolyte to enable proper intercalation into the graphite anode. However, when subjected to extreme operating conditions such as high C-rates and temperatures, the electrolyte begins to interact with the lithium ions being transported and forms permanent chemical compounds. Since batteries generate and store energy through electrochemical reactions, the temperature of operation has an important role in the kind of reaction that takes place. When subjected to high temperatures, the ethylene carbonate in the electrolyte solution reacts with lithium ions to form more SEI and ethylene gas as shown in Equation (1) [24]. The ethylene gas causes the expansion of the battery cell because there is no exhaust or outlet for the gas to escape. This expansion applies pressure on the electrode and causes it to crack and results in more electrode material being exposed to the electrolyte. With more electrolyte-electrode exposure, the degradation rate is increased and more electrolyte and electrode material are lost. Equation (1) is an example of one of the side reactions that takes place in the battery that results in SEI formation.
( 2 ( CH 2 ) 2 CO 3 ) ethylene carbonate + 2 e + 2 Li + ( ( CH 2 OCO 2 Li ) 2 ) SEI + ( CH 2 = CH 2 ) ( ethylene gas ) .
Another degradation phenomena that affects the electrolyte is dissociation when subjected to either very high temperatures or potentials. When the electrolyte is subjected to very high temperatures or potential differences across it, the chemical compounds begin to break down. This breakdown of the chemicals results in the inability of the electrolyte to act as a transportation medium between the electrodes.
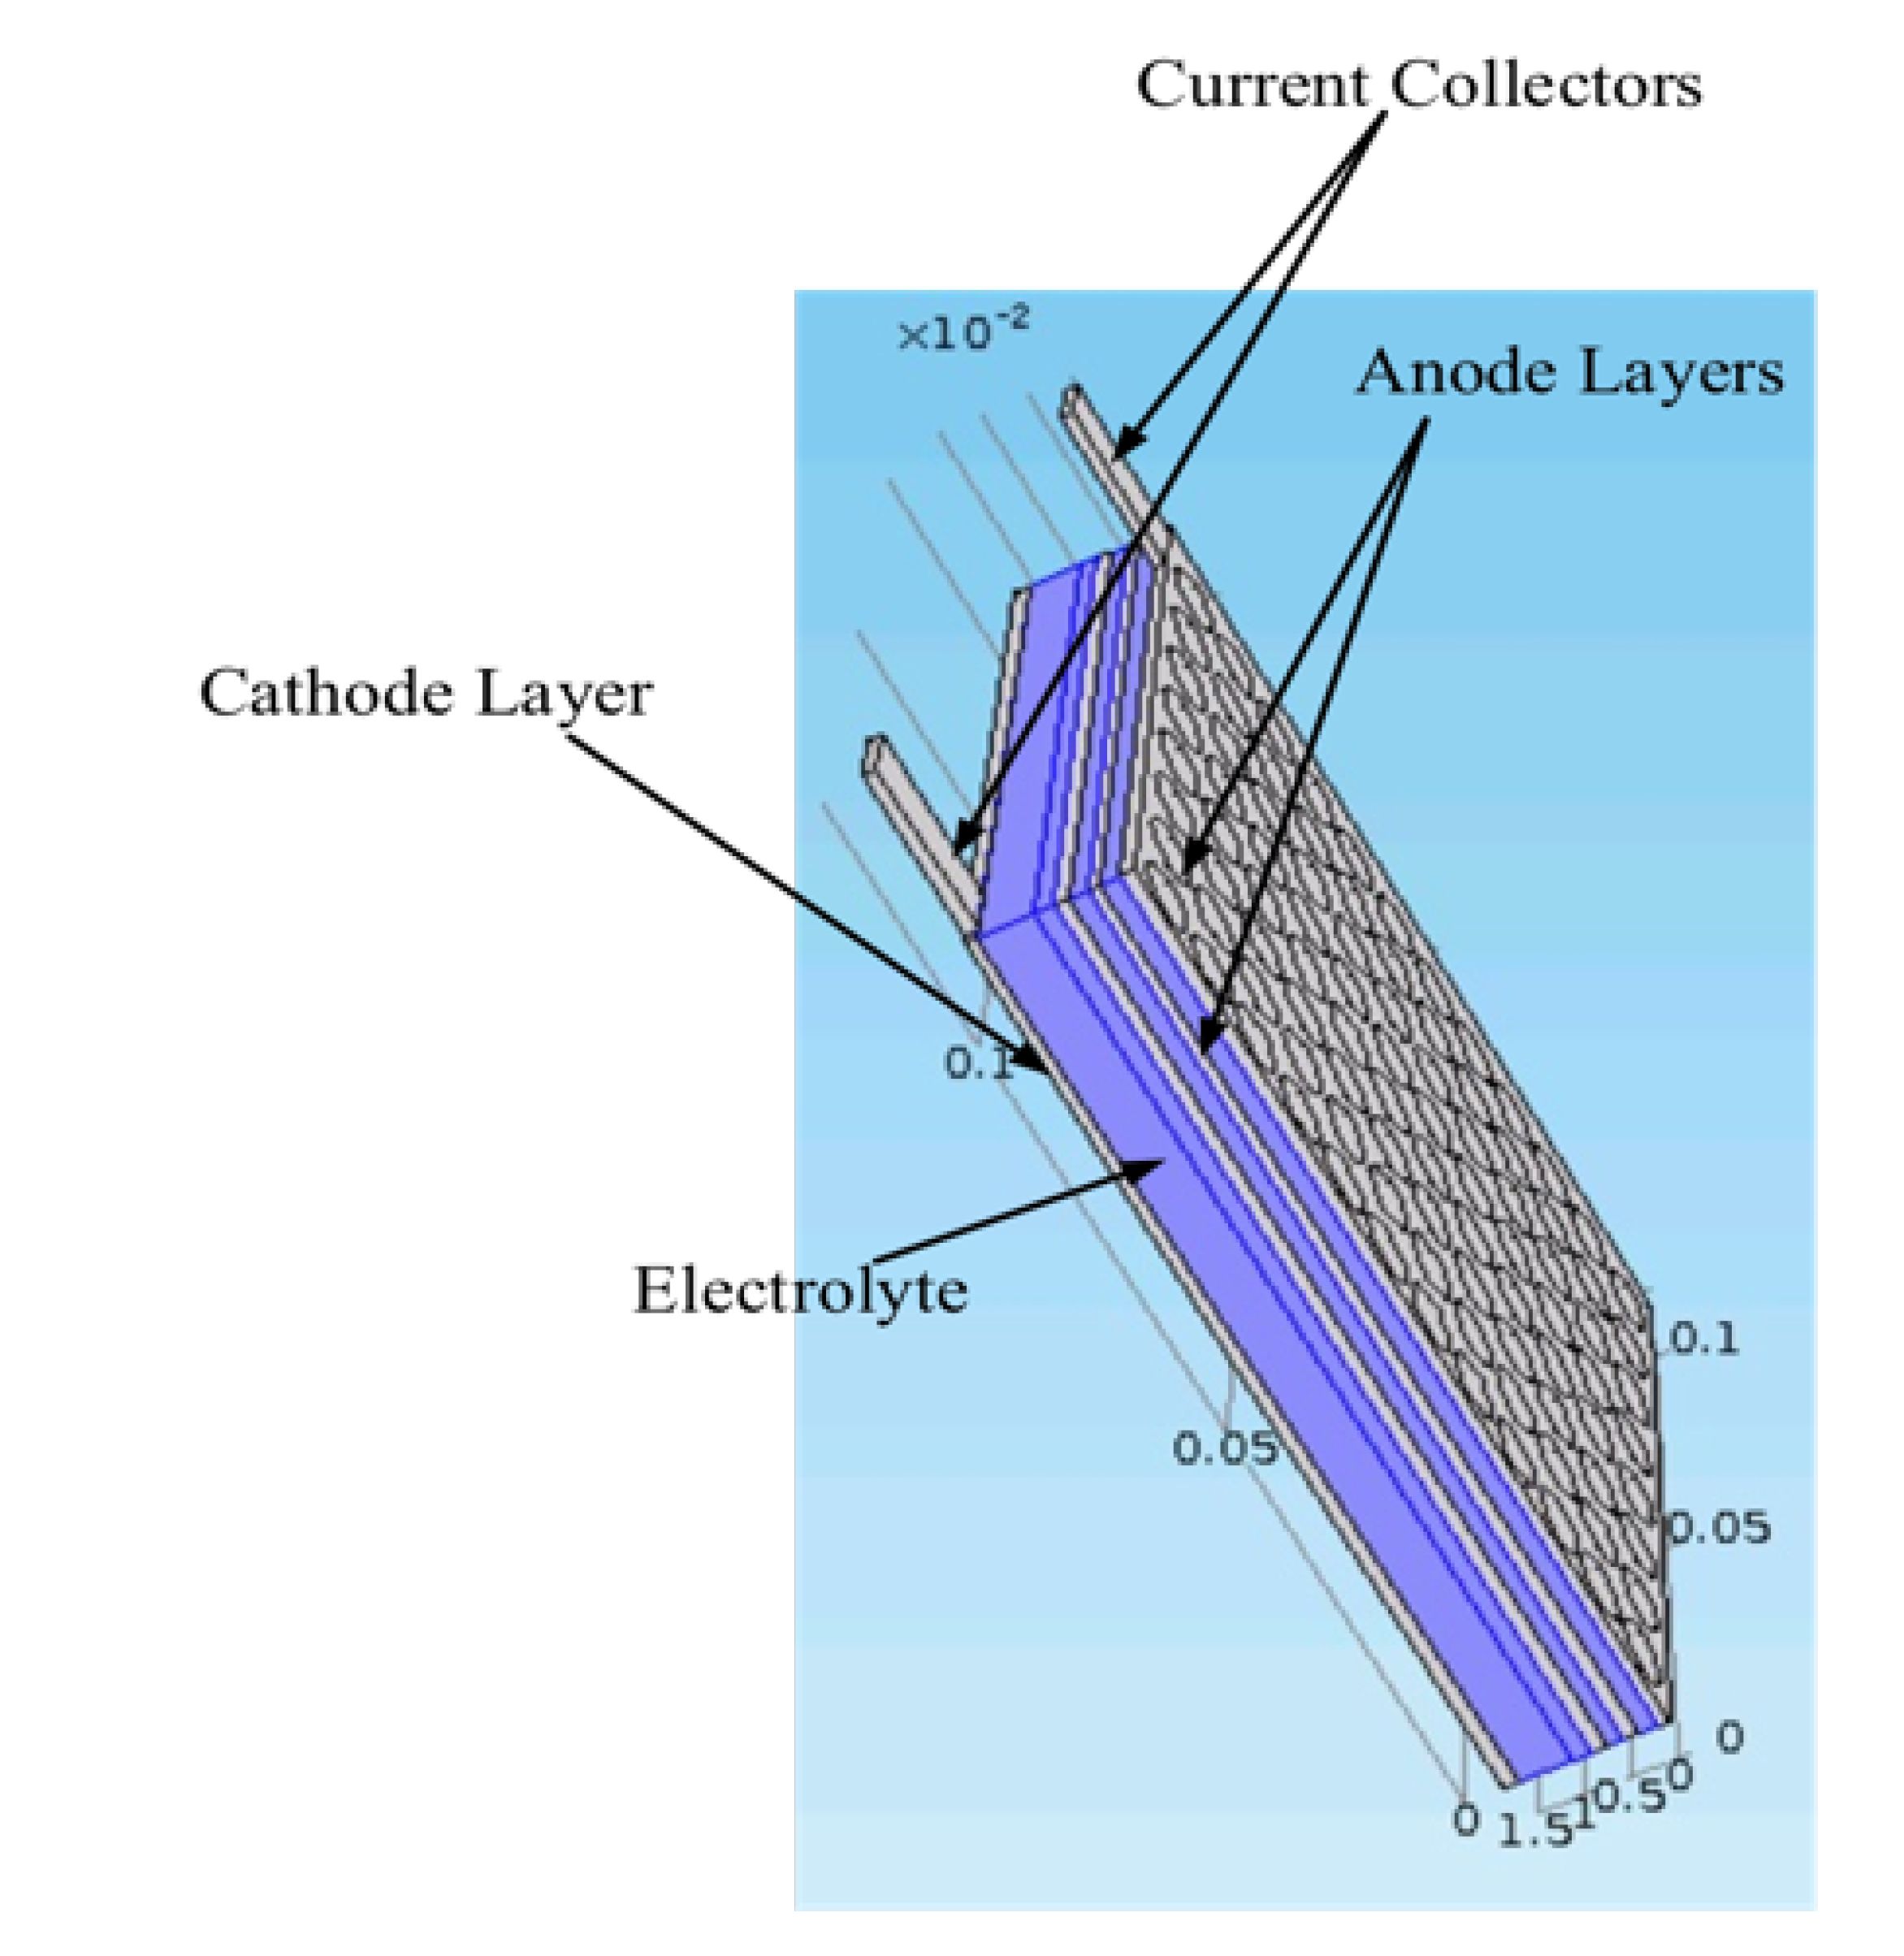
This paper simulates the degradation of the electrolyte by varying the electrochemical properties of the electrolyte: the salt diffusion coefficient and the transference number using the first principle-based 4 dimensional degradation model (4DM) as shown in Figure 2 [24]. The terminal voltage is studied based on the degradation of these parameters and conclusions are drawn in terms of its sensitivity to the degradation of the electrolyte. The electrolyte salt diffusion coefficient and the transference number are also interdependent. Their interdependence can be observed in Equation (3) where the change in the effective diffusion coefficient is directly proportional to the transference number of the electrolyte. When either of the parameters change, there will be a more severe impact on the rate of change of the terminal voltage of the battery. While the 4DM framework is capable of simulating the interdependencies between the different parameters of the electrolyte, this article focuses on the sensitivity of each individual component of the battery on the performance and voltage response. As a result, the interdependencies are not considered in this article and will be presented in a separate article.

3. Electrolyte Salt Diffusion Coefficient Degradation

The salt diffusion coefficient of the electrolyte defines the maximum rate of diffusion that is possible in the electrolyte [25]. The diffusion coefficient’s relationship with the temperature and electromotive force (EMF) applied is given by the Stokes–Einstein equation [26].
D = μ k B T .
Using the conservation of mass equation based on Fick’s Law when applied to the Pseudo 2D (P2D) model, gives,
( ϵ e c e ) t = x D e e f f c e x + 1 t + 0 F j L i .
Given D e e f f = D e ϵ e p , Equation (3) can be written as
( ϵ e c e ) t = D e ϵ e p 2 c e x 2 + 1 t + 0 F j L i .
For a constant j L i , if ϵ e p decreases then ( ϵ e c e ) t will decrease. Integrating and solving Equation (4) with respect to time gives:
ϵ e c e = D e ϵ e p 2 c e x 2 t + 1 t + 0 F j L i t .
Integrating on both sides of Equation (5) with respect to x and solving, we get,
c e = 1 ϵ e x 2 D e ϵ e p t 1 t + 0 F j L i t x x .
Therefore, when ϵ e p decreases then ( ϵ e x 2 D e ϵ e p t ) increases and c e decreases. From (3) and (7), for constant j L i , the decrease in c e will cause an increase in ϕ e to balance the equation.
x κ e f f ϕ e x + κ D e f f l n c e x + j L i = 0 ,
κ e f f 2 ϕ e x 2 = κ D e f f 2 l n c e x 2 j L i .
Integrating (8) gives:
ϕ e = κ D e f f κ e f f l n c e j L i x 2 κ e f f ,
Δ ϕ e = κ D e f f κ e f f l n c e 2 c e 1 .
The overpotential of the battery can be written as,
η = ϕ s ϕ e U .
Since η is constant and the equilibrium potential, U, at any defined concentration is also constant, the only parameter that can vary to compensate for the change in ϕ e is ϕ s . Thus,
Δ η = Δ ϕ s Δ ϕ e Δ U ,
0 = Δ ϕ s Δ ϕ e ,
Δ ϕ s = Δ ϕ e .
Therefore, when ϕ e decreases, then ϕ s will increase to keep η constant. With an increase in ϕ s , V t will either increase or decrease based on the battery mode of operation (charging/discharging).
V t = ϕ s + ϕ s R f A I ,
Δ V t = Δ ϕ s + Δ ϕ s .
From Equations (14) and (16),
Δ V t = f ( Δ ϕ e ) .
Thus, from Equations (10) and (17) we get,
Δ V t = f κ D e f f κ e f f ln c e 2 c e 1 .
From Equation (18), if c e 1 is the initial lithium ion concentration in the electrolyte when the battery is designed then the change in terminal voltage to the decrease in lithium ion concentration in the electrolyte follows an exponential decrease.
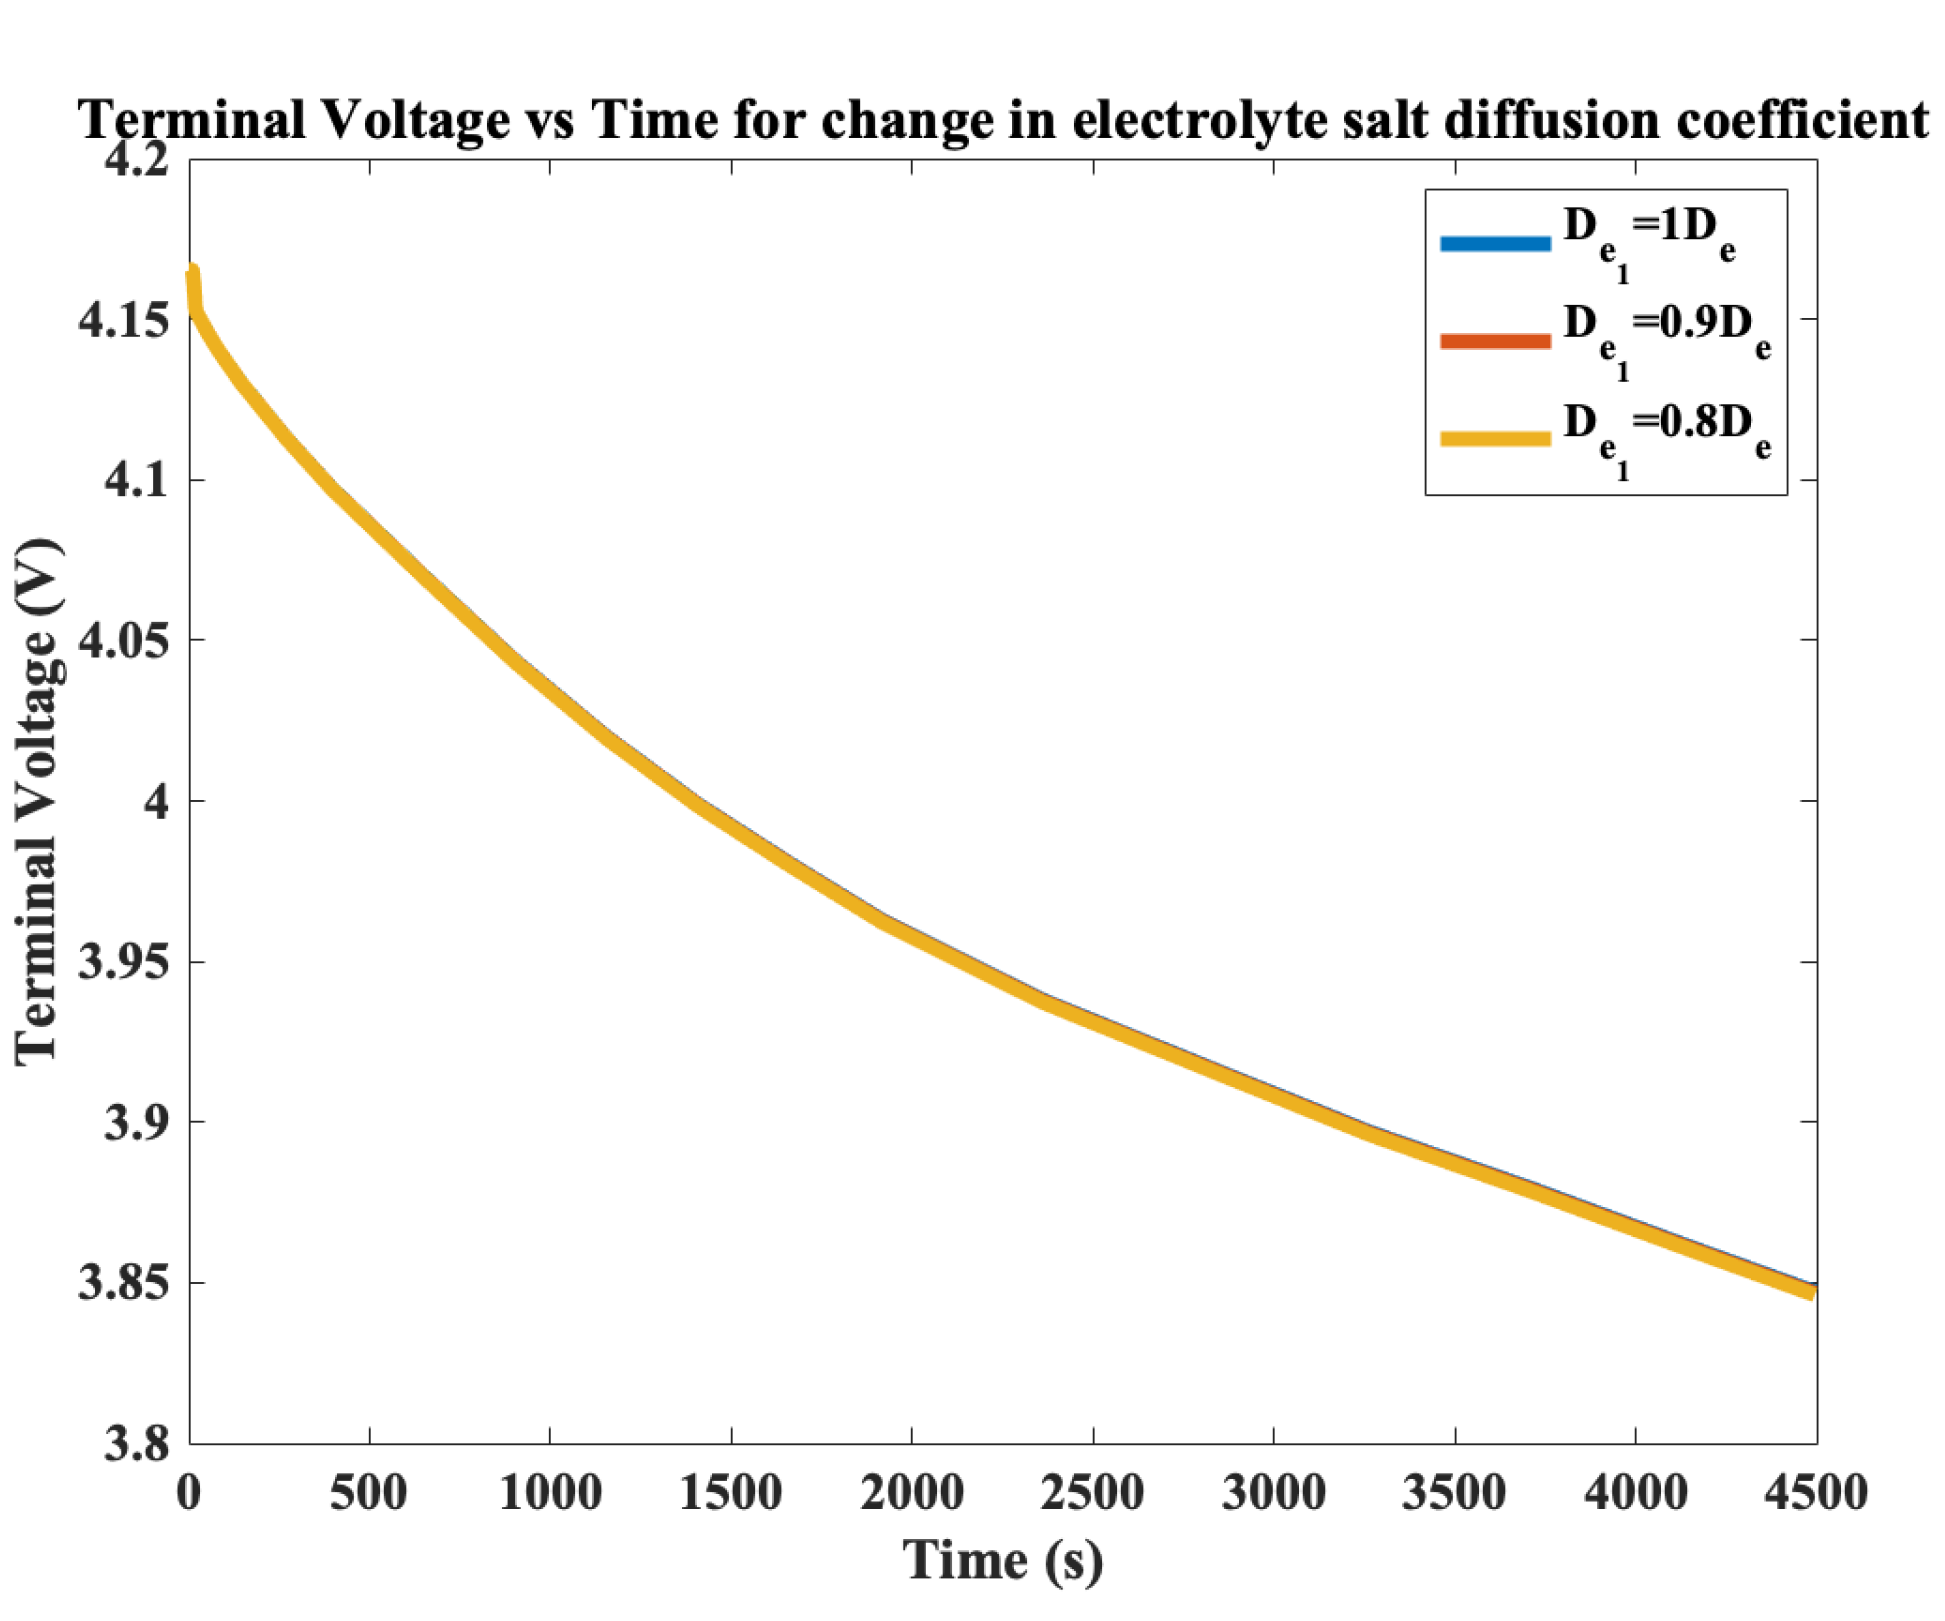
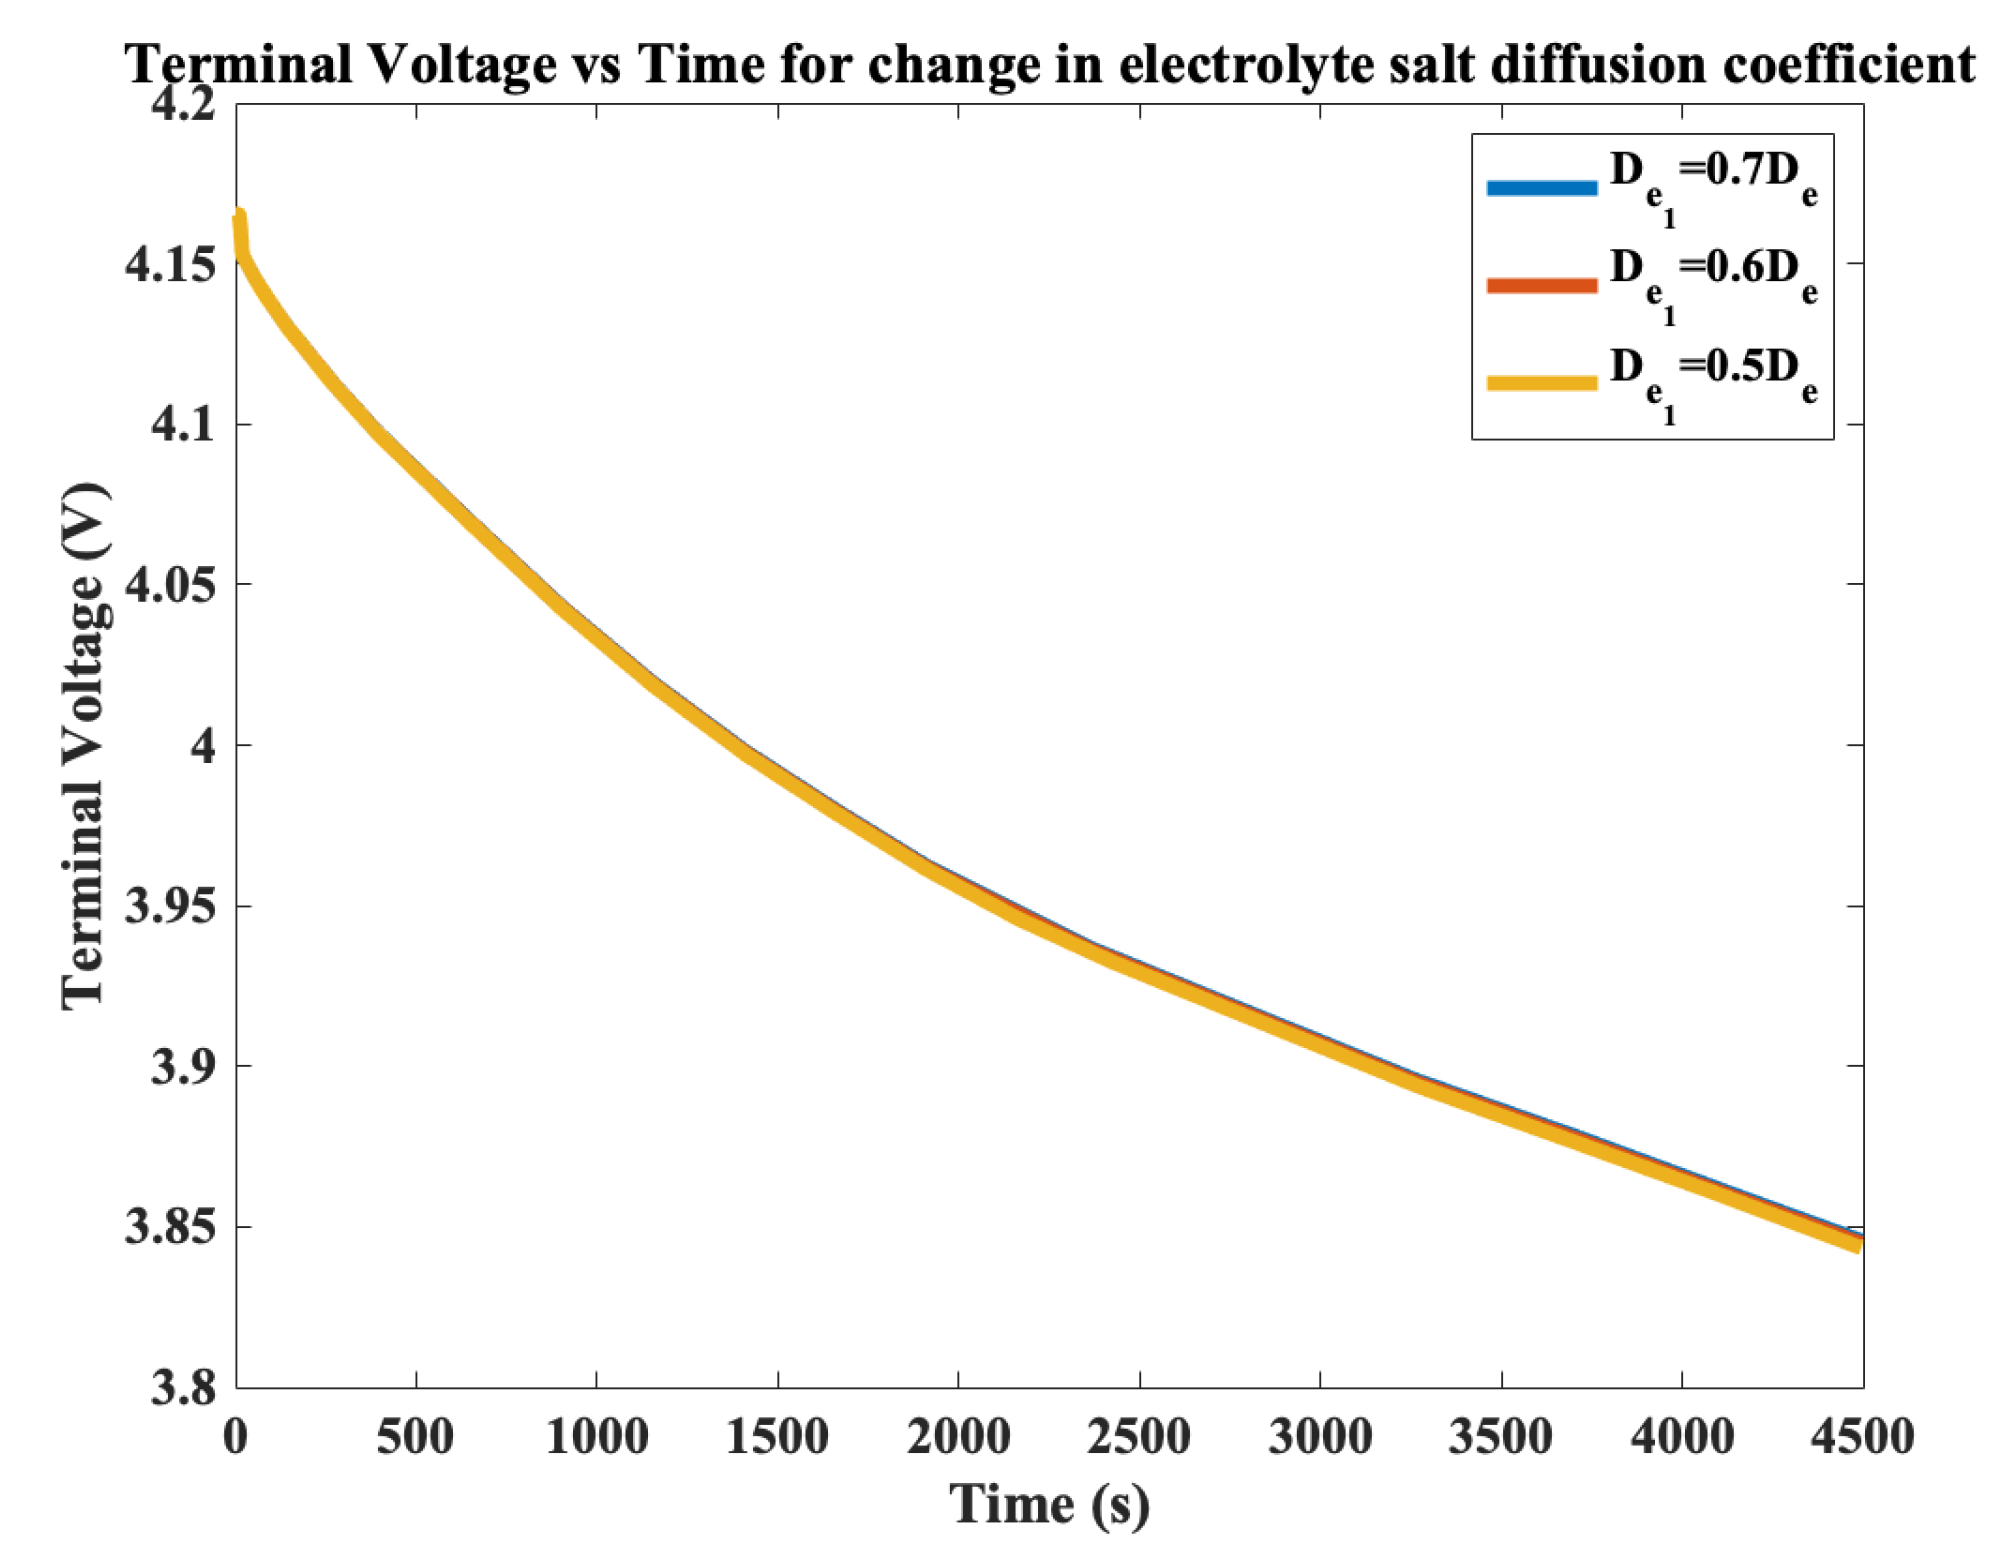
Figure 3, Figure 4 and Figure 5 show the terminal voltage response to the change in the electrolyte salt diffusion coefficient degradation. It can be observed that there is a decrease in the terminal voltage when the battery’s electrolyte salt diffusion coefficient decreases. This is in correlation with the mathematical derivations obtained in Equations (6) and (18). Figure 6 shows that the response follows an exponential curve. This is obtained using the curve fitting toolbox in the Matlab. The R 2 fit is determined to be 0.9952.
Δ V t = 0.02406 e ( 4.001 D e ) .

4. Electrolyte Transference Number Degradation

The electrolyte transference number defines the ratio of current carried by ions in an electrolyte to the total current flowing through the electrolyte [27]. Since in any electrolyte there are positive and negative ions, the transference number is usually between 0 and 1 [26]. In lithium ion batteries, the electrolyte ion transference number is around 0.3–0.4.
Using Equation (7) and the conservation of charge per Fick’s Law as shown in Equation (21) we have,
x κ e f f ϕ e x + κ D e f f l n c e x + j L i = 0 ,
κ D e f f = 2 R T κ e f f F ( t + 0 1 ) 1 + l n f ± l n c e .
For a fixed current being drawn or sent into the battery, j L i is a constant. Assuming that l n f ± l n c e = 0 we get,
κ D e f f = 2 R T κ e f f F ( t + 0 1 ) .
Differentiating κ D e f f with respect to t + 0 gives:
κ D e f f t + 0 = 2 R T κ e f f F .
Therefore, with an increase in t + 0 , there is an increase in κ D e f f . If κ D e f f increases then using Equation (20), the only way to keep the equation equal to 0 for a constant j L i is that x κ e f f ϕ e x must decrease. But κ e f f is a constant for any material. Therefore, 2 ϕ e x 2 must decrease. Thus, Equation (20) can be written as,
2 ϕ e x 2 = 2 R T κ e f f F ( t + 0 1 ) 2 l n c e x 2 j L i κ e f f .
Integrating (24) gives,
ϕ e ( x ) = 2 R T F ( t + 0 1 ) ln c e ( x ) j L i x 2 κ e f f .
Therefore, from Equations (17) and (25), a conclusion that the variation in the terminal voltage is directly proportional to the change in the electrolyte potential can be drawn.
Δ ϕ e ( x ) = 2 R T F ( Δ t + 0 ) ln c e ( x ) .
From Equations (17) and (26), there is a direct relationship between the change in the transference number and the change in the terminal voltage. However, the relationship also has a negative slope.
Δ V t = f 2 R T F ( Δ t + 0 ) ln c e ( x ) .
From Equation (6), we know that c e is a function of t + 0 . Therefore, Equation (27) can be rewritten as,
Δ V t = f ( Δ t + 0 ) .
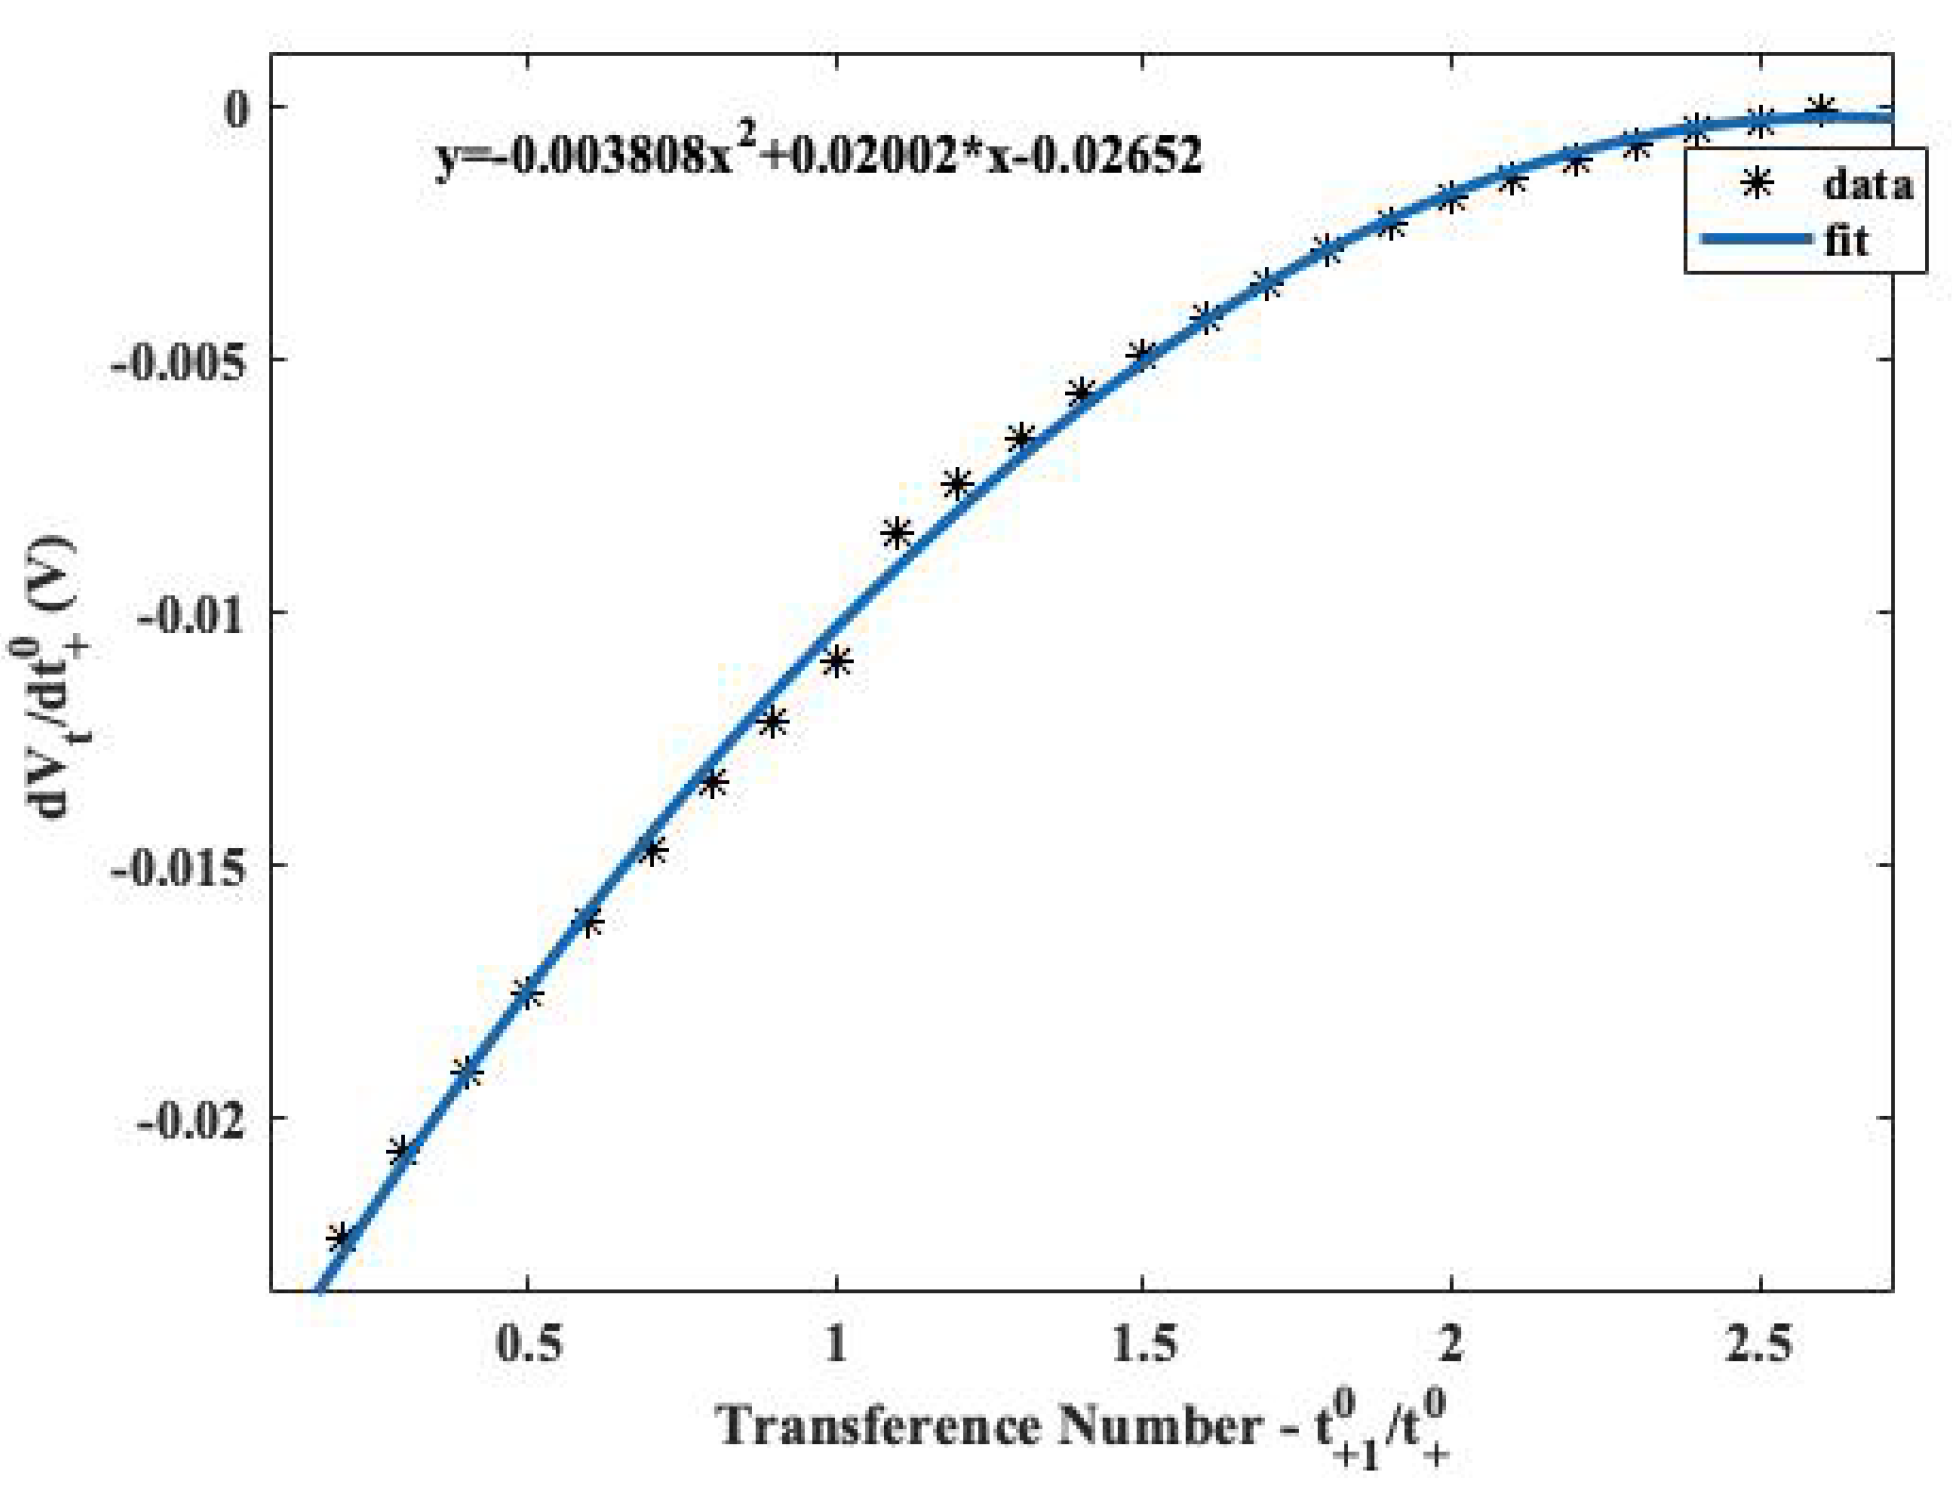
From the curve fitting toolbox in Matlab, the smallest order of the polynomial that fits the function is a second order polynomial with an R 2 fit of 0.9982.
Δ V t = 0.003808 Δ t + 0 2 + 0.02002 Δ t + 0 0.02652 .
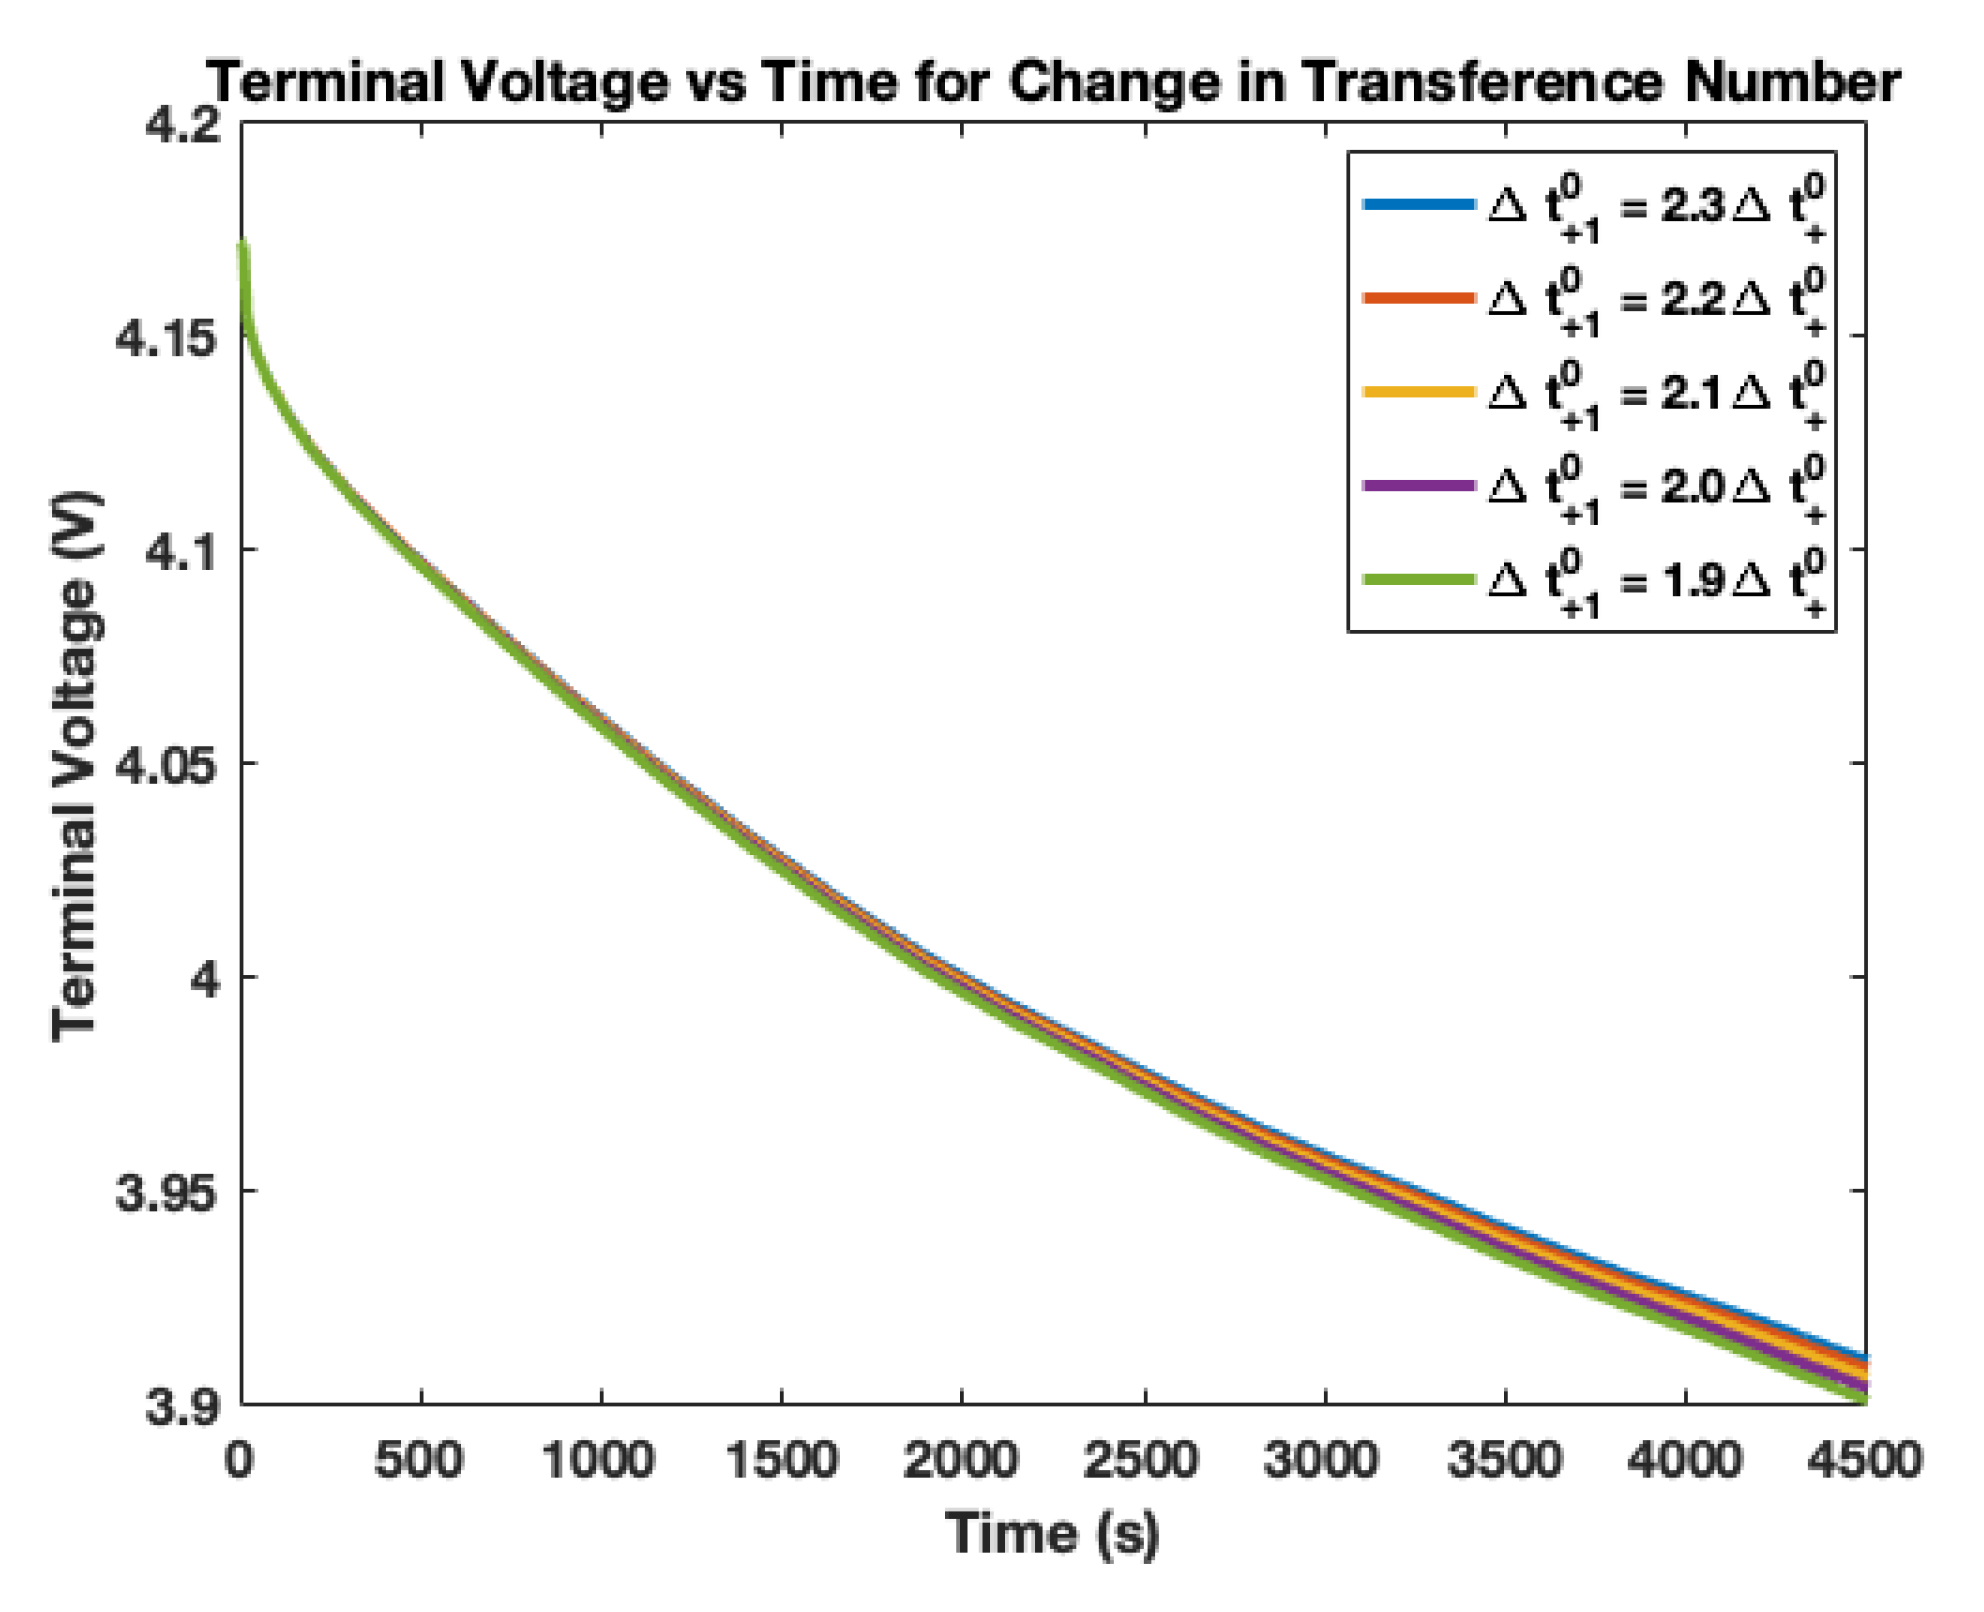
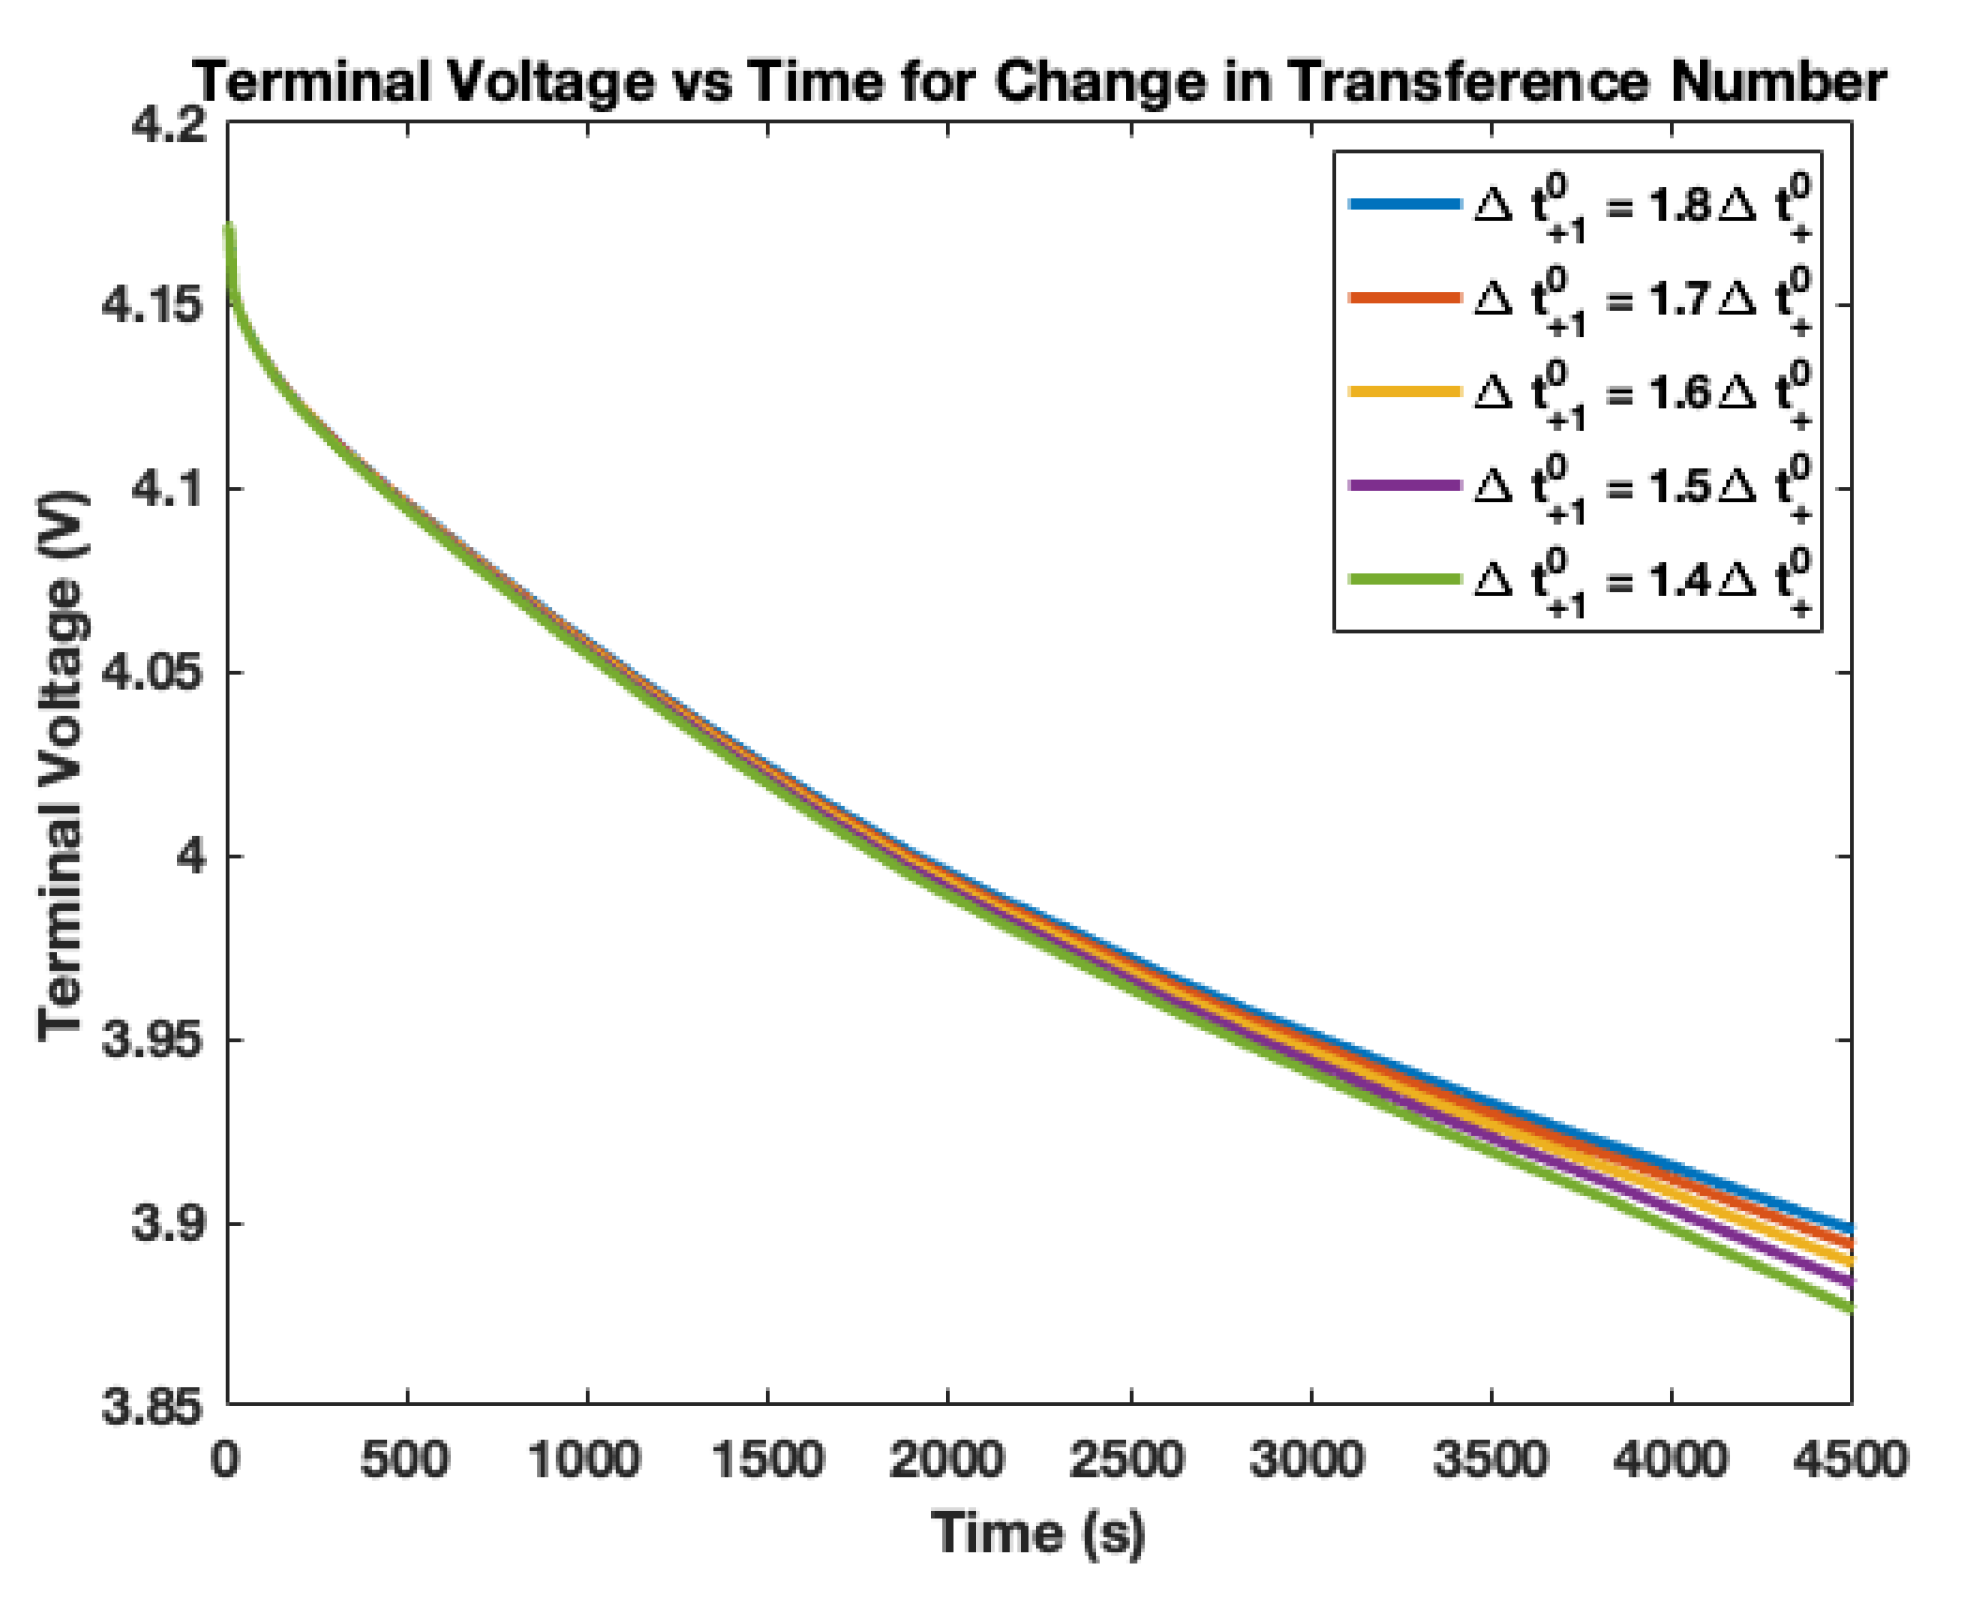
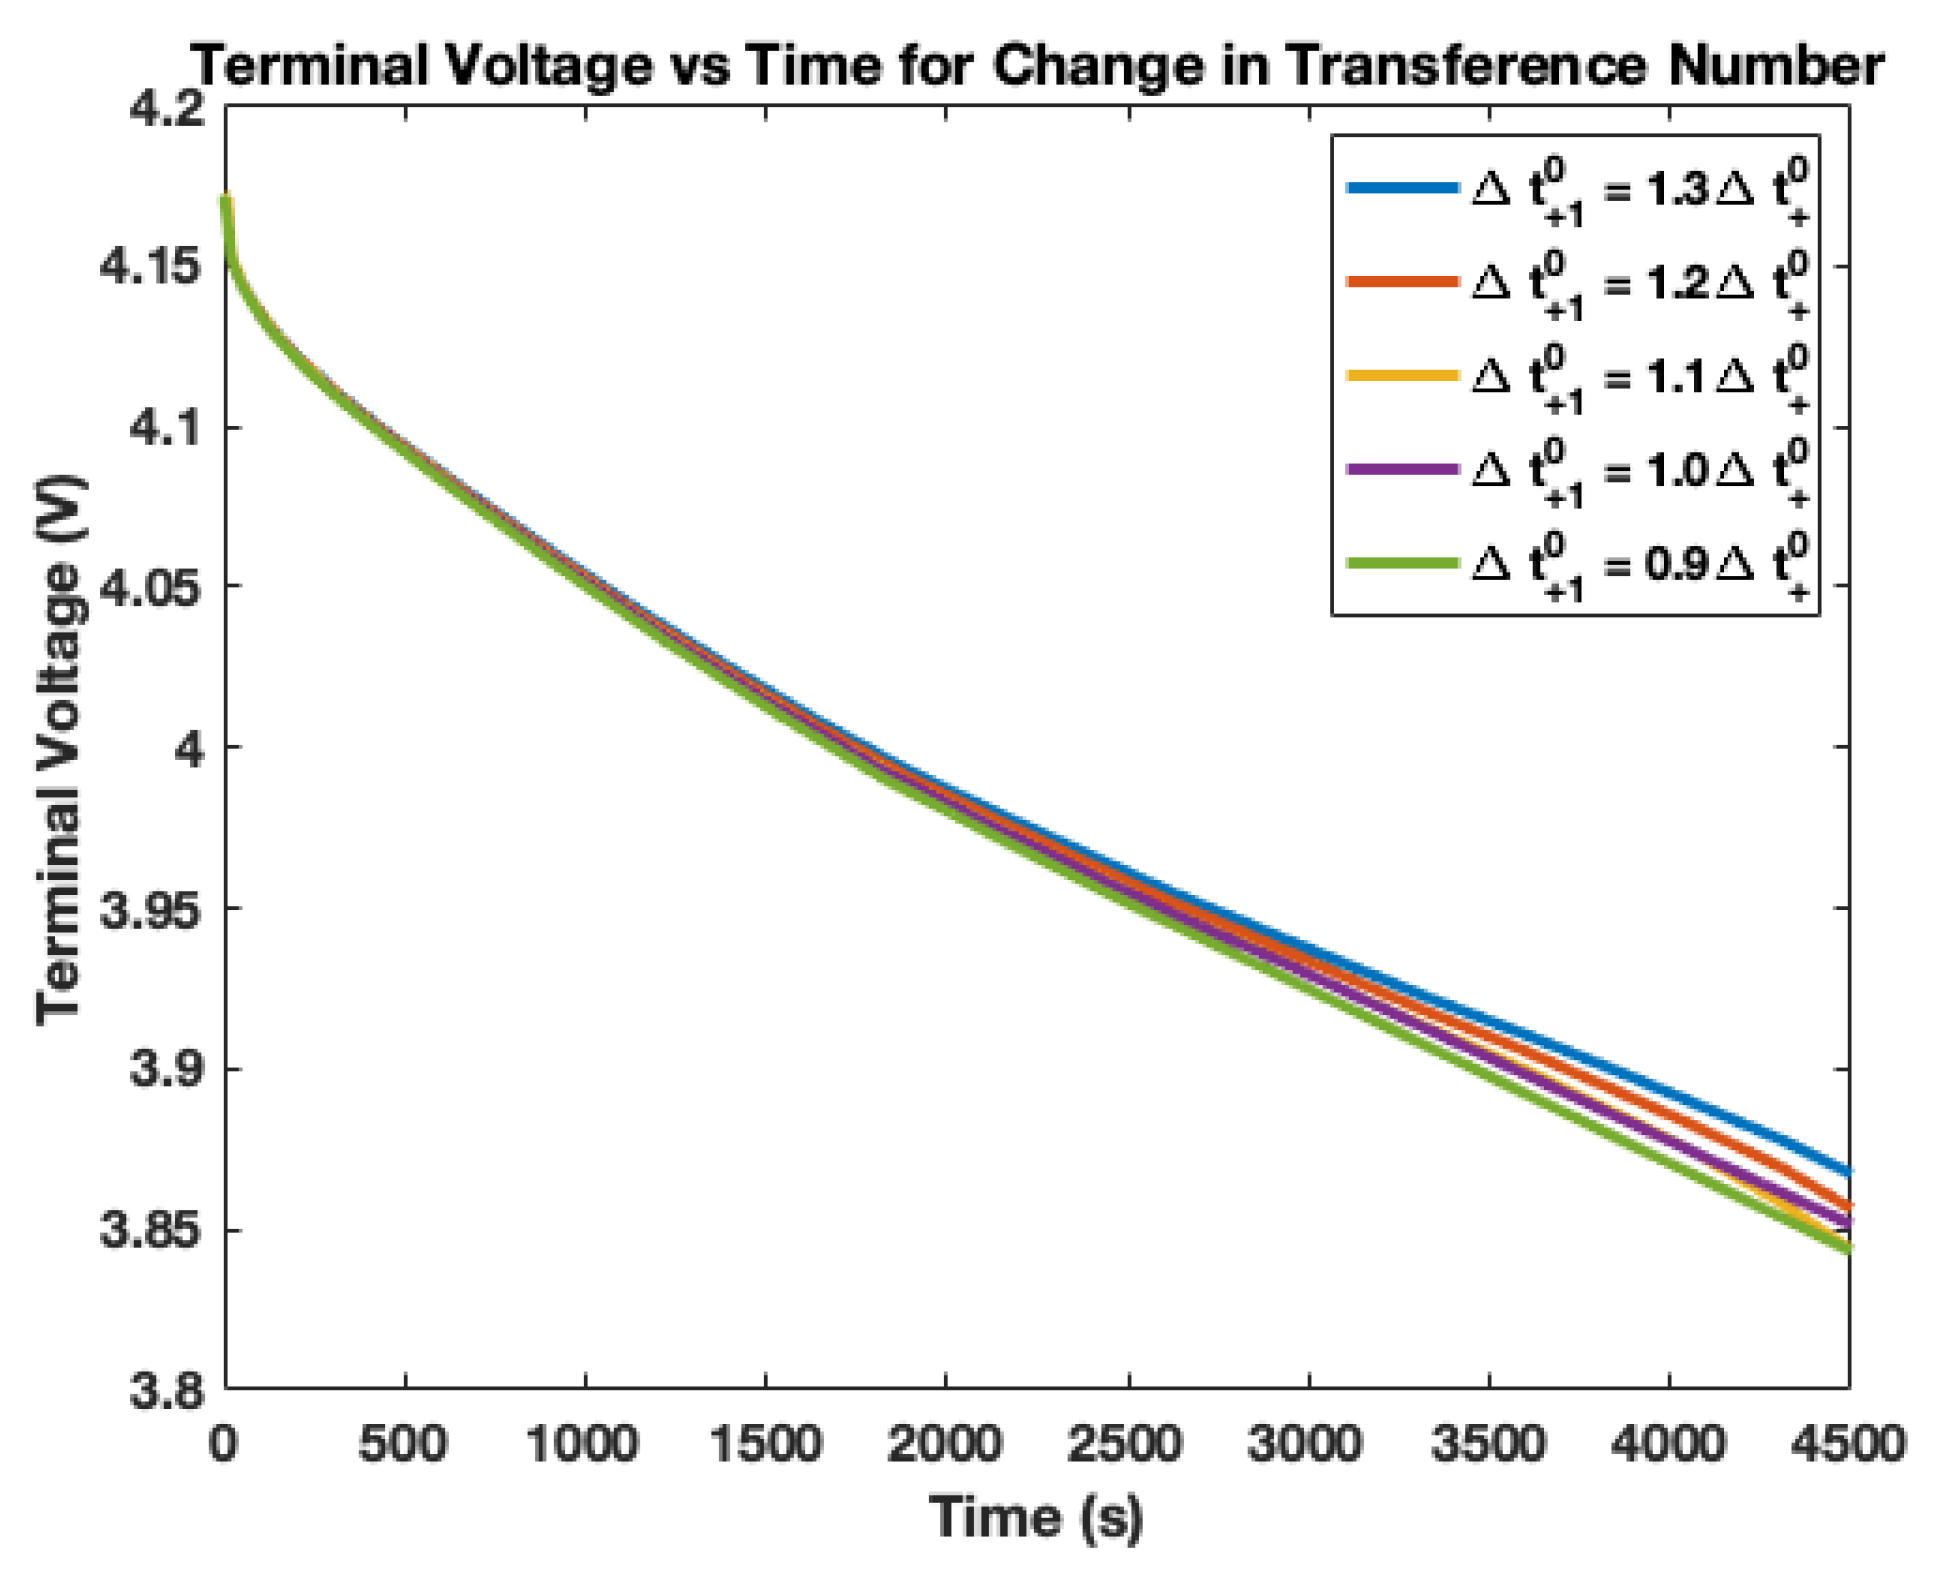
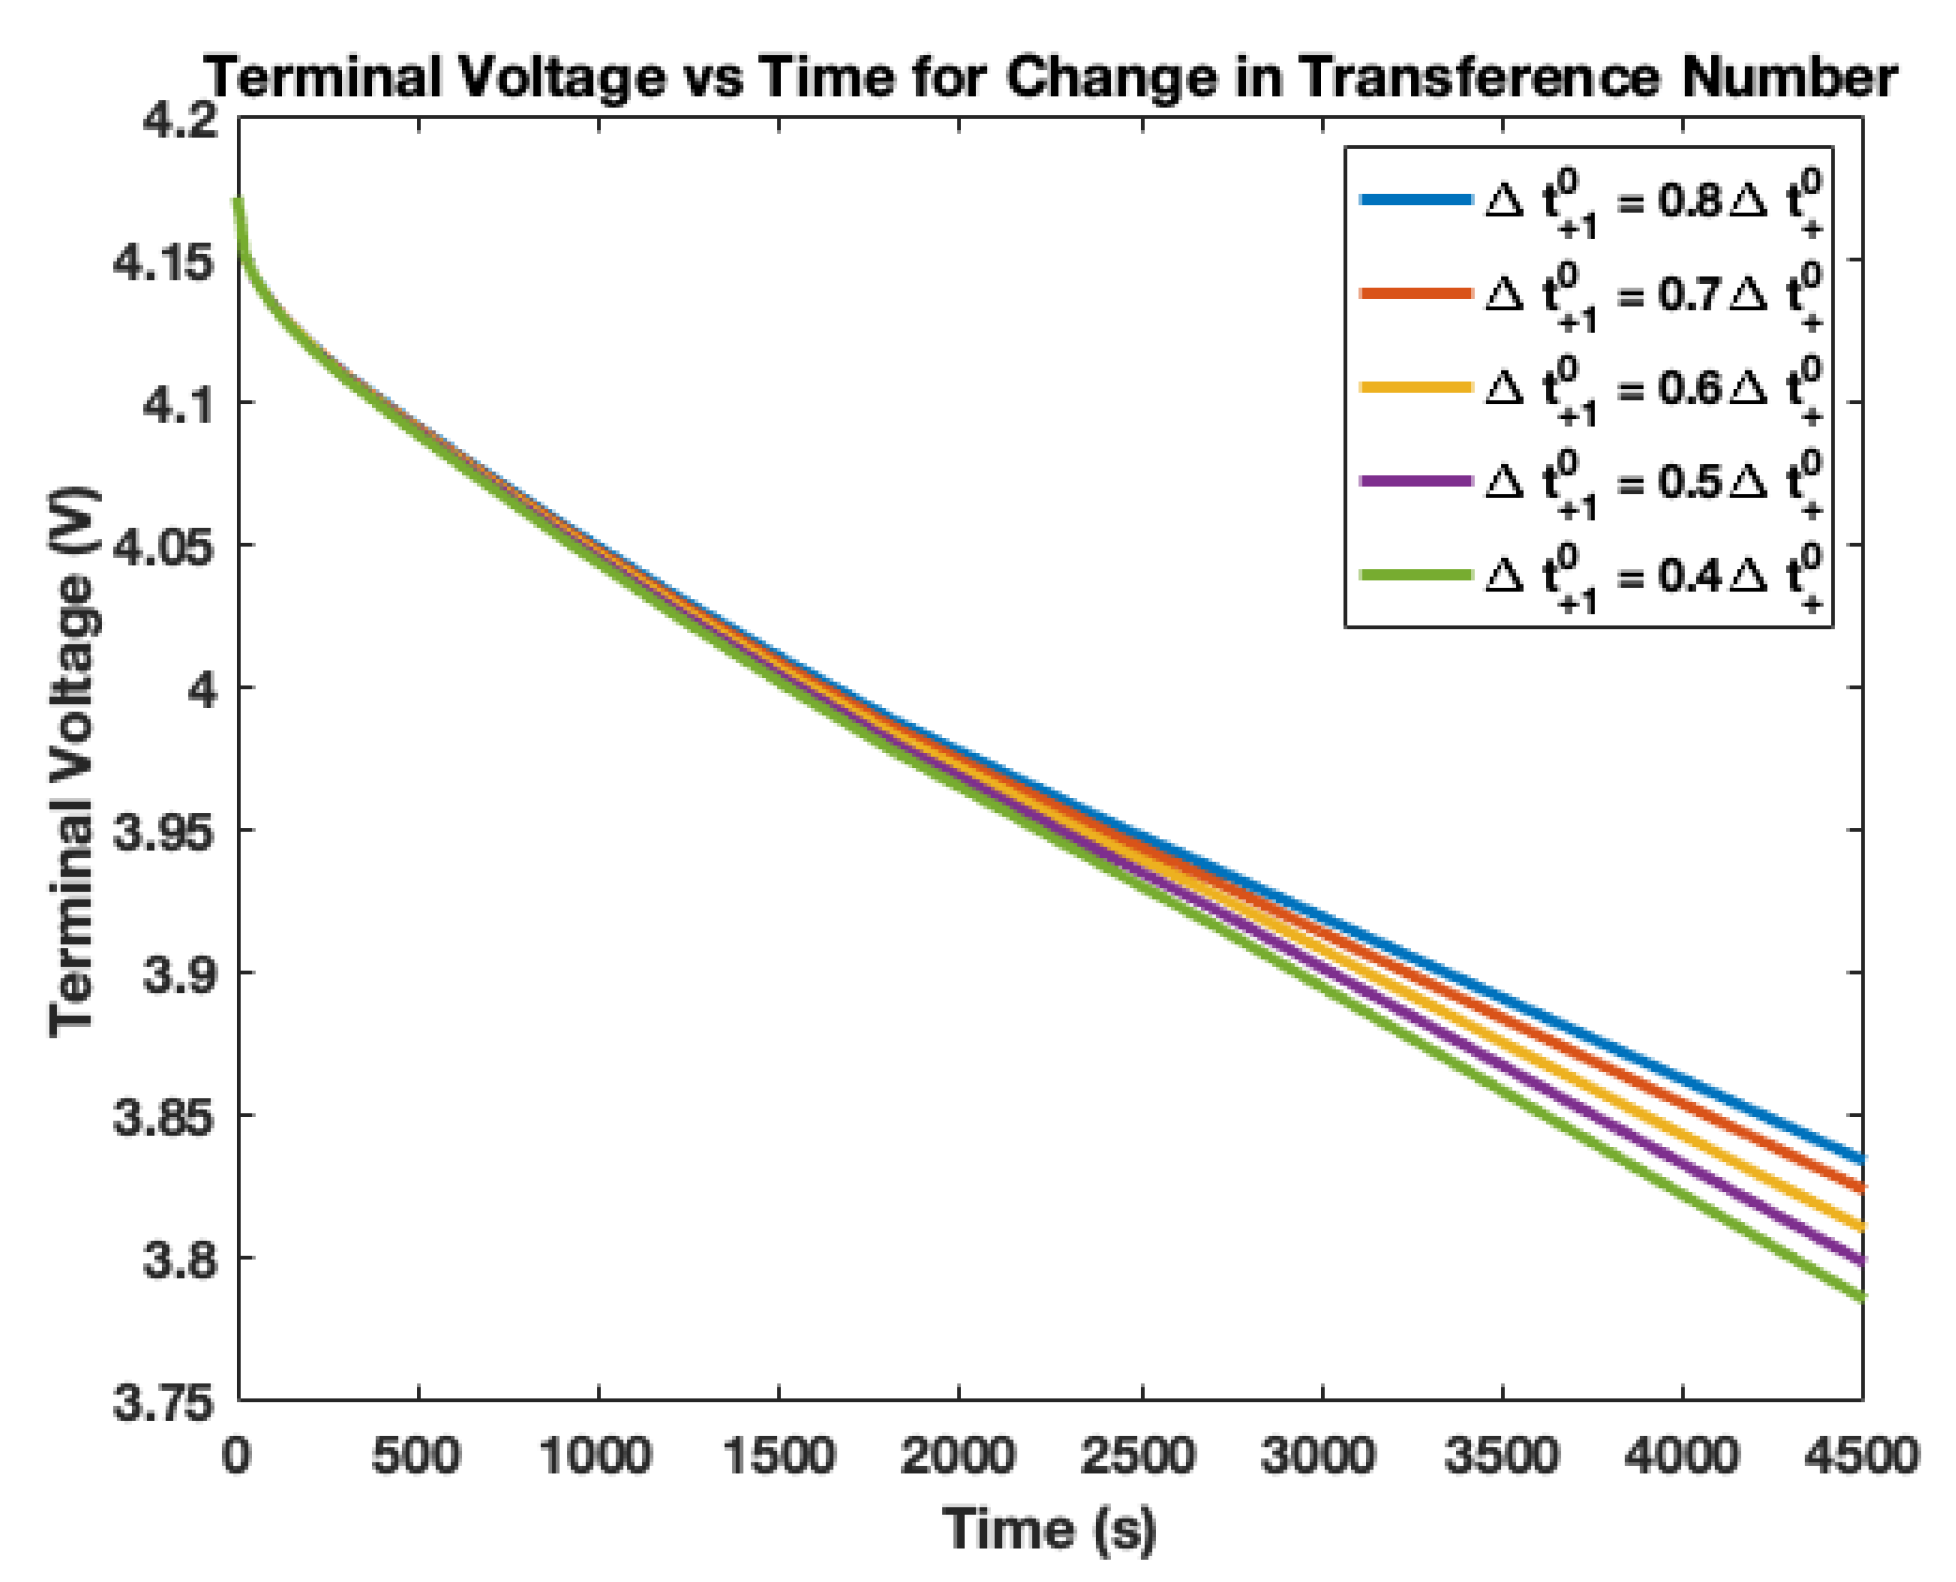
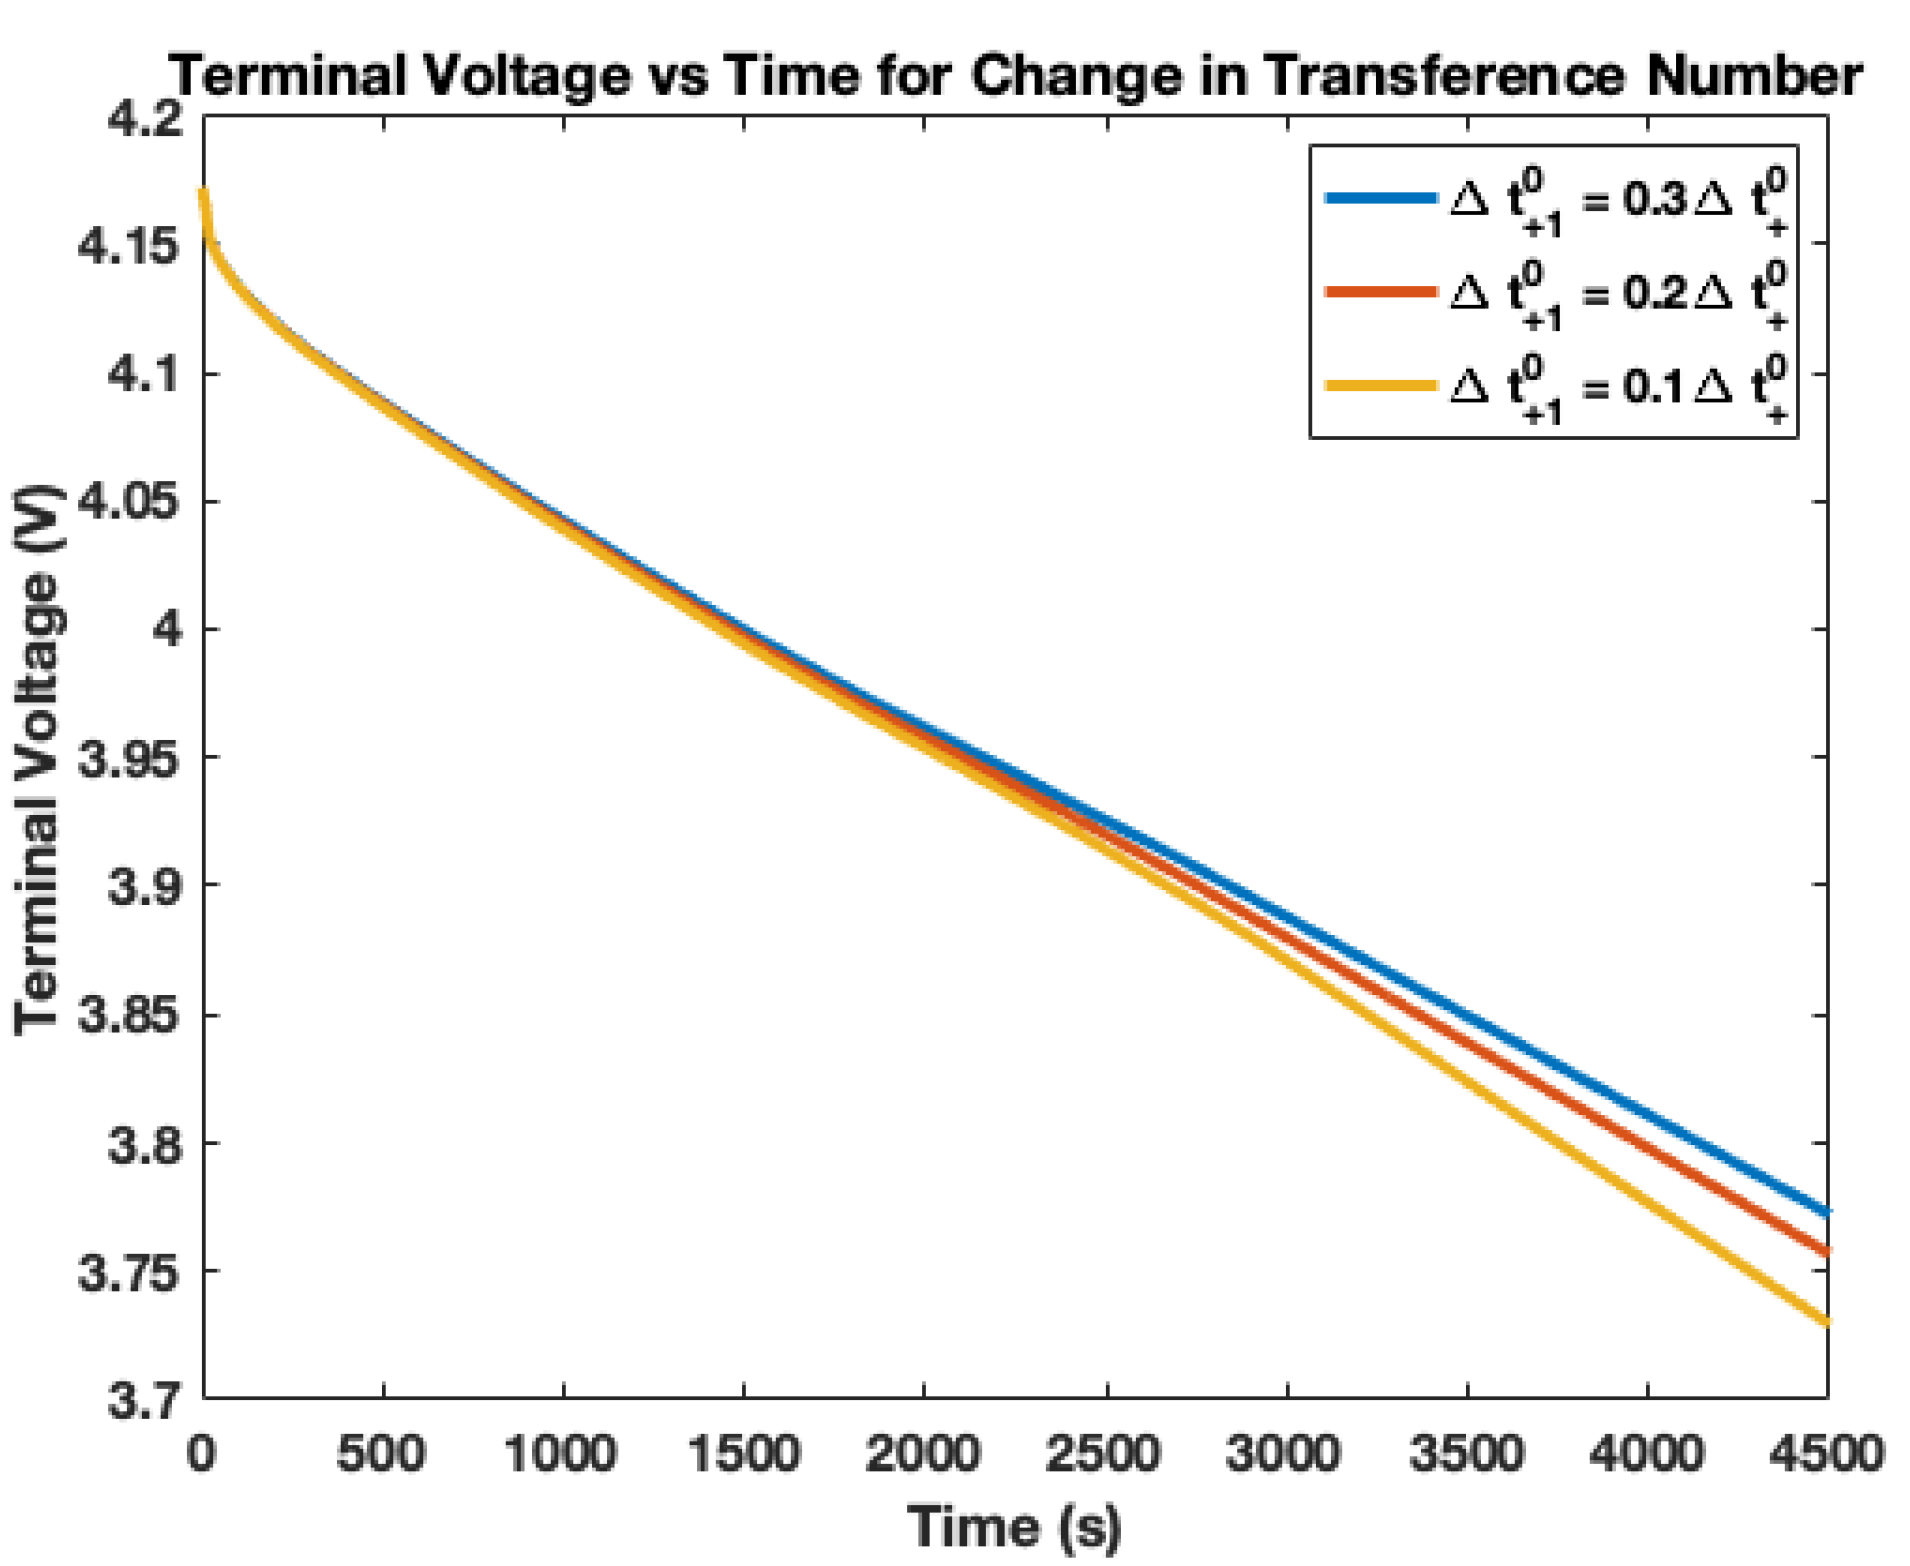
The transference number varies from 0.04 to 1.12. Figure 7, Figure 8, Figure 9, Figure 10, Figure 11 and Figure 12 show the transference number varies from 0.1 to 2.8 because the base transference number is set to 0.4 and is being scaled between 0.04 and 1.12. With a decrease in the transference number, there is an increased impedance to lithium ion flow across the electrolyte. This increase in the resistance causes an increased potential drop across the electrolyte and results in the battery reaching its cut-off voltage sooner. Figure 13 shows the relationship between the change in terminal voltage to the change in transference number vs. the change in the transference number. This figure is consistent with the results obtained from (28).

5. Conclusions and Future Work

There are three major types of side reactions, and they occur at the solid–electrolyte interface, the current collector–electrode interface and in the electrolyte. This article highlights the impact of electrolyte degradation on the performance of the battery and the physical manifestation that this degradation phenomenon has on the terminal voltage of the battery. There are two ways to represent the degradation of the electrolyte—loss of electrolyte salt concentration and change in transference number. The loss of electrolyte concentration increases the resistance to the flow of lithium ions across the electrolyte. The electrolyte loses lithium ions when the battery is subjected to harsh operating conditions such as high temperatures or charging/discharging rates. The lithium ions react with the organic solvents in the electrolyte to form irreversible chemical compounds as shown in Equation (1). The decrease in the transference number of the electrolyte symbolizes the loss of charge-carrying lithium ions or the increase in the electrons that are carrying charge across the electrolyte (i.e., self-discharge). From Equations (18) and (27), it can be seen that the terminal voltage has an exponential decrease for decrease in the concentration of lithium ions in the electrolyte while it follows a quadratic function with the transference number. This implies that the change in the terminal voltage is more sensitive to the decrease in lithium ion concentration in the electrolyte than to the variation in transference number. Depending on the rate of change of the voltage, it is possible to determine the kind of side reaction that is dominant in the electrolyte.
Future work involves performing more sensitivity analysis on the degradation of different physical battery components and determining the sensitivity of the change in terminal voltage and capacity to the change in component degradation.

Author Contributions

Conceptualization: M.-Y.C. and B.B.; Methodology: B.B.; Software: B.B.; Validation: B.B.; Formal Analysis: Bharat Balagpopal; Investigation: B.B.; Data Curation: B.B.; Writing Original Draft preparation: B.B.; Writing-review and editing: M.-Y.C.; Visualization: B.B.; Supervision: M.-Y.C.; Project Administration: M.-Y.C.; Funding Acquisition: M.-Y.C. and B.B. All authors have read and agreed to the published version of the manuscript.

Funding

This research was partially supported by National Science Foundation Award Number IIP—1500208.

Conflicts of Interest

The authors declare no conflict of interest.

Appendix A

Table A1. Table of Symbols.
SymbolDefinitionUnits
DDiffusion Coefficientm 2 /s
μ Particle Mobilitym/Vs
VApplied Electromotive ForceV
k B Boltzmann ConstantJ/K
TTemperatureK
ϵ e Electrolyte Phase Volume FractionUnitless
c e Electrolyte Lithium Ion Concentrationmol/m 3
D e e f f Effective Electrolyte Diffusion Coefficientm 2 /s
xVariable to define position
along the length of the batterym
tTimes
t + 0 Positive Ion (Li + ) Transference NumberUnitless
FFaraday’s ConstantC/mol
j L i Volumetric Electrochemical Reaction RateA/m 3
at the Surface of the Electrode
D e Electrolyte Diffusion Coefficientm 2 /s
κ e f f Effective Electrolyte Ionic ConductivityS/m
ϕ e Electrolyte Phase PotentialV
c s , e Lithium Ion Concentration at themol/m 3
Solid—Electrolyte Interface
κ D e f f Effective Diffusion ConductivityS/m
RUniversal Gas ConstantJ/mol K
f ± Electrolyte Activity CoefficientUnitless
ϕ s Solid Phase PotentialV
UThermodynamic Equilibrium PotentialV
η Over PotentialV
V t Terminal VoltageV
IInput CurrentA
R f Current Collector—Electrode Ω
Contact Resistance

References

  1. Zheng, X.; Gao, W.; Zhang, X.; He, M.; Lin, X.; Cao, H.; Zhang, Y.; Sun, Z. Spent lithium-ion battery recycling—Reductive ammonia leaching of metals from cathode scrap by sodium sulphite. Waste Manag. 2017, 60, 680–688. [Google Scholar] [CrossRef] [PubMed]
  2. Gaines, L. Lithium-ion battery recycling processes: Research towards a sustainable course. Sustain. Mater. Technol. 2018, 17, e00068. [Google Scholar] [CrossRef]
  3. Velázquez-Martínez, O.; Valio, J.; Santasalo-Aarnio, A.; Reuter, M.; Serna-Guerrero, R. A critical review of lithium-ion battery recycling processes from a circular economy perspective. Batteries 2019, 5, 68. [Google Scholar] [CrossRef] [Green Version]
  4. Doughty, D.; Roth, E.P. A general discussion of Li Ion battery safety. Electrochem. Soc. Interface 2012, 21, 37–44. [Google Scholar] [CrossRef] [Green Version]
  5. Liu, B.; Jia, Y.; Li, J.; Yin, S.; Yuan, C.; Hu, Z.; Wang, L.; Li, Y.; Xu, J. Safety issues caused by internal short circuits in lithium-ion batteries. J. Mater. Chem. A 2018, 6, 21475–21484. [Google Scholar] [CrossRef]
  6. Wang, Q.; Jiang, L.; Yu, Y.; Sun, J. Progress of enhancing the safety of lithium ion battery from the electrolyte aspect. Nano Energy 2019, 55, 93–114. [Google Scholar] [CrossRef]
  7. Rahimi-Eichi, H.; Chow, M. Adaptive parameter identification and State-of-Charge estimation of lithium-ion batteries. In Proceedings of the IECON 2012—38th Annual Conference of the IEEE Industrial Electronics Society, Montreal, QC, Canada, 25–28 October 2012; pp. 4012–4017. [Google Scholar]
  8. Balagopal, B.; Chow, M.Y. The state of the art approaches to estimate the state of health (SOH) and state of function (SOF) of lithium Ion batteries. In Proceedings of the 2015 IEEE International Conference on Industrial Informatics (INDIN 2015), Cambridge, UK, 22–24 July 2015; pp. 1302–1307. [Google Scholar] [CrossRef]
  9. Balagopal, B.; Chow, M.Y. Effect of anode conductivity degradation on the Thevenin Circuit Model of lithium ion batteries. In Proceedings of the IECON 2016—42nd Annual Conference of the IEEE Industrial Electronics Society, Florence, Italy, 24–27 October 2016; pp. 2028–2033. [Google Scholar] [CrossRef]
  10. Wu, Y. Lithium-ion Batteries: Fundamentals and Applications; CRC Press: Boca Raton, FL, USA, 2015; p. 1. [Google Scholar]
  11. Jow, T.R.; Delp, S.A.; Allen, J.L.; Jones, J.P.; Smart, M.C. Factors Limiting Li + Charge Transfer Kinetics in Li-Ion Batteries. J. Electrochem. Soc. 2018, 165, A361–A367. [Google Scholar] [CrossRef]
  12. Logan, E.R.; Tonita, E.M.; Beaulieu, L.Y.; Ma, X.; Li, J.; Dahn, J.R.; Gering, K.L. A Study of the Physical Properties of Li-Ion Battery Electrolytes Containing Esters. J. Electrochem. Soc. 2018, 165, A21–A30. [Google Scholar] [CrossRef]
  13. Balagopal, B.; Huang, C.S.; Chow, M.Y. Effect of Calendar Aging on Li Ion Battery Degradation and SOH. In Proceedings of the IECON 2017—43rd Annual Conference of the IEEE, Beijing, China, 29 October–1 November 2017; pp. 7647–7652. [Google Scholar]
  14. Guan, P.; Liu, L. Lithium-ion diffusion in solid electrolyte interface (SEI) predicted by phase field model. Mater. Res. Soc. Symp. Proc. 2015, 1753, 31–37. [Google Scholar] [CrossRef]
  15. Lee, J.T.; Nitta, N.; Benson, J.; Magasinski, A.; Fuller, T.F.; Yushin, G. Comparative study of the solid electrolyte interphase on graphite in full Li-ion battery cells using X-ray photoelectron spectroscopy, secondary ion mass spectrometry, and electron microscopy. Carbon 2013, 52, 388–397. [Google Scholar] [CrossRef]
  16. Laresgoiti, I.; Kabitz, S.; Ecker, M.; Sauer, D.U. Modeling mechanical degradation in lithium ion batteries during cycling: Solid electrolyte interphase fracture. J. Power Sources 2015, 300, 112–122. [Google Scholar] [CrossRef]
  17. Gao, Y.; Jiang, J.; Zhang, C.; Zhang, W.; Ma, Z.; Jiang, Y. Lithium-ion battery aging mechanisms and life model under different charging stresses. J. Power Sources 2017, 356, 103–114. [Google Scholar] [CrossRef]
  18. Cannarella, J.; Arnold, C.B. Stress evolution and capacity fade in constrained lithium-ion pouch cells. J. Power Sources 2014, 245, 745–751. [Google Scholar] [CrossRef]
  19. Cannarella, J.; Arnold, C.B. State of health and charge measurements in lithium-ion batteries using mechanical stress. J. Power Sources 2014, 269, 7–14. [Google Scholar] [CrossRef]
  20. Pinson, M.B.; Bazant, M.Z. Theory of SEI Formation in Rechargeable Batteries: Capacity Fade, Accelerated Aging and Lifetime Prediction. J. Electrochem. Soc. 2012, 160, A243–A250. [Google Scholar] [CrossRef]
  21. Lawder, M.T.; Northrop, P.W.C.; Subramanian, V.R. Model-Based SEI Layer Growth and Capacity Fade Analysis for EV and PHEV Batteries and Drive Cycles. J. Electrochem. Soc. 2014, 161, A2099–A2108. [Google Scholar] [CrossRef] [Green Version]
  22. Williard, N.; He, W.; Osterman, M.; Pecht, M. Reliability and failure analysis of Lithium Ion batteries for electronic systems. In Proceedings of the 2012 13th International Conference on Electronic Packaging Technology & High Density Packaging, Guilin, China, 13–16 August 2012; pp. 1051–1055. [Google Scholar] [CrossRef]
  23. Valo̸en, L.O.; Reimers, J.N. Transport Properties of LiPF6-Based Li-Ion Battery Electrolytes. J. Electrochem. Soc. 2005, 152, A882. [Google Scholar] [CrossRef]
  24. Balagopal, B.; Huang, C.S.; Chow, M.Y. Effect of Calendar Ageing on SEI growth and its Impact on Electrical Circuit Model Parameters in Lithium Ion Batteries. In Proceedings of the IEEE International Conference on Industrial Electronics for Sustainable Energy Systems, Hamilton, New Zealand, 31 January–2 February 2018. [Google Scholar]
  25. Hayamizu, K. Direct relations between ion diffusion constants and ionic conductivity for lithium electrolyte solutions. Electrochim. Acta 2017, 254, 101–111. [Google Scholar] [CrossRef]
  26. Chintapalli, M.; Timachova, K.; Olson, K.R.; Mecham, S.J.; Devaux, D.; Desimone, J.M.; Balsara, N.P. Relationship between Conductivity, Ion Diffusion, and Transference Number in Perfluoropolyether Electrolytes. Macromolecules 2016, 49, 3508–3515. [Google Scholar] [CrossRef] [Green Version]
  27. Diederichsen, K.M.; McShane, E.J.; McCloskey, B.D. Promising Routes to a High Li+ Transference Number Electrolyte for Lithium Ion Batteries. ACS Energy Lett. 2017, 2, 2563–2575. [Google Scholar] [CrossRef]
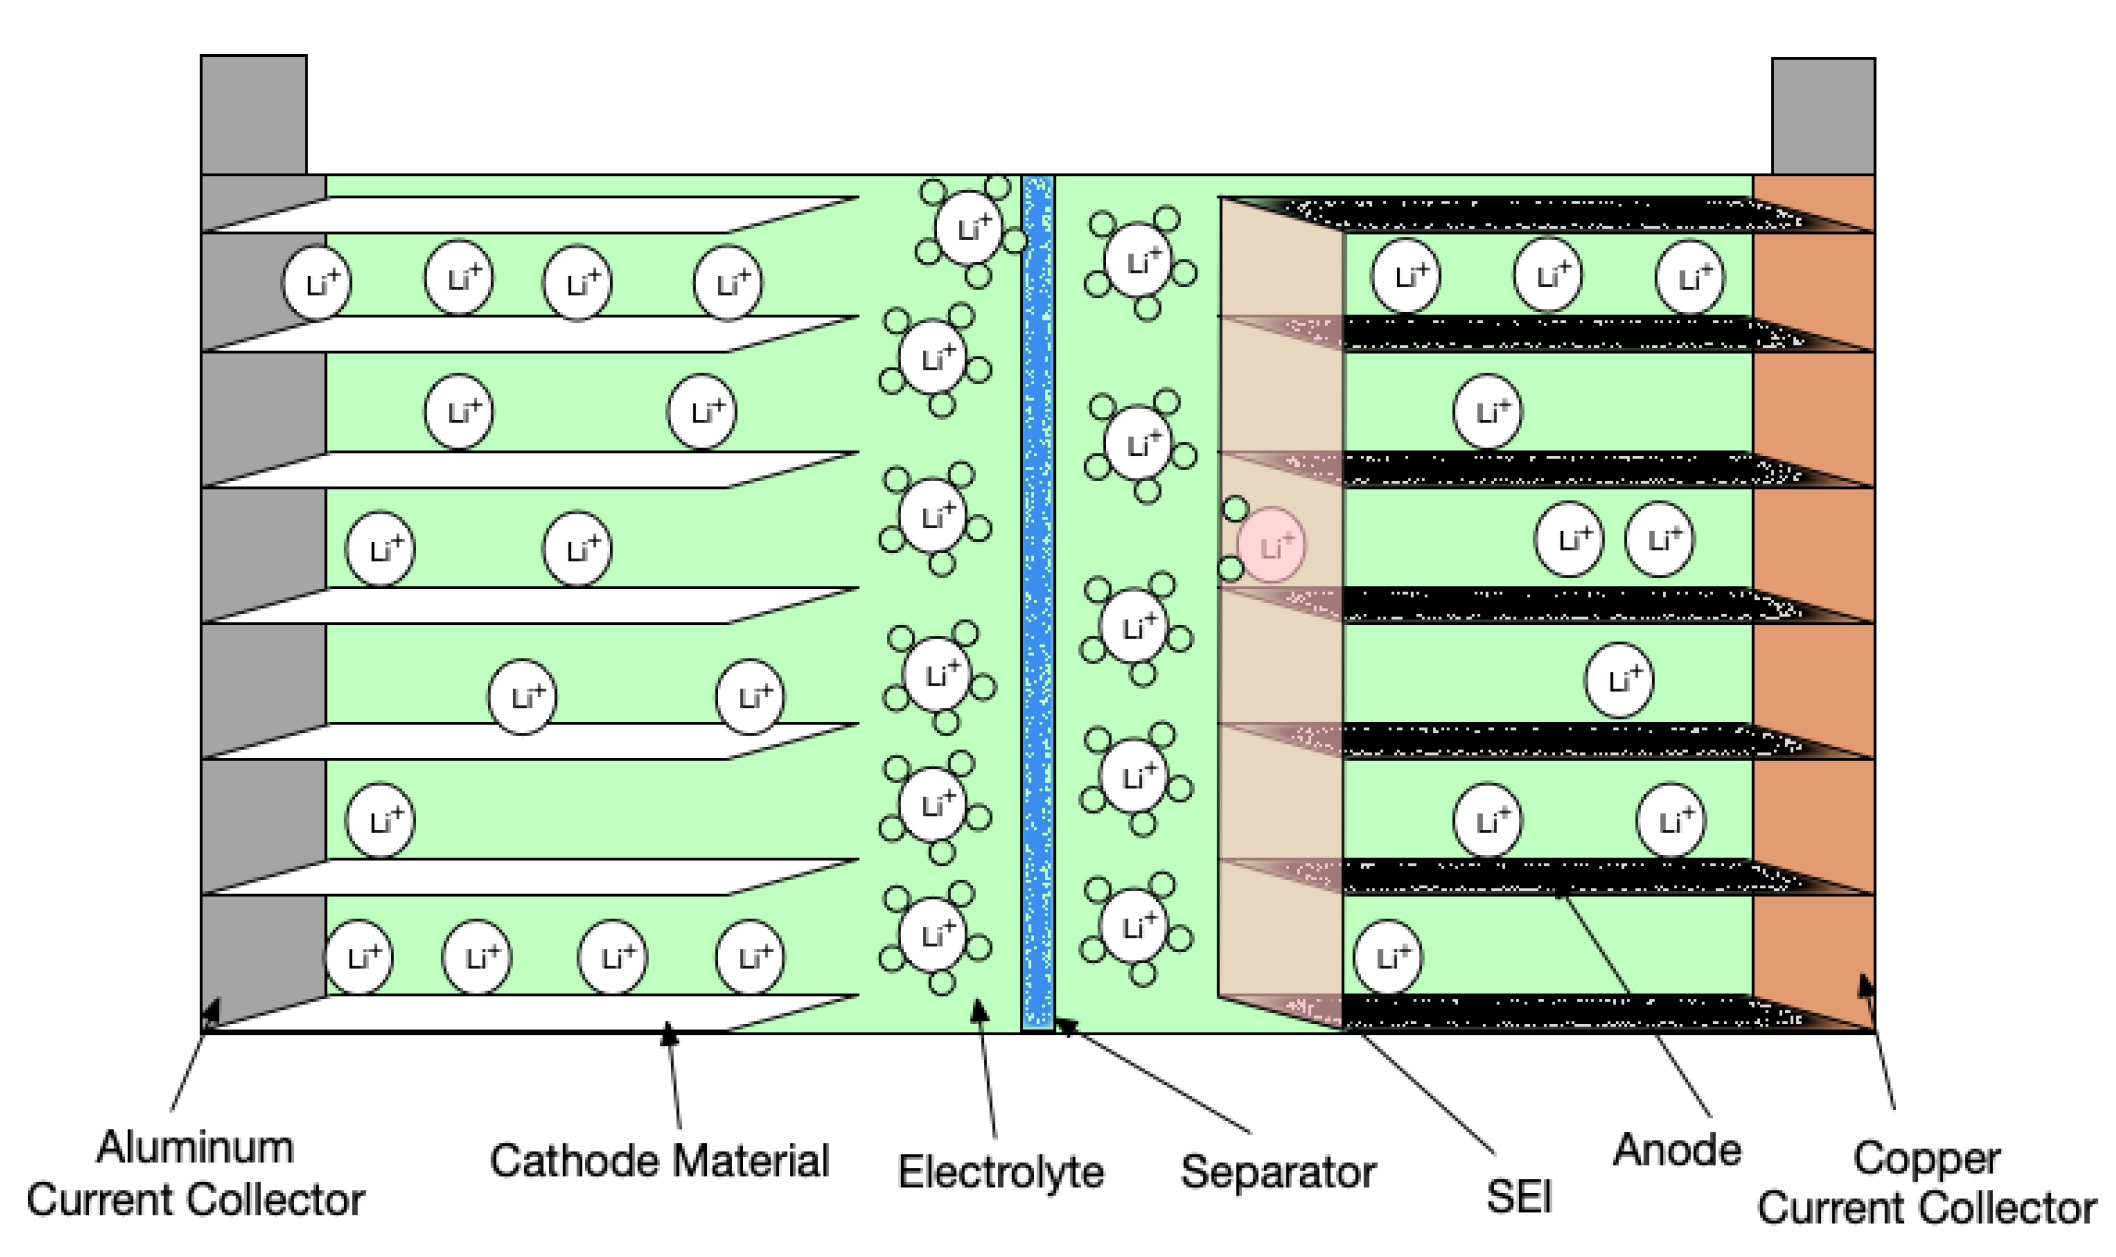
Figure 1. Structure of the battery with manufacturer designed SEI.
Batteries 06 00053 g001
Figure 2. 4DM used to simulate electrolyte degradation.
Batteries 06 00053 g002
Figure 3. Terminal voltage vs. time for change in electrolyte salt diffusion coefficient from 1.0 to 0.8.
Batteries 06 00053 g003
Figure 4. Terminal voltage vs. time for change in electrolyte salt diffusion coefficient from 0.7 to 0.5.
Batteries 06 00053 g004
Figure 5. Terminal voltage vs. time for change in electrolyte salt diffusion coefficient from 0.4 to 0.1.
Batteries 06 00053 g005
Figure 6. Change of terminal voltage to transference number vs. electrolyte salt diffusion coefficient.
Batteries 06 00053 g006
Figure 7. Terminal voltage vs. time for change in transference number from 2.8 to 2.4.
Batteries 06 00053 g007
Figure 8. Terminal voltage vs. time for change in transference number from 2.3 to 1.9.
Batteries 06 00053 g008
Figure 9. Terminal voltage vs. time for change in transference number from 1.8 to 1.4.
Batteries 06 00053 g009
Figure 10. Terminal voltage vs. time for change in transference number from 1.3 to 0.9.
Batteries 06 00053 g010
Figure 11. Terminal voltage vs. time for change in transference number from 0.8 to 0.4.
Batteries 06 00053 g011
Figure 12. Terminal voltage vs. time for change in transference number from 0.3 to 0.1.
Batteries 06 00053 g012
Figure 13. Change of terminal voltage to transference number vs. transference number.
Batteries 06 00053 g013
Publisher’s Note: MDPI stays neutral with regard to jurisdictional claims in published maps and institutional affiliations.