Article

Effects of State-of-Charge and Penetration Location on Variations in Temperature and Terminal Voltage of a Lithium-Ion Battery Cell during Penetration Tests

College of Engineering, Wayne State University, Detroit, MI 48202, USA
*
Author to whom correspondence should be addressed.
Batteries 2021, 7(4), 81; https://doi.org/10.3390/batteries7040081
Submission received: 13 September 2021 / Revised: 26 November 2021 / Accepted: 29 November 2021 / Published: 1 December 2021

Abstract

:
The nail penetration test has been widely adopted as a battery safety test for reproducing internal short-circuits. In this paper, the effects of cell initial State-of-Charge (SOC) and penetration location on variations in cell temperature and terminal voltage during penetration tests are investigated. Three different initial SOCs (10%, 50%, and 90%) and three different penetration locations (one is at the center of the cell, the other two are close to the edge of the cell) are used in the tests. Once the steel cone starts to penetrate the cell, the cell terminal voltage starts to drop due to the internal short-circuit. The penetration tests with higher initial cell SOCs have larger cell surface temperature increases during the tests. Also, the penetration location always has the highest temperature increment during all penetration tests, which means the heat source is always at the penetration location. The absolute temperature increment at the penetration location is always higher when the penetration is close to the edge of the cell, compared to when the penetration is at the center of the cell. The heat generated at the edges of the cell is more difficult to dissipate. Additionally, a battery cell internal short-circuit model with different penetration locations is built in ANSYS Fluent, based on the specifications and experimental data of the tested battery cells. The model is validated with an acceptable discrepancy range by using the experimental data. Simulated data shows that the temperature gradually reduces from penetration locations to their surroundings. The gradients of the temperature distributions are much larger closer to the penetration locations. Overall, this paper provides detailed information on the temperature and terminal voltage variations of a lithium-ion polymer battery cell with large capacity and high power under penetration tests. The presented information can be used for assessing the safety of the onboard battery pack of electric vehicles.

1. Introduction

Lithium-ion batteries have been widely used in many applications, ranging from consumer electronics such as cell phones and laptops, to transportation such as electric vehicles. Although featuring many advantages such as high specific energy, high energy density, low self-discharge rate, and minimal memory effect, lithium-ion batteries still have safety issues, such as catching fire or explosion [1,2]. To assess the risk of battery failure, abusive tests such as overcharging [3,4], external heating [5,6], dynamic impact [7,8], and short-circuiting are usually performed. Short-circuits can cause a temperature rise of several hundred degrees Celsius in a few seconds and even trigger thermal runaway [9]. Based on location, short-circuits can be classified into external short-circuits and internal short-circuits. External short-circuits can usually be well controlled by assembling fuses. On the other hand, internal short-circuits are very difficult to control and hence are more dangerous [10].
The nail penetration test has been widely adopted as a battery safety test for reproducing internal short-circuit [9,10,11,12,13,14]. In this test, the nail which penetrates the battery causes failures of the internal electrodes or the separator, which creates a current path within the battery. A large amount of heat is generated in this current path due to internal resistance. Depending on the heat generation rate, the battery cell can either go into thermal runaway or stay in safe condition during the nail penetration process. The solid electrolyte interface can decompose at about 120 degrees Celsius, which is the beginning of the thermal runaway. Then, the intercalated lithium reacts with the electrolyte, which causes the electrolyte to decompose at a temperature higher than 200 degrees Celsius. When the temperature increases to about 240 degrees Celsius, intercalated lithium starts to react with the binder. Finally, the positive active material decomposes when the temperature goes higher than 250 degrees Celsius [15,16,17,18]. Hazardous gases, such as carbon monoxide and hydrogen fluoride, may be released from the battery cell during the above reactions [19,20].
There is much literature available about the nail penetration tests on lithium-ion batteries with different battery chemistries and capacities. Yokoshima et al. [11,12] conducted nail penetration tests on lithium-ion battery cells with 20 mAh, 60 mAh, 420 mAh, and 800 mAh capacities. An X-ray inspection system was used to visualize the change of the internal structures as well as the gas generation inside the battery cells during the nail penetration tests. Also, the relationship between the number of penetrated electrode layers and the variations in the terminal voltage and cell temperature were presented. Zhao et al. [10] performed both external short-circuit and internal short-circuit (nail penetration) tests on battery cells with 650 mAh, 1.2 Ah, and 5 Ah capacities. They also performed additional nail penetration tests on battery packs with 3 Ah and 8 Ah capacities. An electrochemical-thermal battery model with an additional heat source from the penetrating nail is also developed. This battery model can estimate the battery temperature variation during the short-circuit process and predict the occurrence and beginning time of the thermal runaway. Diekmann et al. [13] proposed standard experimental setups and experimental procedures for the nail penetration tests to produce results with reproducibility at low standard deviation. They performed multiple nail penetration tests on the lithium-ion battery cells with 5 Ah capacity with different battery thermal insulation materials, nail materials, nail-penetrating velocities, and penetration depths. They discovered that using nails with conductive materials with low nail-penetrating velocities generates more reproducible experimental results. Yamanaka et al. [14] proposed a numerical model to simulate the nail penetration test on lithium-ion batteries. “Combustion volume” was defined within the model to quantify the combustion risk. The model was validated by the nail penetration tests on the lithium-ion battery cells with 10.2 Ah capacity. They found that the nail-penetrating velocity was more closely correlated with combustion risk than location of nail penetration. Feng et al. [9] built a battery pack that contained six battery modules. Each module had two parallel-connected 12.5 Ah battery cells. The first battery module in the battery pack was penetrated with the nail, to trigger the thermal runaway propagation across the entire battery pack. The voltage and temperature of each battery module were recorded. The heat transfer path during the thermal runaway propagation was analyzed.
Most available literature on the battery nail penetration tests use battery cells with capacities smaller than 5 Ah for testing, such as [10,11,12,13]. Very few available literatures use battery cells with capacities larger than 10 Ah, such as [9,14]. Using battery cells with small capacities for the nail penetration tests can reduce the combustion risk of the testing battery cell and lower the cost of the experiment. However, most battery cells with small capacities are not for transportation applications in which the battery cells are more vulnerable to penetration damage. Also, most available literatures use long nails with 3–5 mm diameters to conduct the penetration tests, such as [10,11,12,13,14]. Very few literatures use different objects to penetrate the battery cell. In this paper, commercial lithium-ion polymer battery cells with 20 Ah capacity are used for the penetration tests. These battery cells are specifically designed for plug-in hybrid electric vehicles (PHEVs) and electric vehicles (EVs). Also, a sharp steel cone instead of a nail is used to penetrate the battery cell. This paper aims to present more realistic penetration test results for battery cells used in the PHEVs and EVs. The effects of cell initial state-of-charge (SOC) and penetration location on cell temperature and terminal voltage variations during penetration tests are investigated in this paper.

2. Battery Cell Penetration Experiments

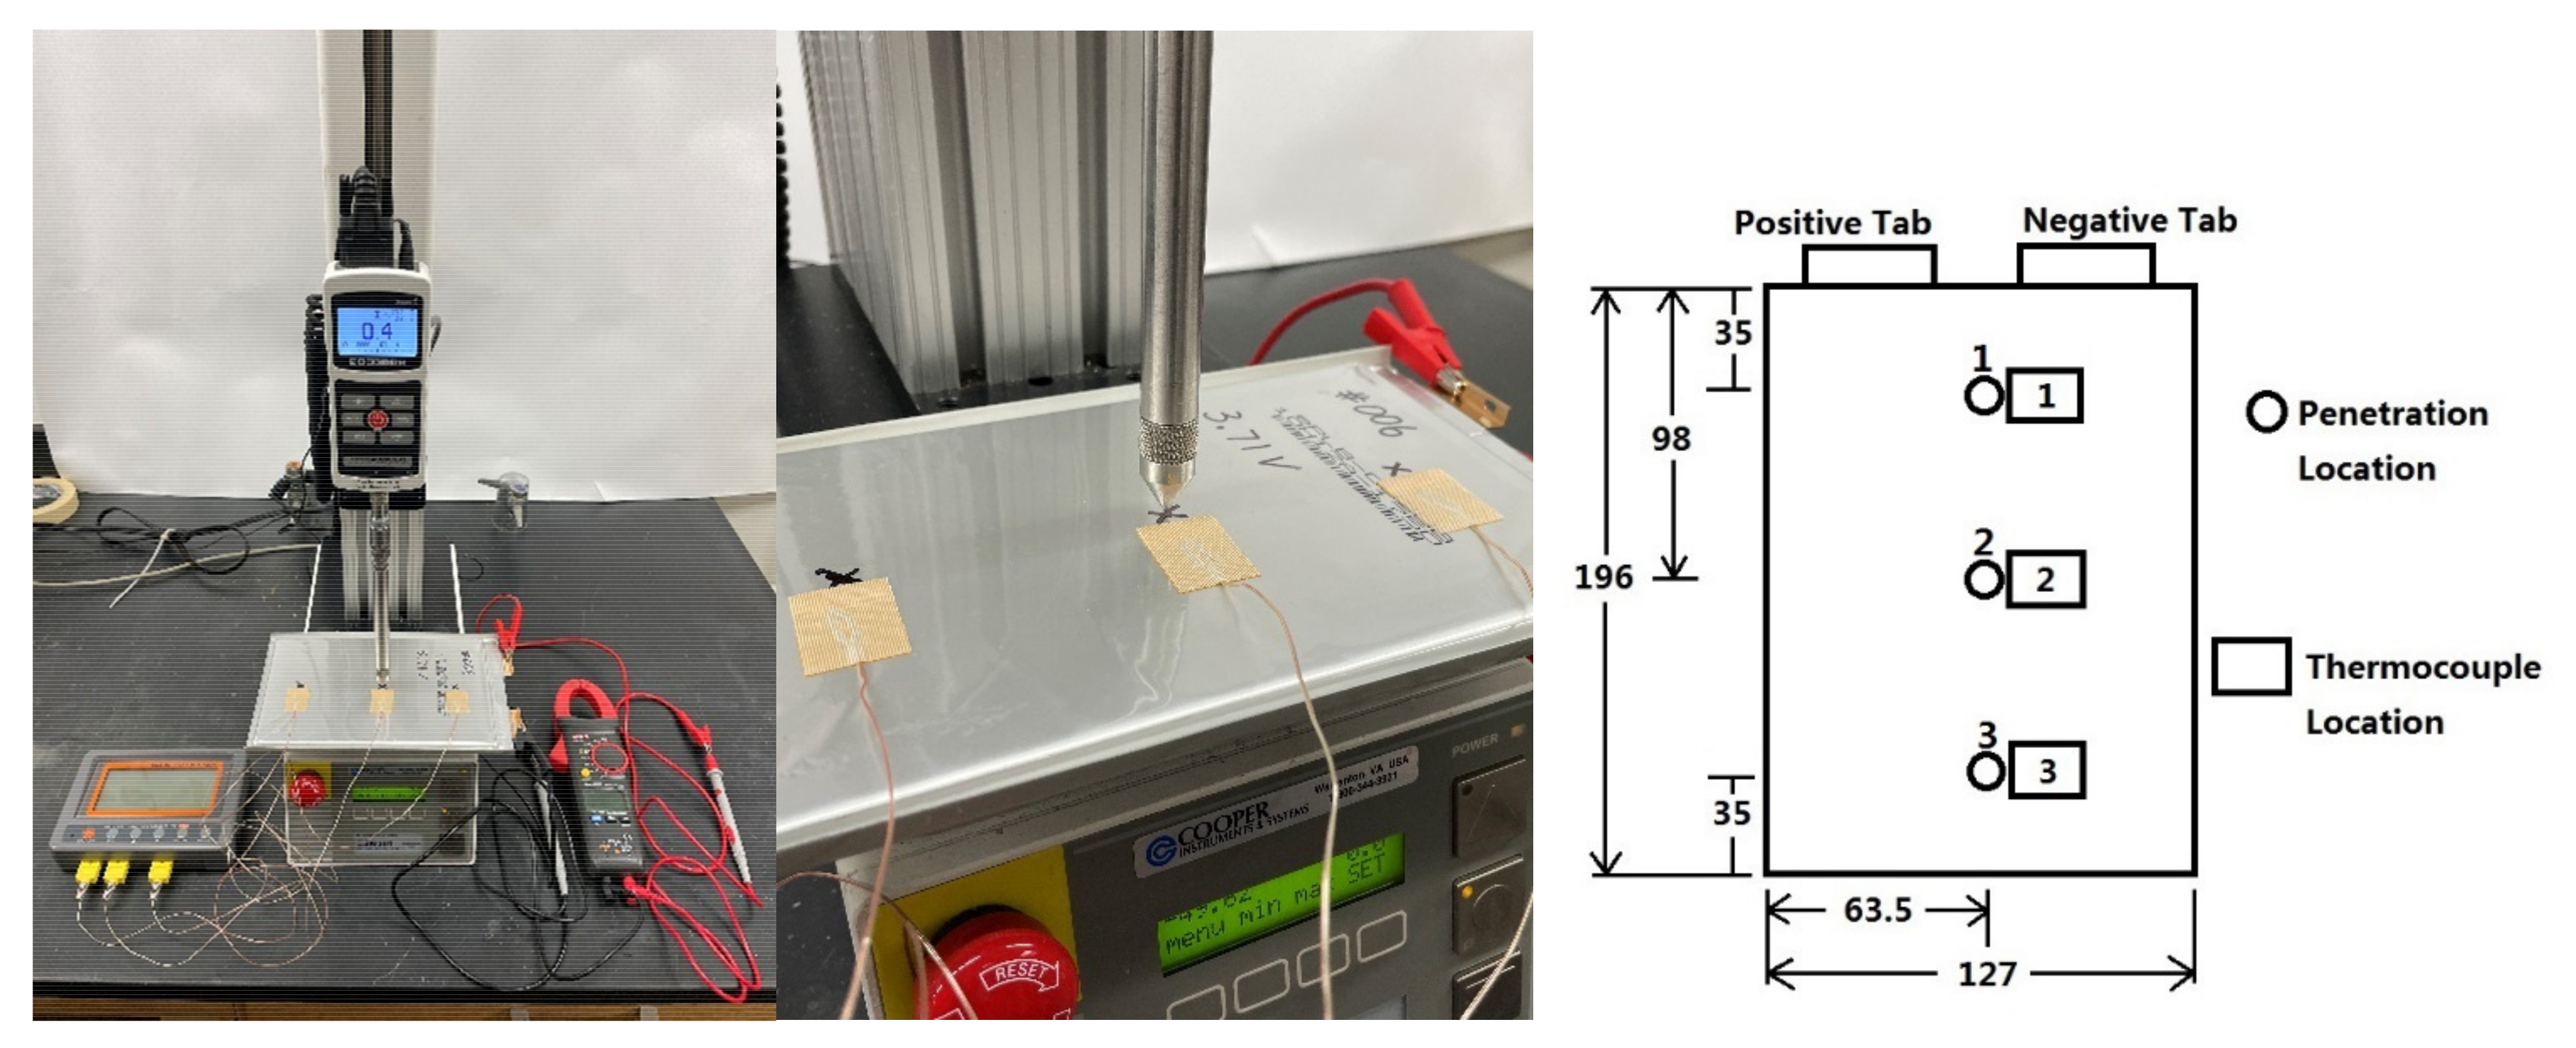
2.1. Experimental Preparation and Setup

The battery cells used in this paper for penetration tests are lithium-ion polymer battery cells with a 3.65 V nominal voltage and a 20 Ah nominal capacity. These battery cells are manufactured by the Energy Innovation Group (EiG) with the model number ePLB-C020. Each cell has a Li[NiCoMn]O2-based cathode and a graphite-based anode. Detailed specifications of the battery cell are summarized in Table 1. Nine battery cells are used for the penetration tests in this paper. Before the penetration tests, each battery cell is discharged by the Digatron charge/discharge unit (cycler) using 1C-rate (20 A) discharging current. Once the discharging voltage reaches the 2.5 V lower voltage limit, the cycler keeps the discharging voltage at 2.5 V by gradually reducing the discharging current. The discharging process stops when the discharging current reduces to 2 A, which marks the point that the cell is fully discharged. Then, these cells are charged by the cycler using 1C-rate current. The charging steps stop after 360 s for three cells, to make the SOC of these three cells 10%. The charging steps stop after 1800 s for another three cells, to make the SOC of these three cells 50%. Additionally, the charging steps stop after 3240 s for the remaining three cells, to make the SOC of these three cells 90%. The experimental setup and the three penetration locations used in the penetration tests are shown in Figure 1. The motorized test stand used is Mark-10 ESM 301. The diameter of the base of the penetrating cone is 12 mm and the apex angle of the cone is 60 degrees. During all experiments, the penetration depth is the thickness of the cell, which is 7 mm. The penetrating velocity of the cone is 28 mm/min, which means it takes 15 s to finish the penetration process. At the beginning of each experiment, the tip of the cone is touching the cell. After 15 s, the tip of the cone penetrates through the cell and reaches the other side of the cell. Then the penetrating cone is stopped and stays at the same position until the end of each experiment. Three different initial cell SOCs (10%, 50%, and 90%) and three different penetration locations (Locations 1, 2, and 3 in Figure 1) are used in the tests, so there are nine testing cases in total. They are named as Cases 1–9, as shown in Table 2. During each penetration test, the variations of the cell surface temperatures at three thermocouple locations, shown in Figure 1, are measured by three surface thermocouples. Also, the variations of the cell terminal voltage during the penetration tests are measured by a multimeter. The resolutions of the measurements of the cell surface temperature and cell terminal voltage are 0.01 degree Celsius and 0.001 V, respectively. The temperature and voltage measurements are started once the cone starts penetrating, and the measurements are stopped once the cell terminal voltage drops to 0.1 V. The cell surface temperature and terminal voltage data are recorded every 30 s.

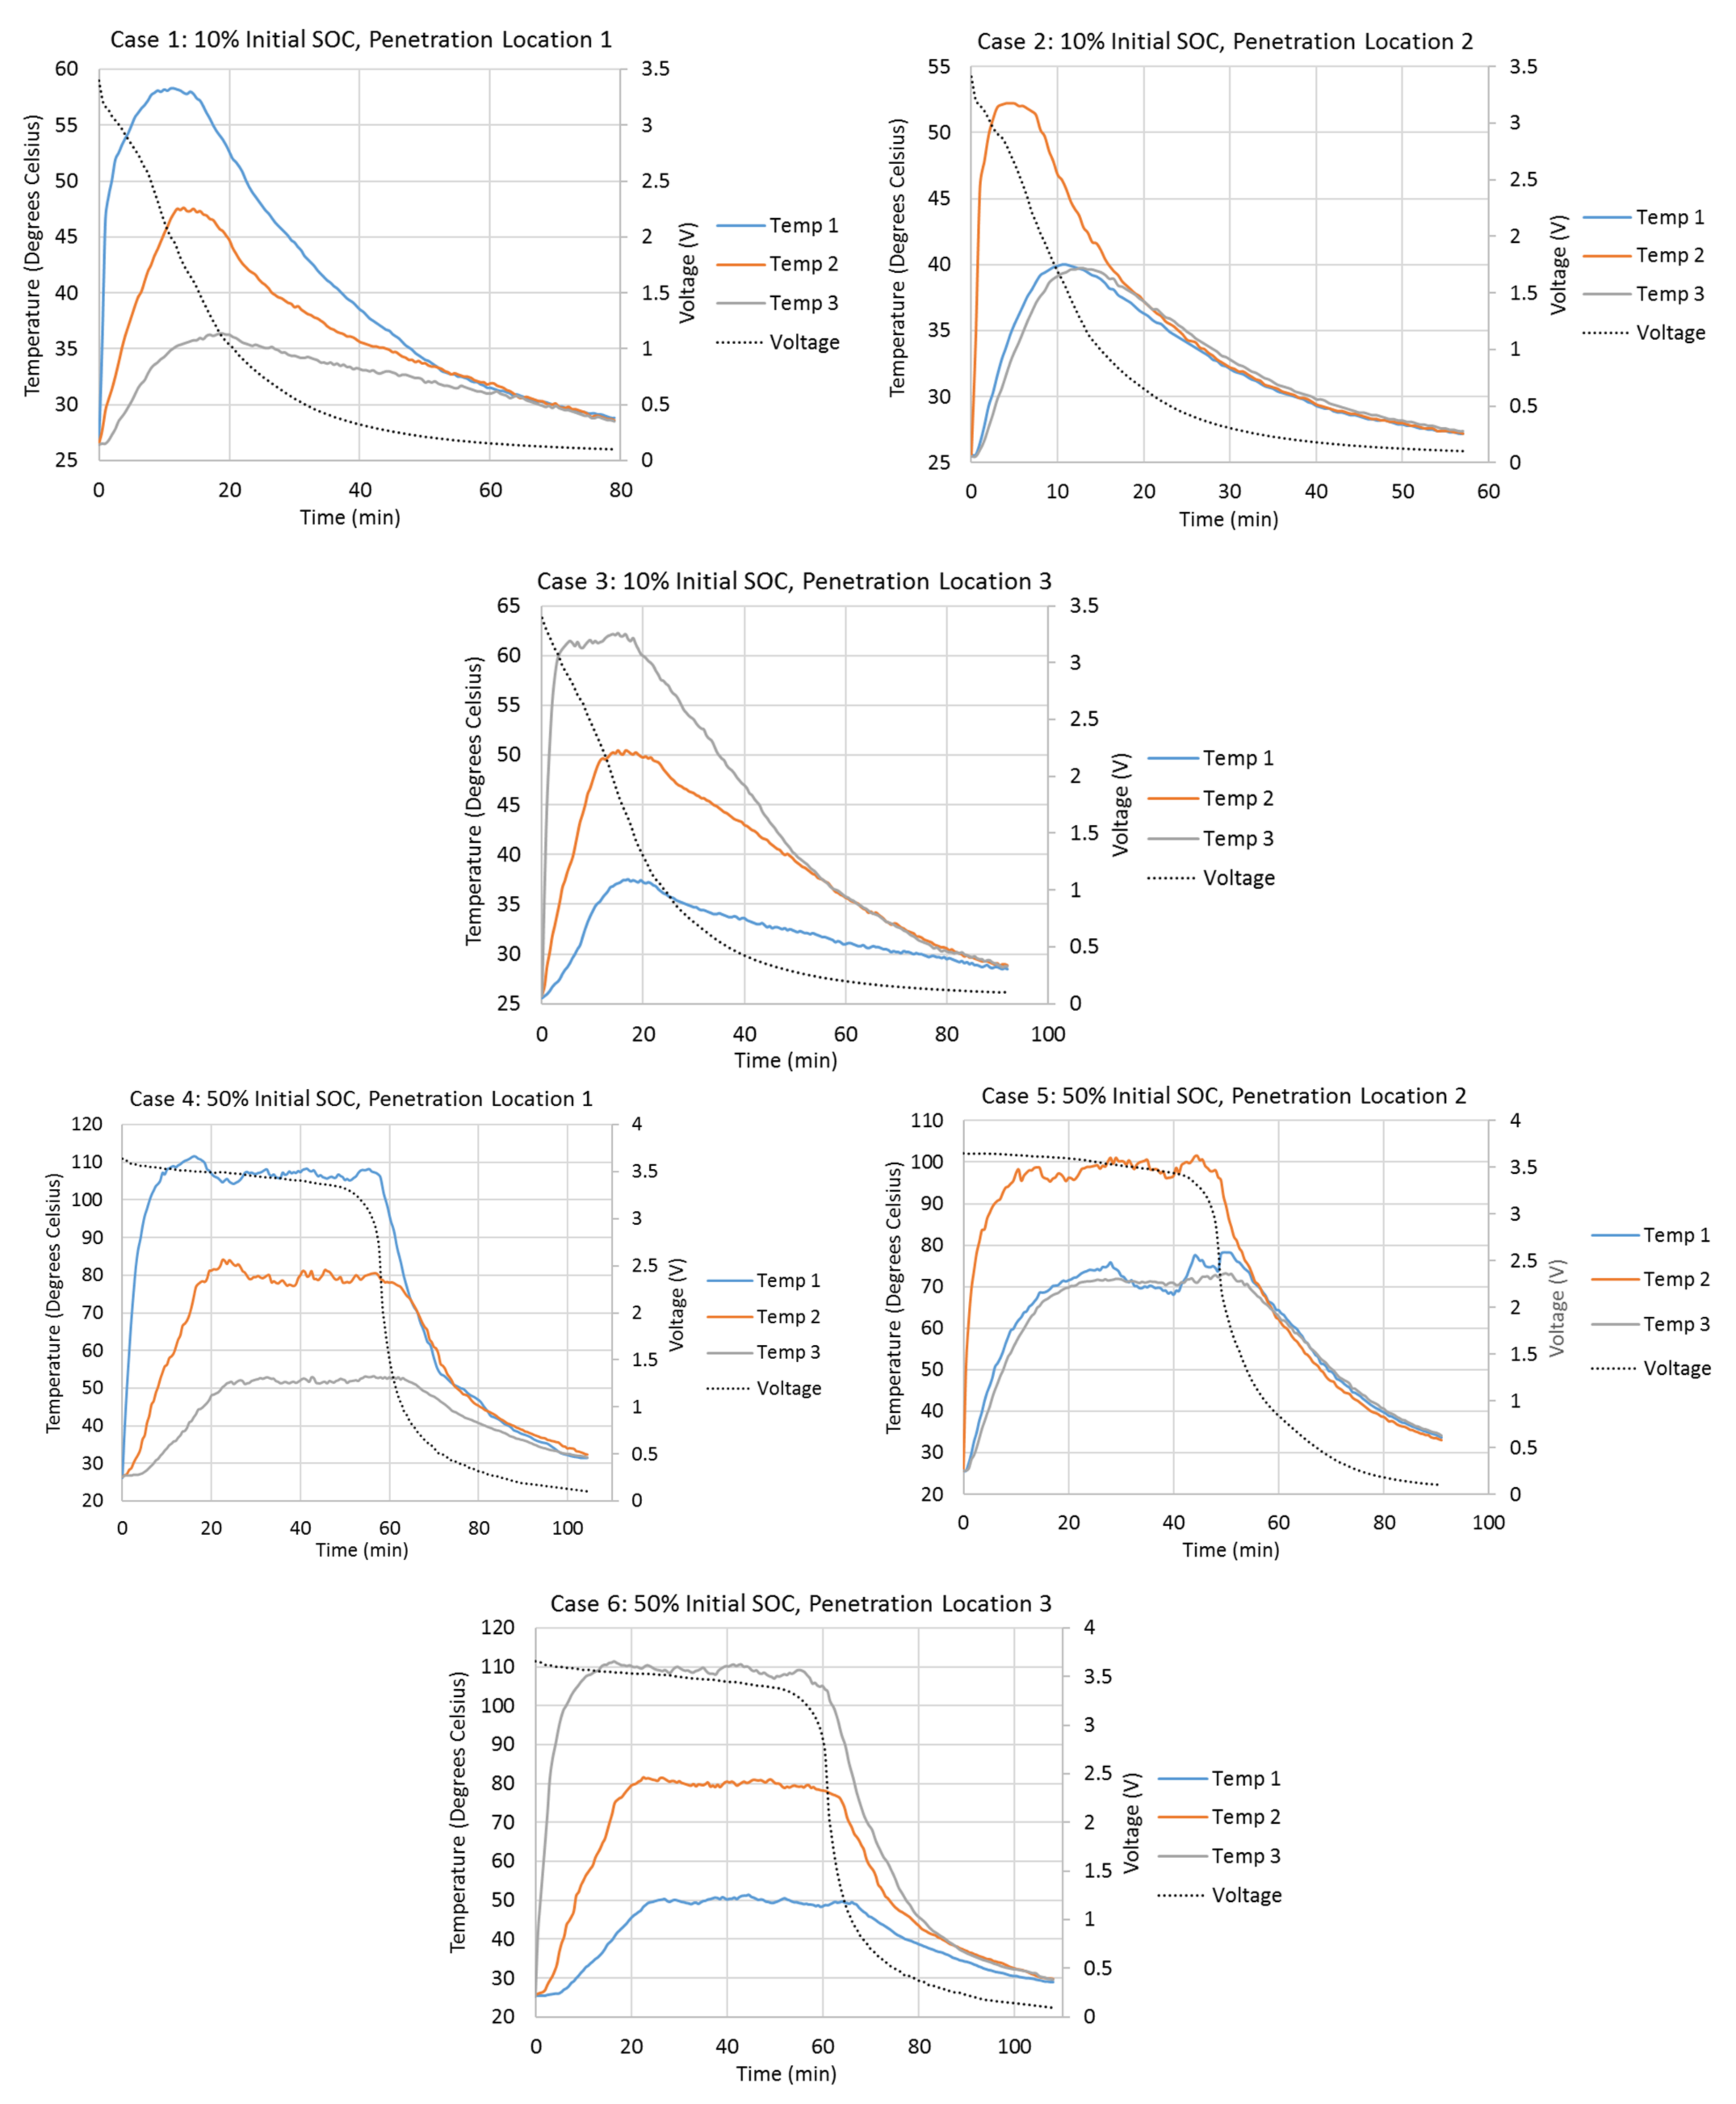
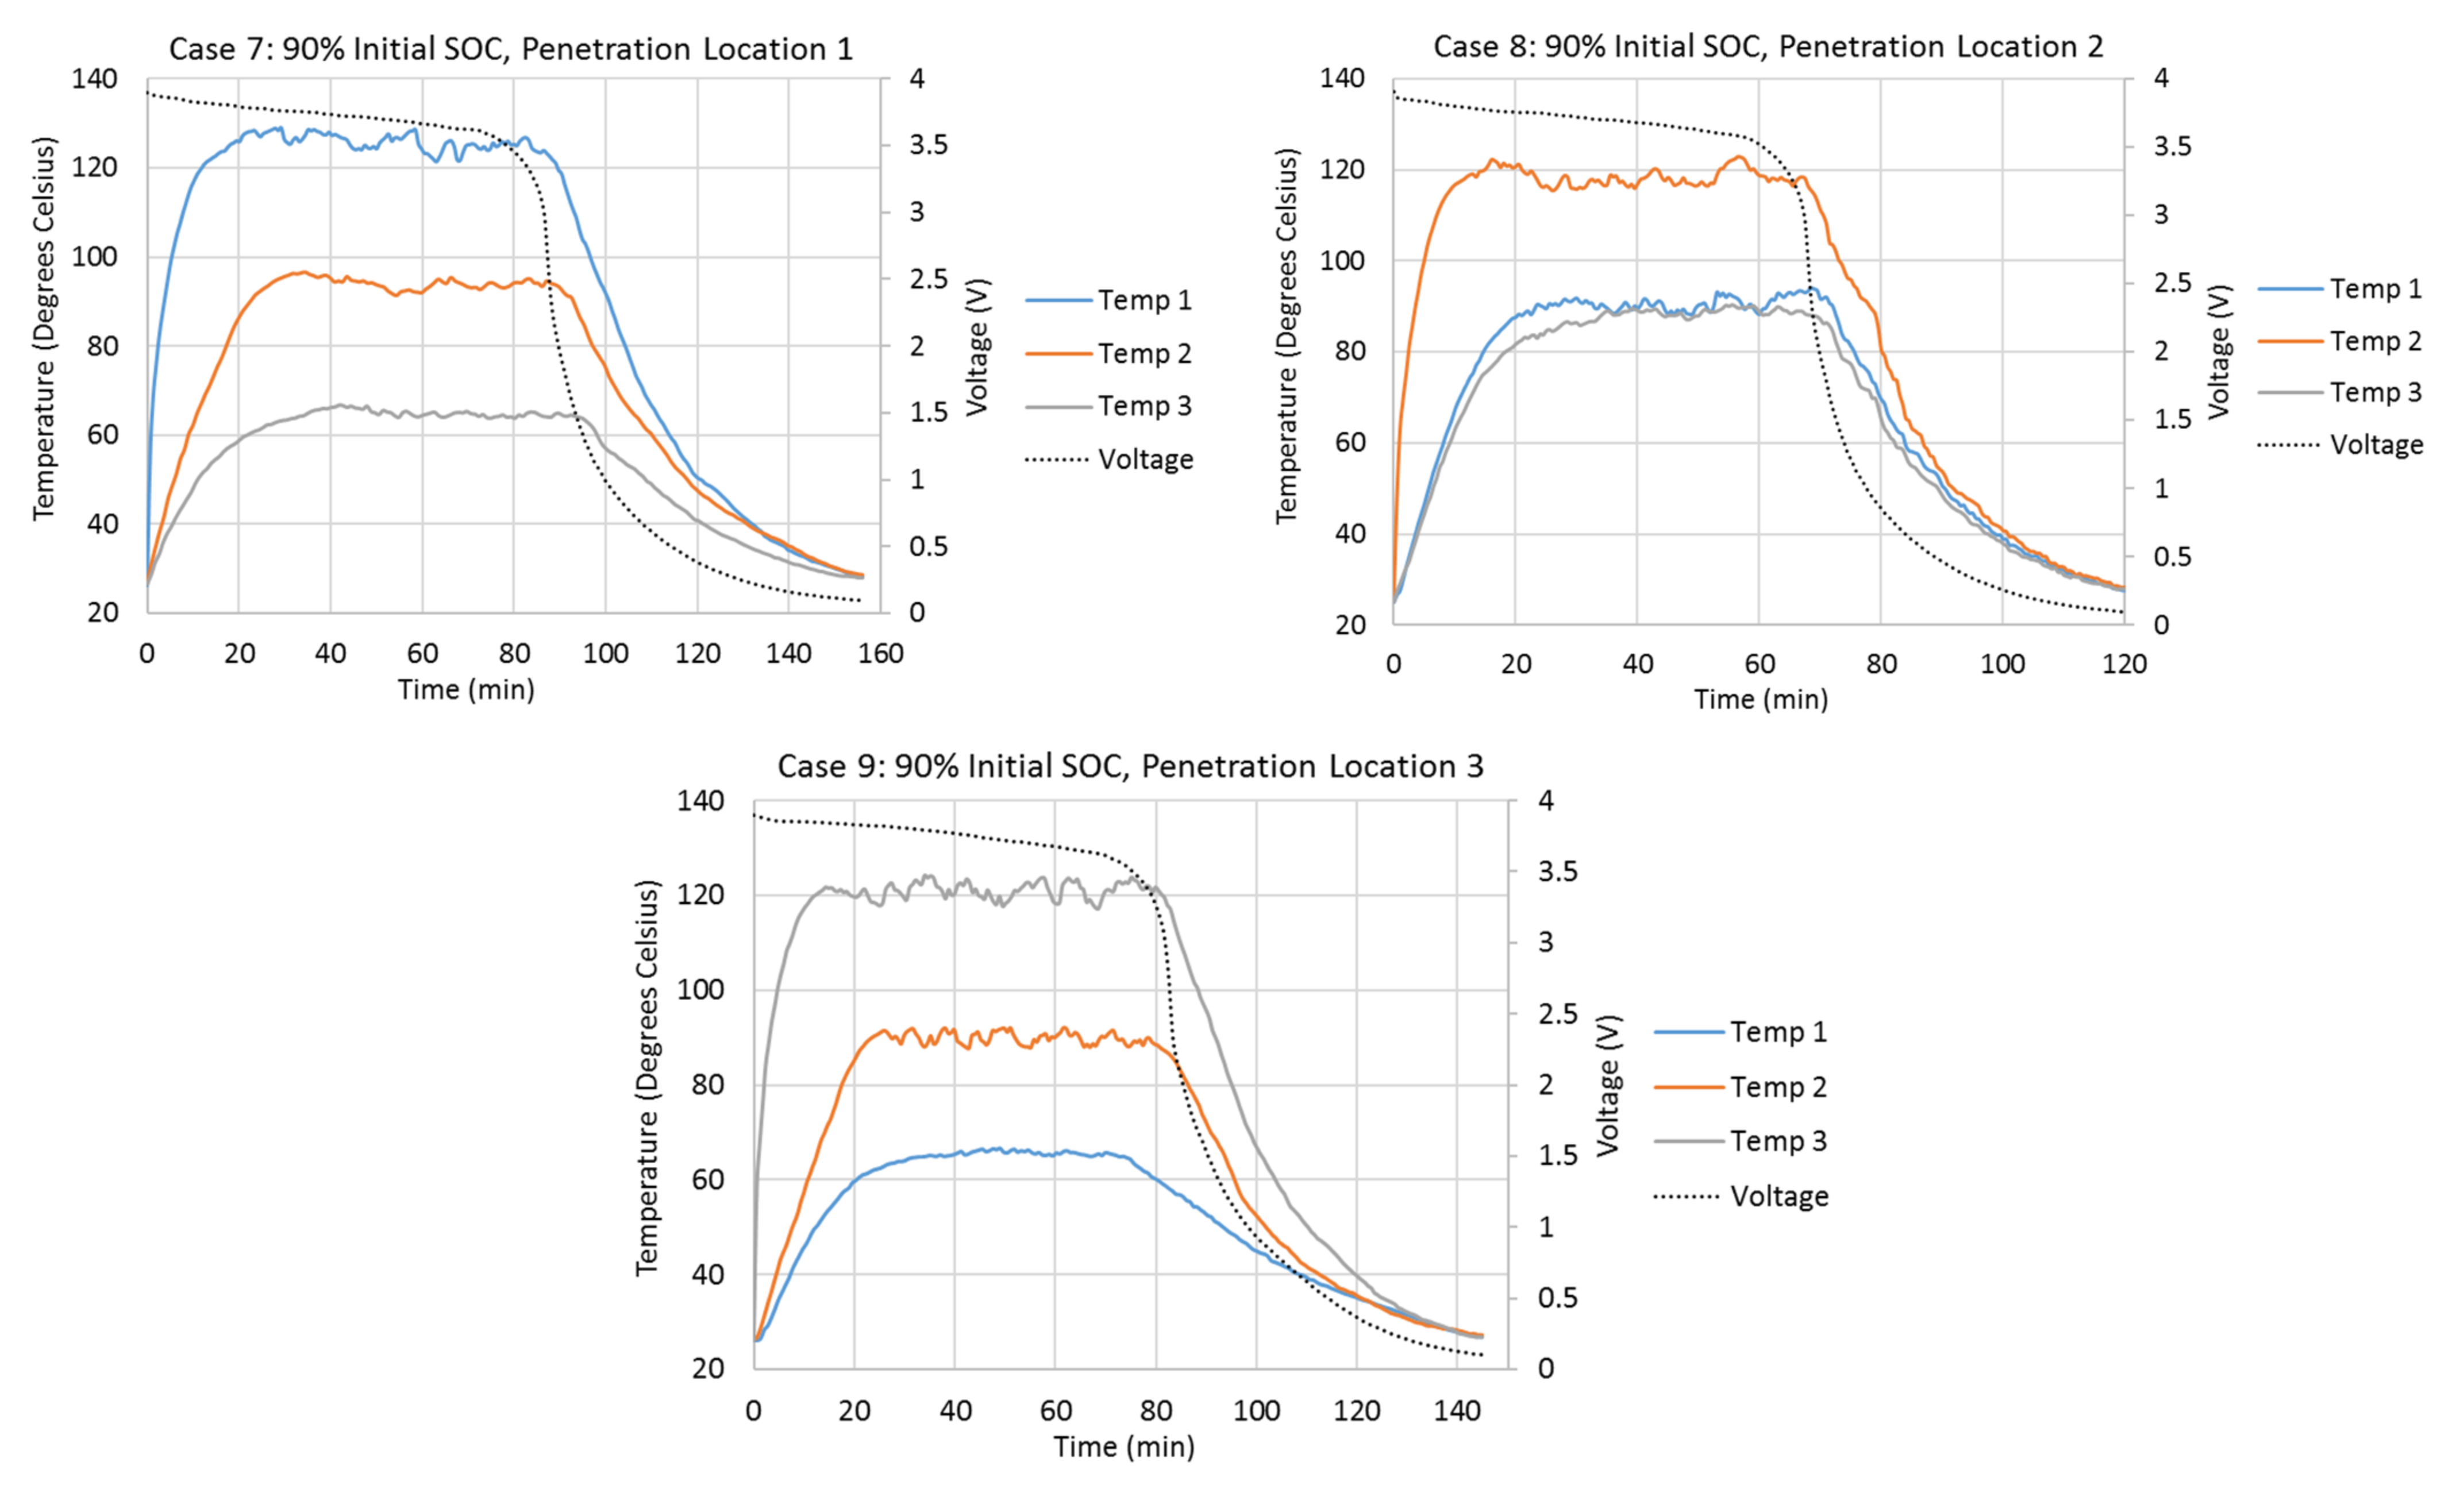
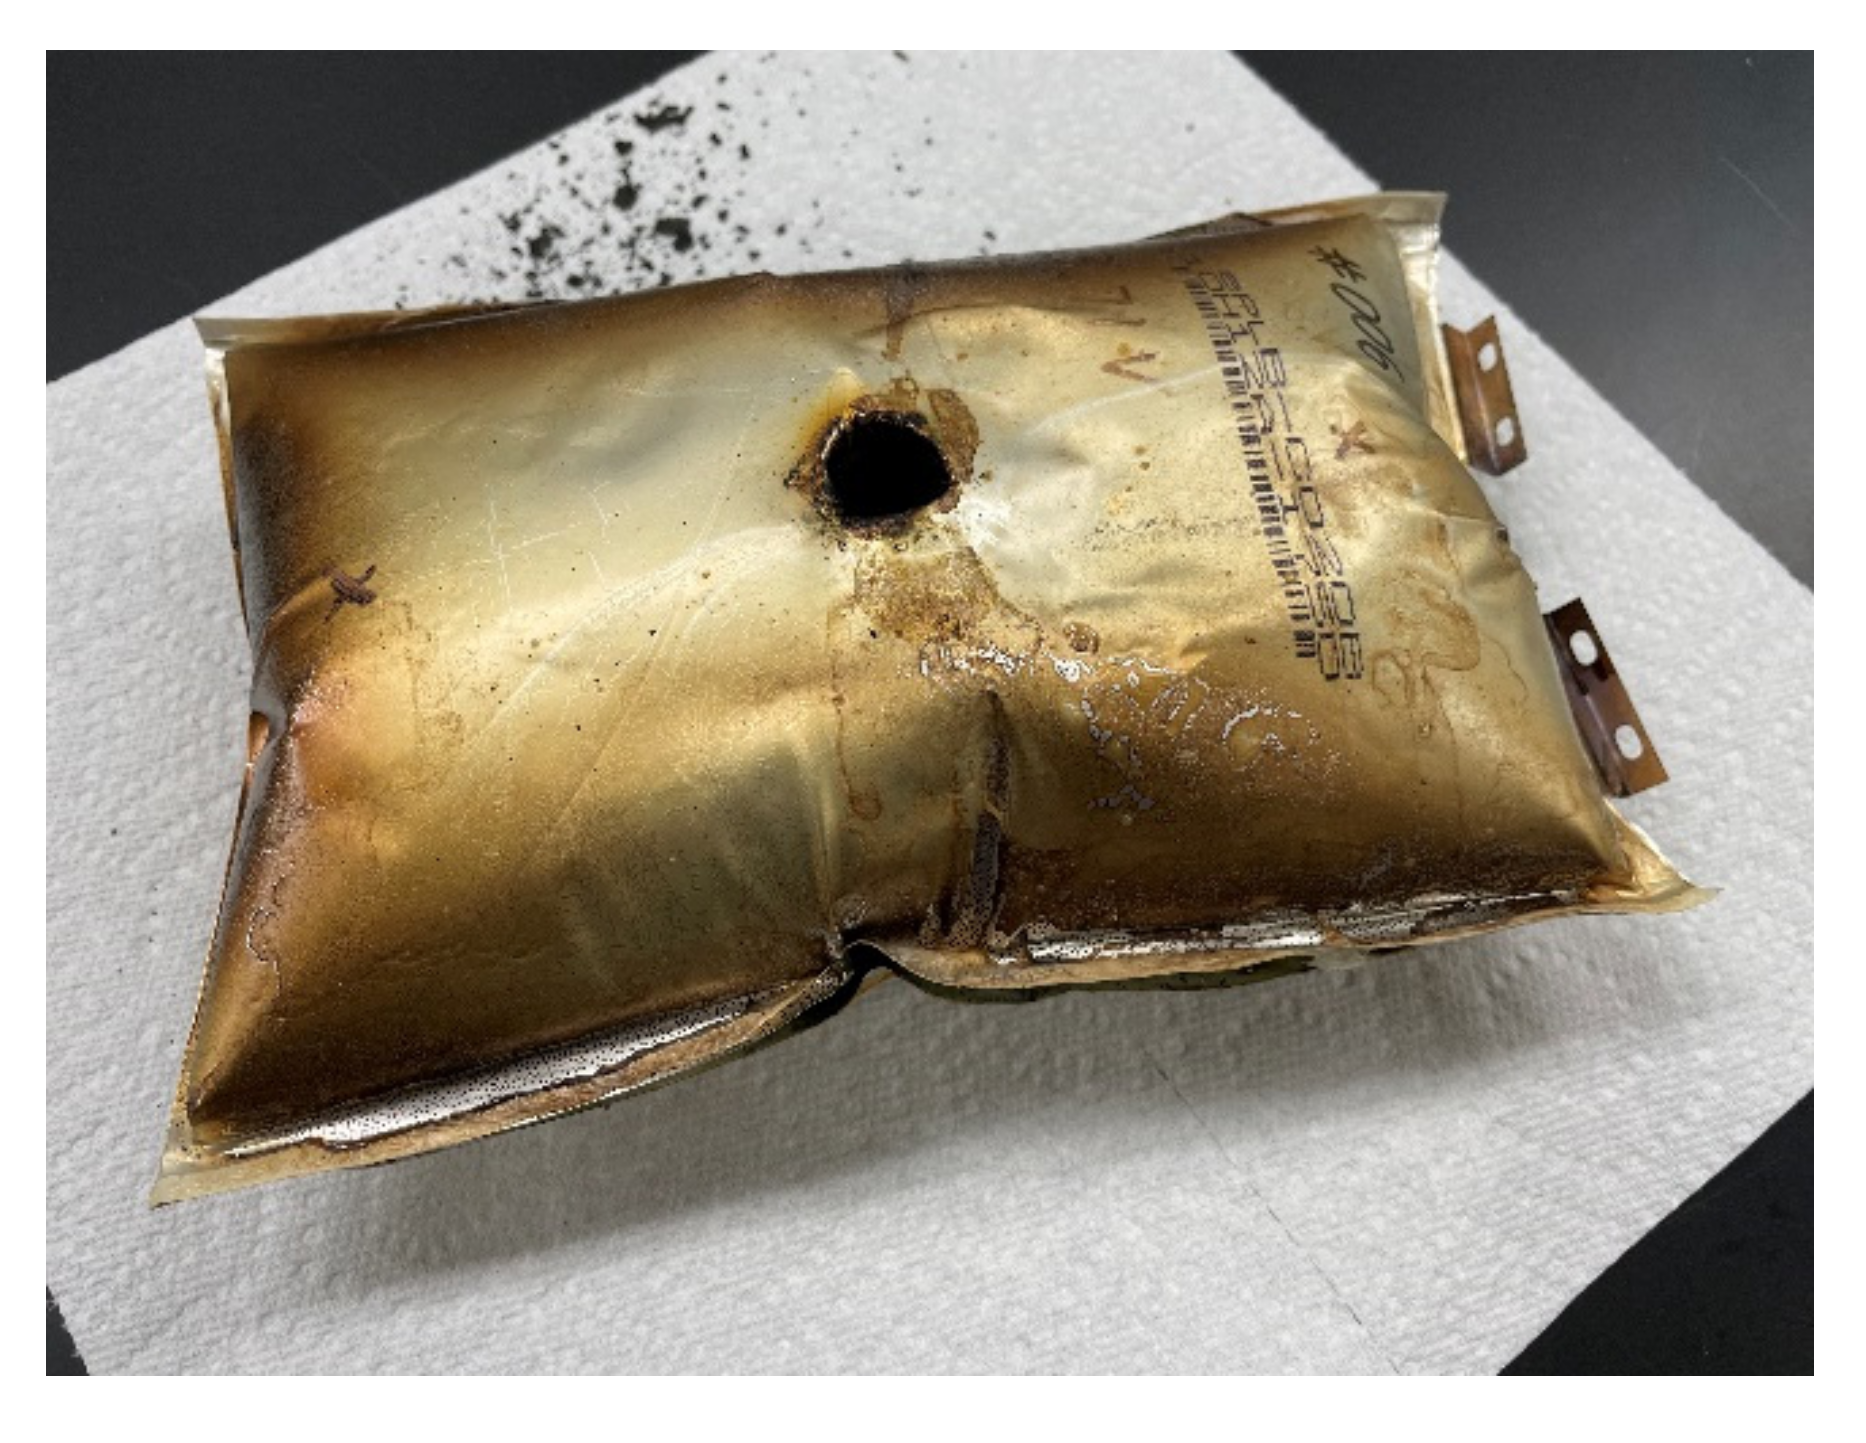
2.2. Experimental Results and Discussion

Figure 2 shows the variations of the cell surface temperatures at different thermocouple locations and the variations of the cell terminal voltages during different penetration tests. Cell surface temperatures at Penetration Locations 1, 2, and 3 are presented by Temp 1, 2, and 3, respectively, in Figure 2. The initial cell terminal voltages corresponding to the 10%, 50%, and 90% SOCs are about 3.4 V, 3.65 V, and 3.9 V. Once the steel cone starts to penetrate the cell, the cell terminal voltage starts to drop due to the internal short-circuit. In all cases, the voltage drops most quickly between 3.4 V and 1 V. The cell terminal voltage drops slowly when it is higher than 3.4 V. It also drops more slowly as it approaches 0.1 V. As the initial terminal voltages are about 3.4 V for the 10% initial SOC cases, the terminal voltages drop very quickly right after the penetrations start. Cases with higher initial SOC take longer for terminal voltage to drop to 0.1 V. For example, Case 8 takes 120 min for the voltage to drop to 0.1 V, while Case 2 only takes 57 min. Also, tests with Penetration Locations 1 and 3 take longer for the voltage to drop to 0.1 V, compared to the test with Penetration Location 2. For example, Cases 4 and 6 take 104.5 min and 108 min, respectively, while Case 5 only takes 91 min.
The penetration tests with higher initial cell SOCs have higher cell surface temperature increases during the tests. The cell surface temperature at the penetration location begins to increase rapidly right after the start of the penetration. Also, the penetration location always has the highest temperature increment during all penetration tests, which means the heat source is always at the penetration location. When the penetration location is the center of the cell (Penetration Location 2), the surface temperatures at Thermocouple Locations 1 and 3 increase almost simultaneously and vary identically. This is because the heat source is at the penetration location, and the amounts of heat dissipated to Thermocouple Locations 1 and 3 are the same. When the penetration location is Penetration Location 1 or 3, the farthest location away from the penetration location has the slowest temperature increase and smallest temperature increment, due to the direction of the heat dissipation from the penetration location. Also, the absolute temperature increment at the penetration location is always higher when the penetration is at Penetration Location 1 or 3, compared to that when the penetration is at Penetration Location 2. This is because Penetration Locations 1 and 3 are close to the edge of the cell. The heat generated at the edges of the cell is more difficult to dissipate. One of the biggest differences of tests with 10% initial SOC compared to tests with 50% and 90% initial SOCs is that the surface temperatures do not stay at their highest points for very long. Once they reach their highest points, they start to drop immediately. The surface temperatures in the tests with 50% and 90% initial SOCs stay and vary around their highest points for a much longer time.
Table 3 compares the detailed surface temperature information at the penetration location between each penetration test. From this table, it can be seen that the shapes of the surface temperature curves at the penetration locations in Cases 4–9 are similar to each other, because the durations of temperature above 80% of temperature increments at penetration locations have similar percentages (50.5% to 56.0%) of total test duration in each case. Also, the times taken to reach 80% of the total temperature increments at penetration locations in Cases 4–9 have similar percentages (3.9% to 4.9%) of the total test duration in each case. Both of these percentages in Cases 4–9 are much larger than those in Cases 1–3.
The penetrating velocity also has large effect on the cell temperature during the penetration test, even though the penetrating velocity’s effects are not included in the scope of this paper. During the preparation stage of the battery penetration experiment, the initial penetrating velocity of the steel cone is set to 42 mm/min, so it takes 10 s to penetrate through the battery cell. However, 42 mm/min penetrating velocity always triggers combustion, regardless of the initial SOC of the cell or the penetration location. Huge flames and large amounts of smoke are generated during the combustion. The combustion usually happens within 10 s after the start of the penetration test. Figure 3 shows the cell after the combustion, at the beginning of the penetration test. The cell is inflated because of the gas generated by the combustion. To eliminate the combustion, the penetrating velocity of the steel cone is reduced to 28 mm/min for the penetration tests in this paper, and combustion does not occur again.

3. Battery Cell Internal Short-Circuit Simulations

3.1. Simulation Setup

A battery cell internal short-circuit model with different penetration locations was built in ANSYS Fluent, based on the specifications and experimental data of the tested battery cells. The simulated temperature distributions on the battery cell surface after the internal short-circuit were compared with the experimental data as the model validation. The detailed procedures of building the battery cell internal short-circuit model are as below, based on the standard procedures provided in the ANSYS Fluent Tutorial Guide Chapter 24 [21]:
  • The mesh of the geometry of the battery cell, which is created by the Mesh function in ANSYS, was imported into the ANSYS Fluent. The dimensions of the geometry of the cell were the same as those of the tested cells, which were 196 mm (excluding the terminals) in height, 127 mm in width, and 7 mm in thickness.
  • The Multi-Scale Multi-Dimensional (MSMD) Battery Model was enabled. NTGK (Newman, Tiedemann, Gu and Kim) Empirical Model was selected as the E-Chemistry model. 20 Ah was entered as the nominal cell capacity. Specified resistance was selected as the solution option and 10,000 ohms was entered as the external resistance. Large external resistance was entered because there was no external current flow during the cell penetration tests and simulations. Minimum and maximum stop voltage were 2.5 V and 4.2 V, respectively. Initial DOD (depth of discharge) was selected based on the initial conditions of different simulations.
  • Under Materials, copper was selected for the tab material. 2092 kg/m3, 678 J/kg-K, 18.4 W/m-K, and 3.541 × 10⁷ siemens/m were entered for the density, specific heat, thermal conductivity, and electrical conductivity of the active material inside the battery cell, respectively. 1,190,000 kg/m-s and 983,000 kg/m-s were entered for uds-0 and uds-1, respectively, as the User Defined Scalar Diffusion Coefficients.
  • Under Boundary Conditions, convection was selected for the thermal condition and 8 W/m2-K was entered for the heat transfer coefficient for all walls of the battery cell model. Free stream temperature was set to 25 degrees Celsius, which was same as the ambient temperature inside the laboratory room.
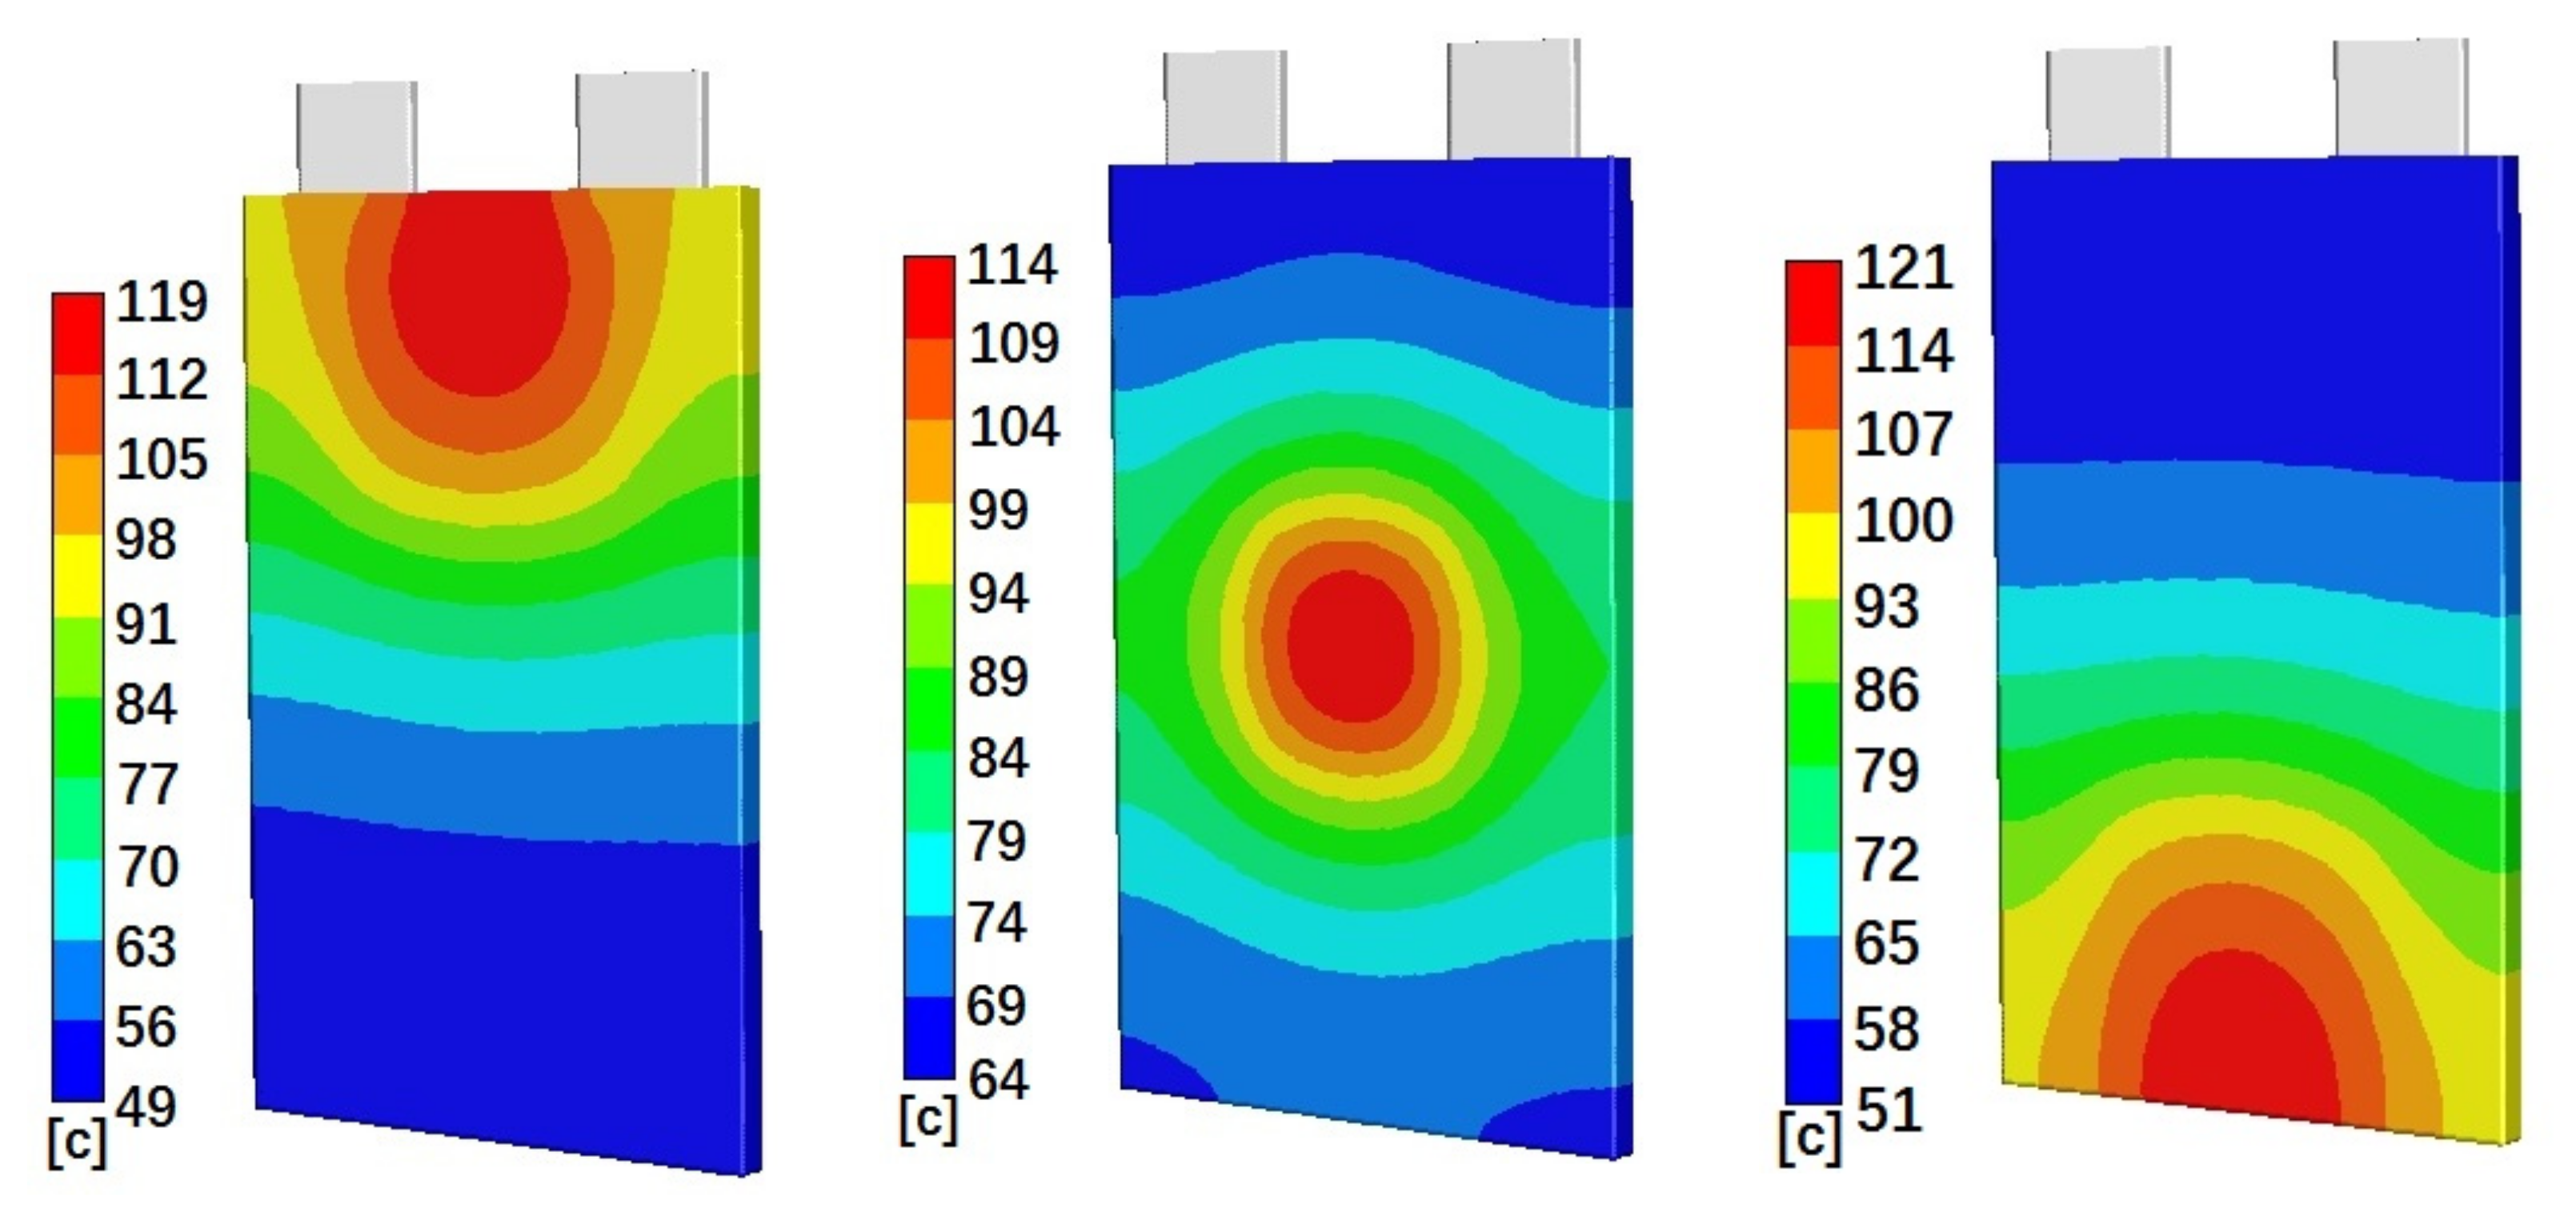
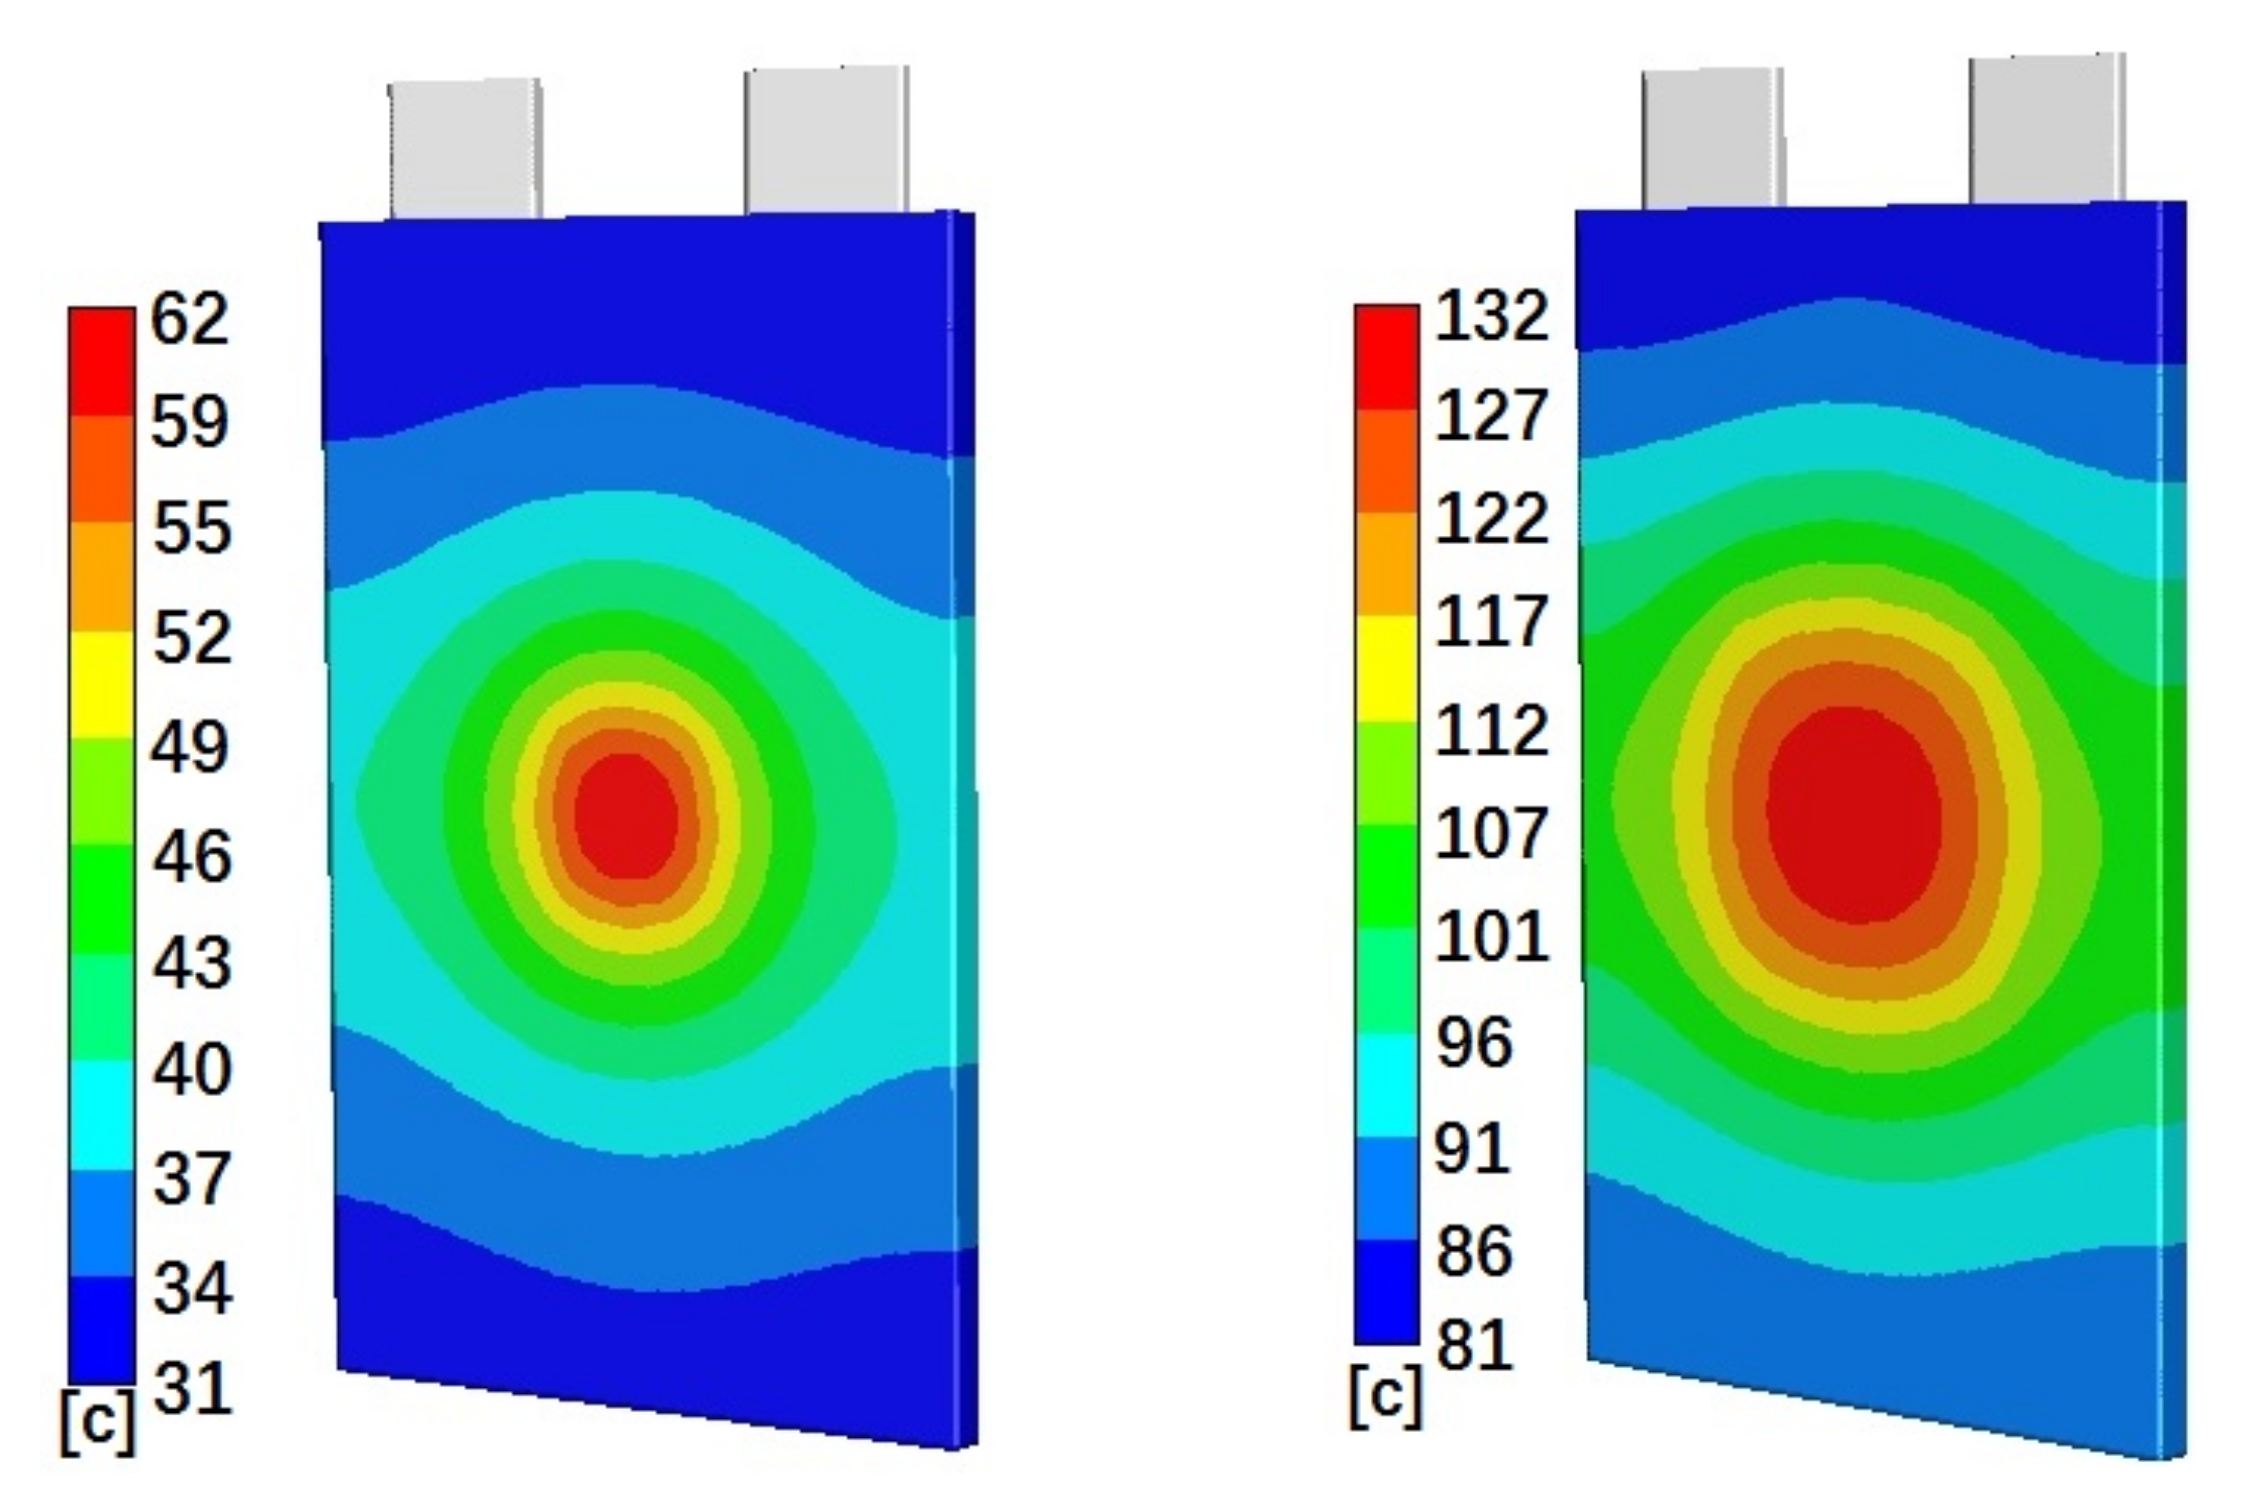
  • Under Setting Up Domain, the locations of the penetration were marked on the battery cell geometry under the Mark/Adapt Cells function. Under Initialization, short circuit resistance was assigned to the penetration location using “Patch” function. The value of the short circuit resistance under “Patch” function is an unitless value with initial value set to 5 × 10⁻⁷. This value was adjusted to make the simulated temperature distributions on battery cell after penetration match the experimental ones. In this paper, this value was adjusted based on the experimental temperature distribution data for the cell with 50% initial SOC and Penetration Location 2 (Case 5). Experimental temperature distribution data for the Cases 2, 4, 6, and 8 were compared to the simulated data as model validation.
  • Under Run Calculation, Fixed was selected as the time stepping method. Time step size was set to 30 s. Number of time steps was selected based on temperature distribution data at what time was required. For example, if temperature distribution data on the battery cell five minutes after penetration started is needed, the number of time steps should set to 10 (30 s multiplied by 10 equals to five minutes). In this paper, cell temperature data at the middle point of the “flat zone” of the temperature curve of the penetration location was used for comparison between simulated and experimental data. Temperature data at 30 min, 40 min, 40 min, 5 min, and 40 min after penetration started were selected for Cases 5, 4, 6, 2, and 8, respectively, for comparisons between simulated and experimental data.

3.2. Simulation Results and Discussion

Figure 4 shows the simulated temperature distributions on the battery cell surface for cells with 50% initial SOC and Penetration Location 1 (left), Location 2 (middle), and Location 3 (right), at 40 min, 30 min, and 40 min after penetration started, respectively. Figure 4 clearly shows that the highest temperature distributions are at the penetration locations. The temperatures gradually reduce from penetration locations to their surroundings. The gradients of the temperature distributions are much larger close to the penetration locations. For the areas far away from the penetration locations, the temperature distributions do not change much. Figure 4 also clearly shows that higher absolute temperatures happen at Penetration Locations 1 and 3. Cases with Penetration Locations 1 and 3 also have a larger temperature distribution range than that of cases with Penetration Location 2. Figure 5 shows the simulated temperature distributions on the battery cell surface for cells with Penetration Location 2 and 10% initial SOC (left) and 90% initial SOC (right), at 5 min and 40 min after penetration started, respectively. Figure 5 shows that penetration on a battery cell with higher initial SOC results in a higher surface temperature distribution. Also, the distribution area of the highest temperature of cell with 90% initial SOC is larger than that of the cell with 10% initial SOC.
Table 4 compares the simulated and experimental temperature data at Thermocouple Locations 1, 2, and 3 and at selected time points in different cases. Simulated data are recorded in “SIM” columns and experimental data are recorded in “EXP” columns. “DIF” columns show the difference between simulated data and experimental data. Positive number means the simulated data is higher than the experimental data, and vice versa. Experimental data in Case 5 are used for model calibration, and experimental data in the other four cases are used for model validation. The differences between simulated and experimental data are smaller than six degrees Celsius in most cases, which is an acceptable discrepancy range considering the total temperature variations. However, the discrepancy is larger at Thermocouple Location 2 in Cases 4 and 6.

4. Conclusions

In this paper, the effects of cell initial SOC and penetration location on variations in cell temperature and terminal voltage during penetration tests are investigated. Three different cell initial SOCs (10%, 50%, and 90%) and three different penetration locations (Locations 1, 2, and 3, shown in Figure 1) are used in the tests. A steel cone is used to penetrate the battery cell. Once the steel cone starts to penetrate the cell, the cell terminal voltage starts to drop due to the internal short-circuit. In all cases, the voltage drops most quickly between 3.4 V and 1 V. The cell terminal voltage drops slowly when it is higher than 3.4 V. It also drops more slowly as it approaches to 0.1 V. The penetration tests with higher initial cell SOCs have larger cell surface temperature increase during the tests. Also, the penetration location always has the highest temperature increment during all penetration tests, which means the heat source is always at the penetration location. The absolute temperature increment at the penetration location is always higher when the penetration is at Location 1 or 3, compared to that when the penetration is at Location 2. This is because Penetration Locations 1 and 3 are close to the edge of the cell. The heat generated at the edges of the cell is more difficult to dissipate. Also, a battery cell internal short-circuit model with different penetration locations is built in ANSYS Fluent, based on the specifications and experimental data of the tested battery cells. The model is validated with an acceptable discrepancy range by using the experimental data. Simulated data shows that the highest temperatures are at the penetration locations. The temperatures gradually reduce from penetration locations to their surroundings. The gradients of the temperature distributions are much larger close to the penetration locations. For the areas far away from the penetration locations, the temperature distributions do not change much. Overall, this paper provides detailed information on temperature and terminal voltage variations of a lithium-ion polymer battery cell with large capacity and high power under penetration tests. The presented information can be used for assessing the safety of the onboard battery pack of PHEVs and EVs.

Author Contributions

Performing experiments, Y.L. (Yiqun Liu) and Y.L. (Yitian Li); software simulation, Y.L. (Yiqun Liu); paper writing, Y.L. (Yiqun Liu) and Y.G.L.; paper revision, Y.G.L. and M.-C.L. All authors have read and agreed to the published version of the manuscript.

Funding

The author(s) disclosed receipt of the following financial support for the research, authorship, and/or publication of this article: This work was supported in part by the National Science Foundation, ATE: Centers, under grant number DUE-1902369.

Conflicts of Interest

The authors declare no conflict of interest.

References

  1. Doughty, D.H.; Roth, E.P. A general discussion of Li Ion battery safety. Electrochem. Soc. Interface 2012, 21, 37–44. [Google Scholar] [CrossRef] [Green Version]
  2. Jeong, G.; Kim, Y.-U.; Kim, H.; Kim, Y.-J.; Sohn, H.-J. Prospective materials and applications for Li secondary batteries. Energy Environ. Sci. 2011, 4, 1986–2002. [Google Scholar] [CrossRef]
  3. Fernandes, Y.; Bry, A.; de Persis, S. Identification and quantification of gases emitted during abuse tests by overcharge of a commercial Li-ion battery. J. Power Sources 2018, 389, 106–119. [Google Scholar] [CrossRef]
  4. Ren, D.; Feng, X.; Lu, L.; Ouyang, M.; Zheng, S.; Li, J.; He, X. An electrochemical-thermal coupled overcharge-to-thermal-runaway model for lithium ion battery. J. Power Sources 2017, 364, 328–340. [Google Scholar] [CrossRef]
  5. Larsson, F.; Bertilsson, S.; Furlani, M.; Albinsson, I.; Mellander, B.-E. Gas explosions and thermal runaways during external heating abuse of commercial lithium-ion graphite-LiCoO2 cells at different levels of ageing. J. Power Sources 2018, 373, 220–231. [Google Scholar] [CrossRef]
  6. Finegan, D.P.; Scheel, M.; Robinson, J.B.; Tjaden, B.; Hunt, I.; Mason, T.J.; Millichamp, J.; Michiel, M.D.; Offer, G.J.; Hinds, G.; et al. In-operando high-speed tomography of lithium-ion batteries during thermal runaway. Nat. Commun. 2015, 6, 6924. [Google Scholar] [CrossRef] [PubMed]
  7. Sheikh, M.; Elmarakbi, A.; Elkady, M. Thermal runaway detection of cylindrical 18650 lithium-ion battery under quasi-static loading conditions. J. Power Sources 2017, 370, 61–70. [Google Scholar] [CrossRef] [Green Version]
  8. Kisters, T.; Sahraei, E.; Wierzbicki, T. Dynamic impact tests on lithium-ion cells. Int. J. Impact Eng. 2017, 108, 205–216. [Google Scholar] [CrossRef]
  9. Feng, X.; Sun, J.; Ouyang, M.; Wang, F.; He, X.; Lu, L.; Peng, H. Characterization of penetration induced thermal runaway propagation process within a large format lithium ion battery module. J. Power Sources 2015, 275, 261–273. [Google Scholar] [CrossRef]
  10. Zhao, R.; Liu, J.; Gu, J. Simulation and experimental study on lithium ion battery short circuit. Appl. Energy 2016, 173, 29–39. [Google Scholar] [CrossRef]
  11. Yokoshima, T.; Mukoyama, D.; Maeda, F.; Osaka, T.; Takazawa, K.; Egusa, S.; Naoi, S.; Ishikura, S.; Yamamoto, K. Direct observation of internal state of thermal runaway in lithium ion battery during nail-penetration test. J. Power Sources 2018, 393, 67–74. [Google Scholar] [CrossRef]
  12. Yokoshima, T.; Mukoyama, D.; Maeda, F.; Osaka, T.; Takazawa, K.; Egusa, S. Operando Analysis of Thermal Runaway in Lithium Ion Battery during Nail-Penetration Test Using an X-ray Inspection System. J. Electrochem. Soc. 2019, 166, A1243–A1250. [Google Scholar] [CrossRef]
  13. Diekmann, J.; Doose, S.; Weber, S.; Munch, S.; Haselrieder, W.; Kwade, A. Development of a New Procedure for Nail Penetration of Lithium-Ion Cells to Obtain Meaningful and Reproducible Results. J. Electrochem. Soc. 2020, 167, 090504. [Google Scholar] [CrossRef]
  14. Yamanaka, T.; Takagishi, Y.; Tozuka, Y.; Yamaue, T. Modeling lithium ion battery nail penetration tests and quantitative evaluation of the degree of combustion risk. J. Power Sources 2019, 416, 132–140. [Google Scholar] [CrossRef]
  15. Yang, H.; Zhuang, G.V.; Ross, P.N. Thermal stability of LiPF6 salt and Li-ion battery electrolytes containing LiPF6. J. Power Sources 2006, 161, 573–579. [Google Scholar] [CrossRef] [Green Version]
  16. Galushkin, N.E.; Yazvinskaya, N.N.; Galushkin, D.N. Mechanism of Thermal Runaway in Lithium-Ion Cells. J. Electrochem. Soc. 2018, 165, A1303–A1308. [Google Scholar] [CrossRef]
  17. Wang, H.; Tang, A.; Huang, K. Oxygen Evolution in Overcharged LixNi1/3Co1/3Mn1/3O2 Electrode and Its Thermal Analysis Kinetics. Chin. J. Chem. 2011, 29, 1583–1588. [Google Scholar] [CrossRef]
  18. Lopez, C.F.; Jeevarajan, J.A.; Mukherjee, P.P. Experimental Analysis of Thermal Runaway and Propagation in Lithium-Ion Battery Modules. J. Electrochem. Soc. 2015, 162, A1905–A1915. [Google Scholar] [CrossRef]
  19. Spinner, N.S.; Field, C.R.; Hammond, M.H.; Williams, B.A.; Myers, K.M.; Lubrano, A.L.; Rose-Pehrsson, S.L.; Tuttle, S.G. Physical and chemical analysis of lithium-ion battery cell-to-cell failure events inside custom fire chamber. J. Power Sources 2015, 279, 713–721. [Google Scholar] [CrossRef]
  20. Zhang, M.; Du, J.; Liu, L.; Stefanopoulou, A.; Siegel, J.; Lu, L.; He, X.; Xie, X.; Ouyang, M. Internal Short Circuit Trigger Method for Lithium-Ion Battery Based on Shape Memory Alloy. J. Electrochem. Soc. 2017, 164, A3038–A3044. [Google Scholar] [CrossRef] [Green Version]
  21. ANSYS, Inc. ANSYS Fluent Tutorial Guide Release 18.0, Chapter 24: Simulating a Single Battery Cell Using the MSMD Battery Model; ANSYS, Inc.: Canonsburg, PA, USA, 2017; pp. 961–1003. [Google Scholar]
Figure 1. Penetration test setup (left), closer look of penetrating cone (middle), and penetration locations and thermocouple locations with unit in mm (right).
Batteries 07 00081 g001
Figure 2. Variations in the cell surface temperatures at different thermocouple locations and the variations in the cell terminal voltages during different penetration tests.
Batteries 07 00081 g002aBatteries 07 00081 g002b
Figure 3. Battery cell after the combustion during the penetration test.
Batteries 07 00081 g003
Figure 4. Simulated temperature distributions on the battery cell surface for Case 4 (left), Case 5 (middle), and Case 6 (right), at 40 min, 30 min, and 40 min after penetration started, respectively.
Batteries 07 00081 g004
Figure 5. Simulated temperature distributions on the battery cell surface for Case 2 (left) and Case 8 (right), at 5 min and 40 min after penetration started, respectively.
Batteries 07 00081 g005
Table 1. Specifications of EiG ePLB-C020 Battery Cell.
Length196 mm
Width127 mm
Thickness7 mm
Weight428 g
Nominal Voltage3.65 V
Nominal Capacity20 Ah
AC Impedance (1 KHz)<3 milliohm
Specific Energy174 Wh/Kg
Energy Density370 Wh/L
Specific Power (50%DOD, 10 s)2300 W/Kg
Power Density (50%DOD, 10 s)4600 W/L
Max. Charging Voltage4.15 V
Lower Voltage Limit for Discharge2.5 V
Table 2. Testing cases of penetration test.
Cell Initial SOCPenetration Location
Case 110%1
Case 210%2
Case 310%3
Case 450%1
Case 550%2
Case 650%3
Case 790%1
Case 890%2
Case 990%3
Table 3. Comparison of surface temperature information at the penetration location between each penetration test.
10%-1
(Case 1)
10%-2
(Case 2)
10%-3
(Case 3)
50%-1
(Case 4)
50%-2
(Case 5)
50%-3
(Case 6)
90%-1
(Case 7)
90%-2
(Case 8)
90%-3
(Case 9)
Initial Temp. of Penetration Location (°C)26.425.625.826.225.725.326.426.326
Highest Temp. of Penetration Location (°C)58.352.262.3111.5101.5111.5128.9123124.3
Temp. Increment of Penetration Location (°C)31.926.636.585.375.886.2102.596.798.3
Temp. at 80% of Temp. Increment of Penetration Location (°C)51.9246.885594.4486.3494.26108.4103.66104.64
Time Taken to Reach 80% of Temp. Increment of Penetration Location (min) (% of Test Duration)2.5
(3.2%)
1.25
(2.2%)
1.96
(2.1%)
4.77
(4.6%)
4.49
(4.9%)
4.83
(4.5%)
7.44
(4.8%)
5.56
(4.6%)
5.71
(3.9%)
Duration that Temp. above 80% of Temp. Increment of Penetration Location (min) (% of Test Duration)18.5
(23.4%)
8.75
(15.4%)
25.54
(27.8%)
55.48
(53.1%)
45.97
(50.5%)
58.8
(54.4%)
86.2
(55.3%)
66.47
(55.4%)
81.2
(56.0%)
Test Duration (min)795792104.591108156120145
Table 4. Comparison between simulated and experimental temperature data at Thermocouple (TC) Locations 1, 2, and 3 and at selected time points in Cases 2, 4, 5, 6, and 8.
TC Location 1TC Location 2TC Location 3
SIMEXPDIFSIMEXPDIFSIMEXPDIF
50% Initial SOC
Penetration Location 2
(Case 5)
70.472.7−2.3103.8100.23.673.171.71.4
50% Initial SOC
Penetration Location 1
(Case 4)
108.9107.31.672.780.1−7.452.8520.8
50% Initial SOC
Penetration Location 3
(Case 6)
53.650.23.469.380.5−11.2108.8110.3−1.5
10% Initial SOC
Penetration Location 2
(Case 2)
33.335.5−2.248.552.2−3.735.133.41.7
90% Initial SOC
Penetration Location 2
(Case 8)
87.389.5−2.2122.41175.491.589.22.3
Publisher’s Note: MDPI stays neutral with regard to jurisdictional claims in published maps and institutional affiliations.

