A Fast Approach to Obtain Layered Transition-Metal Cathode Material for Rechargeable Batteries
Abstract
:1. Introduction
2. Results and Discussion
2.1. Oxalate Precursor Characterization
2.2. Cathode Material’s Characterization
2.3. Electrochemical Performance Test
2.4. Postmortem Analysis
3. Materials and Methods
3.1. Material Synthesis
3.2. Material Characterization
3.3. Cell Assembly and Electrochemical Testing
4. Conclusions
Supplementary Materials
Author Contributions
Funding
Institutional Review Board Statement
Informed Consent Statement
Data Availability Statement
Conflicts of Interest
References
- Kåberger, T. Progress of renewable electricity replacing fossil fuels. Prog. Renew. Electr. Replac. Foss. Fuels 2018, 1, 48–52. [Google Scholar] [CrossRef]
- Van Mierlo, J.; Maggetto, G.; Lataire, P. Which energy source for road transport in the future? A comparison of battery, hybrid and fuel cell vehicles. Energy Convers. Manag. 2006, 47, 2748–2760. [Google Scholar] [CrossRef]
- Offer, G.J.; Howey, D.; Contestabile, M.; Clague, R.; Brandon, N.P. Comparative analysis of battery electric, hydrogen fuel cell and hybrid vehicles in a future sustainable road transport system. Energy Policy 2010, 38, 24–29. [Google Scholar] [CrossRef] [Green Version]
- Dunn, B.; Kamath, H.; Tarascon, J.M. Electrical energy storage for the grid: A battery of choices. Science 2011, 334, 928–935. [Google Scholar] [CrossRef] [Green Version]
- Miao, Y.; Hynan, P.; Von Jouanne, A.; Yokochi, A. Current li-ion battery technologies in electric vehicles and opportunities for advancements. Energies 2019, 12, 1074. [Google Scholar] [CrossRef] [Green Version]
- Jaiswal, A. Lithium-ion battery based renewable energy solution for off-grid electricity: A techno-economic analysis. Renew. Sustain. Energy Rev. 2017, 72, 922–934. [Google Scholar] [CrossRef]
- Berckmans, G.; Messagie, M.; Smekens, J.; Omar, N.; Vanhaverbeke, L.; Mierlo, J. Van Cost projection of state of the art lithium-ion batteries for electric vehicles up to 2030. Energies 2017, 10, 1314. [Google Scholar] [CrossRef] [Green Version]
- Wang, L.; Chen, B.; Ma, J.; Cui, G.; Chen, L. Reviving lithium cobalt oxide-based lithium secondary batteries-toward a higher energy density. Chem. Soc. Rev. 2018, 47, 6505–6602. [Google Scholar] [CrossRef]
- Jhu, C.Y.; Wang, Y.W.; Wen, C.Y.; Shu, C.M. Thermal runaway potential of LiCoO2 and Li(Ni1/3Co1/3Mn1/3)O2 batteries determined with adiabatic calorimetry methodology. Appl. Energy 2012, 100, 127–131. [Google Scholar] [CrossRef]
- Feng, X.; Ouyang, M.; Liu, X.; Lu, L.; Xia, Y.; He, X. Thermal runaway mechanism of lithium ion battery for electric vehicles: A review. Energy Storage Mater. 2018, 10, 246–267. [Google Scholar] [CrossRef]
- Scharf, B.; Clement, C.C.; Zolla, V.; Perino, G.; Yan, B.; Elci, S.G.; Purdue, E.; Goldring, S.; MacAluso, F.; Cobelli, N.; et al. Molecular analysis of chromium and cobalt-related toxicity. Sci. Rep. 2014, 4, 5729. [Google Scholar] [CrossRef] [Green Version]
- Sironval, V.; Reylandt, L.; Chaurand, P.; Ibouraadaten, S.; Palmai-Pallag, M.; Yakoub, Y.; Ucakar, B.; Rose, J.; Poleunis, C.; Vanbever, R.; et al. Respiratory hazard of Li-ion battery components: Elective toxicity of lithium cobalt oxide (LiCoO2) particles in a mouse bioassay. Arch. Toxicol. 2018, 92, 1673–1684. [Google Scholar] [CrossRef] [PubMed]
- Michalska, M.; Ziółkowska, D.A.; Jasiński, J.B.; Lee, P.H.; Ławniczak, P.; Andrzejewski, B.; Ostrowski, A.; Bednarski, W.; Wu, S.H.; Lin, J.Y. Improved electrochemical performance of LiMn2O4 cathode material by Ce doping. Electrochim. Acta 2018, 276, 37–46. [Google Scholar] [CrossRef]
- Zhu, Q.; Zheng, S.; Lu, X.; Wan, Y.; Chen, Q.; Yang, J.; Zhang, L.Z.; Lu, Z. Improved cycle performance of LiMn2O4 cathode material for aqueous rechargeable lithium battery by LaF3 coating. J. Alloys Compd. 2016, 654, 384–391. [Google Scholar] [CrossRef]
- Cai, Z.; Ma, Y.; Huang, X.; Yan, X.; Yu, Z.; Zhang, S.; Song, G.; Xu, Y.; Wen, C.; Yang, W. High electrochemical stability Al-doped spinel LiMn2O4 cathode material for Li-ion batteries. J. Energy Storage 2020, 27, 101036. [Google Scholar] [CrossRef]
- Yoon, C.S.; Kim, U.H.; Park, G.T.; Kim, S.J.; Kim, K.H.; Kim, J.; Sun, Y.K. Self-Passivation of a LiNiO2 Cathode for a Lithium-Ion Battery through Zr Doping. ACS Energy Lett. 2018, 3, 1634–1639. [Google Scholar] [CrossRef]
- Li, M.; Lu, J. Cobalt in lithium-ion batteries. Science 2020, 367, 979–980. [Google Scholar] [CrossRef]
- Yang, H.; Savory, C.N.; Morgan, B.J.; Scanlon, D.O.; Skelton, J.M.; Walsh, A. Chemical Trends in the Lattice Thermal Conductivity of Li(Ni, Mn, Co)O2(NMC) Battery Cathodes. Chem. Mater. 2020, 32, 7542–7550. [Google Scholar] [CrossRef]
- Olivetti, E.A.; Ceder, G.; Gaustad, G.G.; Fu, X. Lithium-Ion Battery Supply Chain Considerations: Analysis of Potential Bottlenecks in Critical Metals. Joule 2017, 1, 229–243. [Google Scholar] [CrossRef] [Green Version]
- Pelegov, D.V.; Pontes, J. Main drivers of battery industry changes: Electric vehicles—A market overview. Batteries 2018, 4, 65. [Google Scholar] [CrossRef] [Green Version]
- Yudha, C.S.; Muzayanha, S.U.; Hendri, W.; Iskandar, F.; Sutopo, W.; Purwanto, A.; Widiyandari, H.; Iskandar, F.; Sutopo, W.; Purwanto, A. Synthesis of LiNi0.85Co0.14Al0.01O2 Cathode Material and its Performance in an NCA/Graphite Full-Battery. Energies 2019, 12, 1886. [Google Scholar] [CrossRef] [Green Version]
- Hamad, K.I.; Xing, Y. Stabilizing Li-rich NMC materials by using precursor salts with acetate and nitrate anions for Li-ion batteries. Batteries 2019, 5, 69. [Google Scholar] [CrossRef] [Green Version]
- Zha, G.; Hu, W.; Agarwal, S.; Ouyang, C.; Hu, N.; Hou, H. High performance layered LiNi0.8Co0.07Fe0.03Mn0.1O2 cathode materials for Li-ion battery. Chem. Eng. J. 2021, 409, 128343. [Google Scholar] [CrossRef]
- Dong, H.; Koenig, G.M. A review on synthesis and engineering of crystal precursors produced: Via coprecipitation for multicomponent lithium-ion battery cathode materials. Cryst. Eng. Comm. 2020, 22, 1514–1530. [Google Scholar] [CrossRef]
- Yin, K.; Fang, W.; Zhong, B.; Guo, X.; Tang, Y.; Nie, X. The effects of precipitant agent on structure and performance of LiNi1/3Co1/3Mn1/3O2 cathode material via a carbonate co-precipitation method. Electrochim. Acta 2012, 85, 99–103. [Google Scholar] [CrossRef]
- Zhang, S.; Deng, C.; Yang, S.Y.; Niu, H. An improved carbonate co-precipitation method for the preparation of spherical Li[Ni1/3Co1/3 Mn1/3]O2 cathode material. J. Alloys Compd. 2009, 484, 519–523. [Google Scholar] [CrossRef]
- Li, J.; Li, H.; Stone, W.; Weber, R.; Hy, S.; Dahn, J.R. Synthesis of Single Crystal LiNi0.5Mn0.3Co0.2O2 for Lithium Ion Batteries. J. Electrochem. Soc. 2017, 164, A3529–A3537. [Google Scholar] [CrossRef]
- Eilers-Rethwisch, M.; Winter, M.; Schappacher, F.M. Synthesis, electrochemical investigation and structural analysis of doped Li[Ni0.6Mn0.2Co0.2-xMx]O2 (x = 0, 0.05; M = Al, Fe, Sn) cathode materials. J. Power Sources 2018, 387, 101–107. [Google Scholar] [CrossRef]
- Zhang, N.; Li, J.; Li, H.; Liu, A.; Huang, Q.; Ma, L.; Li, Y.; Dahn, J.R. Structural, Electrochemical, and Thermal Properties of Nickel-Rich LiNixMnyCozO2 Materials. Chem. Mater. 2018, 30, 8852–8860. [Google Scholar] [CrossRef]
- Xu, L.; Zhou, F.; Kong, J.; Chen, Z.; Chen, K. Synthesis of Li(Ni0.6Co0.2Mn0.2)O2 with sodium DL-lactate as an eco-friendly chelating agent and its electrochemical performances for lithium-ion batteries. Ionics 2018, 24, 2261–2273. [Google Scholar] [CrossRef]
- Yang, Z.; Lu, J.; Bian, D.; Zhang, W.; Yang, X.; Xia, J.; Chen, G.; Gu, H.; Ma, G. Stepwise co-precipitation to synthesize LiNi1/3Co1/3Mn1/3O2one-dimensional hierarchical structure for lithium ion batteries. J. Power Sources 2014, 272, 144–151. [Google Scholar] [CrossRef]
- Zhu, J.; Yan, J.; Zhang, L. High specific capacity Mg-doping LiNi1/3Mn1/3Co1/3O2 cathode materials synthesised by a simple stepwise co-precipitation method. Micro Nano Lett. 2019, 14, 129–132. [Google Scholar] [CrossRef]
- Yao, X.; Xu, Z.; Yao, Z.; Cheng, W.; Gao, H.; Zhao, Q.; Li, J.; Zhou, A. Oxalate co-precipitation synthesis of LiNi0.6Co0.2Mn0.2O2 for low-cost and high-energy lithium-ion batteries. Mater. Today Commun. 2019, 19, 262–270. [Google Scholar] [CrossRef]
- Wu, C.Y.; Bao, Q.; Tsai, Y.T.; Duh, J.G. Tuning (003) interplanar space by boric acid co-sintering to enhance Li+ storage and transfer in Li(Ni0.8Co0.1Mn0.1)O2 cathode. J. Alloys Compd. 2021, 865, 158806. [Google Scholar] [CrossRef]
- Amutha, R.; Akilandeswari, S.; Muruganandham, M.; Sillanpää, M.; Ahmmad, B.; Ohkubo, T. Template-free synthesis of self-assembled Co3O4 micro/nanocrystals. J. Nanosci. Nanotechnol. 2011, 11, 3171–3179. [Google Scholar] [CrossRef]
- Dong, H.; Koenig, G.M. Compositional control of precipitate precursors for lithium-ion battery active materials: Role of solution equilibrium and precipitation rate. J. Mater. Chem. A 2017, 5, 13785–13798. [Google Scholar] [CrossRef]
- Oh, H.J.; Jo, C.H.; Yoon, C.S.; Yashiro, H.; Kim, S.J.; Passerini, S.; Sun, Y.K.; Myung, S.T. Nickel oxalate dihydrate nanorods attached to reduced graphene oxide sheets as a high-capacity anode for rechargeable lithium batteries. NPG Asia Mater. 2016, 8, e270. [Google Scholar] [CrossRef] [Green Version]
- Tang, W.; Wu, X.; Li, D.; Wang, Z.; Liu, G.; Liu, H.; Chen, Y. Oxalate route for promoting activity of manganese oxide catalysts in total VOCs’ oxidation: Effect of calcination temperature and preparation method. J. Mater. Chem. A 2014, 2, 2544–2554. [Google Scholar] [CrossRef]
- Nayaka, G.P.; Zhang, Y.; Dong, P.; Wang, D.; Zhou, Z.; Duan, J.; Li, X.; Lin, Y.; Meng, Q.; Pai, K.V.; et al. An environmental friendly attempt to recycle the spent Li-ion battery cathode through organic acid leaching. J. Environ. Chem. Eng. 2019, 7, 102854. [Google Scholar] [CrossRef]
- Dhayal Raj, A.; Suresh Kumar, P.; Mangalaraj, D.; Ponpandian, N.; Albert Irudayaraj, A.; Yang, Q. Gas sensing behavior of high surface area Co3O4 Micro/Nano structures synthesized by simple sonication process. Sens. Lett. 2012, 10, 826–832. [Google Scholar] [CrossRef]
- Nandiyanto, A.B.D.; Oktiani, R.; Ragadhita, R. How to read and interpret ftir spectroscope of organic material. Indones. J. Sci. Technol. 2019, 4, 97–118. [Google Scholar] [CrossRef]
- Jung, I.; Choi, J.; Tak, Y. Nickel oxalate nanostructures for supercapacitors. J. Mater. Chem. 2010, 20, 6164–6169. [Google Scholar] [CrossRef]
- Małecka, B.; Małecki, A.; Drozdz-Cieśla, E.; Tortet, L.; Llewellyn, P.; Rouquerol, F. Some aspects of thermal decomposition of NiC2O4·2H2O. Thermochim. Acta 2007, 466, 57–62. [Google Scholar] [CrossRef]
- Shen, B.B.; Shen, H.; Pan, Y.; Chen, T. The Thermal Decomposition of NiC2O4 2H2O: An In situ TP-XRD and TGA/FT-IR Study. Oldenbourg Wissenschaftsverlag 2001, 1418, 1413–1418. [Google Scholar] [CrossRef]
- Zhan, D.; Cong, C.; Diakite, K.; Tao, Y.; Zhang, K. Kinetics of thermal decomposition of nickel oxalate dihydrate in air. Thermochim. Acta 2005, 430, 101–105. [Google Scholar] [CrossRef]
- Langdon, J.; Manthiram, A. A perspective on single-crystal layered oxide cathodes for lithium-ion batteries. Energy Storage Mater. 2021, 37, 143–160. [Google Scholar] [CrossRef]
- Murali, N.; Babu, K.V.; Babu, K.E.; Veeraiah, V. Structural characterization of LiNiO2 and LiNi0.96Mg0.04O2 cathode materials. J. Appl. Chem. 2014, 3, 1202–1207. [Google Scholar]
- Kalyani, P.; Kalaiselvi, N.; Renganathan, N.G.; Raghavan, M. Studies on LiNi0.7Al0.3-xCoxO2 solid solutions as alternative cathode materials for lithium batteries. Mater. Res. Bull. 2004, 39, 41–54. [Google Scholar] [CrossRef]
- Sathiyaraj, K.; Gangulibabu; Bhuvaneswari, D.; Kalaiselvi, N. Effect of reaction temperature on morphology and electrochemical behavior: A comparative study on hydrothermal and co-precipitation synthesis of LiCoO2 and LiMn2O4 using same set of precursors. Ionics 2011, 17, 49–59. [Google Scholar] [CrossRef]
- Zhu, J.; Vo, T.; Li, D.; Lu, R.; Kinsinger, N.M.; Xiong, L.; Yan, Y.; Kisailus, D. Crystal Growth of Li[Ni1/3Co1/3Mn1/3]O2 as a Cathode Material for High-Performance Lithium Ion Batteries. Cryst. Growth Des. 2012, 12, 1–6. [Google Scholar] [CrossRef]
- Wu, K.; Wang, F.; Gao, L.; Li, M.R.; Xiao, L.; Zhao, L.; Hu, S.; Wang, X.; Xu, Z.; Wu, Q. Effect of precursor and synthesis temperature on the structural and electrochemical properties of Li(Ni0.5Co0.2Mn0.3)O2. Electrochim. Acta 2012, 75, 393–398. [Google Scholar] [CrossRef]
- Kim, H.; Kim, S.B.; Park, D.H.; Park, K.W. Fluorine-doped LiNi0.8Mn0.1Co0.1O2 cathode for high-performance lithium-ion batteries. Energies 2020, 13, 4808. [Google Scholar] [CrossRef]
- Julien, C.; Mauger, A.; Zaghib, K.; Groult, H. Optimization of layered cathode materials for lithium-ion batteries. Materials 2016, 9, 595. [Google Scholar] [CrossRef] [Green Version]
- Aregai, T.; Babu, K.V.; Babu, B.V.; Veeraiah, V. Effect of calcination and sintering temperature on the properties of layered LiNi1/3Co1/3Mn1/3O2 cathode material for lithium-ion batteries. Int. J. ChemTech Res. 2017, 10, 479–489. [Google Scholar] [CrossRef]
- Qiu, Z.; Zhang, Y.; Dong, P.; Xia, S.; Yao, Y. A facile method for synthesis of LiNi0.8Co0.15Al0.05O2 cathode material. Solid State Ionics 2017, 307, 73–78. [Google Scholar] [CrossRef]
- Teichert, P.; Eshetu, G.G.; Jahnke, H.; Figgemeier, E. Degradation and aging routes of ni-rich cathode based Li-ion batteries. Batteries 2020, 6, 8. [Google Scholar] [CrossRef] [Green Version]
- Bak, S.; Hu, E.; Zhou, Y.; Yu, X.; Senanayake, S.D.; Cho, S.; Kim, K.; Chung, K.Y.; Yang, X.; Nam, K. Structural Changes and Thermal Stability of Charged LiNi. Appl. Mater. Interfaces 2014, 6, 22594–22601. [Google Scholar] [CrossRef]
- Schmidt, D.; Kamlah, M.; Knoblauch, V. Highly densified NCM-cathodes for high energy Li-ion batteries: Microstructural evolution during densification and its influence on the performance of the electrodes. J. Energy Storage 2018, 17, 213–223. [Google Scholar] [CrossRef]
- Liang, L.; Du, K.; Peng, Z.; Cao, Y.; Duan, J.; Jiang, J.; Hu, G. Co-precipitation synthesis of Ni0.6Co0.2Mn0.2(OH)2 precursor and characterization of LiNi0.6Co0.2Mn0.2O2 cathode material for secondary lithium batteries. Electrochim. Acta 2014, 130, 82–89. [Google Scholar] [CrossRef]
- Fu, C.; Zhou, Z.; Liu, Y.; Zhang, Q.; Zheng, Y.; Li, G. Synthesis and electrochemical properties of Mg-doped LiNi 0.6Co0.2Mn0.2O2 cathode materials for Li-ion battery. J. Wuhan Univ. Technol. Mater. Sci. Ed. 2011, 26, 211–215. [Google Scholar] [CrossRef]
- Ronduda, H.; Zybert, M.; Szczęsna-Chrzan, A.; Trzeciak, T.; Ostrowski, A.; Szymański, D.; Wieczorek, W.; Raróg-Pilecka, W.; Marcinek, M. On the sensitivity of the ni-rich layered cathode materials for Li-ion batteries to the different calcination conditions. Nanomaterials 2020, 10, 2018. [Google Scholar] [CrossRef]
- Lee, S.W.; Kim, H.; Kim, M.S.; Youn, H.C.; Kang, K.; Cho, B.W.; Roh, K.C.; Kim, K.B. Improved electrochemical performance of LiNi0.6Co0.2Mn0.2O2 cathode material synthesized by citric acid assisted sol-gel method for lithium ion batteries. J. Power Sources 2016, 315, 261–268. [Google Scholar] [CrossRef]
- Sun, H.H.; Manthiram, A. Impact of microcrack generation and surface degradation on a nickel-rich layered Li[Ni0.9Co0.05Mn0.05]O2 Cathode for Lithium-Ion Batteries. Chem. Mater. 2017, 29, 8486–8493. [Google Scholar] [CrossRef]
- He, Y. Deterioration mechanism of LiNi0.8Co0.15Al0.05O2/graphite–SiOx power batteries under high temperature and discharge cycling conditions. J. Mater. Chem. A Mater. Energy Sustain. 2017, 6, 65–72. [Google Scholar] [CrossRef]
- Chen, T.; Li, X.; Wang, H.; Yan, X.; Wang, L.; Deng, B.; Ge, W.; Qu, M. The effect of gradient boracic polyanion-doping on structure, morphology, and cycling performance of Ni-rich LiNi0.8Co0.15Al0.05O2 cathode material. J. Power Sources 2018, 374, 1–11. [Google Scholar] [CrossRef]




| Materials | Coprecipitation (°C) | Pre-Sintering (oC) | Sintering (°C) | Total Times (h) | Ref. |
|---|---|---|---|---|---|
| Carbonate Coprecipitation | |||||
| NMC333 | - | 500 | 900 | 22 | [25] |
| NMC333 | 40 | 500 | 850 | 29 | [26] |
| 500 | 950 | ||||
| Hydroxide Coprecipitation | |||||
| NMC532 | 60 | - | 950 | 32 | [27] |
| NMC622 | - | 480 | 850 | 33 | [28] |
| NMC622 | 60 | - | 920 | 32 | [29] |
| NMC622 | - | 500 | 850 | 42 | [30] |
| NMC811 | 60 | - | 780 | 32 | [29] |
| Oxalate Coprecipitation | |||||
| NMC333 | 65 | 480 | 850 | 52 | [31] |
| NMC333 | - | 500 | 850 | 26 | [32] |
| NMC622 | 60 | 500 | 850 | 31 | [33] |
| NMC811 | 150 (hot plate) | 500 | 750 | 38 | [34] |
| LiNixMnyCozO2 (x ≤ 0.8, y ≥ 0.1, z ≥ 0.1) | 60 | 600 | 800 | 18.5 | This work |
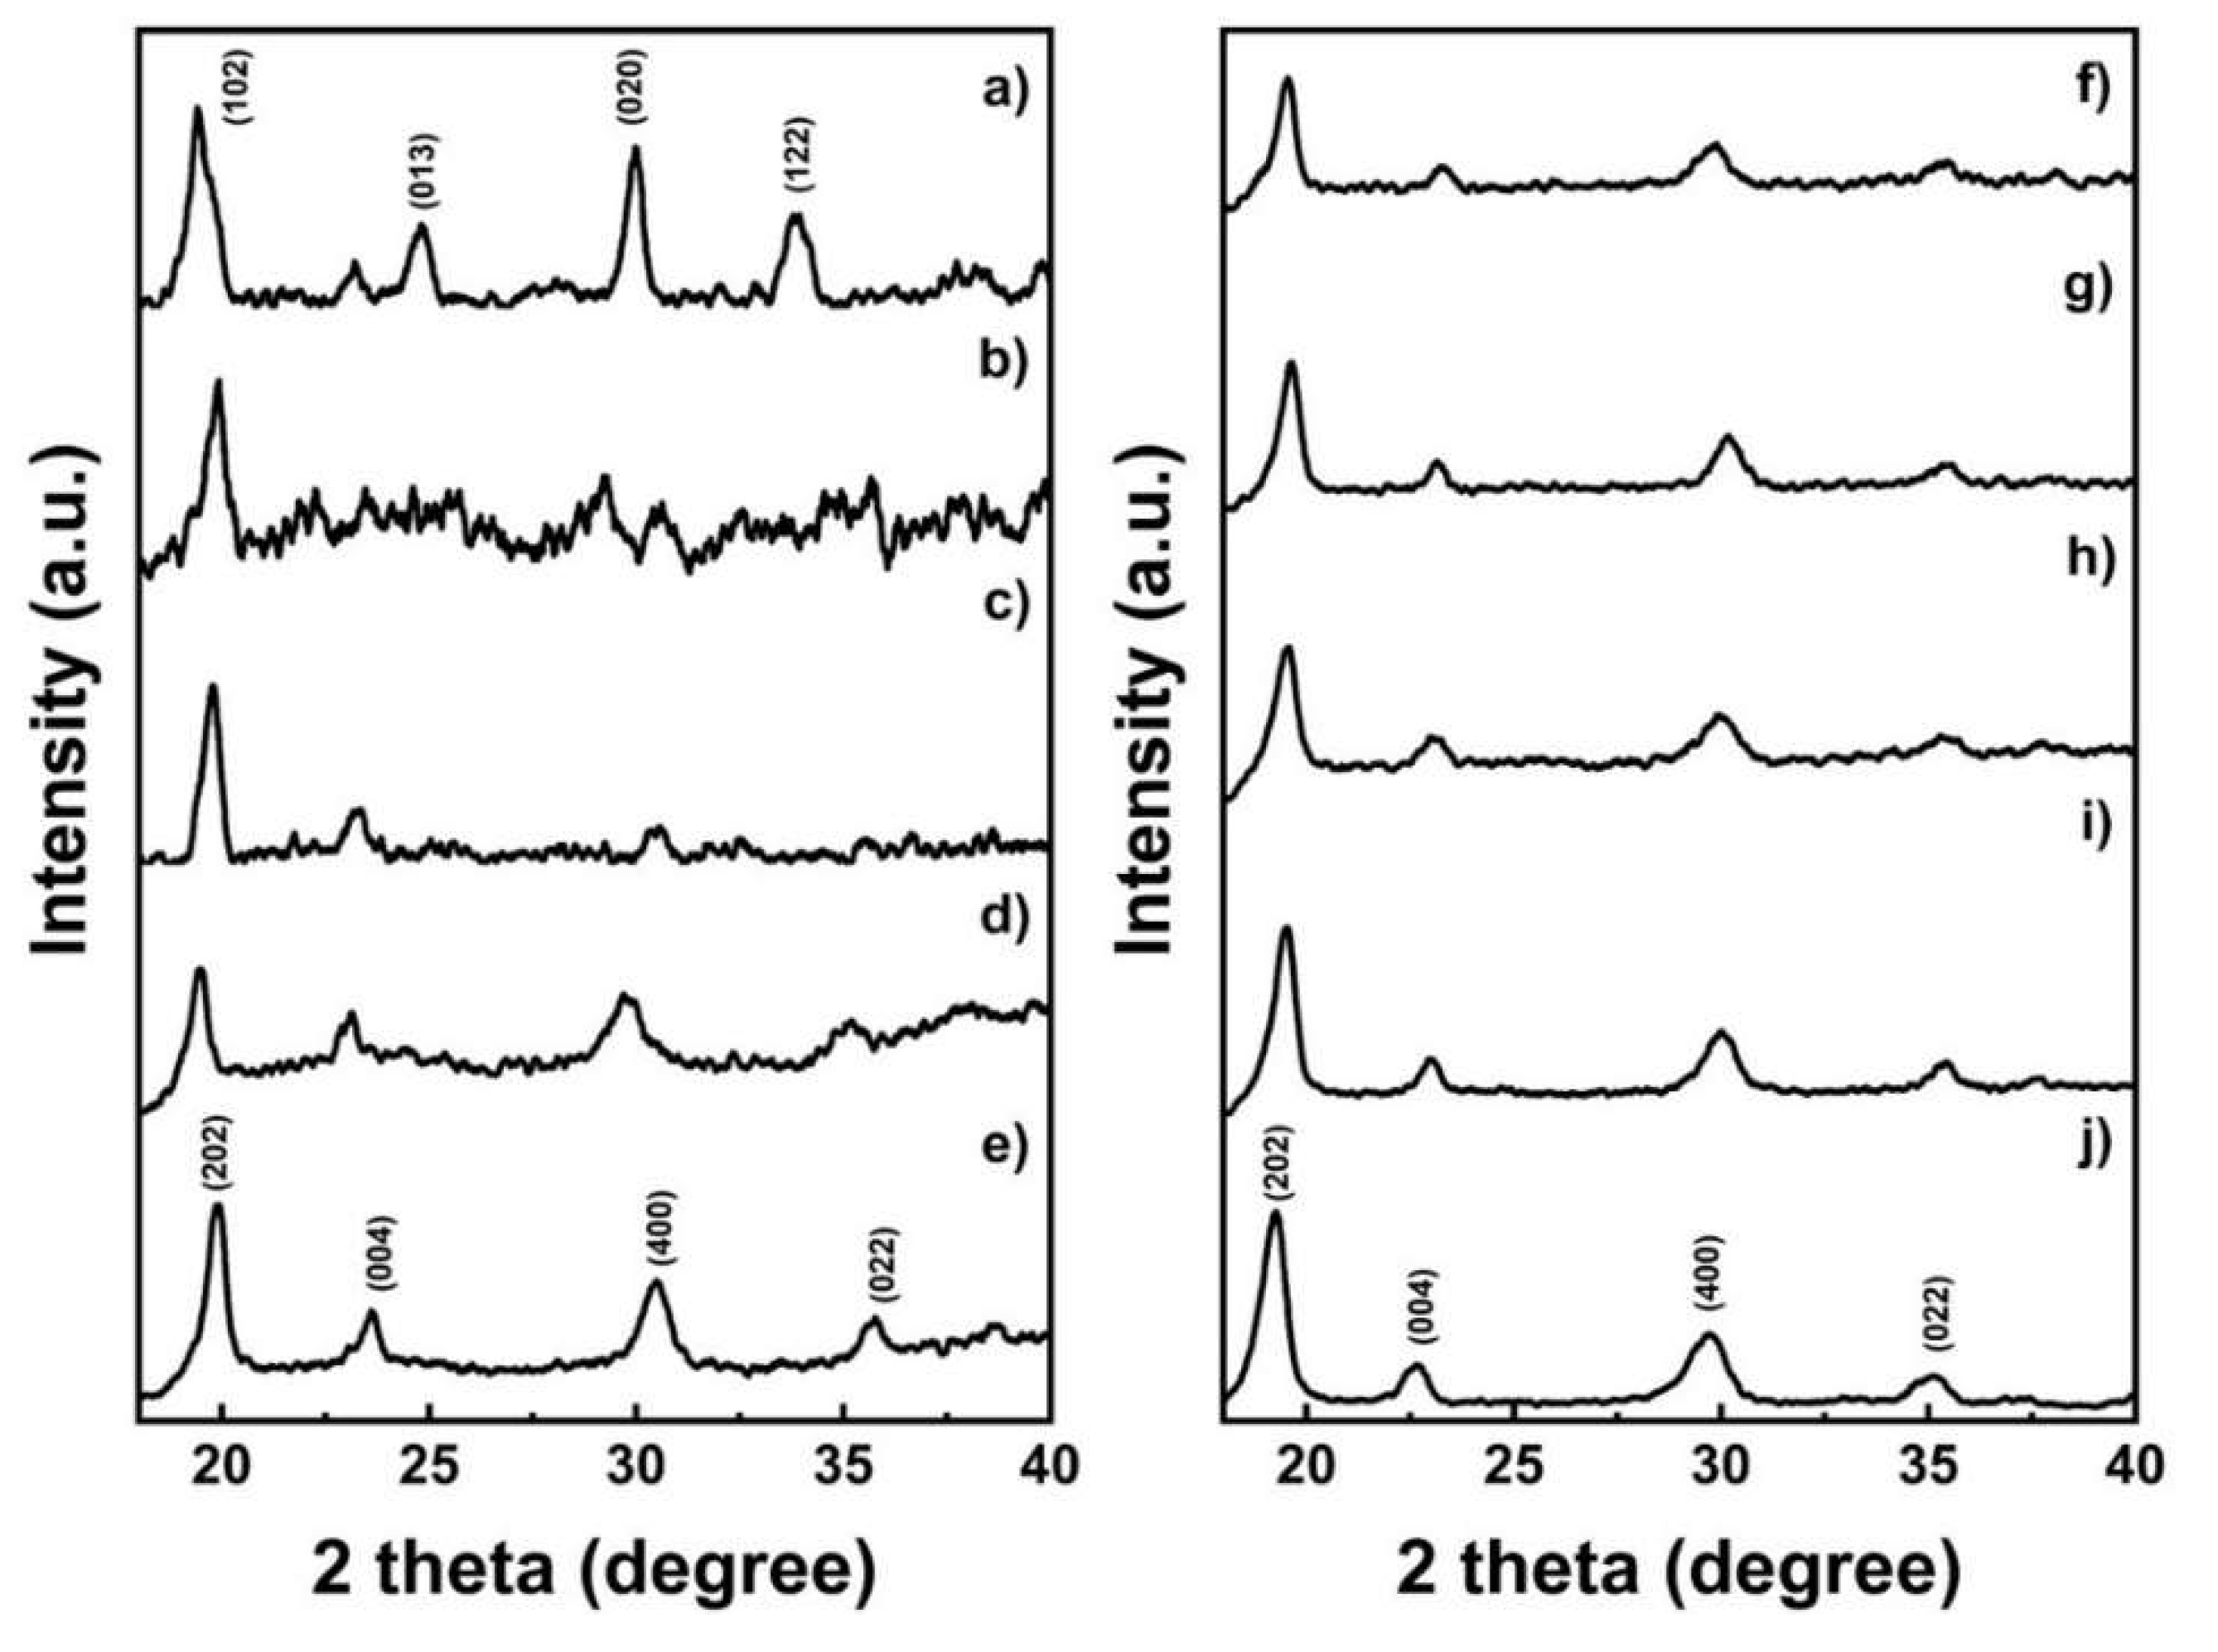
| Sample | a (Å) | b (Å) | c (Å) |
|---|---|---|---|
| MnOX | 13.64 | 3.91 | 12.29 |
| CoOX | 12.22 | 5.30 | 15.99 |
| NMCOX 333 | 11.76 | 5.49 | 15.21 |
| NMCOX 424 | 12.04 | 5.37 | 15.16 |
| NMCOX 442 | 11.95 | 5.44 | 15.40 |
| NMCOX 523 | 11.95 | 5.40 | 15.29 |
| NMCOX 532 | 11.84 | 5.36 | 15.36 |
| NMCOX 622 | 12.24 | 5.35 | 15.37 |
| NMCOX 811 | 11.92 | 5.37 | 15.47 |
| NiOX | 12.04 | 5.41 | 15.72 |
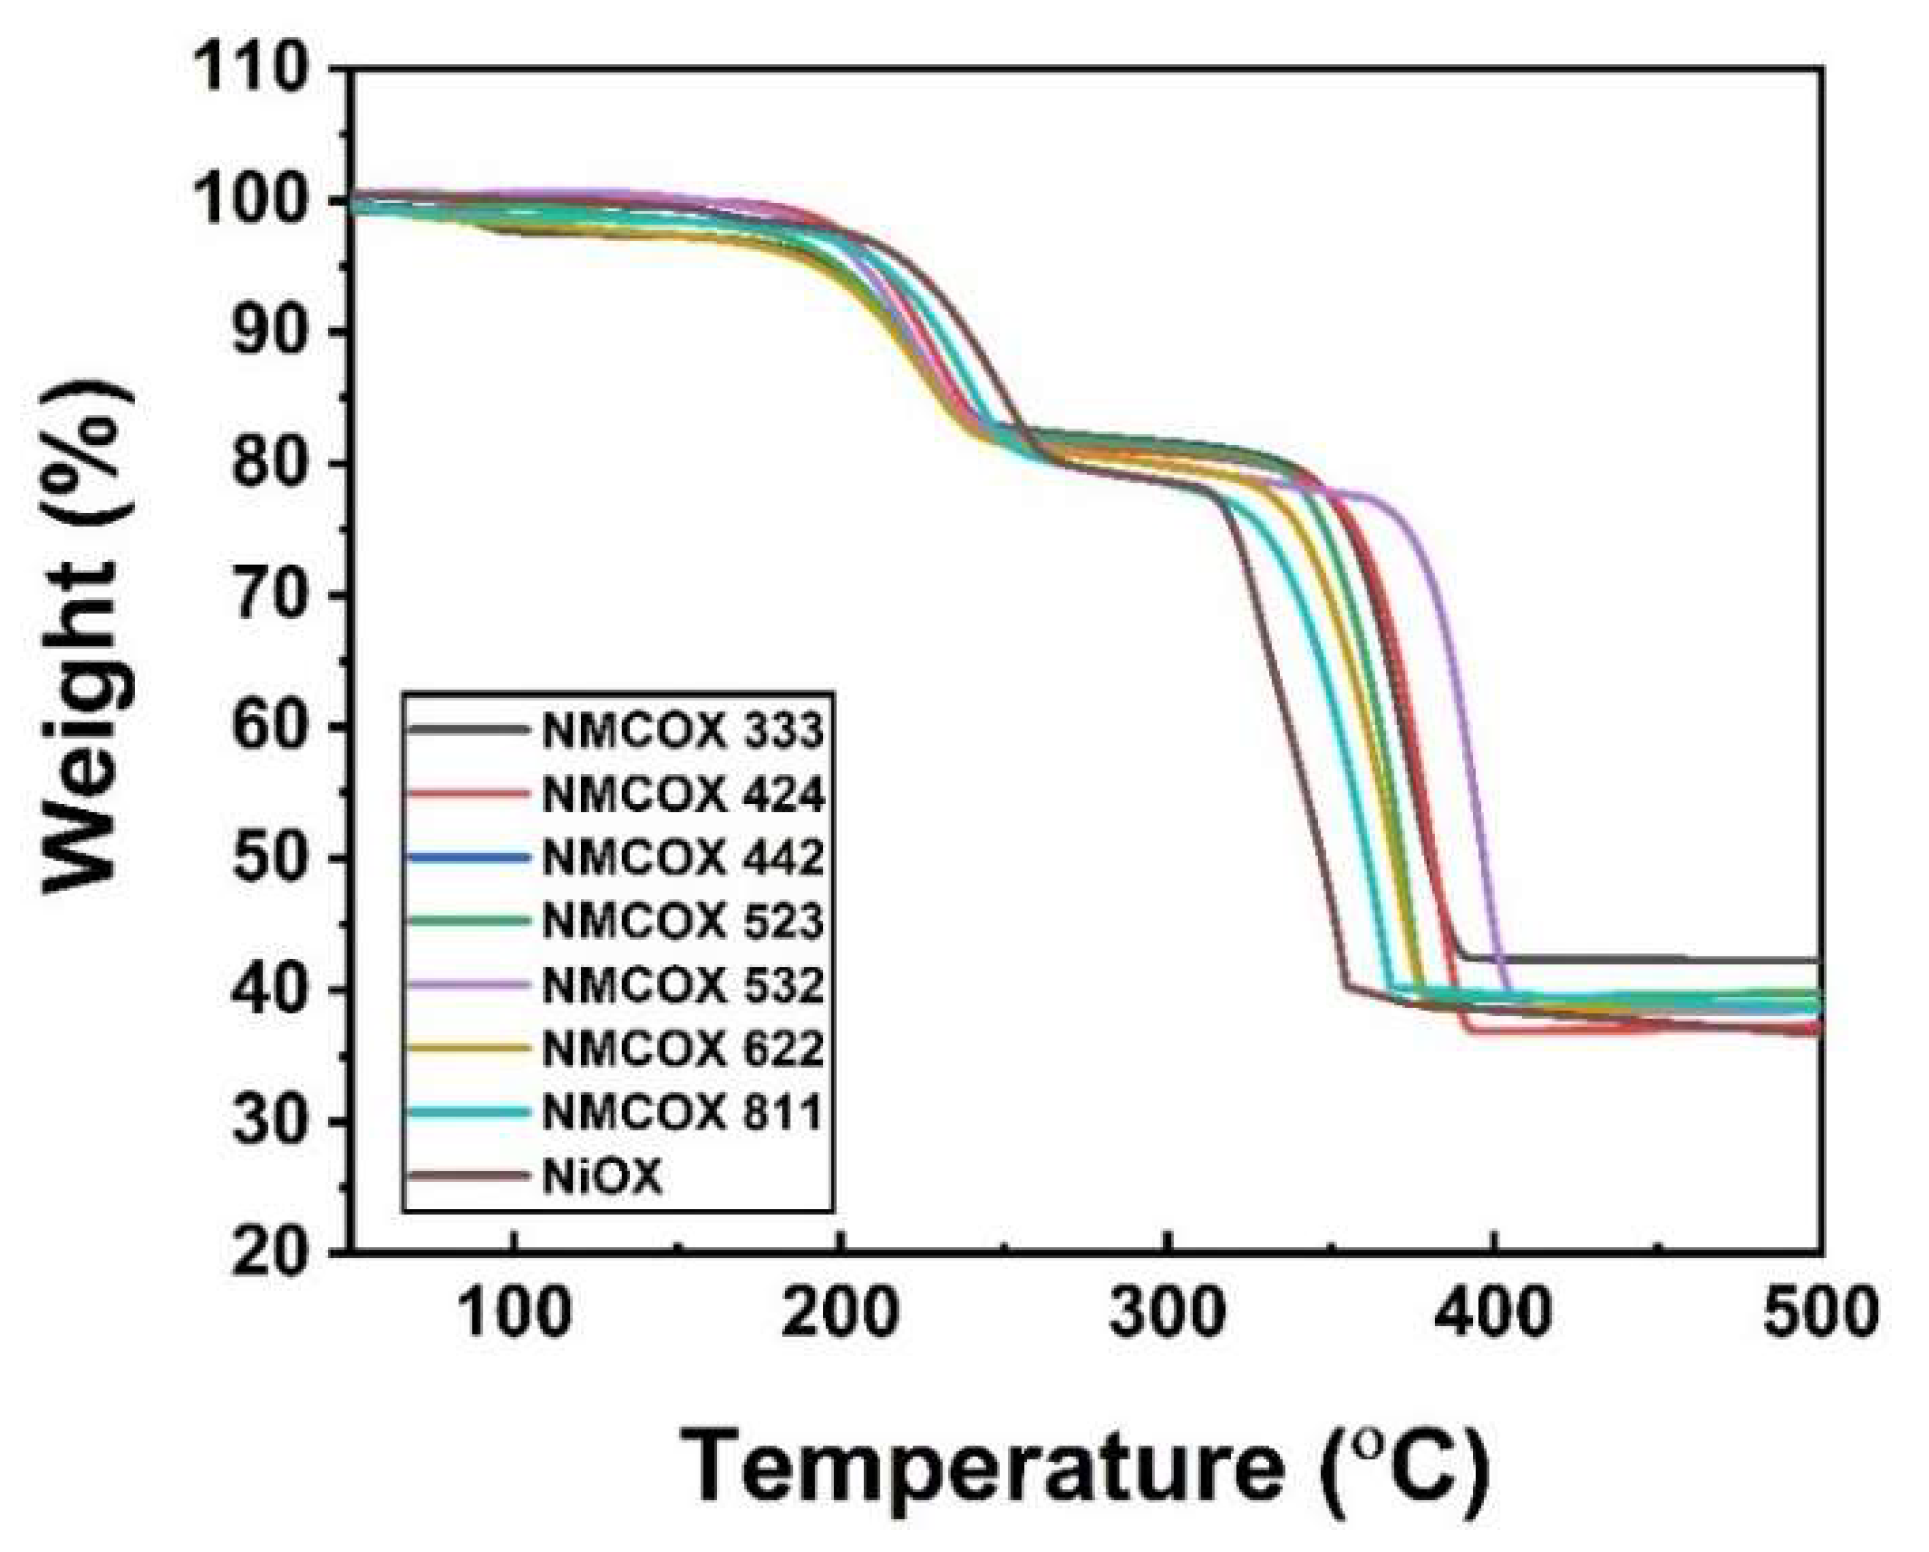
| Sample | Dehydration (°C) | Decomposition (°C) | Ref. |
|---|---|---|---|
| NiC2O4·2H2O | 200–227 | 321–350 | [43] |
| NiC2O4·2H2O | 120–260 | 309–375 | [44] |
| NiC2O4·2H2O | 196–284 | 316–365 | [45] |
| NiC2O4·2H2O and NMCC2O4·2H2O | 200–250 | 320–400 | This work |
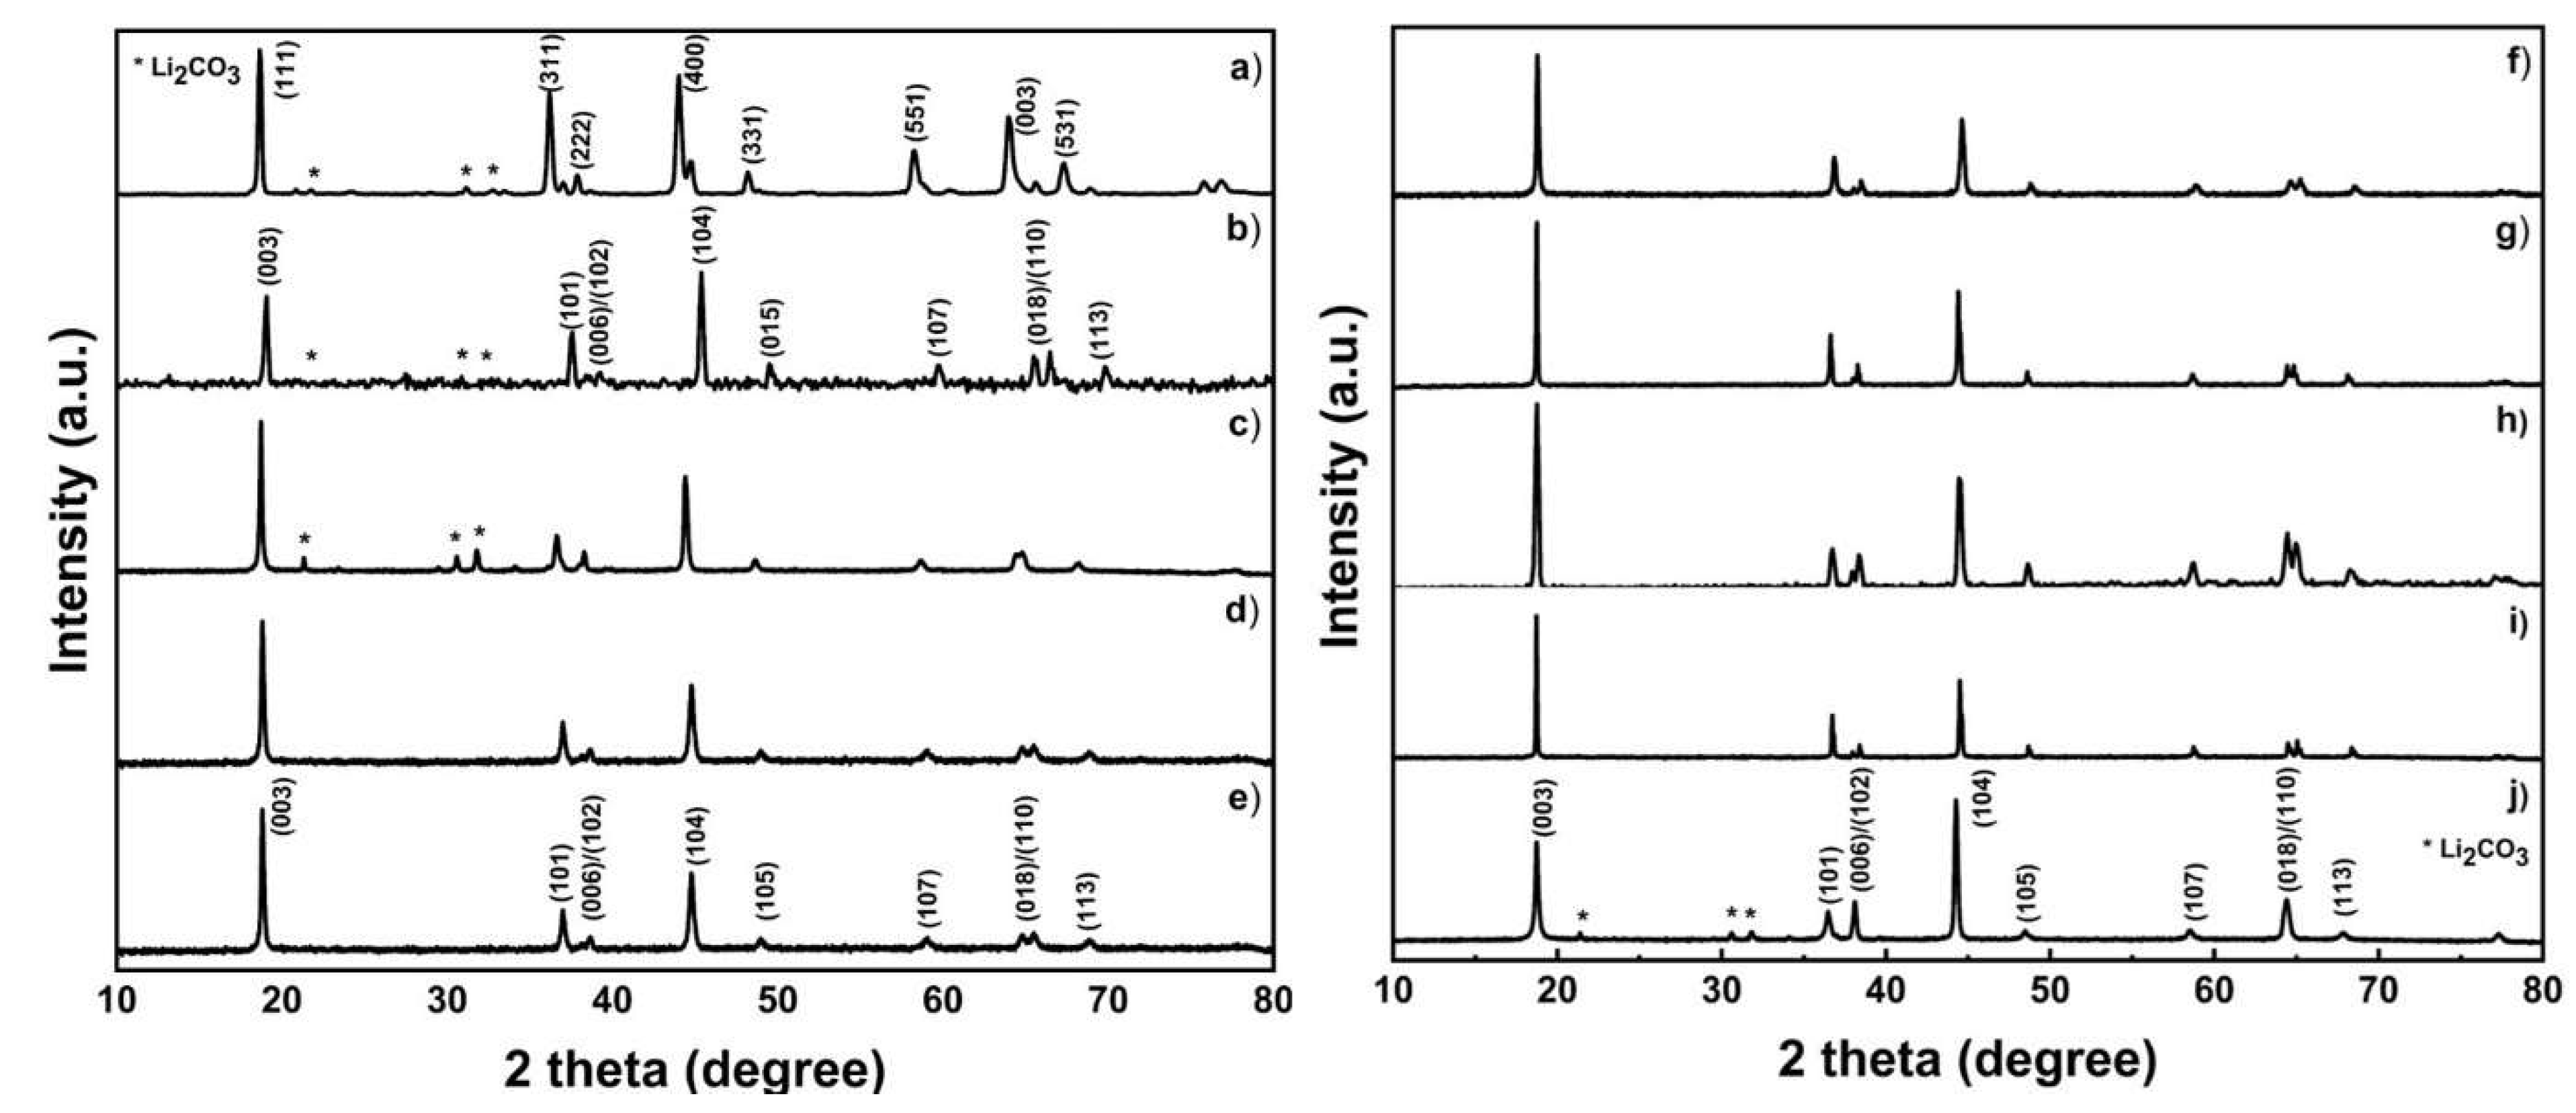
| Sample | a (Å) | c (Å) | c/a | Volume (Å)3 | IR | R |
|---|---|---|---|---|---|---|
| LMO | 8.223 | 8.223 | 1.000 | 556.020 | 1.420 | |
| LCO | 2.849 | 14.170 | 4.974 | 298.758 | 0.744 | 0.314 |
| NMC 333 | 2.874 | 14.156 | 4.925 | 303.834 | 1.467 | 0.410 |
| NMC 424 | 2.845 | 14.142 | 4.971 | 297.364 | 1.430 | 0.399 |
| NMC 442 | 2.845 | 14.100 | 4.957 | 296.428 | 1.437 | 0.441 |
| NMC 523 | 2.849 | 14.170 | 4.974 | 299.922 | 1.571 | 0.372 |
| NMC 532 | 2.873 | 14.156 | 4.930 | 303.558 | 1.633 | 0.366 |
| NMC 622 | 2.865 | 14.170 | 4.946 | 302.167 | 1.430 | 0.313 |
| NMC 811 | 2.865 | 14.257 | 4.976 | 304.004 | 1.582 | 0.459 |
| LNO | 2.887 | 14.185 | 4.913 | 307.211 | 1.530 | 0.253 |
| Sample | Primary Particle (µm) | Secondary Particle (µm) |
|---|---|---|
| LMO | 0.2–0.8 | - |
| LCO | 0.4–0.8 | 6–10 |
| NMC 333 | 0.09–0.3 | 2–5 |
| NMC 424 | 0.2–0.3 | 1–5 |
| NMC 442 | 0.09–0.4 | 1–3 |
| NMC 523 | 0.4–1.0 | 3–5 |
| NMC 532 | 0.1–0.2 | 3–5 |
| NMC 622 | 0.6–1.5 | 3–7 |
| NMC 811 | 0.1–0.2 | 3–7 |
| LNO | 0.2–0.7 | 3–8 |
| No | Samples | Ni (Atom%) | Mn (Atom%) | Co (Atom%) |
|---|---|---|---|---|
| 1. | NMC 333 | 38.86 | 25.91 | 35.22 |
| 2. | NMC 424 | 41.70 | 18.00 | 40.30 |
| 3. | NMC 442 | 41.34 | 39.94 | 18.72 |
| 4. | NMC 523 | 52.96 | 15.36 | 31.68 |
| 5. | NMC 532 | 54.21 | 24.80 | 20.98 |
| 6. | NMC 622 | 59.80 | 18.85 | 21.35 |
| 7. | NMC 811 | 81.26 | 8.03 | 10.71 |
| Electrode | Methods | Electrochemical Performance (Capacity (mAh/g), Cycle, Rate) | Ref. |
|---|---|---|---|
| NMC622 vs. Li metal | Hydroxide coprecipitation | 172 mAh/g, 94% after 100 cycles at 1 C, 143 mAh/g at 10 C | [59] |
| NMC622 vs. Li metal | Hydroxide coprecipitation | 201 mAh/g, 78% after 100 cycles at 0.1 C, ~120 mAh/g at 5 C | [30] |
| NMC622 vs. Li metal | Carbonate coprecipitation | 155 mAh/g, 96% after 30 cycles at 0.5 C, - | [60] |
| NMC622 vs. Li metal | Carbonate coprecipitation | 186 mAh/g, 95% after 10 cycles at 0.5 C, ~50 mAh/g at 5 C | [61] |
| NMC622 vs. Li metal | Sol–gel | 174 mAh/g, 87% after 100 cycles at 1 C, ~70 mAh/g at 10 C | [62] |
| NMC622 vs. Li metal | Hydroxide coprecipitation | 188 mAh/g, 96% after 100 cycles at 0.5 C, ~140 mAh/g at 5 C | [63] |
| NMC622 vs. MCMB | Oxalate coprecipitation | 153.6 mAh/g, 70.9% after 100 cycles at 1 C, 140 mAh/g at 2 C | This work |
Publisher’s Note: MDPI stays neutral with regard to jurisdictional claims in published maps and institutional affiliations. |
© 2022 by the authors. Licensee MDPI, Basel, Switzerland. This article is an open access article distributed under the terms and conditions of the Creative Commons Attribution (CC BY) license (https://creativecommons.org/licenses/by/4.0/).
Share and Cite
Nisa, S.S.; Rahmawati, M.; Yudha, C.S.; Nilasary, H.; Nursukatmo, H.; Oktaviano, H.S.; Muzayanha, S.U.; Purwanto, A. A Fast Approach to Obtain Layered Transition-Metal Cathode Material for Rechargeable Batteries. Batteries 2022, 8, 4. https://doi.org/10.3390/batteries8010004
Nisa SS, Rahmawati M, Yudha CS, Nilasary H, Nursukatmo H, Oktaviano HS, Muzayanha SU, Purwanto A. A Fast Approach to Obtain Layered Transition-Metal Cathode Material for Rechargeable Batteries. Batteries. 2022; 8(1):4. https://doi.org/10.3390/batteries8010004
Chicago/Turabian StyleNisa, Shofirul Sholikhatun, Mintarsih Rahmawati, Cornelius Satria Yudha, Hanida Nilasary, Hartoto Nursukatmo, Haryo Satriya Oktaviano, Soraya Ulfa Muzayanha, and Agus Purwanto. 2022. "A Fast Approach to Obtain Layered Transition-Metal Cathode Material for Rechargeable Batteries" Batteries 8, no. 1: 4. https://doi.org/10.3390/batteries8010004
APA StyleNisa, S. S., Rahmawati, M., Yudha, C. S., Nilasary, H., Nursukatmo, H., Oktaviano, H. S., Muzayanha, S. U., & Purwanto, A. (2022). A Fast Approach to Obtain Layered Transition-Metal Cathode Material for Rechargeable Batteries. Batteries, 8(1), 4. https://doi.org/10.3390/batteries8010004


