
Enhancing the LCO 18,650 Battery Charging/Discharging Using Temperature and Electrical Based Model


Abstract
:1. Introduction
2. Methodology
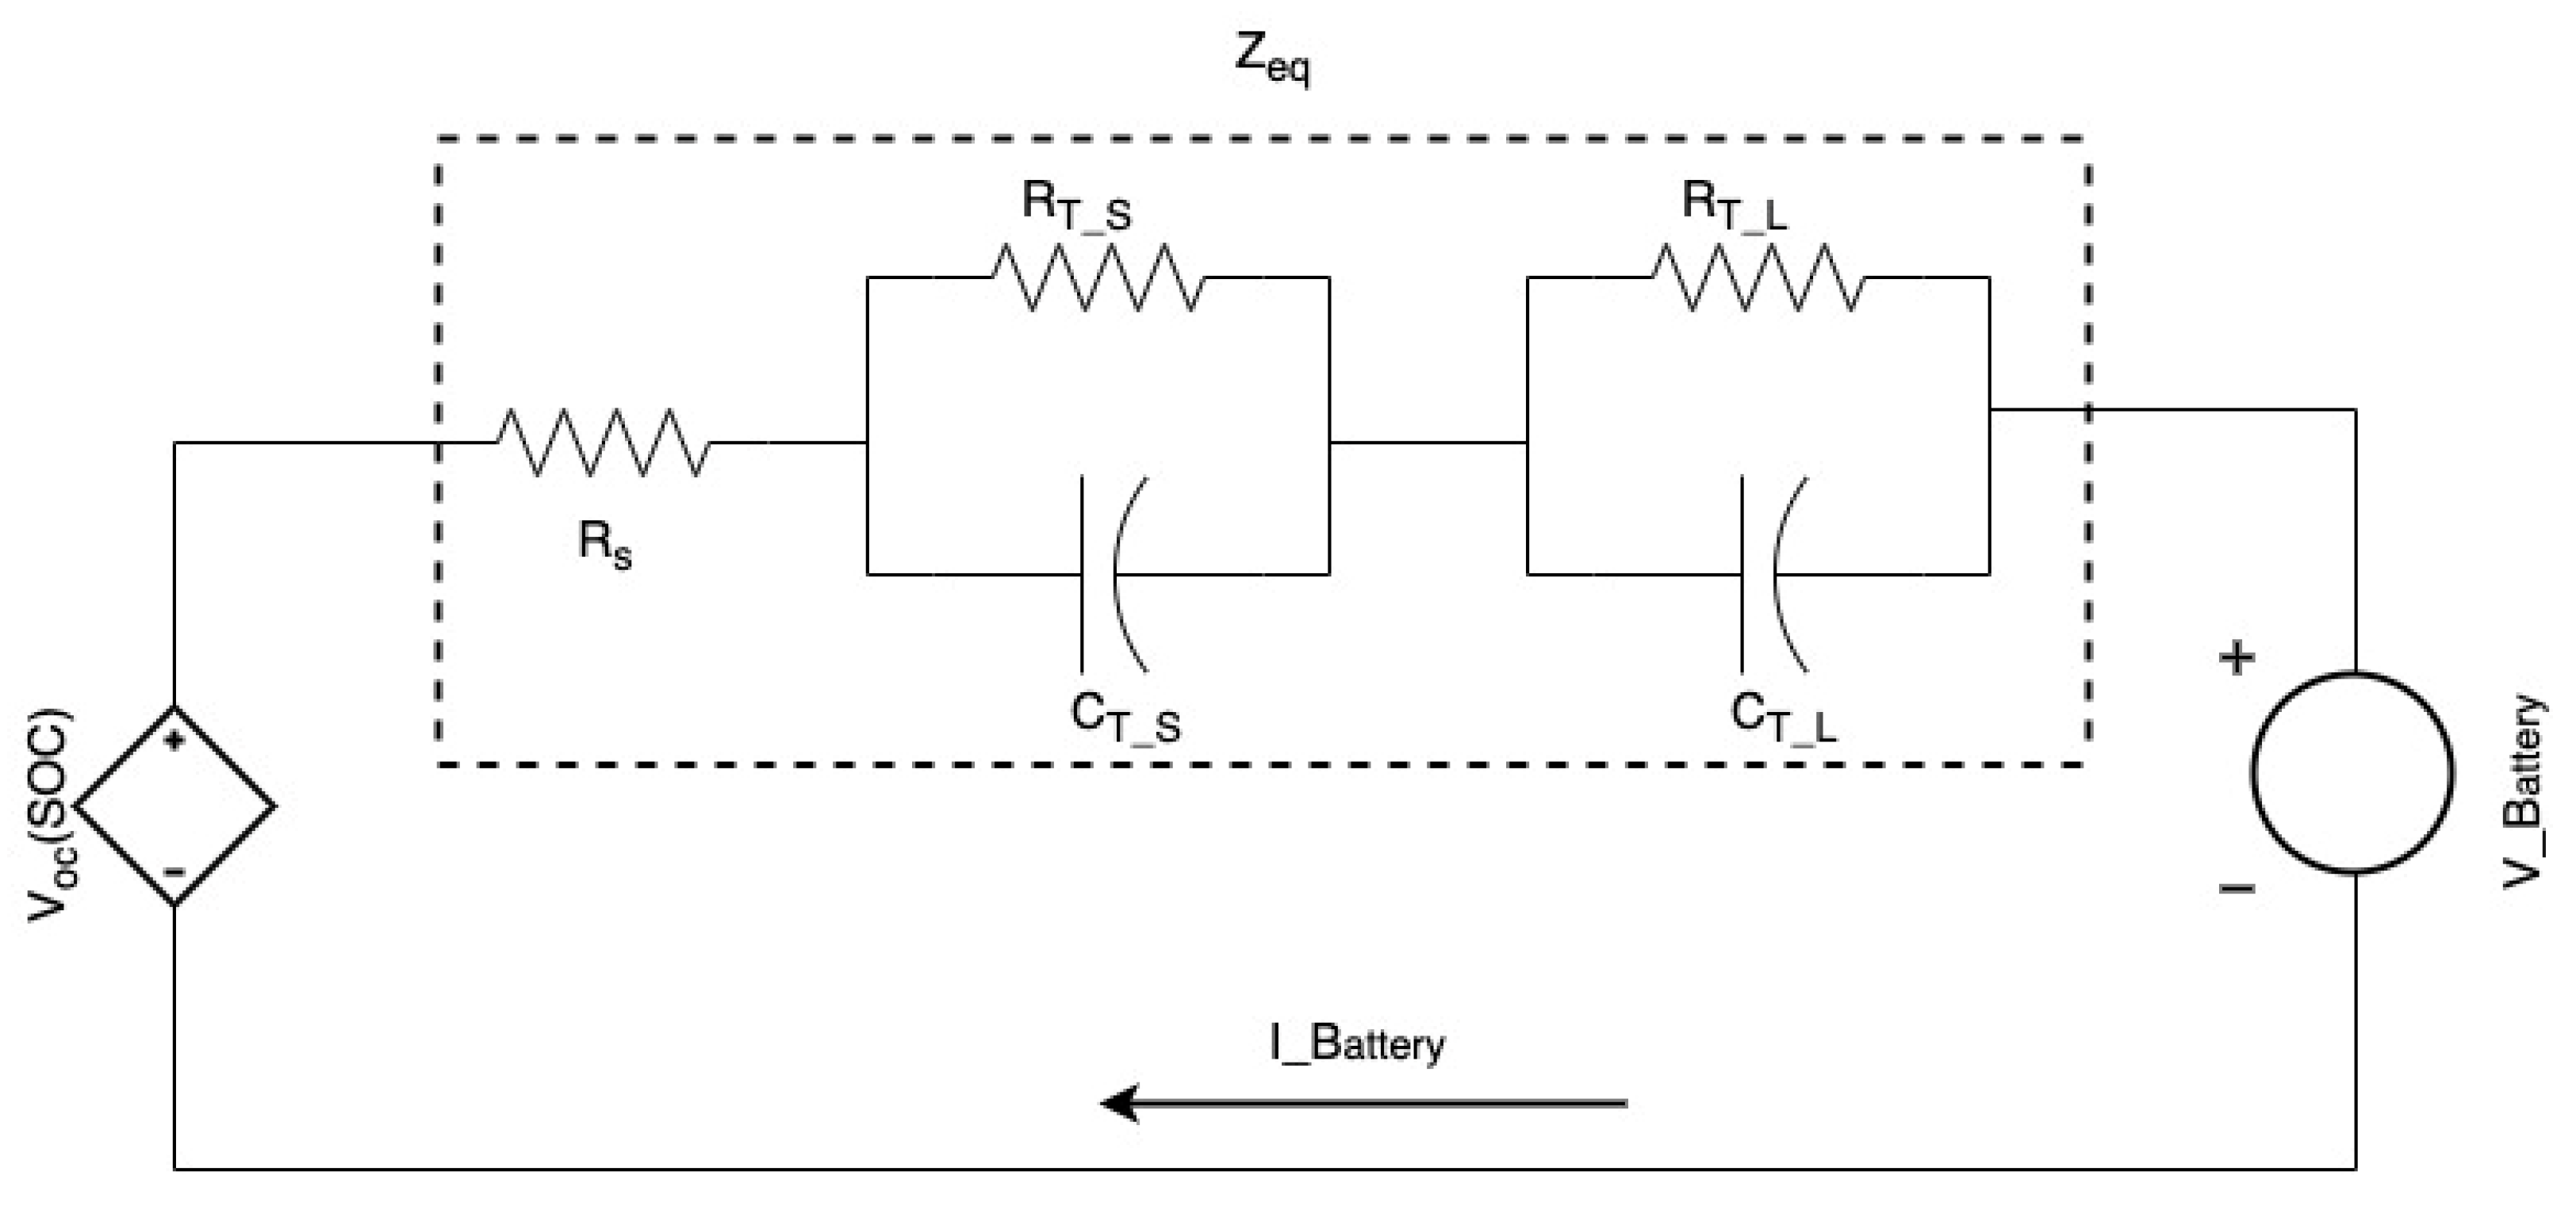
2.1. Electrical Battery Model—Overview and Governing Equations
2.2. Numerical Battery Temperature Model
2.3. The LCO 18,650 Battery Charging/Discharging Model
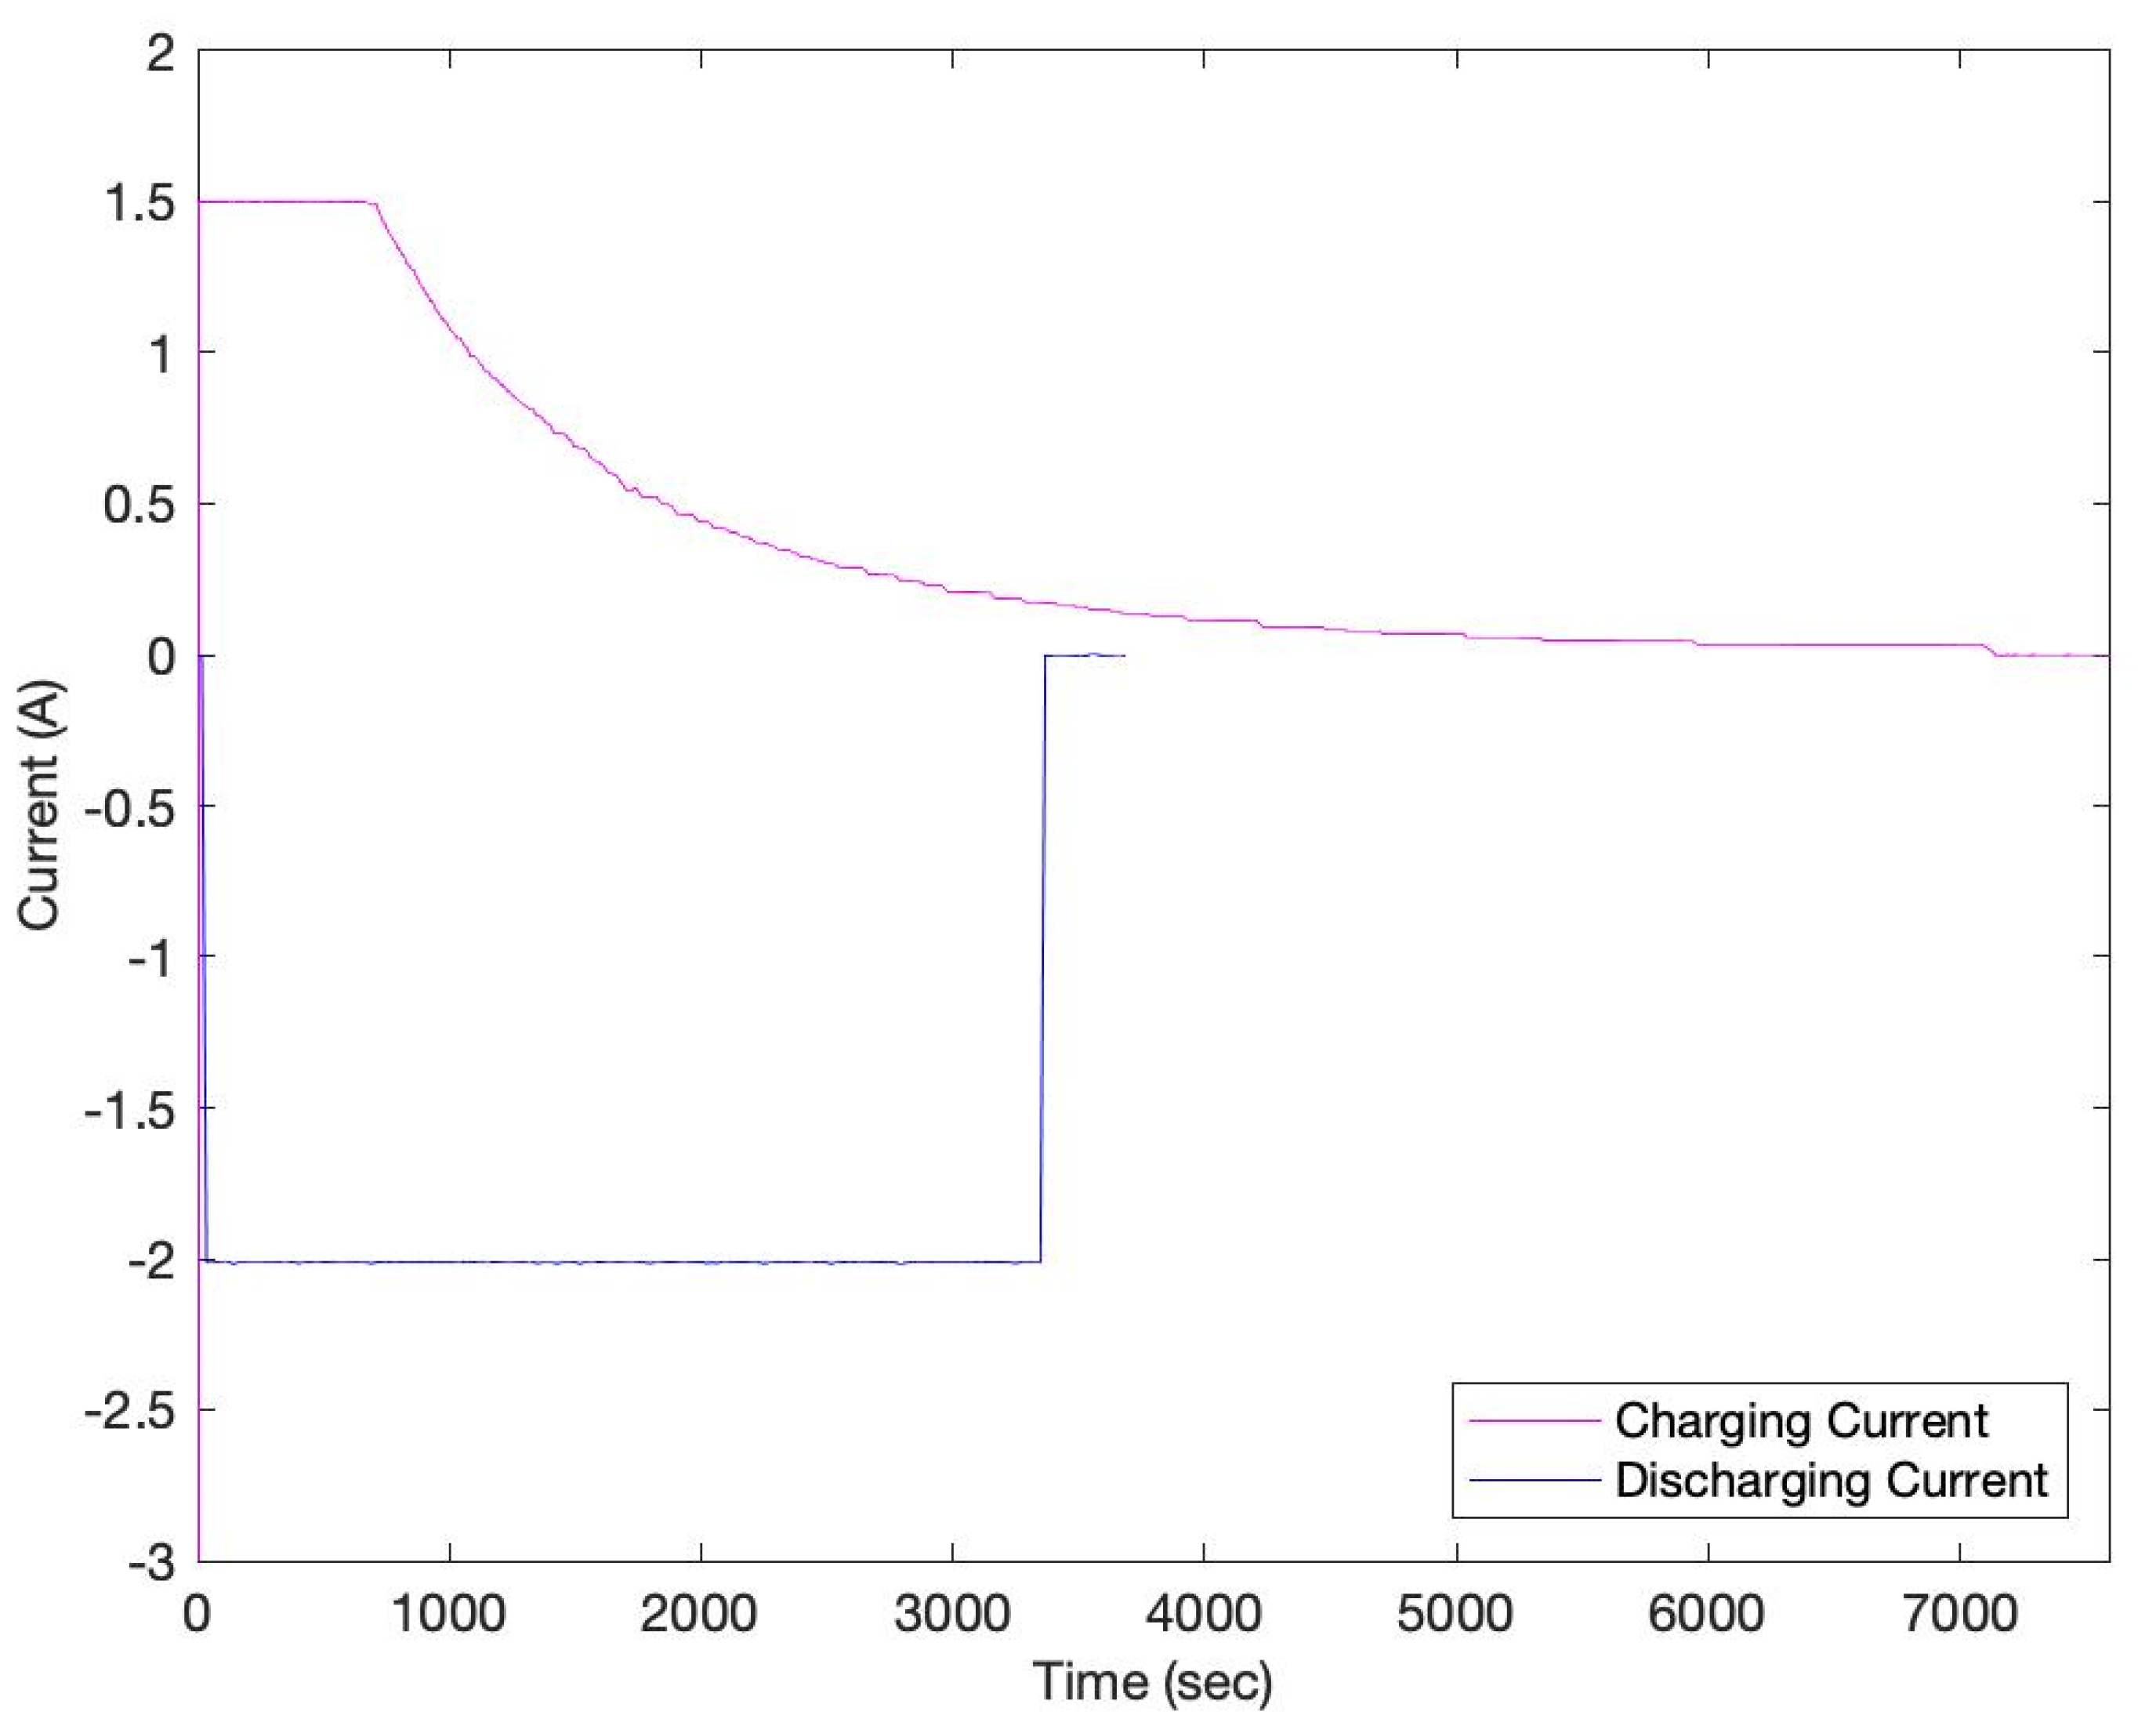
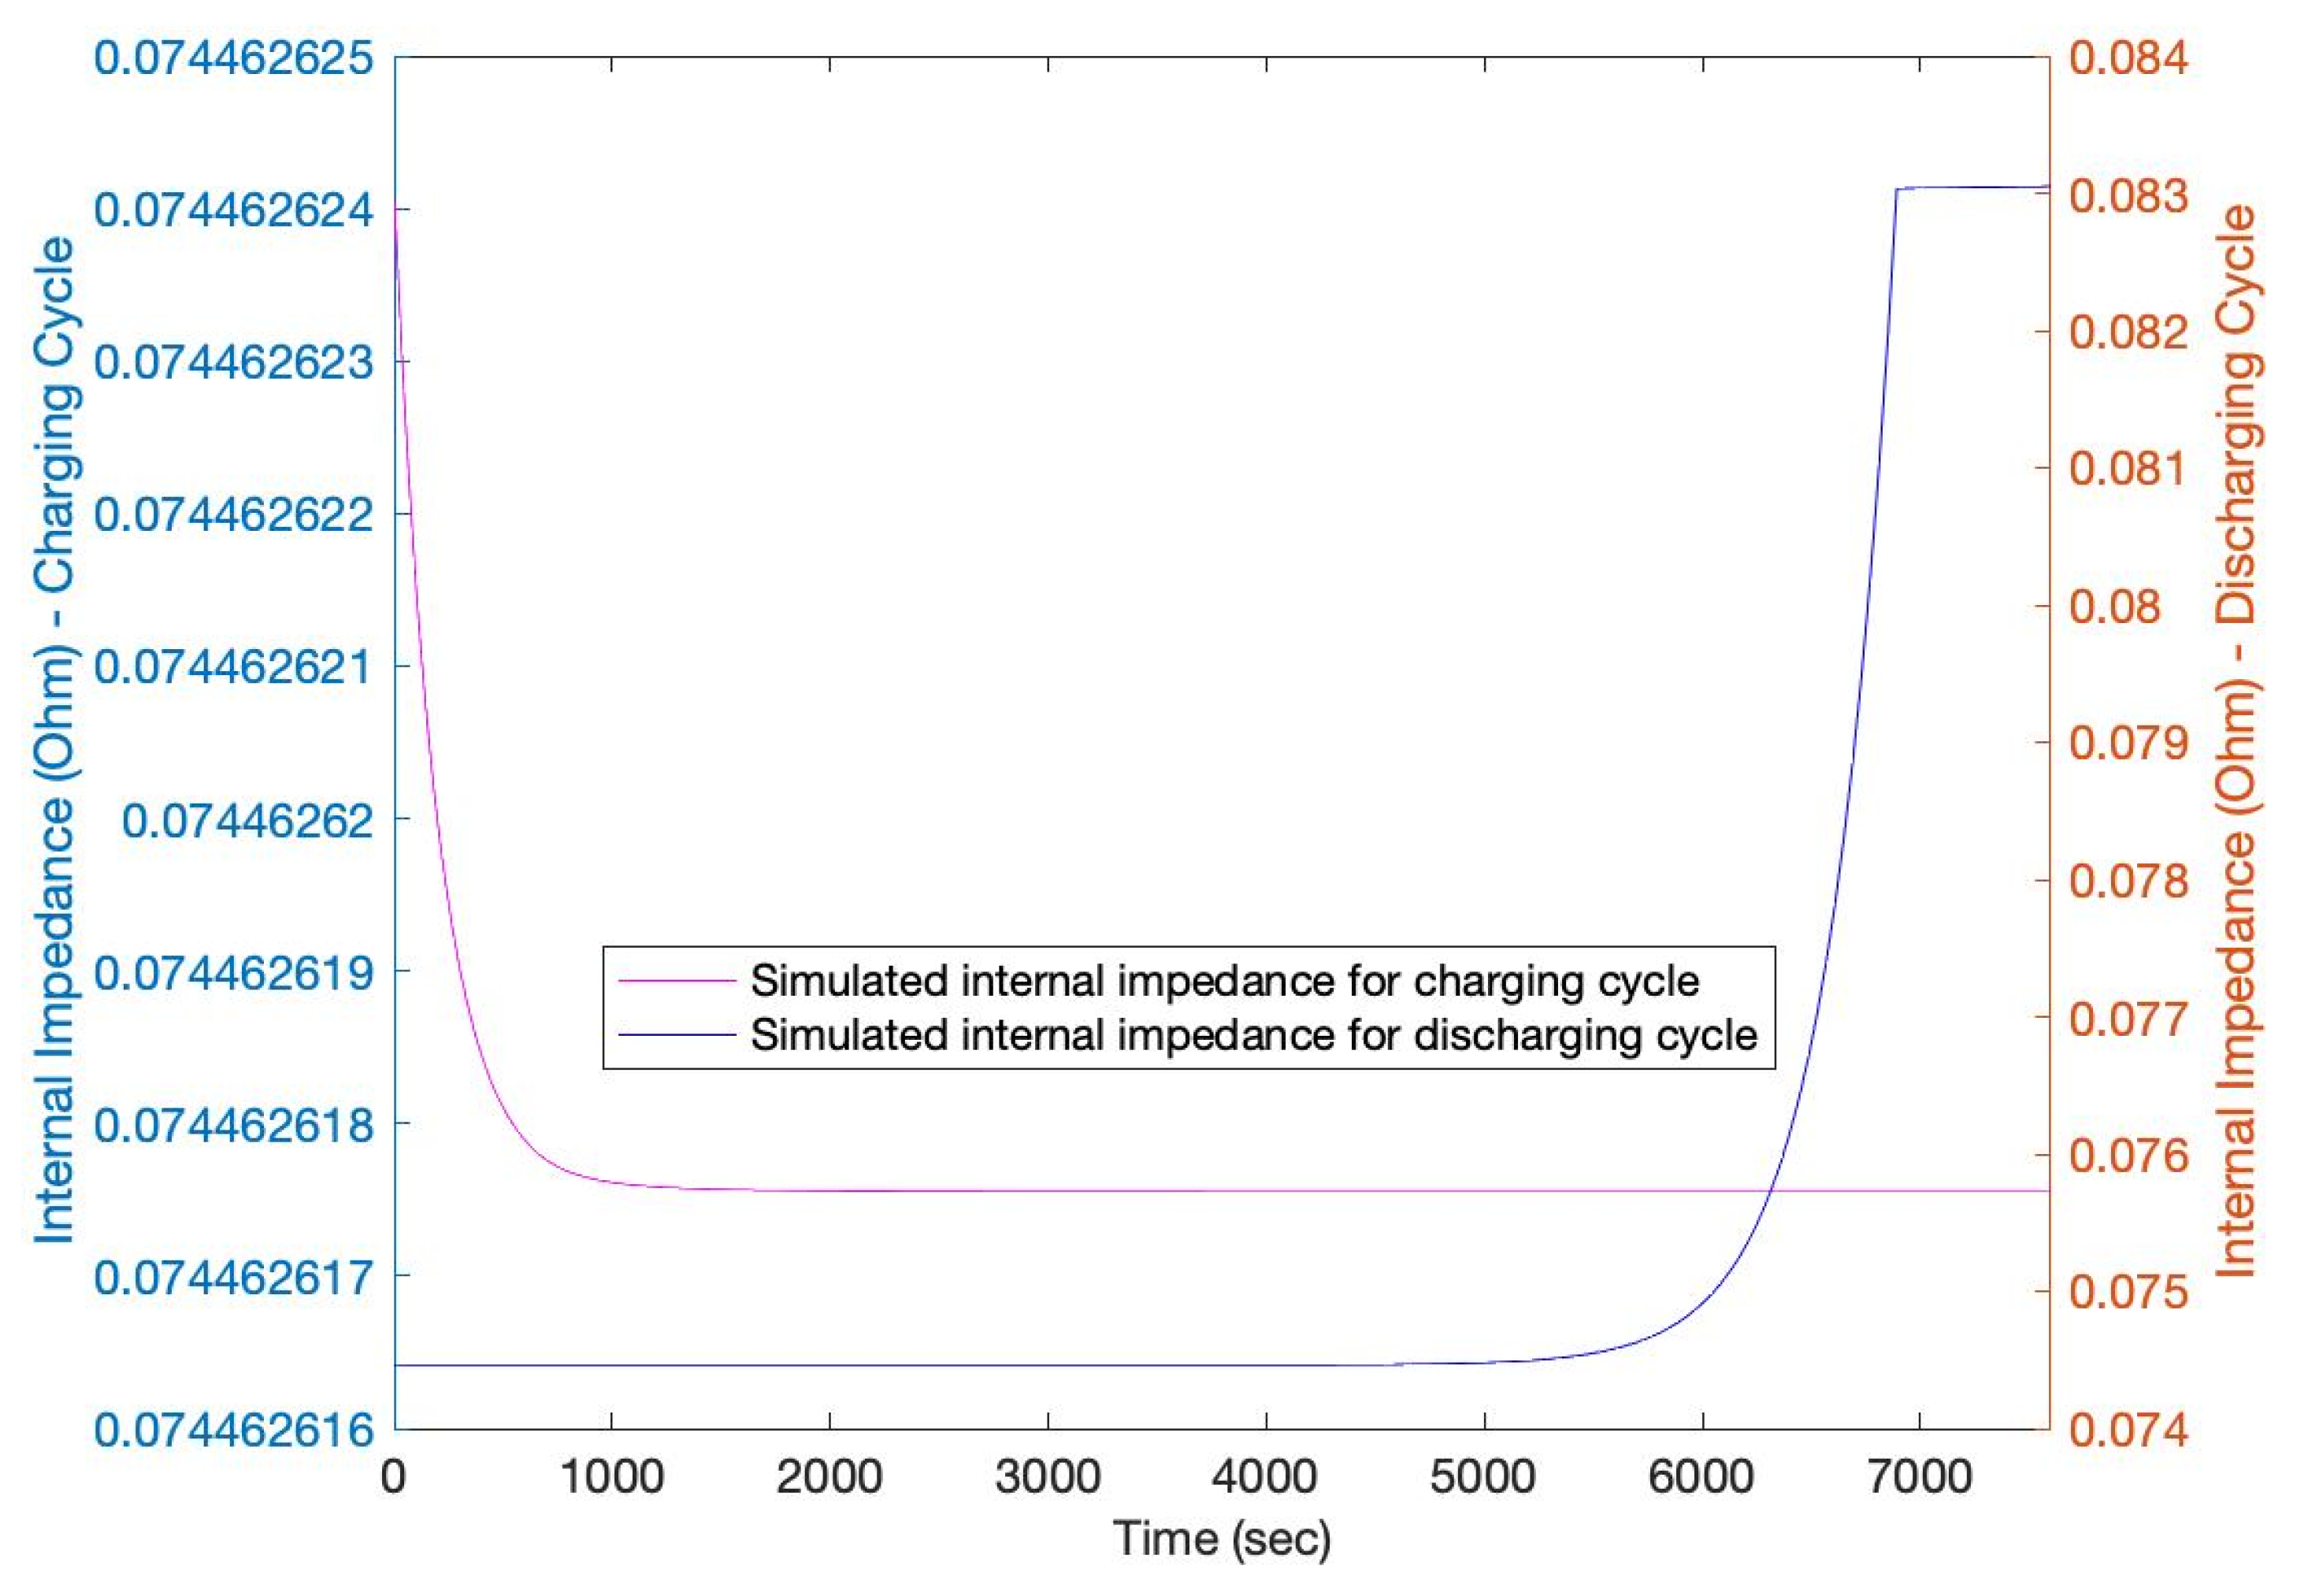
3. Results
4. Conclusions
Author Contributions
Funding
Institutional Review Board Statement
Informed Consent Statement
Data Availability Statement
Conflicts of Interest
References
- Yoshino, A. The Birth of the Lithium-Ion Battery. Angew. Chem. Int. Ed. 2012, 51, 5798–5800. [Google Scholar] [CrossRef] [PubMed]
- Hu, B.; Ma, Z.; Lei, W.; Zou, Y.; Lu, C. A chemo-mechanical model coupled with thermal effect on the hollow core–shell electrodes in lithium-ion batteries. Theor. Appl. Mech. Lett. 2017, 7, 199–206. [Google Scholar] [CrossRef]
- Dees, D.W.; Battaglia, V.S.; Bélanger, A. Electrochemical modeling of lithium polymer batteries. J. Power Sources 2002, 110, 310–320. [Google Scholar] [CrossRef]
- Song, L.; Evans, J.W. Electrochemical-Thermal Model of Lithium Polymer Batteries. J. Electrochem. Soc. 2000, 147, 2086–2095. [Google Scholar] [CrossRef]
- Yang, Z.; Patil, D.; Fahimi, B. Electrothermal Modeling of Lithium-Ion Batteries for Electric Vehicles. IEEE Trans. Veh. Technol. 2018, 68, 170–179. [Google Scholar] [CrossRef]
- Gomadam, P.M.; Weidner, J.W.; Dougal, R.A.; White, R.E. Mathematical modeling of lithium-ion and nickel battery systems. J. Power Sources 2002, 110, 267–284. [Google Scholar] [CrossRef]
- Newman, J.; Thomas, K.E.; Hafezi, H.; Wheeler, D.R. Modeling of lithium-ion batteries. J. Power Sources 2003, 119–121, 838–843. [Google Scholar] [CrossRef]
- Chen, M.; Rincon-Mora, G.A. Accurate electrical battery model capable of predicting runtime and IV perfor-mance. IEEE Trans. Energy Convers. 2006, 21, 504–511. [Google Scholar] [CrossRef]
- Rakhmatov, D.; Vrudhula, S.; Wallach, D. A model for battery lifetime analysis for organizing applications on a pocket computer. IEEE Trans. Very Large Scale Integr. (VLSI) Syst. 2003, 11, 1019–1030. [Google Scholar] [CrossRef]
- Rong, P.; Pedram, M. An analytical model for predicting the remaining battery capacity of lithium-ion batteries. IEEE Trans. Very Large Scale Integr. (VLSI) Syst. 2006, 14, 441–451. [Google Scholar] [CrossRef]
- Sun, F.; Yi, C.; Li, Y. Battery-friendly scheduling policy in MAC layer for WBAN data packets transmission. IET Commun. 2017, 11, 1423–1430. [Google Scholar] [CrossRef]
- Pedram, M.; Wu, Q. Design considerations for battery-powered electronics. In Proceedings of the 1999 Design Automation Conference (Cat. No. 99CH36361), New Orleans, LA, USA, 21–25 June 1999; pp. 861–866. [Google Scholar] [CrossRef]
- Rynkiewicz, R. Discharge and charge modeling of lead acid batteries. In Proceedings of the APEC ’99. Fourteenth Annual Applied Power Electronics Conference and Exposition. 1999 Conference Proceedings (Cat. No.99CH36285), Dallas, TX, USA, 19–23 March 1999; Volume 2, pp. 707–710. [Google Scholar] [CrossRef]
- Chiasserini, C.-F.; Rao, R. Energy efficient battery management. IEEE J. Sel. Areas Commun. 2001, 19, 1235–1245. [Google Scholar] [CrossRef]
- Pascoe, P.; Al-Anbuky, A. VRLA Battery Discharge Reserve Time Estimation. IEEE Trans. Power Electron. 2004, 19, 1515–1522. [Google Scholar] [CrossRef]
- Zhou, F.; Bao, C. Analysis of the lithium-ion battery capacity degradation behavior with a comprehensive math-ematical model. J. Power Sources 2021, 515, 230630. [Google Scholar] [CrossRef]
- Wang, C.-J.; Zhu, Y.-L.; Fan, X.-K.; Qi, C.; Gao, F. Mathematical model for thermal behavior of lithium-ion battery pack under overheating. Appl. Therm. Eng. 2021, 191, 116894. [Google Scholar] [CrossRef]
- Chan, H. A new battery model for use with battery energy storage systems and electric vehicles power systems. In Proceedings of the 2000 IEEE Power Engineering Society Winter Meeting. Conference Proceedings (Cat. No.00CH37077), Singapore, 23–27 January 2000; Volume 1, pp. 470–475. [Google Scholar] [CrossRef]
- Zhan, C.-J.; Wu, X.; Kromlidis, S.; Ramachandaramurthy, V.; Barnes, M.; Jenkins, N.; Ruddell, A. Two electrical models of the lead–acid battery used in a dynamic voltage restorer. IEE Proc.-Gener. Transm. Distrib. 2003, 150, 175–182. [Google Scholar] [CrossRef]
- Salameh, Z.; Casacca, M.; Lynch, W. A mathematical model for lead-acid batteries. IEEE Trans. Energy Convers. 1992, 7, 93–98. [Google Scholar] [CrossRef]
- Gold, S. A PSPICE macromodel for lithium-ion batteries. In Proceedings of the Twelfth Annual Battery Conference on Applications and Advances, California, CA, USA, 14–17 January 1997; pp. 215–222. [Google Scholar] [CrossRef]
- Glass, M. Battery electrochemical nonlinear/dynamic SPICE model. In Proceedings of the IECEC 96. Proceedings of the 31st Intersociety Energy Conversion Engineering Conference, Washington, DC, USA, 11–16 August 1996; Volume 1, pp. 292–297. [Google Scholar] [CrossRef]
- Valvo, M.; Wicks, F.; Robertson, D.; Rudin, S. Development and application of an improved equivalent circuit model of a lead acid battery. In Proceedings of the IECEC 96. Proceedings of the 31st Intersociety Energy Conversion Engineering Conference, Washington, DC, USA, 11–16 August 1996; Volume 2, pp. 1159–1163. [Google Scholar] [CrossRef]
- Kim, D.; Lee, J. Discharge scheduling for voltage balancing in reconfigurable battery systems. Electron. Lett. 2017, 53, 496–498. [Google Scholar] [CrossRef]
- Benini, L.; Castelli, G.; Macii, A.; Macii, E.; Poncino, M.; Scarsi, R. Discrete-time battery models for system-level low-power design. IEEE Trans. Very Large Scale Integr. (VLSI) Syst. 2001, 9, 630–640. [Google Scholar] [CrossRef]
- Gao, L.; Liu, S.; Dougal, R. Dynamic lithium-ion battery model for system simulation. IEEE Trans. Components Packag. Technol. 2002, 25, 495–505. [Google Scholar] [CrossRef] [Green Version]
- Barsali, S.; Ceraolo, M. Dynamical models of lead-acid batteries: Implementation issues. IEEE Trans. Energy Convers. 2002, 17, 16–23. [Google Scholar] [CrossRef]
- Baudry, P.; Neri, M.; Gueguen, M.; Lonchampt, G. Electro-thermal modelling of polymer lithium batteries for starting period and pulse power. J. Power Sources 1995, 54, 393–396. [Google Scholar] [CrossRef]
- Huang, C.; Wang, L. Gaussian process regression-based modelling of lithium-ion battery temperature-dependent open-circuit-voltage. Electron. Lett. 2017, 53, 1214–1216. [Google Scholar] [CrossRef] [Green Version]
- Buller, S.; Thele, M.; De Doncker, R.W.; Karden, E. Impedance based simulation models of supercapacitors and Li-ion batteries for power electronic applications. IEEE Trans. Ind. Appl. 2005, 41, 742–747. [Google Scholar] [CrossRef]
- Schweighofer, B.; Raab, K.; Brasseur, G. Modeling of high power automotive batteries by the use of an automated test system. IEEE Trans. Instrum. Meas. 2003, 52, 1087–1091. [Google Scholar] [CrossRef]
- Ceraolo, M. New dynamical models of lead-acid batteries. IEEE Trans. Power Syst. 2000, 15, 1184–1190. [Google Scholar] [CrossRef] [Green Version]
- Abu-Sharkh, S.; Doerffel, D. Rapid test and non-linear model characterisation of solid-state lithium-ion batteries. J. Power Sources 2004, 130, 266–274. [Google Scholar] [CrossRef]
- Khalfi, J.; Boumaaz, N.; Soulmani, A.; Laadissi, E.M. Nonlinear Modeling of Lithium-Ion Battery Cells for Electric Vehicles using a Hammerstein–Wiener Model. J. Electr. Eng. Technol. 2020, 16, 659–669. [Google Scholar] [CrossRef]
- Tran, M.K.; Panchal, S.; Chauhan, V.; Brahmbhatt, N.; Mevawalla, A.; Fraser, R.; Fowler, M. Python-based scikit-learn machine learning models for thermal and electrical performance prediction of high-capacity lithium-ion battery. Int. J. Energy Res. 2022, 46, 786–794. [Google Scholar] [CrossRef]
- Lacressonnière, F.; Varais, A.; Roboam, X.; Bru, E.; Mullins, T. Scale electro-thermal model of a lithium-ion battery for time-accelerated experiments in a hardware in the loop process. J. Energy Storage 2021, 39, 102576. [Google Scholar] [CrossRef]
- Chen, L.; Hu, M.; Cao, K.; Li, S.; Su, Z.; Jin, G.; Fu, C. Core temperature estimation based on electro-thermal model of lithium-ion batteries. Int. J. Energy Res. 2020, 44, 5320–5333. [Google Scholar] [CrossRef]
- Kuntinugunetanon, S.; Meesiri, W.; Wongkokua, W. Internal resistance measurements of Li-ion batteries using AC methods. J. Physics Conf. Ser. 2021, 1719, 012045. [Google Scholar] [CrossRef]
- Erdinc, O.; Vural, B.; Uzunoglu, M. A dynamic lithium-ion battery model considering the effects of temperature and capacity fading. In Proceedings of the 2009 International Conference on Clean Electrical Power, Capri, Italy, 9–11 June 2009; pp. 383, 386. [Google Scholar] [CrossRef]
- He, H.; Xiong, R.; Zhang, X.; Sun, F.; Fan, J. State-of-Charge Estimation of the Lithium-Ion Battery Using an Adaptive Extended Kalman Filter Based on an Improved Thevenin Model. IEEE Trans. Veh. Technol. 2011, 60, 1461–1469. [Google Scholar] [CrossRef]
- Crompton, T.R. Battery Reference Book, 3rd ed.; Newnes: Oxford, UK, 2000. [Google Scholar]
- Charkhgard, M.; Farrokhi, M. State-of-Charge Estimation for Lithium-Ion Batteries Using Neural Networks and EKF. IEEE Trans. Ind. Electron. 2010, 57, 4178–4187. [Google Scholar] [CrossRef]
- Plett, G.L. Extended Kalman filtering for battery management systems of LiPB-based HEV battery packs, Part 2: Modeling and identification. J. Power Sources 2004, 134, 262–276. [Google Scholar] [CrossRef]
- Wang, S.; Fan, Y.; Stroe, D.; Fernandez, C.; Yu, C.; Cao, W.; Chen, Z. Chapter 5—Battery state-of-charge estimation methods. In Battery System Modeling; Elsevier: Amsterdam, The Netherlands, 2021; pp. 157–198. [Google Scholar]
- Choi, W.; Shin, H.-C.; Kim, J.M.; Choi, J.-Y.; Yoon, W.-S. Modeling and Applications of Electrochemical Impedance Spectroscopy (EIS) for Lithium-ion Batteries. J. Electrochem. Sci. Technol. 2020, 11, 528. [Google Scholar] [CrossRef] [Green Version]
- Schweitzer, B.; Wilke, S.; Khateeb, S.; Al-Hallaj, S. Experimental validation of a 0-D numerical model for phase change thermal management systems in lithium-ion batteries. J. Power Sources 2015, 287, 211–219. [Google Scholar] [CrossRef]
- Al Hallaj, S.; Prakash, J.; Selman, J. Characterization of commercial Li-ion batteries using electrochemical–calorimetric measurements. J. Power Sources 2000, 87, 186–194. [Google Scholar] [CrossRef]
- Mills, A.; Al-Hallaj, S. Simulation of passive thermal management system for lithium-ion battery packs. J. Power Sources 2005, 141, 307–315. [Google Scholar] [CrossRef]
- Al-Hallaj, S.; Selman, J. Thermal modeling of secondary lithium batteries for electric vehicle/hybrid electric vehicle applications. J. Power Sources 2002, 110, 341–348. [Google Scholar] [CrossRef]
- Viswanathan, V.V.; Choi, D.; Wang, D.; Xu, W.; Towne, S.; Williford, R.E.; Zhang, J.-G.; Liu, J.; Yang, Z. Effect of entropy change of lithium intercalation in cathodes and anodes on Li-ion battery thermal management. J. Power Sources 2010, 195, 3720–3729. [Google Scholar] [CrossRef]
- Saha, B.; Goebel, K. Battery Data Set; NASA Ames Prognostics Data Repository, Ames Research Center: Moffett Field, CA, USA, 2007. Available online: http://ti.arc.nasa.gov/project/prognostic-data-repository (accessed on 2 October 2022).
- Kollmeyer, P.; Skells, M. Turnigy Graphene 5000 mAh 65C Li-ion Battery Data. Mendeley Data 2020, 1. [Google Scholar] [CrossRef]


| Parameters | Value | Unit |
|---|---|---|
| Nominal Capacity | 2000 | mAh |
| Charging Voltage | 4.2 | V |
| Nominal Voltage | 3.7 | V |
| Battery Weight | 45 | G |
| Battery Diameter | 18.2 | Mm |
| Battery Height | 64.5 | Mm |
| H | 16 | W/(m2 × K) |
| Cp | 850 | kJ/(kg × k) |
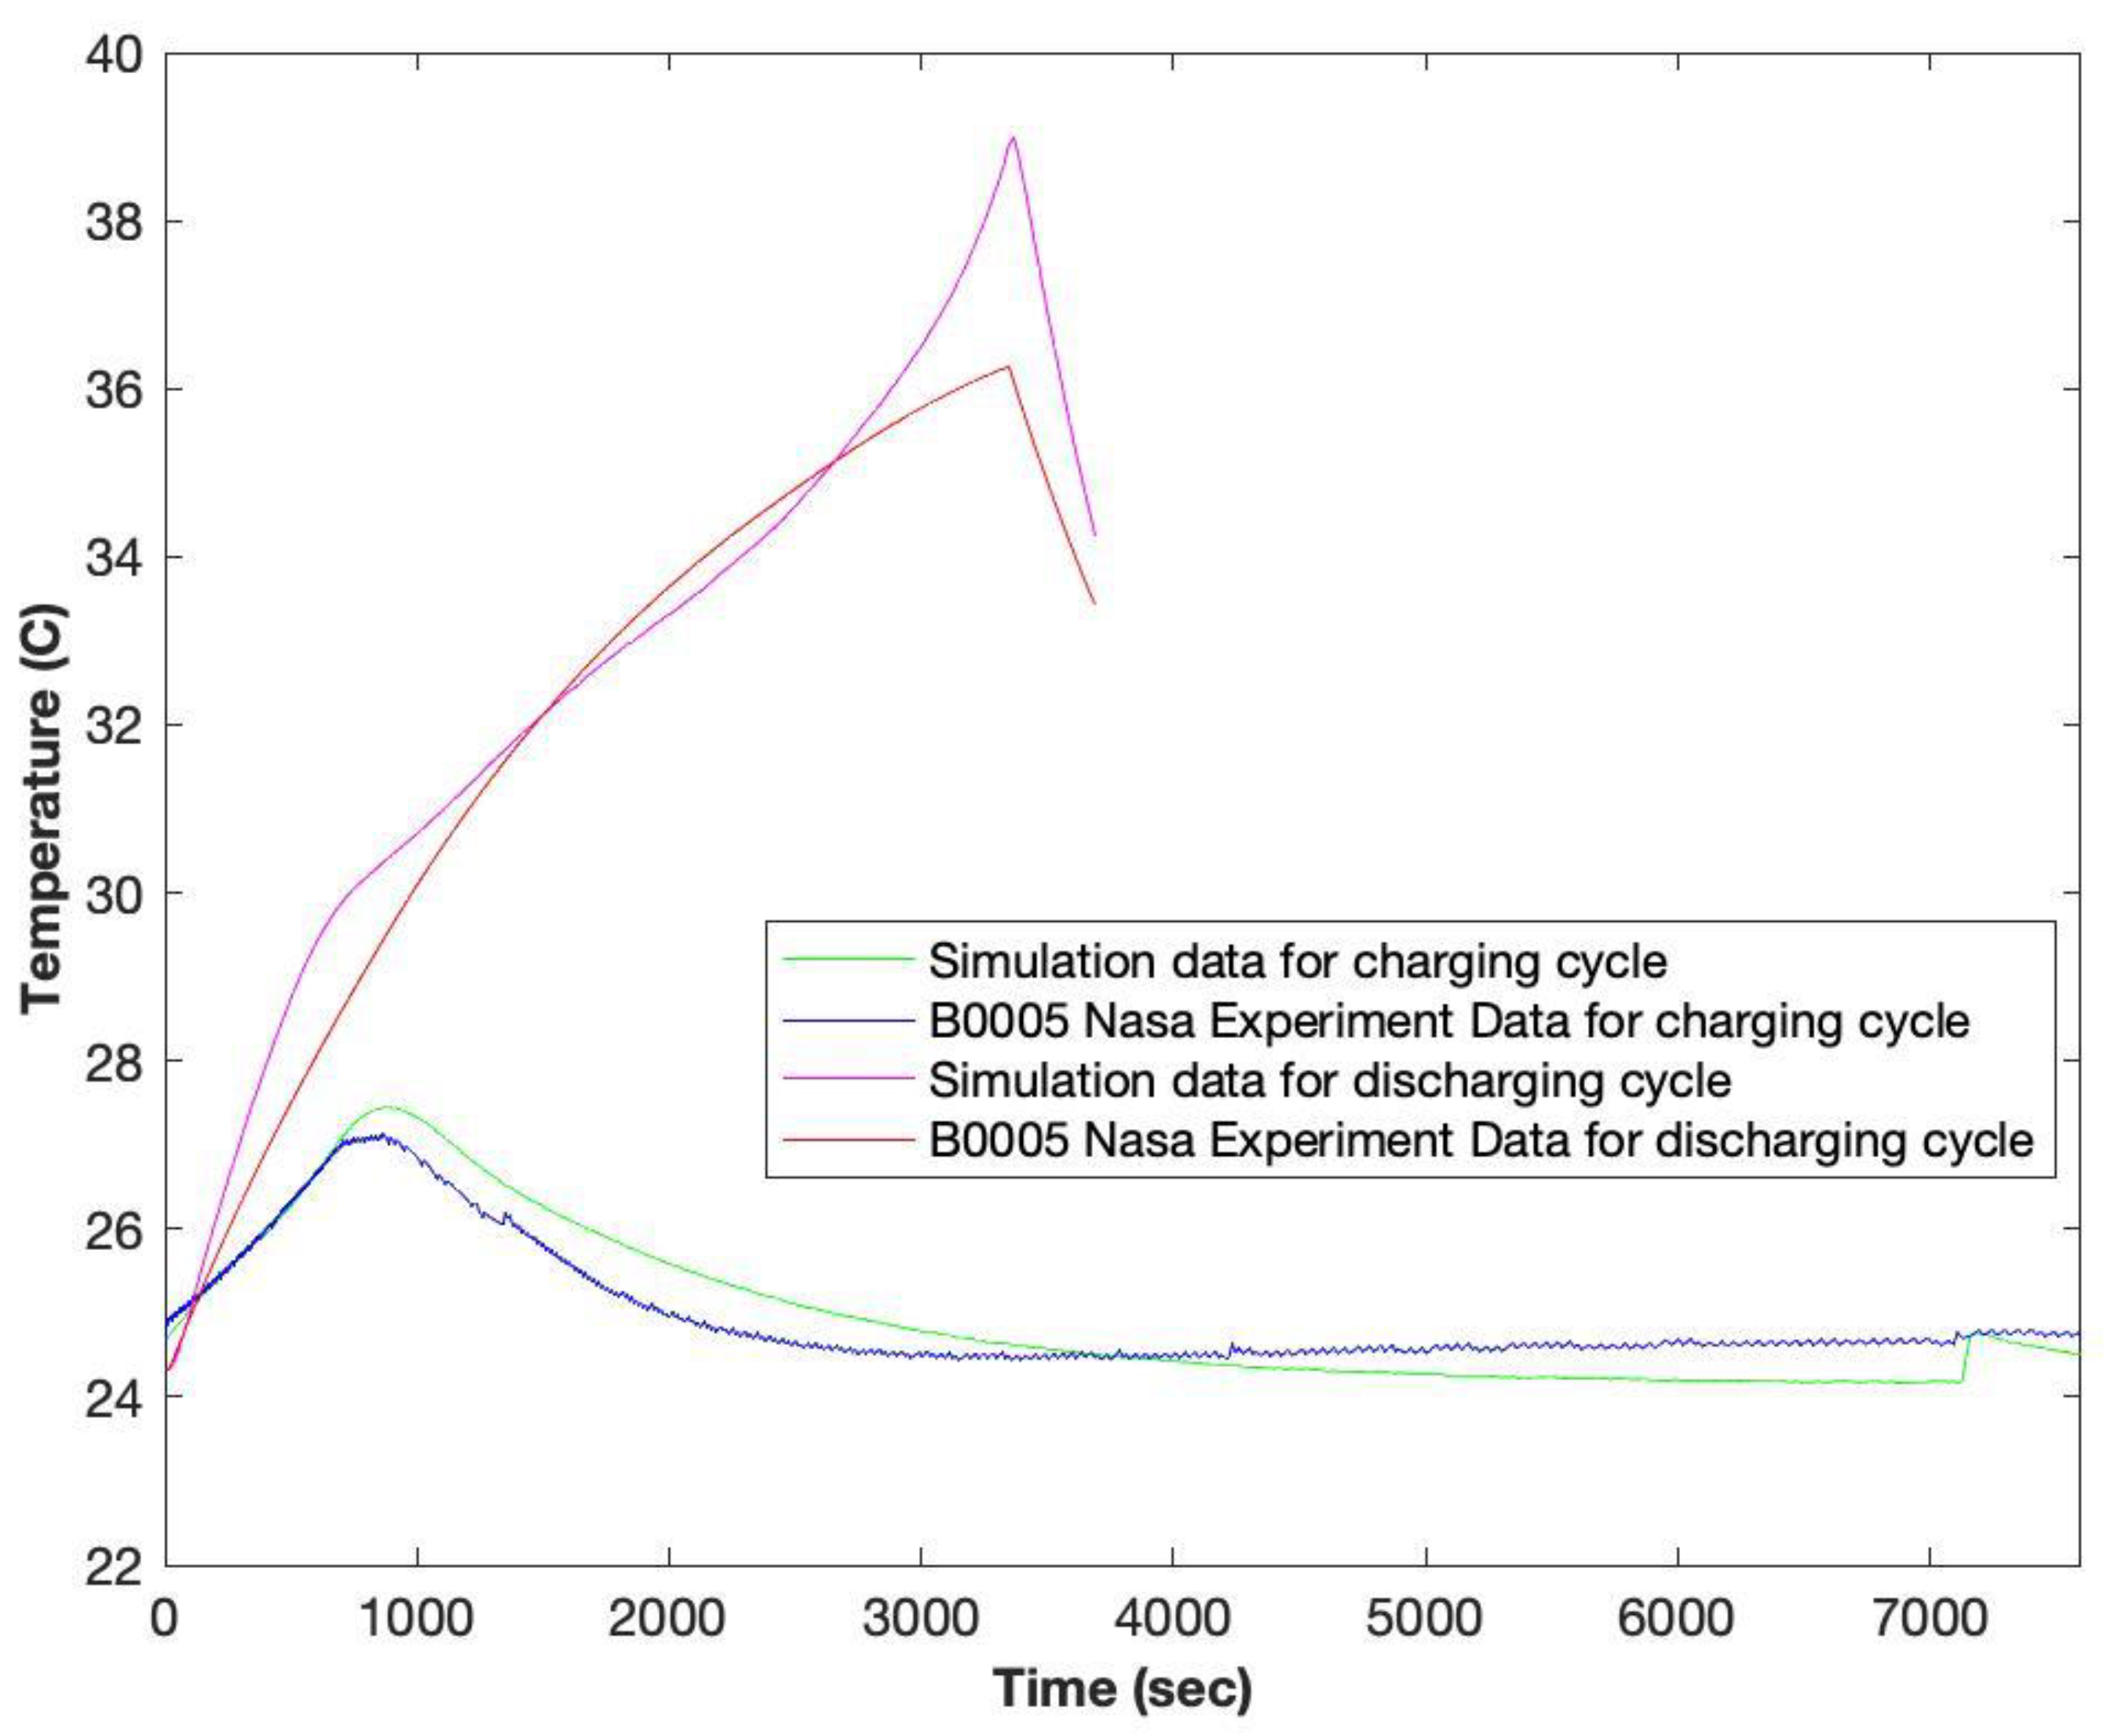
| Profile | MAE | RMS |
|---|---|---|
| Charging Cell Voltage | 0.05 V | 0.06 V |
| Charging Battery Temperature | 0.3 °C | 0.38 °C |
| Discharging Cell Voltage | 0.14 V | 0.2 V |
| Discharging Battery Temperature | 0.65 °C | 0.89 °C |
Publisher’s Note: MDPI stays neutral with regard to jurisdictional claims in published maps and institutional affiliations. |
© 2022 by the authors. Licensee MDPI, Basel, Switzerland. This article is an open access article distributed under the terms and conditions of the Creative Commons Attribution (CC BY) license (https://creativecommons.org/licenses/by/4.0/).
Share and Cite
Al-Refai, A.; Alkhateeb, A.; Dalala, Z.M. Enhancing the LCO 18,650 Battery Charging/Discharging Using Temperature and Electrical Based Model. Batteries 2022, 8, 199. https://doi.org/10.3390/batteries8110199
Al-Refai A, Alkhateeb A, Dalala ZM. Enhancing the LCO 18,650 Battery Charging/Discharging Using Temperature and Electrical Based Model. Batteries. 2022; 8(11):199. https://doi.org/10.3390/batteries8110199
Chicago/Turabian StyleAl-Refai, Abdullah, Abedalrhman Alkhateeb, and Zakariya M. Dalala. 2022. "Enhancing the LCO 18,650 Battery Charging/Discharging Using Temperature and Electrical Based Model" Batteries 8, no. 11: 199. https://doi.org/10.3390/batteries8110199
APA StyleAl-Refai, A., Alkhateeb, A., & Dalala, Z. M. (2022). Enhancing the LCO 18,650 Battery Charging/Discharging Using Temperature and Electrical Based Model. Batteries, 8(11), 199. https://doi.org/10.3390/batteries8110199