Article

High Adsorption Graphene Oxide Prepared by Graphite Anode from Spent Lithium-Ion Batteries for Methylene Blue Removal

1
Fachgebiet Angewandte Nanophysik, Institut für Physik & IMN MacroNano, Technische Universität Ilmenau, 98693 Ilmenau, Germany
2
Hebei Key Laboratory of Thermal Science and Energy Clean Utilization, School of Energy and Environmental Engineering, Hebei University of Technology, Tianjin 300401, China
3
School of Low-Carbon Energy and Power Engineering, China University of Mining and Technology, Xuzhou 221116, China
*
Authors to whom correspondence should be addressed.
Batteries 2022, 8(11), 249; https://doi.org/10.3390/batteries8110249
Submission received: 28 October 2022 / Revised: 16 November 2022 / Accepted: 18 November 2022 / Published: 20 November 2022
(This article belongs to the Section Battery Processing, Manufacturing and Recycling)

Abstract

:
Limited by the service life, a large amount of spent lithium-ion batteries (LIBs) have been produced in recent years. Without proper disposal, spent LIBs can cause environmental pollution and waste of resources. In this paper, we focus on the recycling of the graphite anode (GA) in spent LIBs. GAs from spent LIBs were converted to graphene oxide (GO) through a modified Hummers method. Then the prepared GO was applied to absorb methylene blue in dyeing wastewater under different reaction conditions. The experimental results indicate that GO can quickly and effectively adsorb methylene blue, which also exhibits thermal stability. The maximum adsorption capacity and removal rate are about 833.11 mg/g and 99.95%, respectively. The adsorption kinetics and isotherms were investigated; the adsorption process of GO is more consistent with the pseudo-second-order adsorption kinetic model while the isotherm is close to the Langmuir isotherm. This study is of great significance for the economy and environment. The reaction can turn waste into wealth and is a win-win approach for both spent LIBs recycling and dyeing wastewater cleaning.

1. Introduction

In order to meet the need for sustainable development of society [1], lithium-ion batteries (LIBs) are used in a wide range of applications, including consumer batteries, new energy vehicles, and solar power plants, due to its no memory effect, large specific energy, small self-discharge and size [2,3,4,5]. According to the prediction, the compound annual growth rate of LIBs in the global market can reach up to 12.3% from 2021 to 2030, with the market value growing from $41.1 billion to $116.6 billion [6]. However, limited by the service life (3-10 years) [7], vast amounts of spent LIBs are continuously generated with the increasing worldwide demand for LIBs. Spent LIBs contain hazardous metal, flammable electrolytes and graphite powders which will not only pollute the environment but jeopardize human health without proper treatment [8,9,10]. At present, most research is focused on the recovery of valuable metals from the cathode of spent LIBs [11,12,13]. However, the importance of recovery of graphite anode (GA) from spent LIBs cannot be overestimated. On the one hand, graphite has occupied a dominant position in the global anode market, accounting for as much as 92.6%. The lesser-known key component of GA is about 20 times higher than lithium in LIBs [14]. A massive waste of graphite will be generated with the increasing production of spent LIBs, which will not only cause serious pollution to air, water and soil, but even endanger human health. On the other hand, battery grade graphite needs to meet high-purity requirements, and the purification technologies are often accompanied by environmental pollution and increased costs. Therefore, considering resources, economy and environment, all these suggest that the recycling of spent GA cannot be ignored and should be paid more attention.
After repeated de/intercalation of lithium ions during long-term charge/discharge cycles of batteries, the structure of GAs has some changes, such as interlayer spacing expanding [15] and interlayer force decreasing [16], which make it easier to intercalate and peel off than common graphite. This characteristic is beneficial for its utilization in preparing graphene oxide (GO). In view of the existence of some structural defects in GA, the amount of H2SO4 and KMnO4 is less than that in the preparation process using natural graphite [17]. In addition, acid leaching and shear mixing pretreatment were also applied in the process of preparing GO from waste GA. The results showed that the lithiation pre-expansion treatment of waste graphite during multiple charge-discharge cycles can significantly improve the GO yields [18].
Due to the rapid development of industry [19,20], water pollution has become increasingly serious [21]. Due to the unique properties, GO has received extensive attention in the fields of wastewater processing [22]. GO is easily bound to organic molecules by electrostatic, hydrogen bonding, or π-π stacking because of the presence of oxygen-containing functional groups (hydroxyl groups, carboxyl groups) on its surface. The surface also has many hydrophilic groups, resulting a great dispersibility in water. The abundant oxygen-containing functional groups of GO have significant effect in metal adsorption, which can remove the Cd2+ [23], Co2+ [23], Pb2+ [24], and U(VI) [25] in aqueous solution. There have been many studies on the adsorption of GO on different dyes, including methylene blue (MB) [26], methyl orange, malachite green [26], methyl violet [27], rhodamine B [22], acridine orange [28] and so on.
In this paper, waste GA from spent LIBs was innovatively used as the raw material to prepare GO via a modified Hummers method. Then the prepared GO was applied as an adsorbent for the removal of MB in wastewater. The effects of different reaction conditions on the adsorption were investigated experimentally, and the adsorption kinetics and thermodynamics in the adsorption process were fitted. The experimental results indicate that the prepared GO shows a higher adsorption capacity on MB than that prepared by different graphite materials using the similar Hummers method (Table 1). The maximum adsorption capacity and removal rate of GO prepared by spent GA are 833.11 mg/g, which is higher than that in the previous literature. Thanks to the efficient and fast adsorption performance, this study has great implications for the recovery of GA from spent LIBs and the cleaning of dyeing wastewater, which also has benefits on the economy and environment.

2. Results and Discussion

2.1. The Characteristics of GO

As shown in Figure 1a, GA has a large scale, and obvious layered stacking structure which can be observed at high magnification. The layered stacking is not compact, which indicates that the van der Waals force between layers is weak. These morphologies are beneficial to the peeling and shedding in the subsequent process. It can be seen from Figure 1b that prepared GO has obvious wrinkles and corrugations, which is because of the tendency of GO to spontaneously reduce the surface energy, thus leading to the shrinkage and curling of the surface as well as the structure in Table 2 [35]. The images at 400 nm show that GO is a large sheet with a high degree of folds, indicating it can provide more active sites for the adsorption process.
Figure 2a shows the Raman spectra of prepared GO, and the main characteristic peaks from 500 to 2000 1/cm can be identified clearly. The main characteristic peaks, including the D peak and G peak, are generated by the sp2 structure. The D peak is caused by the breathing vibration of sp2 hybridized carbon atoms, reflecting the internal structure defects. The high value of the D peak indicates a strong degree of disorder and obvious defects of material. The G peak represents the symmetry and order of the graphitic structure, which is generated by the stretching motion of the sp2 hybridized atom pair in carbocycles or long chains. It can be seen that GA from spent LIBs has both a D peak (1358 1/cm) and a G peak (1584 1/cm). Thus, the graphite structure of GA has changed slightly and the defects have increased after the manifold charge/discharge cycles in spent LIBs. It is worth noting that these defects are favorable for the preparation of GO. As shown in Figure S1, the G peak of the GF-GO (GO prepared by natural graphite flakes) was obviously broadened and moved to 1601 1/cm, and a new strong D peak appeared at 1355 1/cm. It illustrates that the C=C double bond is destroyed, some sp2 hybrid carbon atoms are converted into sp3 hybrid structure, and the graphite has been oxidized to GO. Compared with GA, both the D and G peaks of GO are stronger than those of GA which indicates that the internal structural defects and disorder of GO are higher than those of GA. This is because the oxygen functional groups are connected to the carbon atoms to form disordered sp3 hybrid bonds after the oxidation and exfoliation of graphite. The experimental results proved that the GO was successfully prepared, which laid a foundation for the next step of studying the behavior of GO on MB adsorption.
In addition, the XRD patterns in Figure 2b and Figure S2 demonstrate that GA and natural graphite flakes (GF) have high-intensity diffraction peaks around 2θ = 26°, which is the diffraction peaks of the graphite plane, indicating that the spatial arrangement of the pure graphite microchip layer is regular. It can be calculated by the Bragg law [36] 2dsinθ = nλ that the layer spacing is about 0.33 nm in the graphite. After the graphite is oxidized, a strong diffraction peak of the surface of the GO diffraction peak appears at nearly 2θ = 11°, which demonstrates that the crystalline form of the graphite is disrupted, and a new crystal structure is created. The XRD pattern of GO shows that the diffraction peak of its graphite plane (002) left shifts to 2θ = 9.96° and the intensity decreased. This is due to the addition of a strong oxidant, and the various bonds between oxygen and carbon atoms lead to the introduction of oxygen functional groups and other defects between the graphite sheets and the edges, which eventually leads to an increase in the distance between layers. In addition, the peak at 2θ = 26° almost completely disappears, indicating that there is almost no graphite material in the sample, that is, this modified Hummers method can completely oxidize the GA to GO. Meanwhile, the diffraction peak of the graphite plane (002) of GF-GO also shifts to about 2θ = 11.44° and the intensity decreases, indicating that GF is also oxidized to GF-GO (Figure S2). However, it still has an obvious diffraction peak at 2θ = 26°, which demonstrates that some graphite is still not completely oxidized. However, the intensity of the diffraction peak at 2θ = 26° is weaker than that of GF and the peak becomes wider, which shows that the crystallinity of the graphite has deteriorated, and the graphite particles with larger volume become smaller. Furthermore, as shown in Figure S3, the thickness of prepared GO is about 3 nm. The result indicates that the number of prepared GO layers is about 3 layers since the thickness of a single GO is about 0.8-1.0 nm [37]. In general, under the same conditions, the oxidation degree of GA is much higher than that of commercial graphite flakes.

2.2. Adsorption Study

pH value is an important influence on the affinity of ionic adsorbents [38]. During the adsorption process, the pH of the solution has an obvious influence on adsorption ability, which not only influences the surface charge, active sites of the adsorbent, and functional groups, but also the ionization degree and structure. Therefore, it could affect the surface chemical properties of adsorbent and the existence form of the adsorbate, and causing changes in the interaction between the adsorbate and adsorbent. Figure 3a shows the effect of pH value of the initial solution on the adsorption effect of GO on MB. In general, the adsorption capacity of GO increased with the initial pH increasing. When the pH < 7, the adsorption capacity increased smoothly. While the pH > 7, it increased greatly and tended to be stable. The reason is that as a cationic dye, MB is positively charged in water solution. The surface charge of the adsorbent can affect the adsorption capacity. Under acidic conditions, the H+ in the solution competes for active sites with the positively charged MB cationic groups, leading to a reduced adsorption capacity. As the pH value of the solution increases, the H+ in the solution decreases relatively, the competitiveness for active sites is weak, and the adsorption capacity increases slowly. As the pH value continues to increase, the solution becomes alkaline, the surface potential of GO becomes negative, and a strong electrostatic attraction is generated between the GO and MB, so the adsorption capacity is significantly higher than that under acidic conditions. However, the adsorption capacity did not significantly rise as the pH value increased. Although the adsorption of MB by GO under acidic conditions is relatively low, it can also reach 474 mg/g, and the removal rate is 95.5%.
From an economic viewpoint, it is of great significance to investigate the dosage of GO to select the appropriate amount of adsorbent for industrial applications. The effect of GO addition on the removal rate and adsorption capacity was investigated under the conditions of pH = 9 and an initial concentration of 200 mg/L. Figure 3b shows that as adsorbent dosage increased, the unit adsorption capacity of GO on MB decreased. When the amount added is small, the adsorption active sites of GO can fully absorb MB, so that the unit adsorption capacity is larger. While the dosage continued to increase, limited by the initial concentration, not all the adsorption sites would be adsorbed to saturation by MB, so the unit adsorption capacity of GO decreased. Furthermore, the removal rate increases with the addition of GO, and when the addition is 15 mg, the removal rate can reach 99.92%. This is because the adsorption sites and specific surface area on the GO surface increased in the solution with the increase of the dosage; they can fully absorb the MB, thereby increasing the removal rate. However, when the addition continued to increase to a certain extent, limited by a certain initial concentration, the adsorption of MB in the solution reached saturation, and the removal rate would not increase. Selecting the appropriate amount of adsorbent added can not only meet higher adsorption requirements but also save costs.
The initial concentration of MB is of great practical importance to study the maximum adsorption capacity of GO and the dependence of the upper limit of adsorption on MB concentration. In Figure 4a, the adsorption capacity of GO exhibited a linear trend with the increase of the initial MB concentration. The adsorption capacity was only 332.97 mg/g with a low initial concentration (100 mg/L). This is because the active functional groups and adsorption sites of GO are not all covered by MB molecules; thus, the unit adsorption capacity is small. With the initial MB concentration increasing, the MB adsorbed by GO functional groups and adsorption sites was gradually saturated and the adsorption capacity increased. When the MB solution concentration is 300 mg/L, the unit adsorption capacity can reach up to 995.56 mg/g. Nevertheless, the high adsorption capacity does not mean that the initial concentration of MB can be continuously increased. It also can be seen that the removal rate of MB is almost stable at 99.94% with the range of 100 mg/L to 250 mg/L. However, the removal rate was significantly decreased to 99.3% at higher levels (300 mg/L). When the addition of GO is fixed, the exposed adsorption sites of GO can adsorb almost all the MB under low concentrations so that the removal rate is high. With the increase of initial concentration, the MB adsorbed on the adsorption sites was basically saturated and the unabsorbed MB still remained in the solution, resulting in a decreased removal rate. In order to ensure a high removal rate and good adsorption capacity, the MB concentration was fixed at 250 mg/L in the subsequent experiments, where the adsorption capacity and removal rate were high, at 833.01 mg/g and 99.95%, respectively.
The effect of reaction temperature is shown in Figure 4b. The results indicate that reaction temperature has little effect on the adsorption efficiency of GO from spent LIBs. It also demonstrates that the prepared GO exhibits a great thermal stability; the adsorption capacities at different temperatures are about 830 mg/g, and the removal rates are greater than 99.5%. This result demonstrates that GO is a great adsorbent with high adsorption capacity and thermal stability, which can meet a wide working temperature conditions.
The reaction time is also a key factor for MB removal. The adsorption efficiency of GO for MB at different reaction times is shown in Figure 5a. It is evident that the adsorption capacity of GO increases with the increase of reaction time. As the reaction time continues to increase, the adsorption amount tends to be flat. When the reaction time is short, MB molecules were not completely in contact with GO, and the adsorption capacity is low. The adsorption of GO tends to be saturated with the increase of reaction time, and the adsorption capacity hardly increases (about 833.3 mg/g). In the initial adsorption stage, the high MB concentration leads to a large driving force during the adsorption process. At this time, there are many active functional groups and active sites exposed on the surface of GO which can quickly combine with MB and the efficiency increases rapidly. As time lengthens, the adsorption driving force decreases and the concentration of MB declines. Meanwhile, the number of exposed active functional groups and active sites on the GO surface is also greatly reduced, resulting in a slower growth of adsorption rate. Similarly, the removal rate of MB also increased with increased reaction time. It is worth noting that in only a 10 min reaction, the removal rate can reach to 99.87%, indicating that the adsorption capacity of GO is high and a large amount of MB can be removed in a short time. The removal rate tends to be stable with the extension of time, and the removal rate and adsorption capacity were 99.96% and 833.11 mg/g, respectively. To further demonstrate the adsorption properties of GO, the adsorption properties of GF-GO were investigated under the same conditions. As Figure 5b shows, both the adsorption capacity and removal rate of GO are better than those of GF-GO. The adsorption capacity of GO is 1.2 times greater than that of GF-GO while the removal rate increased by 20.89% compared to GF-GO. The reason for this difference is that the GO is oxidized more completely than GF-GO under same treatment, and amount of oxygen containing functional groups and active sites could result strong adsorption capacity.

2.3. Adsorption Kinetics

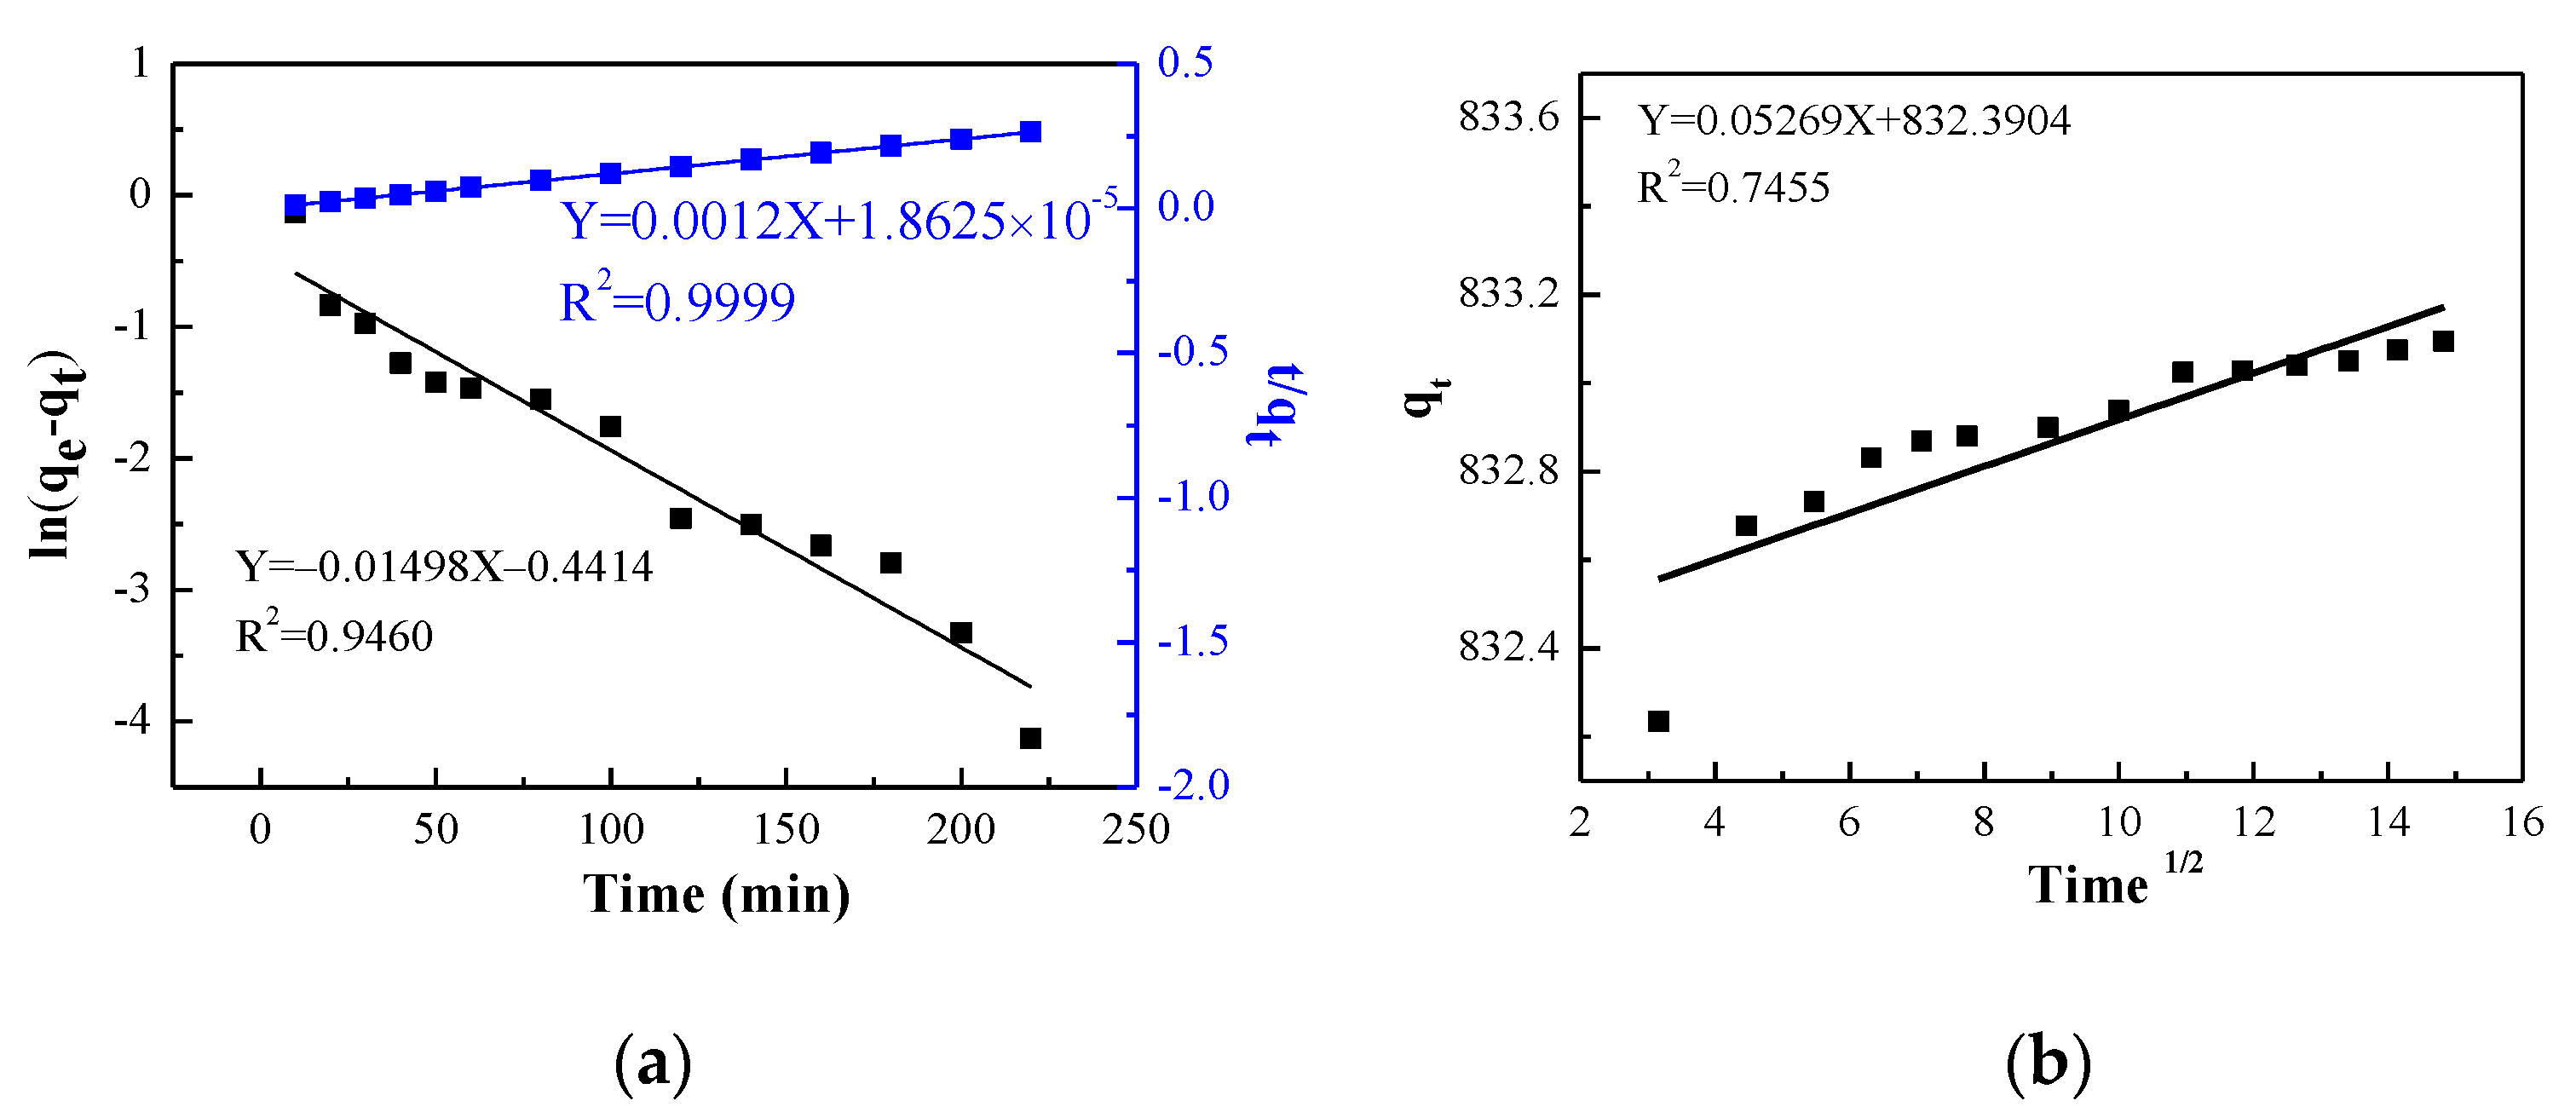
Adsorption kinetics models can describe the rate controlling the process of adsorption. Therefore, the experimental data were fitted with pseudo-first-order, pseudo-second-order and Weber–Morris models.
  • Pseudo-First-Order kinetic equation reflecting the relationship between the rate of a chemical reaction and the conditions of the substances involved in the reaction. The expression is as follows [39]:
d q t d t = k 1 q e q t
ln q e q t = ln q e k 1 t
Here, t is the reaction time, q e and q t represent the adsorption capacity at equilibrium and time t, respectively (mg/g); k 1 is the adsorption rate constant of the pseudo-first-order kinetic model (1/min).
2.
The pseudo-second-order kinetic model is an assumption that the adsorption rate is governed by a chemisorption mechanism, which involves electron sharing or electron transfer between adsorbent and adsorbate. The behavior of the entire adsorption process can be revealed and is consistent with the speed control step. The equation is as follows [40]:
t q t = 1 k 2   q e 2 + 1 q e t
Here, q e and q t represent the equilibrium and time t adsorption capacity, respectively (mg/g) ;   k 2 is the adsorption rate constant (1/min).
3.
In order to obtain the intraparticle diffusion rate constant of the adsorbent, the Weber–Morris model is used to analyze the controlling steps in the reaction, and the expression is as follows [41].
q t = k i p t 1 2 + C
Here, q t is the adsorption capacity of GO for MB at time t (mg/g), k i p is the internal diffusivity constant, C is a constant related to boundary layer and thickness.
The linear diagrams of absorption data fitted by the three kinetic models are shown in Figure 6. The R2 of the pseudo-first-order kinetic and Weber–Morris model are 0.9460 and 0.74552, respectively (Figure 6a), which means that the degree of matching between the experimental data and the model is relatively low. However, the R2 of pseudo-second-order kinetics is high, at up to 0.9999, representing that the adsorption process of GO for MB is chemical adsorption (Figure 6b). Furthermore, the theoretical maximum adsorption capacity is 833.33 mg/g, which is very close to the actual experimental data.

2.4. Adsorption Isotherms

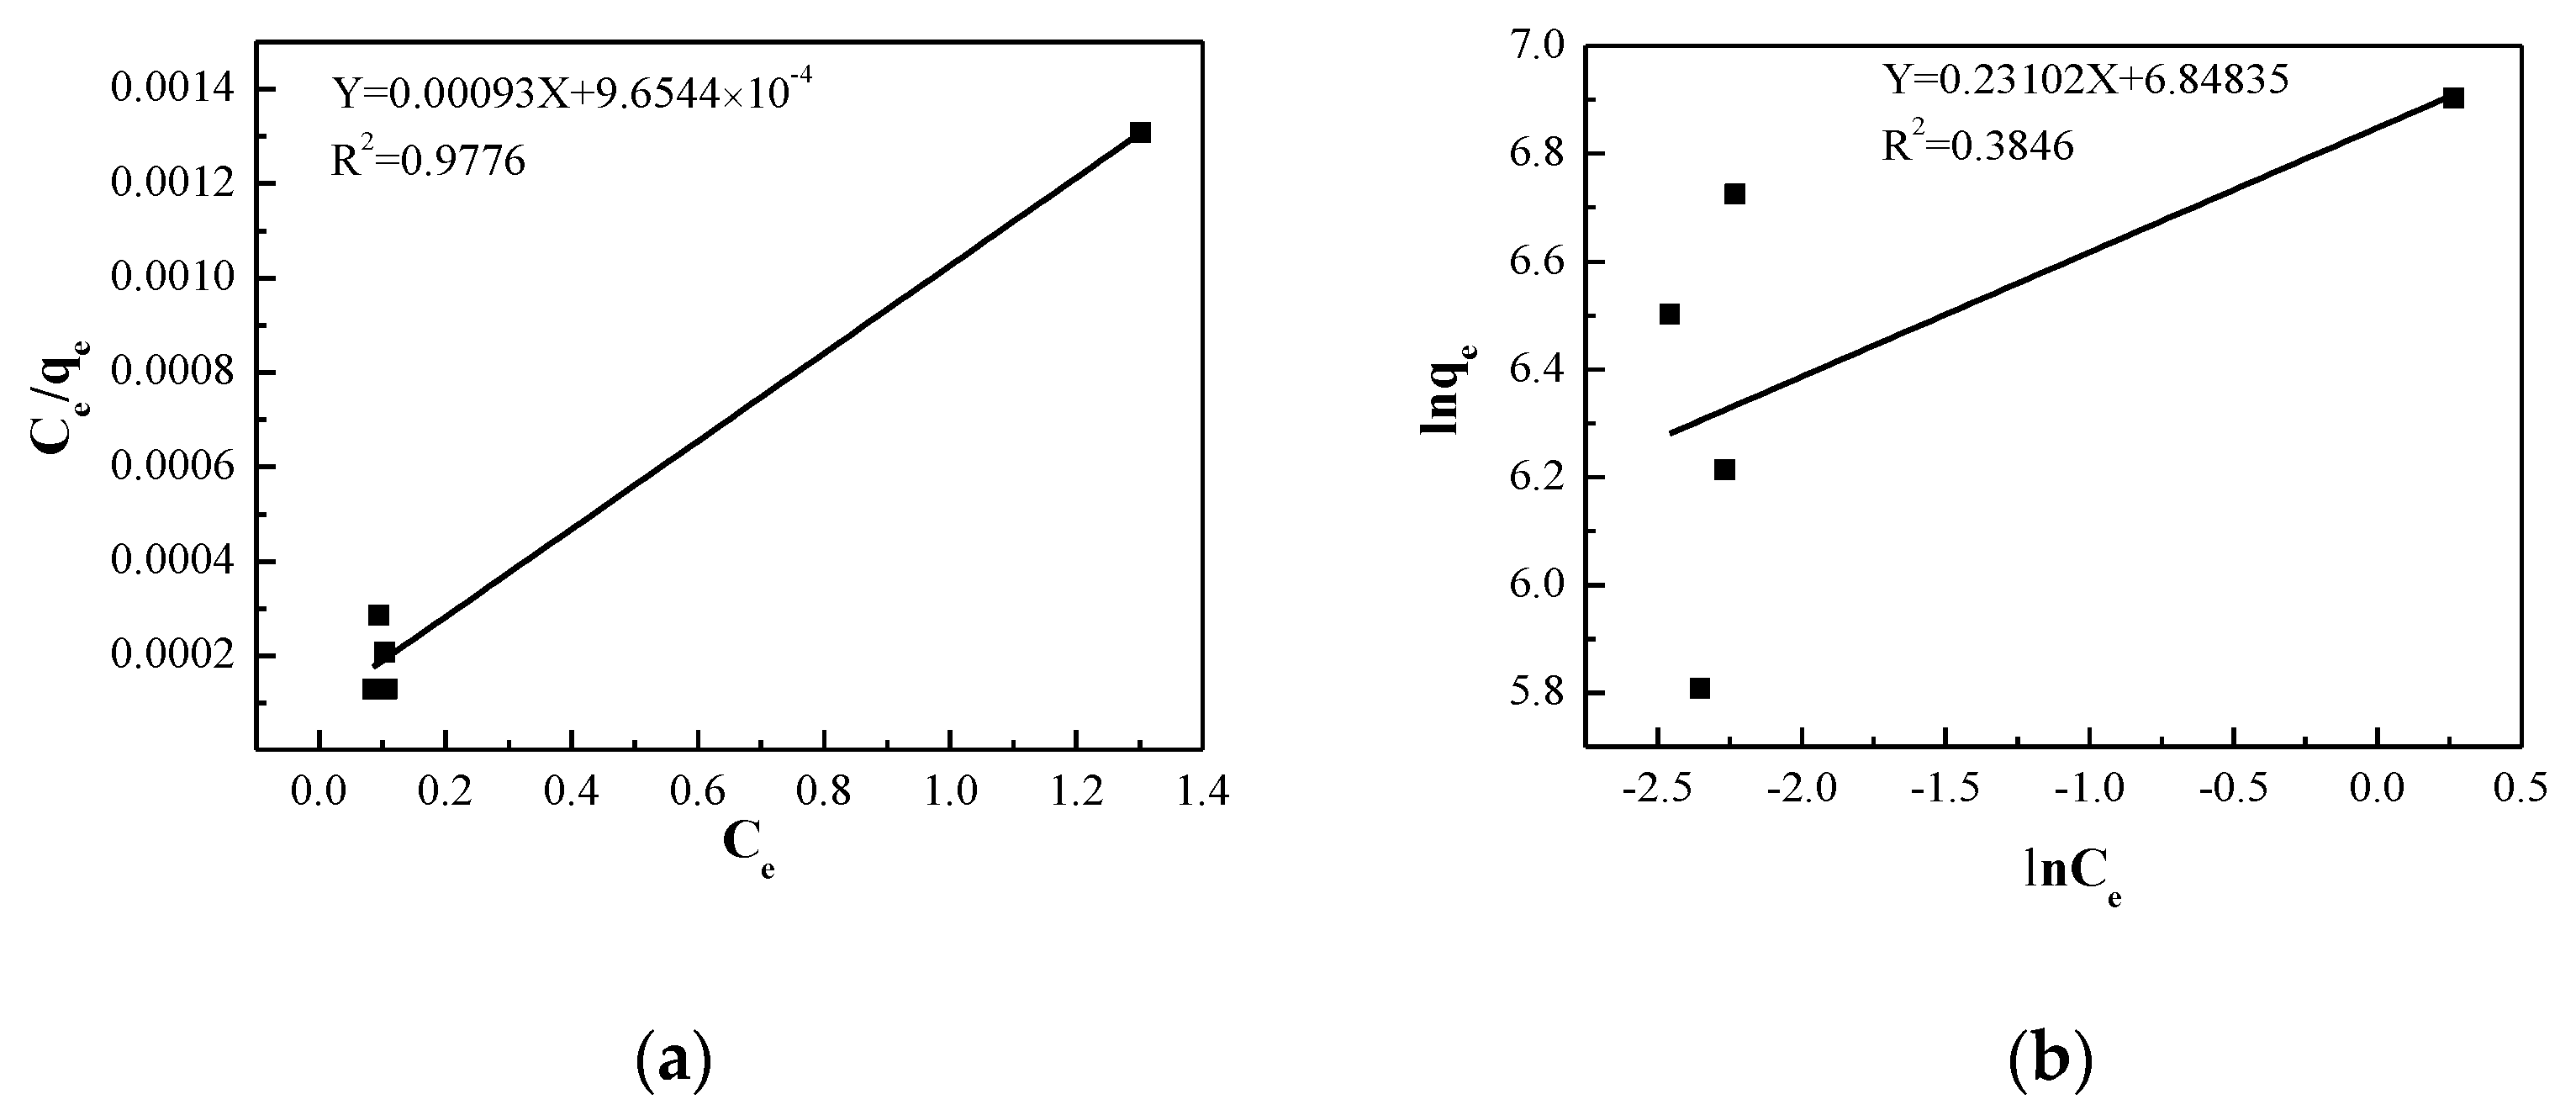
The adsorption isotherms are generally used to describe the relationship between the contaminant and the adsorbent when they reach equilibrium at a specific temperature [42]. It can macroscopically summarize the characteristics of adsorption such as adsorption amount, adsorption strength, adsorption state and so on [43]. Here, we chose two common isothermal adsorption models to investigate the GO adsorption of MB.
  • The Langmuir adsorption model assumes that the adsorbate is adsorbed by a monolayer on the surface of the adsorbent. Meanwhile, the distribution of each adsorption position on the surface is uniform, and the enthalpy change during the adsorption process is the same. The linear form of the equation is as follows [44]:
C e q e = 1 q m K L + C e q m
Here, C e is the equilibrium concentration (mg/L), q e is the adsorption quantity at adsorption equilibrium (mg/g), q m is the saturated adsorption capacity of monomolecular adsorption, K L is the Langmuir constant (L/mg), which represents the size of binding force of adsorbent to adsorbent. The K L value is related to the reaction temperature and the properties of the adsorbent, and a large value of K L indicates a strong adsorption capacity. q m is the maximum adsorption capacity; the larger the q m , the better the performance of the absorbent. According to the experimental data, C e q e is plotted against C e , and then regression analysis is performed to fit it into the corresponding regression equation. The adsorption constant K L and the maximum adsorption capacity q m of the monolayer can be obtained from the fitting curve through the slope and intercept.
2.
The Freundlich adsorption isotherm is an empirical adsorption equilibrium model established based on the adsorption of the adsorbent on the multiphase surface. If the solid surface of the adsorbent is not uniform, the adsorption equilibrium constant will be related to the surface coverage, and its expression equation is [45]:
ln q e = ln K F + 1 n ln C e
Here, C e is the equilibrium concentration (mg/L), q e is the adsorption quantity at adsorption equilibrium (mg/g), K F is the Freundlich constant, which represents the strength of adsorption capacity, n is the empirical constant of the adsorption process.
Adsorption isotherms were analyzed according to according to the linear form of Langmuir and Freundlich models, respectively. The fitting curves are exhibited in Figure 7 and the parameters of the Freundlich and Langmuir models were determined and listed in Table 3. The higher R2 (0.9776) of the Langmuir equation suggests that it can fit the experimental data and evaluate the maximum adsorption capacity of GO. Meanwhile, the small R2 (0.3846) demonstrates that the data are not quite in line with Freundlich model. This is attributed to the fact that the Freundlich adsorption isotherm is an empirical model and its fitting accuracy decreases with the increase of adsorbent [46].

3. Conclusions

In conclusion, GO with high adsorption capacity for MB has been successfully produced from waste graphite anodes from spent LIBs via a modified Hummers method. The experimental results indicate that GO is an excellent adsorbent with extraordinary removal capacity and fast adsorption rates for MB dye removal from dyeing water. When the initial concentrations of MB are lower than 250 mg/L, the removal efficiency is higher than 99.95% and the adsorption capacity can reach to 833.11 mg/g. The reaction time, initial pH and concentrations of MB solution can affect the removal efficiency. Besides, the reaction temperature has little effect on adsorption efficiency, which indicates GO has great thermal stability and is suitable for various temperature conditions. The adsorption kinetics and isotherms were studied, and the kinetic fitting revealed that the adsorption process is more in line with the pseudo-second-order kinetic model than pseudo-first-order kinetic model, with the theoretical maximum adsorption capacity value being close to the experimental value. The adsorption isotherm is well-modeled by the Langmuir isotherm model. This study combines the recycling of GA from spent LIBs and the removal of MB dye in wastewater, which is a win-win approach. It can not only avoid the waste and pollution of GA but also benefits the cleaning of MB dye wastewater.

4. Materials and Methods

4.1. Materials

The spent LIBs were obtained from laptops, which were produced by Simplo Technology Co. Ltd. Commercial graphite flakes were purchased from thermo scientific sources. MB, potassium permanganate (KMnO4) and sodium hydroxide (NaOH) were purchased from Sigma-Aldrich. Concentrated sulfuric acid (H2SO4) and phosphoric acid (H3PO4) were purchased from VWR Chemicals. Hydrogen peroxide (H2O2), sodium chloride (NaCl) and hydrochloric acid (HCl) was purchased from EMD Millipore Corporation. All of the chemicals used in this work were analytical grade and were used directly with no further purification.

4.2. Preparation of GO

Since there is still residual power inside the spent LIBs, they were soaked in NaCl solution to consume the residual power. After the batteries were fully discharged, they were manually disassembled in a fume hood, and the positive and negative materials of the battery were collected, respectively. The GA adheres to the copper foil current collector with a hydrophilic binder; the graphite can be peeled off from the copper foil by immersing the negative electrode material in an aqueous solution and simple sonication. Then the obtained GA was dried in a vacuum drying oven for 12 h at 30 °C and passed through a 230-mesh sieve to make the particle size uniform.
GO was prepared from the collected GA by a modified Hummers method. GA (1 g) was mixed with H2SO4 and H3PO4 (9:1) in a small beaker under an ice-water mixture condition. Then KMnO4 (6 g) was slowly added in batches into the beaker with constant stirring for 30 min. After that, the reaction temperature of the system was raised to 50 ℃ and maintained for 12 h, then the beaker was placed in the ice-water mixture again. H2O2 solution (10 mL 30% H2O2 dissolved in 100 mL deionized water) was added to the suspension slowly while stirring until the color of solution turned to gold. Next, the mixture was filtered and washed with HCl and deionized water until the pH was about 7. Finally, the obtained GO was dispersed in deionized water and cleaned for 2 h using an ultrasonic cleaner, and dried at 60 °C for 12 h in a vacuum drying oven. Meanwhile, the GO prepared by commercial GF under same conditions was named GF-GO.

4.3. Adsorption of MB

GO was added to the MB solution, then the solvent was placed in a magnetic stirrer to react at a constant temperature for a certain time. After the reaction was completed, the solution was filtered using a polytetrafluoroethylene membrane filter, and the filter liquor and residue were collected separately. With deionized water as the reference, the residual concentration of MB solution was calculated by the absorbance value measured by UV-VIS spectrophotometer. Due to the accuracy requirements of the instrument, all samples were diluted to the same scale before testing. The influence of different factors on the adsorption effect was analyzed by comparative experiment. The variables were the pH value of the MB solution (3–11), addition of GO (5–25 mg), initial concentration (100–300 mg/L), reaction temperature (20–60 °C) and reaction time (10–240 min).
MB solution was selected to simulate dye wastewater as the water to be treated, and standard MB solutions with mass concentrations of 1, 2, 3, 4, 5, 6, 7, 8, 9, and 10 mg/L were prepared. Through the full wavelength test, it can be determined that the maximum absorption wavelength is 664 nm (Figure 8a). The corresponding absorbance of the standard solution is measured at 664 nm. The mass concentrations of MB are taken as the abscissa and the absorbance as the ordinate for a linear fit, with standard curves as shown in Figure 8b. The linear relationship between the standard concentration and absorbance is:
Y = 1.82807X + 0.0683 (R2 = 0.9994)
Here, Y represents absorbance, X is the MB concentration (mg/g), R2 is the coefficient of determination.
From the regression equation and coefficient of determination, there is a good linear correlation between the absorbance of MB and the determined concentration range. Therefore, according to the absorbance of MB solution measured by UV-VIS spectrophotometer, the residual concentration of MB can be calculated through the standard curve equation. Moreover, the removal rate and adsorption capacity are obtained by the following formula [47]:
R = C 0 C e C 0 × 100 %
q = C 0 C e V m
Here, R is the removal rate of MB (%), C 0 is the initial concentration (mg/L), C e is the equilibrium concentration (mg/L), q is the unit adsorption capacity (mg/g), V is the volume of solution (L), m is the mass value of absorbent (g).

Supplementary Materials

The following supporting information can be downloaded at: https://www.mdpi.com/article/10.3390/batteries8110249/s1, Figure S1: Raman spectra of commercial graphite flakes (GF) and graphite oxide (GO) prepared by GF; Figure S2: XRD images of GF and GO prepared by GF. Figure S3: AFM images of prepared GO.

Author Contributions

Y.Q.: Data curation, formal analysis, writing–original draft, conceptualization, methodology, writing—review & editing. H.Z.: conceptualization, methodology, writing-review & editing. Z.R.: Conceptualization, methodology, writing-review & editing, supervision. Y.L.: Conceptualization, methodology, writing-review & editing, supervision, project administration and funding acquisition. All authors have read and agreed to the published version of the manuscript.

Funding

This work is financially supported by the German Research Foundation (DFG: LE 2249/15-1) and Sino-German Center for Research Promotion (GZ1579). Y. Qiao thanks China Scholarship Council (No. 202006420028).

Conflicts of Interest

The authors declare no conflict of interest.

References

  1. Theerthagiri, J.; Karuppasamy, K.; Lee, S.J.; Shwetharani, R.; Kim, H.-S.; Pasha, S.K.K.; Ashokkumar, M.; Choi, M.Y. Fundamentals and comprehensive insights on pulsed laser synthesis of advanced materials for diverse photo- and electrocatalytic applications. Light. Sci. Appl. 2022, 11, 1–47. [Google Scholar] [CrossRef] [PubMed]
  2. Li, M.; Lu, J.; Chen, Z.; Amine, K. 30 Years of lithium-Ion batteries. Adv. Mater. 2018, 30, 1800561. [Google Scholar] [CrossRef] [PubMed] [Green Version]
  3. Xie, J.; Lu, Y.-C. A retrospective on lithium-ion batteries. Nat. Commun. 2020, 11, 2499. [Google Scholar] [CrossRef] [PubMed]
  4. Zhang, J.; You, C.; Lin, H.; Wang, J. Electrochemical Kinetic Modulators in Lithium–Sulfur Batteries: From Defect-Rich Catalysts to Single Atomic Catalysts. Energy Environ. Mater. 2022, 5, 731–750. [Google Scholar] [CrossRef]
  5. Wang, J.; Zhang, J.; Cheng, S.; Yang, J.; Xi, Y.; Hou, X.; Xiao, Q.; Lin, H. Long-Life Dendrite-Free Lithium Metal Electrode Achieved by Constructing a Single Metal Atom Anchored in a Diffusion Modulator Layer. Nano Lett. 2021, 21, 3245–3253. [Google Scholar] [CrossRef]
  6. Wood, L. Global lithium-ion battery market 2021 to 2030. 2021. Available online: https://www.prnewswire.com/news-releases/global-lithium-ion-battery-market-2021-to-2030---declining-prices-of-lithium-ion-batteries-presents-opportunities-301333864.html (accessed on 14 July 2021).
  7. Tran, M.K.; Rodrigues, M.-T.F.F.; Kato, K.; Babu, G.; Ajayan, P.M. Deep eutectic solvents for cathode recycling of Li-ion batteries. Nat. Energy 2019, 4, 339–345. [Google Scholar] [CrossRef]
  8. Beaudet, A.; Larouche, F.; Amouzegar, K.; Bouchard, P.; Zaghib, K. Key Challenges and Opportunities for Recycling Electric Vehicle Battery Materials. Sustainability 2020, 12, 5837. [Google Scholar] [CrossRef]
  9. Kang, D.H.P.; Chen, M.; Ogunseitan, O.A. Potential Environmental and Human Health Impacts of Rechargeable Lithium Batteries in Electronic Waste. Environ. Sci. Technol. 2013, 47, 5495–5503. [Google Scholar] [CrossRef]
  10. Xiao, J.; Li, J.; Xu, Z. Challenges to Future Development of Spent Lithium Ion Batteries Recovery from Environmental and Technological Perspectives. Environ. Sci. Technol. 2020, 54, 9–25. [Google Scholar] [CrossRef]
  11. Lv, W.; Wang, Z.; Cao, H.; Sun, Y.; Zhang, Y.; Sun, Z.H. A Critical Review and Analysis on the Recycling of Spent Lithium-Ion Batteries. ACS Sustain. Chem. Eng. 2018, 6, 1504–1521. [Google Scholar] [CrossRef]
  12. Natarajan, S.; Aravindan, V. Recycling Strategies for Spent Li-Ion Battery Mixed Cathodes. ACS Energy Lett. 2018, 3, 2101–2103. [Google Scholar] [CrossRef] [Green Version]
  13. Zhao, Y.; Yuan, X.; Jiang, L.; Wen, J.; Wang, H.; Guan, R.; Zhang, J.; Zeng, G. Regeneration and reutilization of cathode materials from spent lithium-ion batteries. Chem. Eng. J. 2019, 383, 123089. [Google Scholar] [CrossRef]
  14. Natarajan, S.; Aravindan, V. An Urgent Call to Spent LIB Recycling: Whys and Wherefores for Graphite Recovery. Adv. Energy Mater. 2020, 10, 2002238. [Google Scholar] [CrossRef]
  15. Natarajan, S.; Ede, S.R.; Bajaj, H.C.; Kundu, S. Environmental benign synthesis of reduced graphene oxide (rGO) from spent lithium-ion batteries (LIBs) graphite and its application in supercapacitor. Colloids Surf. A Physicochem. Eng. Asp. 2018, 543, 98–108. [Google Scholar] [CrossRef]
  16. Yi, C.; Yang, Y.; Zhang, T.; Wu, X.; Sun, W.; Yi, L. A green and facile approach for regeneration of graphite from spent lithium ion battery. J. Clean. Prod. 2020, 277, 123585. [Google Scholar] [CrossRef]
  17. Zhang, W.; Liu, Z.; Xia, J.; Li, F.; He, W.; Li, G.; Huang, J. Preparing graphene from anode graphite of spent lithium-ion batteries. Front. Environ. Sci. Eng. 2017, 11, 6. [Google Scholar] [CrossRef]
  18. Zhang, Y.; Song, N.; He, J.; Chen, R.; Li, X. Lithiation-Aided Conversion of End-of-Life Lithium-Ion Battery Anodes to High-Quality Graphene and Graphene Oxide. Nano Lett. 2018, 19, 512–519. [Google Scholar] [CrossRef] [PubMed]
  19. Wang, R.; Huang, J.; Zhang, X.; Han, J.; Zhang, Z.; Gao, T.; Xu, L.; Liu, S.; Xu, P.; Song, B. Two-Dimensional High-Entropy Metal Phosphorus Trichalcogenides for Enhanced Hydrogen Evolution Reaction. ACS Nano 2022, 16, 3593–3603. [Google Scholar] [CrossRef]
  20. Zhang, Y.; Cao, Z.; Liu, S.; Du, Z.; Cui, Y.; Gu, J.; Shi, Y.; Li, B.; Yang, S. Charge-enriched strategy based on mxene-based polypyrrole layers toward. Adv. Energy Mater. 2022, 12, 20103979. [Google Scholar]
  21. Theerthagiri, J.; Lee, S.J.; Karuppasamy, K.; Arulmani, S.; Veeralakshmi, S.; Ashokkumar, M.; Choi, M.Y. Application of advanced materials in sonophotocatalytic processes for the remediation of environmental pollutants. J. Hazard. Mater. 2021, 412, 125245. [Google Scholar] [CrossRef]
  22. Ramesha, G.K.; Kumara, A.V.; Muralidhara, H.B.; Sampath, S. Graphene and graphene oxide as effective adsorbents toward anionic and cationic dyes. J. Colloid Interface Sci. 2011, 361, 270–277. [Google Scholar] [CrossRef] [PubMed]
  23. Zhao, G.; Li, J.; Ren, X.; Chen, C.; Wang, X. Few-Layered Graphene Oxide Nanosheets As Superior Sorbents for Heavy Metal Ion Pollution Management. Environ. Sci. Technol. 2011, 45, 10454–10462. [Google Scholar] [CrossRef] [PubMed]
  24. Zhao, G.; Ren, X.; Gao, X.; Tan, X.; Li, J.; Chen, C.; Huang, Y.; Wang, X. Removal of Pb(ii) ions from aqueous solutions on few-layered graphene oxide nanosheets. Dalton. Trans. 2011, 40, 10945–10952. [Google Scholar] [CrossRef] [PubMed]
  25. Zhao, G.; Wen, T.; Yang, X.; Yang, S.; Liao, J.; Hu, J.; Shao, D.; Wang, X. Preconcentration of U(VI) ions on few-layered graphene oxide nanosheets from aqueous solutions. Dalton. Trans. 2012, 41, 6182–6188. [Google Scholar] [CrossRef] [PubMed]
  26. Bradder, P.; Ling, S.K.; Wang, S.; Liu, S. Dye Adsorption on Layered Graphite Oxide. J. Chem. Eng. Data 2010, 56, 138–141. [Google Scholar] [CrossRef]
  27. Liu, F.; Chung, S.; Oh, G.; Seo, T.S. Three-Dimensional Graphene Oxide Nanostructure for Fast and Efficient Water-Soluble Dye Removal. ACS Appl. Mater. Interfaces 2011, 4, 922–927. [Google Scholar] [CrossRef] [PubMed]
  28. Sun, L.; Yu, H.; Fugetsu, B. Graphene oxide adsorption enhanced by in situ reduction with sodium hydrosulfite to re-move acridine orange from aqueous solution. J. Hazard. Mater. 2012, 203–204, 101–110. [Google Scholar] [CrossRef] [PubMed] [Green Version]
  29. Yang, S.-T.; Chen, S.; Chang, Y.; Cao, A.; Liu, Y.; Wang, H. Removal of methylene blue from aqueous solution by graphene oxide. J. Colloid Interface Sci. 2011, 359, 24–29. [Google Scholar] [CrossRef] [PubMed]
  30. Li, Y.; Du, Q.; Liu, T.; Peng, X.; Wang, J.; Sun, J.; Wang, Y.; Wu, S.; Wang, Z.; Xia, Y.; et al. Comparative study of methylene blue dye adsorption onto activated carbon, graphene oxide, and carbon nanotubes. Chem. Eng. Res. Des. 2013, 91, 361–368. [Google Scholar] [CrossRef]
  31. Wijaya, R.; Andersan, G.; Santoso, S.P.; Irawaty, W. Green Reduction of Graphene Oxide using Kaffir Lime Peel Extract (Citrus hystrix) and Its Application as Adsorbent for Methylene Blue. Sci. Rep. 2020, 10, 667. [Google Scholar] [CrossRef] [Green Version]
  32. Tran, D.; Nguyen, T.; Doan, T.; Doan, T.-H.; Dang, V.-C.; Nghiem, L.D. Removal of direct blue 71 and methylene blue from water by graphene oxide: Effects of charge interaction and experimental parameters. J. Dispers. Sci. Technol. 2022, 1–12. [Google Scholar] [CrossRef]
  33. Soudagar, S.; Akash, S.; Venkat, M.S.; Poiba, V.R.; Vangalapati, M. Adsorption of methylene blue dye on nano graphene ox-ide-thermodynamics and kinetic studies. Mater. Today Proc. 2022, 59, 667–672. [Google Scholar] [CrossRef]
  34. de Araujo, C.M.B.; Nascimento, G.F.O.D.; Da Costa, G.R.B.; Da Silva, K.S.; Baptisttella, A.M.S.; Ghislandi, M.; Sobrinho, M.A.D.M. Adsorptive removal of dye from real textile wastewater using graphene oxide produced via modifications of hummers method. Chem. Eng. Commun. 2018, 206, 1375–1387. [Google Scholar] [CrossRef]
  35. Kim, J.; Cote, L.J.; Huang, J. Two Dimensional Soft Material: New Faces of Graphene Oxide. Accounts Chem. Res. 2012, 45, 1356–1364. [Google Scholar] [CrossRef]
  36. Aboutalebi, S.H.; Gudarzi, M.M.; Zheng, Q.B.; Kim, J.-K. Spontaneous Formation of Liquid Crystals in Ultralarge Graphene Oxide Dispersions. Adv. Funct. Mater. 2011, 21, 2978–2988. [Google Scholar] [CrossRef]
  37. Peng, W.; Li, H.; Liu, Y.; Song, S. A review on heavy metal ions adsorption from water by graphene oxide and its composites. J. Mol. Liquids 2017, 230, 496–504. [Google Scholar] [CrossRef]
  38. Guo, Y.; Deng, J.; Zhu, J.; Zhou, X.; Bai, R. Removal of mercury II and methylene blue from a wastewater environment with mag-netic graphene oxide adsorption kinetics, isotherms and mechanism. RSC Adv. 2016, 86, 82523–82536. [Google Scholar] [CrossRef]
  39. Lin, J.; Wang, L. Comparison between linear and non-linear forms of pseudo-first-order and pseudo-second-order ad-sorption kinetic models for the removal of methylene blue by activated carbon. Front. Environ. Sci. Eng. China 2009, 3, 320–324. [Google Scholar] [CrossRef]
  40. Wu, F.-C.; Tseng, R.-L.; Huang, S.-C.; Juang, R.-S. Characteristics of pseudo-second-order kinetic model for liquid-phase adsorption: A mini-review. Chem. Eng. J. 2009, 151, 1–9. [Google Scholar] [CrossRef]
  41. Svilović, S.; Rušić, D.; Bašić, A. Investigations of different kinetic models of copper ions sorption on zeolite 13X. Desalination 2010, 259, 71–75. [Google Scholar] [CrossRef]
  42. Wang, J.; Guo, X. Adsorption isotherm models: Classification, physical meaning, application and solving method. Chemosphere 2020, 258, 127279. [Google Scholar] [CrossRef] [PubMed]
  43. Majd, M.M.; Kordzadeh-Kermani, V.; Ghalandari, V.; Askari, A.; Sillanpää, M. Adsorption isotherm models: A comprehensive and systematic review (2010−2020). Sci. Total. Environ. 2021, 812, 151334. [Google Scholar] [CrossRef] [PubMed]
  44. Kim, H.; Kang, S.-O.; Park, S.; Park, H.S. Adsorption isotherms and kinetics of cationic and anionic dyes on three-dimensional reduced graphene oxide macrostructure. J. Ind. Eng. Chem. 2015, 21, 1191–1196. [Google Scholar] [CrossRef]
  45. Nounou, M.N.; Nounou, H.N. Multiscale estimation of the Freundlich adsorption isotherm. Int. J. Environ. Sci. Technol. 2010, 7, 509–518. [Google Scholar] [CrossRef] [Green Version]
  46. Chen, X.; Hossain, F.; Duan, C.; Lu, J.; Tsang, Y.F.; Islam, S.; Zhou, Y. Isotherm models for adsorption of heavy metals from water—A review. Chemosphere 2022, 307, 135545. [Google Scholar] [CrossRef]
  47. Durrani, W.Z.; Nasrullah, A.; Khan, A.S.; Fagieh, T.M.; Bakhsh, E.M.; Akhtar, K.; Khan, S.B.; Din, I.U.; Khan, M.A.; Bokhari, A. Adsorption efficiency of date palm based activated carbon-alginate membrane for methylene blue. Chemosphere 2022, 302, 134793. [Google Scholar] [CrossRef]
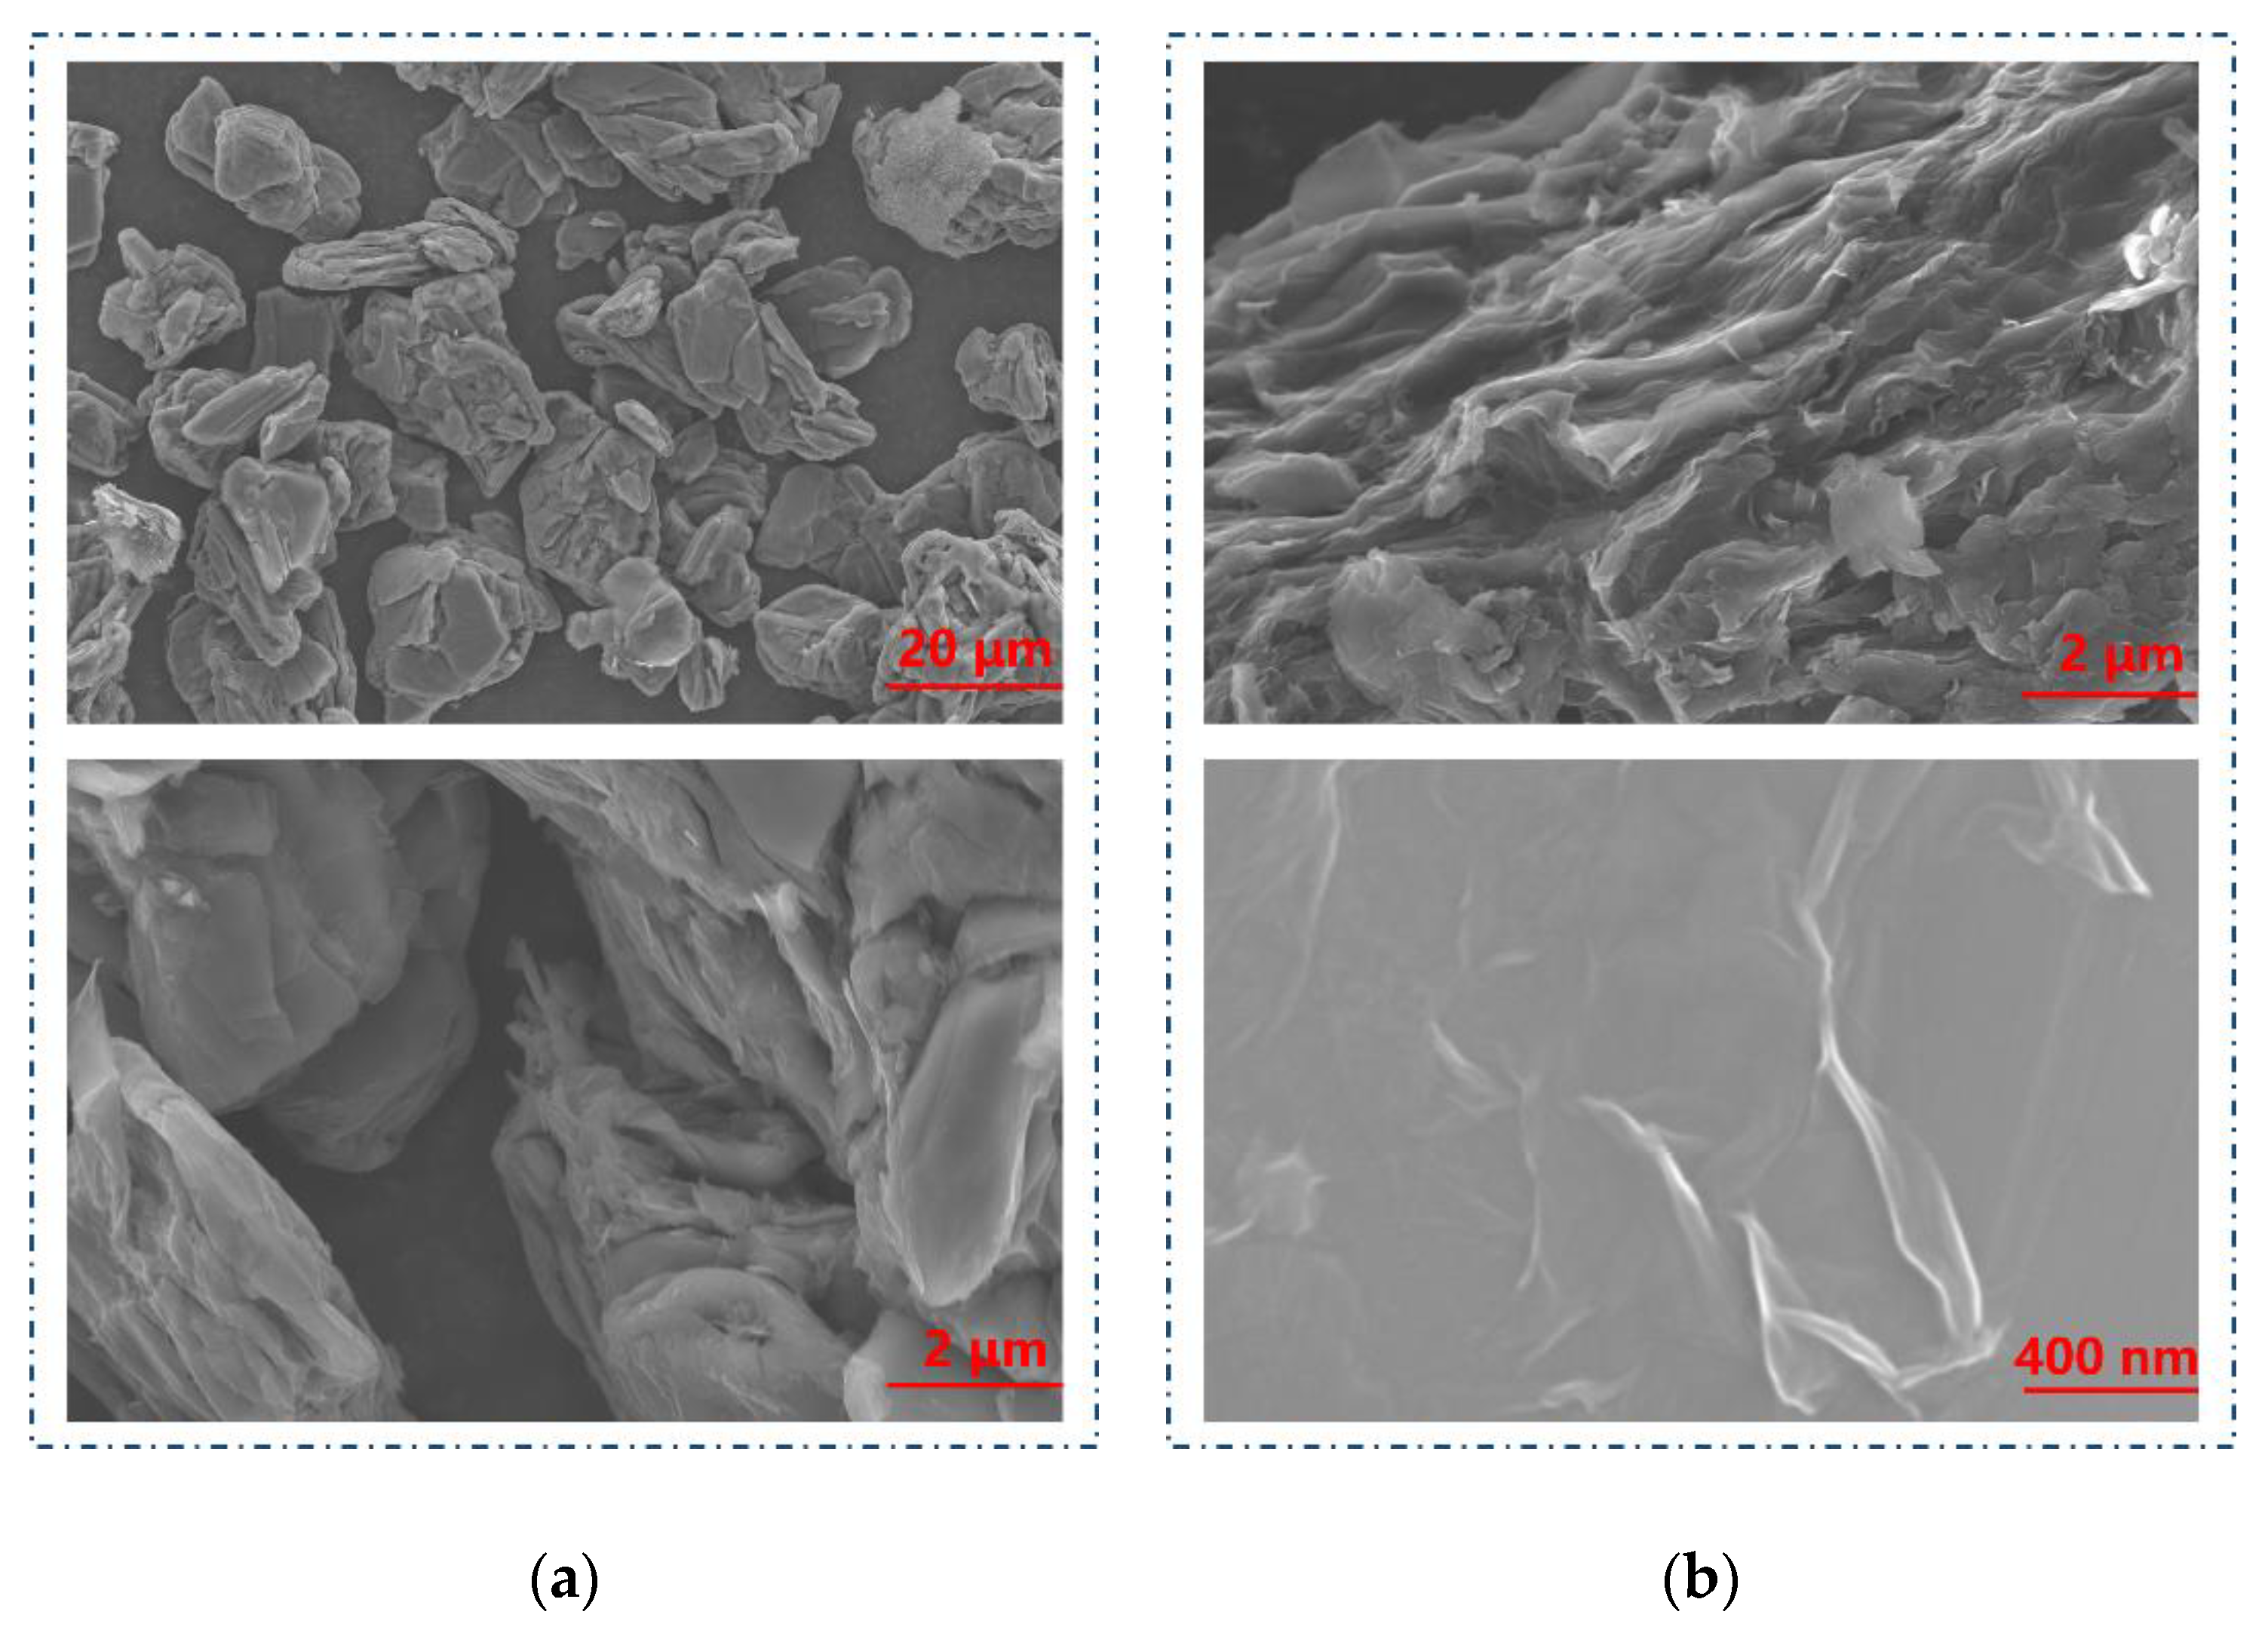
Figure 1. SEM images of (a) GA. (b) GO.
Batteries 08 00249 g001
Figure 2. (a) Raman images of GA and GO. (b) XRD pattern of GA and GO.
Batteries 08 00249 g002
Figure 3. Effect of (a) initial pH and (b) GO addition on adsorption.
Batteries 08 00249 g003
Figure 4. Effect of (a) initial concentration of MB solution and (b) reaction temperature, on adsorption capacity.
Batteries 08 00249 g004
Figure 5. (a) Effect of reaction time on adsorption. (b) The comparison of the adsorption capacity of GO, where the GA-GO and GF-GO are GO prepared by GA and commercial graphite flakes, respectively.
Batteries 08 00249 g005
Figure 6. Fitting curve (a) Pseudo-first-order and pseudo-second-order kinetic. (b) Weber–Morris model.
Batteries 08 00249 g006
Figure 7. (a) Langmuir isotherm adsorption curve of GO for MB adsorption. (b) Fitting of the Freundlich adsorption isotherm of GO for MB adsorption.
Batteries 08 00249 g007
Figure 8. (a) UV–VIS spectra of MB solution with different concentrations. (b) MB standard solution concentration and absorbance fitting curve.
Batteries 08 00249 g008
Table 1. The adsorption of MB using GO prepared by Hummers method.
Raw MaterialspHqe (mg/g)Reference
Graphite-351.1[26]
Graphite6714[29]
Expandable graphite9243.9[30]
Natural graphite powder by PT. Brataco-276.06[31]
Graphite powder7476.19[32]
Graphite fine powder (98%, Loba Chemicals)8428.485[33]
Graphite12308.11[34]
Spent GA9833.11This study
Table 2. Parameters of kinetic models for MB adsorption.
Kinetic ModelParametersValue
Pseudo-first-order kineticqe (mg/g)0.6431
k1 (1/min)0.01498
R20.9460
Pseudo-second-order kineticqe (mg/g)833.33
k2 (g/(mg min))0.077
R20.9999
Weber–Morris modelkip0.05269
C832.904
R20.7455
Table 3. Parameters of adsorption isotherm models for MB adsorption.
Isotherm ModelParametersValue
Langmuirqm1075.26
KL0.9632
R20.9776
Freundlichn4.328
KF942.27
R20.1795
Publisher’s Note: MDPI stays neutral with regard to jurisdictional claims in published maps and institutional affiliations.