Article

Assessing the Feasibility of a Cold Start Procedure for Solid State Batteries in Automotive Applications

Institute for Advanced Automotive Propulsion Systems (IAAPS), University of Bath, Bath BA2 7AY, UK
*
Author to whom correspondence should be addressed.
Batteries 2022, 8(2), 13; https://doi.org/10.3390/batteries8020013
Submission received: 12 October 2021 / Revised: 17 December 2021 / Accepted: 13 January 2022 / Published: 5 February 2022
(This article belongs to the Special Issue Solid State Batteries)

Abstract

:
This paper addresses the thermal management of a solid polymer electrolyte battery system, which is currently the only commercialized solid-state battery chemistry. These batteries aim to increase the range of electric vehicles by facilitating a lithium metal anode but are limited by operational temperatures above 60 °C. The feasibility of a cold start procedure is examined, which would enable a solid polymer battery to be used, without preconditioning, in a wide variety of ambient temperatures. The proposed solution involves dividing the solid-state battery into smaller sub-packs, which can be heated and brought online more quickly. Thermal modelling shows a cold start procedure is theoretically feasible when using a small liquid electrolyte lithium battery at the start. The key bottlenecks are the rate at which the solid-state batteries can be heated, and the discharge rates they can provide. After resistive heating is used for the first solid-state module, all subsequent heating can be provided by waste heat from the motor and operating battery modules. Due to the insulation required, the proposed system has lower volumetric, but higher gravimetric energy density than liquid electrolyte systems. This work suggests that with suitable system-level design, solid-state batteries could be widely adopted despite temperature constraints.

1. Introduction

All Solid-State Batteries (ASSB) are highlighted as a potential solution to many or all of the limitations and drawbacks of current Liquid Electrolyte Battery (LEB) cells and systems [1,2]; these include range, charging times, safety, cost, and recyclability. For this reason, they are of considerable interest to vehicle makers, who are under increasing pressure from regulators to decarbonize the transportation industry and meet the pledges of the 2015 Paris Climate Agreement [3] and other regional policies [4,5]. However, ASSBs do not come without their own challenges. Only polymer electrolyte ASSBs have progressed beyond laboratory experiments, however these Solid Polymer Electrolyte (SPE) cells require an elevated operating temperature of around 60–80 °C due to poor ionic conductivity at low temperatures [1,6]. For all types of solid electrolyte, a great deal of research effort is focused on reducing the viable operating temperature, though by their nature they will always work better (higher ionic conductivity) at elevated temperatures [7].
At present, the only commercially available ASSB for automotive applications is the Lithium Metal Polymer (LMP) battery produced by Bolloré, which uses a SPE [8]. This was used in the Citroën e-Mehari (produced 2016–2019), however owing to the large thermal inertia of the battery it must be kept permanently at operating temperature, even when not in use. As such, it must be kept plugged in while parked so that the battery heaters can draw the heating load from the grid, thereby avoiding discharging the high-voltage battery. This is an important consideration both in terms of practicality for the application as well as for whole life cycle energy cost. For long periods of planned inactivity, a ‘hibernation mode’ can be activated where the heaters turn off and the battery cools to ambient temperature [9]. Bolloré have since focused more on the commercial vehicle market such as busses, which see much higher utilization rates and so these considerations present less of a disadvantage.
Reviewing the current landscape for ASSBs and the future prospects of the various technologies, Pasta et al. recently noted that increasing the current densities of ASSBs “may still require higher pressures or even operating SSBs under higher temperatures. Is this feasible in practice?” [10] (p. 6). The aim of this paper is to directly address that question. We examine the feasibility of starting an ASSB battery pack from a variety of ambient temperatures and warming it to operational temperature during the use phase of the vehicle. The proposed method involves using a hybrid (multi-chemistry) battery pack architecture, comprising of a smaller conventional LEB, which provides initial heating and tractive power while the ASSB warms up, and a larger ASSB component which provides the majority of the energy storage. This novel architecture and heating approach aims to tackle the overarching question of whether elevated operational temperature is necessarily a barrier to ASSB adoption, or whether their adoption could be hastened through appropriate systems engineering. This is addressed by understanding if the inconvenient and energy intensive methods currently used can be mitigated by utilizing the waste heat generated by the electric powertrain.
The remainder of the paper is structured as follows: Section 2 will review the relevant literature, Section 3 describes the vehicle architecture and model used for the study, Section 4 presents results and notably how component sizing and environmental conditions affect the feasibility of the proposed approach, Section 5 discusses the relevance of the findings and Section 6 presents the conclusions.

2. Literature Review

2.1. Solid-State Batteries

Three main categories of electrolyte exist for ASSBs: SPE, inorganic solid electrolyte (ISE), and organic-inorganic composite solid electrolyte (CSE). ISEs and CSEs are yet to reach commercial maturity in the automotive sector as they currently suffer from unstable interface layers between the cathode, anode, and electrolyte, which continue to hinder the performance of the cells [11]. Although SPEs resolve this through increased plasticity, they are limited by their poor ionic conductivity, which results in the requirement for 60–80 °C operational temperatures [1]. There is currently great effort to reduce the required operating temperatures of ISE and CSE ASSBs [12,13], though they will always function better at elevated temperatures due to the higher ionic conductivity and lower internal resistances [7]. Additionally, the current inability to use high voltage cathodes means that SPE cells are restricted to offering around 125% the gravimetric energy density of their liquid electrolyte counterparts [14], hindering the potential two-fold improvements they are theoretically capable of achieving [15].
The improvements in energy densities are realized due to the use of lithium metal anodes. When these are used with liquid electrolyte cells, it results in excessive dendrite growth due to uneven current distributions, which after repeated cycles pierce the internal separator causing short circuits and subsequent fires [16,17]. Conversely, the increased stability of solid electrolytes reduces dendrite growth, and can also act as a barrier to block them [18]. However, it has been shown that SPE cells may only reduce the rate at which the dendrites pierce through the electrolyte (not prevent them entirely) as they are still able to propagate between two grains in the electrolyte’s polycrystalline structure [19]. Nevertheless, they provide a viable solution to facilitate lithium metal anodes.
The improvement in safety offered by ASSBs comes from the fact that liquid electrolytes are flammable—this is the reason LEBs present such a fire risk. Solid electrolytes are not flammable, and therefore offer considerable safety advantages.

2.2. Battery Heating Techniques

As LEBs are used in the overwhelming majority of BEVs, research into battery Thermal Management Systems (TMS) primarily focuses on them. LEBs can operate between −20 °C and 60 °C; however, at low temperatures, the electrochemistry becomes slow, and at high temperatures the rate of degradation increases [20]. Additionally, at temperatures exceeding 60 °C, the cells are at higher risk of thermal runaway and battery fires [21]. Therefore, the recommended operational temperature for these batteries is between 15 °C and 35 °C [20,22]. As a result, the majority of literature [23,24] focuses on removing heat generated by batteries to prevent thermal runaway and fires. However, there are also several studies [25,26,27,28] on heating modules from initial temperatures below zero degrees Celsius. These sub-zero heating systems have many transferable design considerations: energy consumption, temperature uniformity, cost, system complexity, safety, and reliability [26]. Therefore, insights are taken from these designs for heating a SPE battery system.
For heating or cooling battery systems, it is important to ensure that cell temperatures in the pack are within 5 °C, as this minimizes any difference in performance or aging between the cells [29]. Temperature inhomogeneity within the battery pack typically arises for two reasons: firstly, the working fluid inevitably reaches some cells before others meaning cells are not all exposed to the same rate of heating, and secondly because the internal cell temperature lags the external. This is a drawback of all external heating methods and limits the heating and cooling rates of the cells in a pack. Wang et al. [30] summarized the literature on battery heating and showed through experiment and simulation that heating rates of up to 200 W/L are achievable without exceeding 4 °C temperature difference between cells in a module. This is broadly supported by a range of other studies [27,28]. To ensure the rate of heating remains within practical limits, in this work, this rate of heating is adopted as a maximum, as described later in Section 3.5.
Internal heating methods, including using alternating current (AC), offer an alternative to external heating and may offer improved temperature uniformity. Many examples of internal heating are highlighted in a comprehensive review by Hu et al. [26]. However, since we primarily consider the feasibility of moving waste heat between powertrain components, a liquid circuit remains essential. Where energy must be directly converted to heat, Positive Temperature Coefficient (PTC) resistive heaters are assumed rather than any internal heating, since these are commonplace in the industry. Nevertheless, as this work focuses on bulk energy flows, the actual heating technology assumed has little bearing on many of the general conclusions.

3. Methods

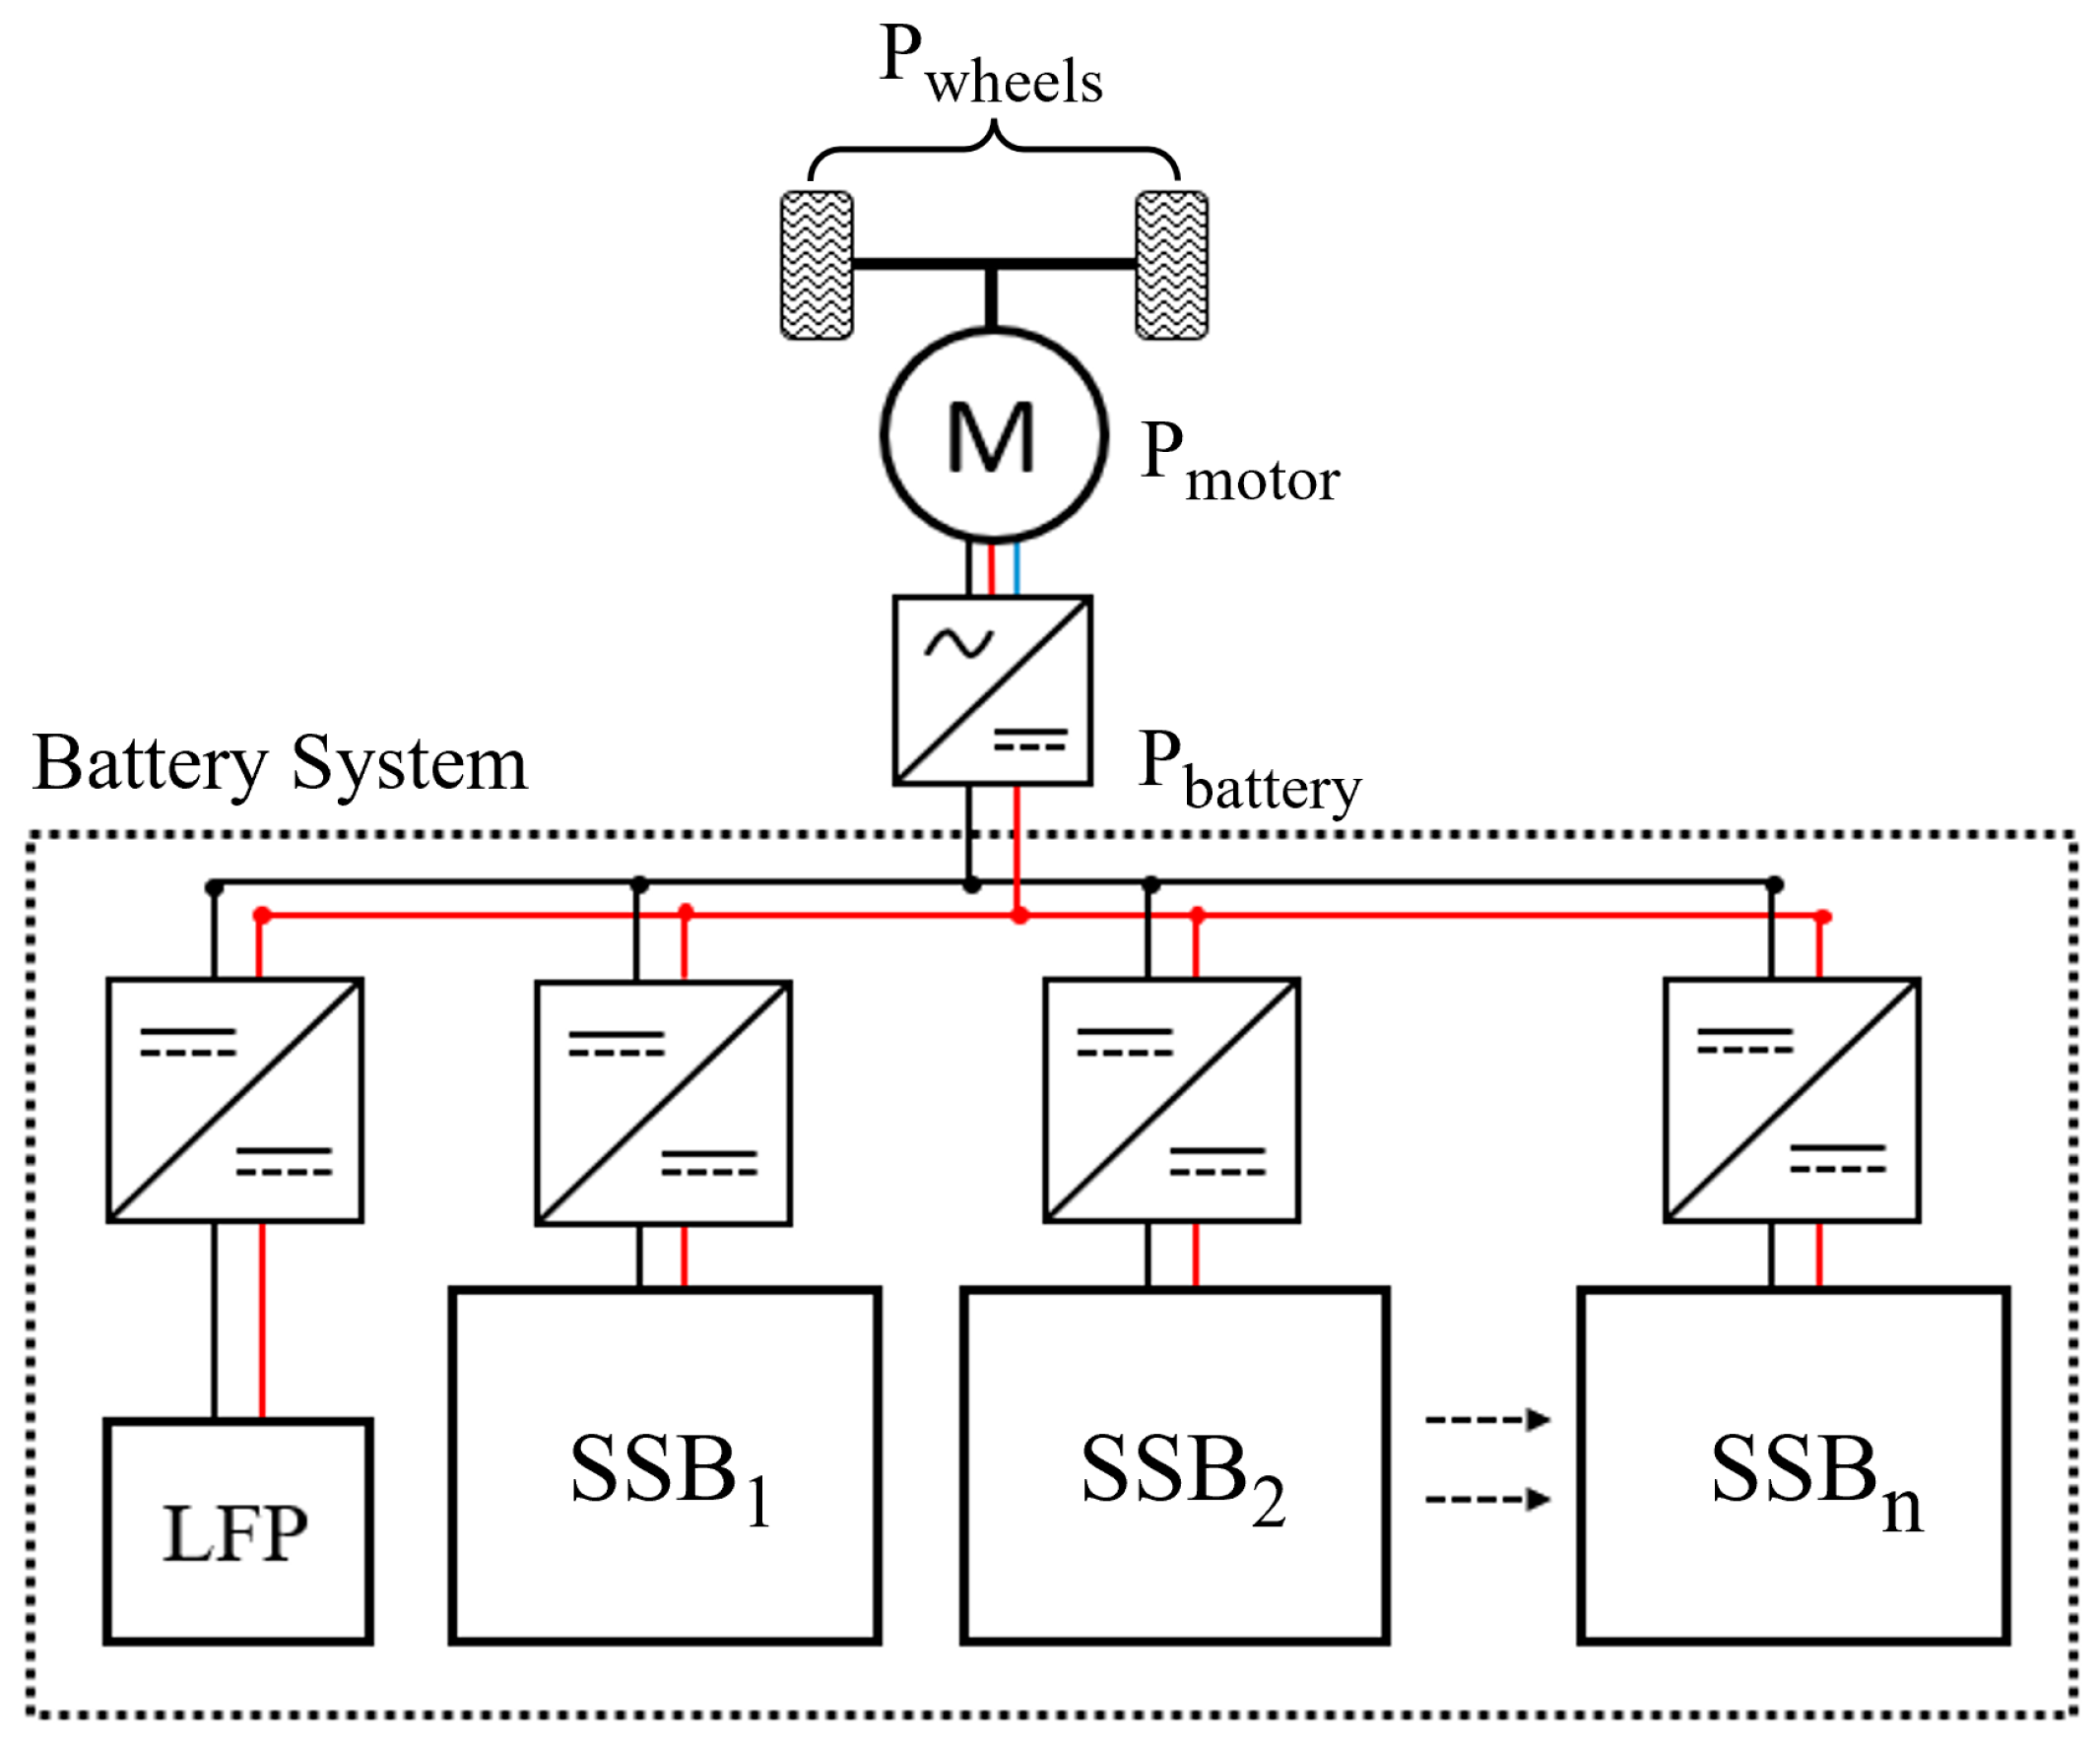
3.1. Powertrain Architecture

The powertrain architecture proposed for this study is shown in Figure 1; the key novelty is the use of a multi-chemistry battery pack as discussed in Section 1. In this arrangement, a small lithium-iron phosphate (LFP) battery is used to start the drive cycle while the SPE batteries are heated to operational temperature. The SPE batteries are arranged into thermally isolated and functionally independent sub-packs in order to subdivide their thermal mass. In this way, each can be heated sequentially, rather than heating the whole battery mass together, which should allow this stored energy to be made available more quickly. This introduces the constraint that each sub-pack must reach its operational temperature before its energy is required by the tractive power demand of the vehicle.
The ‘sub-packs’ in this sense are not necessarily similar to modules commonly used as the building-blocks of battery packs, because each is functionally independent of the others. Each would likely be of high voltage, and they are therefore more analogous to the multiple series-connected strings of cells contained in many packs. Whereas in conventional packs these strings are connected in parallel, in this case they could not be since there may be significant differences between them in State of Charge (SOC) and therefore voltage. It is for this reason that each sub-pack is shown with its own DC-DC converter. This approach of using sub-packs to achieve multi-chemistry battery packs has attracted attention recently as a means of combining energy-dense cells and power-dense cells [31].
Figure 2 illustrates one configuration of a thermal management system that could distribute heat within the powertrain by pumping coolant around the components shown. A series of valves control the coolant flow to ensure waste heat is directed to the correct solid-state sub-pack. Here, it is assumed the LFP pack is air cooled. The logic used to control the heating within this system is described in more detail in Section 3.2.

3.2. Model Architecture

To address the aims of this paper, a method for obtaining transient thermal information about the whole powertrain system was required. This was achieved through the development of a dynamic vehicle model and a lumped capacitance thermal model of the powertrain, using MATLAB/Simulink R2020b by MathWorks, Natick, MA, USA.
Within the developed model, the size of the ASSB sub-packs can be easily varied; however, a system with six solid-state sub-packs each of 10 kWh was used within this work. This model only concerns the flow of energy within the system; therefore, it negates the requirement to consider the power electronics in any detail.
The heating of the ASSB sub-packs comes from resistive heating via PTC heaters, waste heat from the motor, and waste heat from any ASSB sub-packs that have reached operational temperature. For the initial electrical heating, power is drawn from the smaller LFP starter battery. This was sized at 10 kWh based on results from the model, shown in Section 4.3 and Section 4.4. Additionally, the starter pack must meet the maximum power demands of 41 kW from the drive cycles in Section 4.1, relating to a discharge rate of approximately 4 °C. An LFP pack can achieve this in all the simulated temperatures, which drop to −10 °C. This can be seen by interpolating data from Omar et al. [32], who show that C-rates of approximately 6 °C are possible at −10 °C in LFP cells, with a discharge capacity of 90% their rated value. However, in practice, due to self-heating of the pack during discharge, this figure increases to around 96% of the rated capacity, as shown in the datasheet of a similar liquid electrolyte cell operating at 4C in −10 °C [33]. Voltage drops in the cells from 25 °C to −10 °C are also minimal, at around 7% in [32] and 8% in [33], though these differences will also reduce as the pack self-heats.
The thermal power available from the motor and ASSB sub-packs is transported using a coolant fluid. As the fluid transfer pipes are short and have low thermal conductivities, pipe losses have been neglected. When heating the ASSB sub-packs, heat is only considered to flow with a negative temperature gradient (i.e., no heat pump), therefore heat is only taken from the motor and ASSB sub-packs once they have exceeded 60 °C; below this temperature, we consider that a bypass value would be used as is common in automotive cooling circuits. During heating, any available waste heat (thermal power) is distributed to the next ASSB sub-pack that is below 60 °C. If the total available waste heat power is greater than the heating limit for a given sub-pack, the excess is distributed to the next sub-pack. Once no additional sub-pack is available (all are sufficiently heated), the excess waste heat is considered rejected through a suitably sized radiator, as is standard in automotive cooling applications (Figure 2) to maintain this temperature. Waste heat from the LFP battery is disregarded as this was found to be negligible in quantity and difficult to use due to its low working temperature (below 35 °C); this is corroborated by the authors’ own experimental experience of the air-cooled 7 kWh LFP battery used by the 2016 BMW i8.

3.3. Vehicle Model

To calculate the power demands from the vehicle, and hence the energy flows throughout the whole system, a model similar to that used by Fiori et al. [34] was built. This model computes the instantaneous energy flow in and out of the energy storage system using only the vehicle’s speed, the gradient profile of the road, and certain vehicle characteristics. The power at the wheels was calculated using Equation (1):
P W h e e l s ( t ) = ( m V e h a ( t ) + m V e h g . cos ( θ ) . C r + 1 2 ρ A f C d v 2 ( t ) + m V e h g . sin ( θ ) ) . v ( t )
where P W h e e l s is the power at the wheels, m V e h is the mass of the vehicle, a is the vehicle acceleration, g is gravitational acceleration, θ is the road gradient, C r the coefficient of rolling resistance, ρ is the density of air, A f is the vehicle’s frontal area, C d is the vehicle’s drag coefficient, and v is the vehicle velocity. The values used are summarized in Table 1.
The mechanical power at the motor ( P M o t o r ) and the electrical power at the battery terminals ( P D C ) are calculated from the power at the wheels using the relevant efficiencies for the driveline ( η D r i v e ) and motor ( η M o t o r ) as follows in Equations (2)–(4):
P M o t o r ( t ) = P W h e e l s ( t ) · η D r i v e k
P D C ( t ) = P M o t o r ( t ) · η M o t o r k
where the switch k is used to ensure that the efficiency is applied in the correct direction depending on the direction of power flow.
k = { 1 1               i f     P W h e e l s ( t ) < 0 i f     P W h e e l s ( t ) 0
The efficiency assumed for the drivetrain is 90% [35], and the efficiency of the motor is described in Section 3.4. The energy from regenerative braking is represented as the negative values of P D C ( t ) and acts to reduce the total energy consumption from the battery.

3.4. Motor Model

Following the calculation of the instantaneous power requirement during a given drive cycle, the energy rejected as heat from the motor is found assuming all inefficiencies (i.e., 1 η M o t o r ) result in heat.
The efficiency map of the Nissan Leaf motor and inverter was used, implemented as a lookup table. This map is represented in Figure 3. The speed and torque at the motor used to find the efficiency were calculated using Equations (5) and (6):
τ M o t o r ( t ) = | P M o t o r ( t ) | v ( t ) r T y r e ϕ D r i v e
ω M o t o r ( t ) = 60 v ( t ) ϕ D r i v e π · D T y r e
where τ M o t o r is the torque at the motor, r T y r e is the radius of the tyres, ϕ D r i v e is the drivetrain gear ratio, ω M o t o r is the speed of the motor, and D T y r e is the diameter of the tyre. Note that by taking the absolute value of power in Equation (5) the efficiency is assumed symmetric in the drive and regeneration quadrants of operation.
Using the efficiency value, the thermal power available for heating was calculated using Equation (7), and the bulk temperature of the motor was calculated using Equation (8). This method of calculating the motor temperature does not account for temperature gradients within it; however, it is suitably accurate for understanding the energy flows within the powertrain system. As it is assumed that all losses are available for heating, once warmed up, the motor is held at a constant temperature, simulating an ideal cooling system that extracts all waste heat.
Q ˙ M o t o r ( t ) = | P D C ( t ) | . ( 1 η M o t o r ( t ) )
T M o t o r ( t ) = T A m b + 0 t 1 m M o t o r . C M o t o r . Q ˙ M o t o r d t
where Q ˙ M o t o r is the heating power from the motor, T M o t o r is the bulk motor temperature, T A m b is the ambient temperature, m M o t o r is the mass of the motor, and C M o t o r is the bulk specific heat capacity of the motor.
The specific heat capacity of the motor was found by averaging the specific heat capacities of the component materials by mass, as shown in Equation (9). These values were taken from a study by Rassolkin et al. [37].
C M o t o r = i = 0 n ( C i ( m i m M o t o r ) )
where C i is the specific heat capacity of a material in the motor, and m i is the mass of that component within the motor.
The values used for the motor model are summarized in Table 2, based on values from the 2011–2018 Nissan Leaf [36].

3.5. Battery Model

The battery model encompasses both the liquid electrolyte starter battery and the main solid-state battery sub-packs. The calculations for this section are split into those relating to the thermal characteristics, and those relating to the electrical energy available from the batteries, though in this work, they are inherently related. As noted in Section 3.2, the thermal characteristics of the liquid electrolyte starter battery are not considered as these were found to be irrelevant.
The specific heat capacity of the solid-state cells is calculated as per Equation (10) using the composition (materials and layer thicknesses) of two SPE batteries from the literature [38,39]; shown in Figure 4.
C S S B = 0.80 · i = 0 n [ d i . ρ i i = 0 n ( d i . ρ i ) . C i ] + 0.20 · C C a s i n g
where C S S B is the average specific heat capacity of the cell, ρ i is the gravimetric density of a given material, C i its specific heat capacity, d i its thickness, and C C a s i n g is the specific heat capacity of the cell casing. The casing is assumed to contribute 20% of the specific heat capacity, which is consistent with conventional cells for which this value varies from approximately 15–25% depending on cell geometry [40,41,42]. Although methods such as Scanning Electron Microscopy or X-ray Diffraction may allow material properties to be obtained more accurately, commercial cells of this type are difficult to source at present, and the chosen method can provide sufficient accuracy for the ends intended here using data available in the literature.
From Table 3, the bulk specific heat values found for the SPE cells are comparable to liquid electrolyte cells [43,44], though slightly higher. Since this analysis suggests that 1010 J/kg∙K is achievable, this value was used in the analysis. As we have a requirement in this application for low thermal inertia, minimizing the bulk thermal conductivity may be considered a target for future system development.
As with the motor model, heat generated from the SPE sub-packs was calculated by finding the losses. Because the losses are dependent on the discharge rate of the sub-pack, a proxy ‘C-rate’ was first calculated using Equation (11).
P C R S S B ( t ) = P D C ( t ) n S S B o n .     E S S B ,
where P C R S S B is the proxy C-rate of the ASSB system, n S S B o n is the number of preheated ASSB sub-packs, and   E S S B is the capacity of a ASSB sub-pack. This proxy C-rate approximates the actual C-rate, necessary because the different sub-packs may have varying SOC and therefore different voltages.
The proxy C-rate was used to find the instantaneous efficiency according to Figure 5. Randau et al. [46] found through an extensive literature survey that ASSBs generally exceed 90% round-trip energy efficiency at a cycling rate of 1 C, and so 93% at 1 C is taken here as a conservative estimate for heat generation for an ASSB. To increase the simulation accuracy an efficiency degradation is accounted for at increased C-rates. Since these data are not available in the literature, the general efficiency profile form for the round-trip efficiency of a LFP battery, as described by Stan et al. [47], was used and scaled to 93% at 1 C.
The ASSB efficiency was used to calculate heat generation within online solid-state sub-packs as in Equation (12). Here, the energy efficiency is divided by two to give a unidirectional efficiency.
Q ˙ S S B W a s t e ( t ) = P D C ( t ) .   1 η S S B ( t ) 2 ,
where Q ˙ S S B W a s t e is the heating power from the heated ASSB sub-packs, and η S S B is the efficiency of the ASSB sub-packs.
The total heat energy available for heating additional ASSB sub-packs is found by considering the energy balance in Equation (13) where heat lost from the online batteries by convection to the environment is removed, and additional heat is added from the electric motor and the PTC heaters.
Q ˙ S S B ( t ) = Q ˙ S S B W a s t e ( t ) + Q ˙ M o t o r ( t ) + Q ˙ P T C ( t ) 1 i = n S S B o n Q ˙ S S B L o s s i ( t )
where Q ˙ S S B is the total thermal power available for heating subsequent ASSB sub-packs, Q ˙ P T C is the heating power from the PTC, and Q ˙ S S B L o s s i is the convective heat loss to the environment of each online sub-pack.
The control logic for the heating is as described in Section 3.2. For the first ASSB sub-pack only the heating power available from waste heat may be supplemented by electrical heating of the coolant using the PTC, whose power is determined in order to achieve the maximum heating power limit:
Q ˙ S S B ( t ) = Q ˙ S S B M a x
where Q ˙ S S B M a x is the maximum heating power for an ASSB sub-pack.
Convective heat loss to the environment from each online sub-pack is found from:
Q ˙ S S B L o s s i ( t ) = A S S M o d u l e ( T S S M o d u l e i ( t ) T A m b ) . 1 ( 1 h S S M o d u l e + d I n s u l a t i o n k I n s u l a t i o n )
where A S S M o d u l e is the surface area of a sub-pack, T S S M o d u l e i is the temperature of a given sub-pack, h S S M o d u l e is the convective heat transfer coefficient, d I n s u l a t i o n is the insulation thickness, and k I n s u l a t i o n is the insulation thermal conductivity.
Finally, the temperature of each sub-pack is found using Equation (16):
T S S M o d u l e i ( t ) = T A m b + 0 t Q ˙ S S B i ( t ) 0.9     m S S M o d u l e C S S B d t
where m S S M o d u l e is the mass of the solid-state sub-pack. The mass is multiplied by 0.9 to account for a 90% gravimetric packing efficiency [48], as external sections of the module are not heated.
The sub-pack mass and volume are based on a Tesla model S pack [49], with the figures in Table 4 representing a volumetric and gravimetric energy density increase of 25% to account for the use of a SPE [14]. Table 4 also includes a figure for the maximum heating power; this was included to ensure the simulated sub-packs are not heated with more power than they could realistically receive, due to temperature gradients and heat transfer rate limitations. For this, the value of 200 W/L from [30] (see Section 2.2) was multiplied by the average volumetric packing efficiency of cells into modules of 0.66 [48,49] giving 132.7 W/L at the sub-pack level. Calculation of the natural convection heat transfer co-efficient for each sub-pack is simplified by using a constant value [50], and for the sub-pack surface area the sub-pack is taken to be a cube to minimize surface area to volume ratio.
The total available energy capacity ( E B a t t ) of the whole battery system is determined based on the temperatures of all the solid-state sub-packs. The initial value for E B a t t is set to the capacity of the LFP starter battery and any pre-heated solid-state sub-packs. When a solid-state sub-pack reaches operational temperature, E H e a t e d increases by the capacity of the heated sub-pack, representing an increase in total available capacity, as described by Equations (17) and (18):
P B a t t ( t ) = Q ˙ P T C ( t ) P D C ( t ) ,
where P B a t t is the total electrical power to or from the complete battery system.
E B a t t ( t ) = 0 t P B a t t ( t ) d t + E H e a t e d ( t ) + E I n i t i a l
where E B a t t is the total energy available within the battery system, E H e a t e d is the energy available from heated ASSB sub-packs, and E I n i t i a l is the available energy in the complete battery system when the simulation begins.

4. Results

4.1. Drive Cycles

To understand the feasibility of the cold start procedure, two different drive cycles were used. This enabled the response of the system to be understood in various use cases. Figure 6 shows a velocity with time graph for the Worldwide Harmonized Light Vehicle Test Procedure (WLTP) and a motorway drive cycle.
The WLTP was chosen as it gives a standardized example of a realistic drive cycle, while the motorway drive cycle presents the most challenging situation for the proposed system because it requires rapid availability of tractive energy. The motorway drive cycle was constructed by taking the initial acceleration of the highway portion of the WLTP (at around 1500 s) until 130 kph is reached, and then holding this speed continuously until all the sub-packs were heated. The 1800 s WLTP was also cycled on repeat until all the ASSB sub-packs were heated.

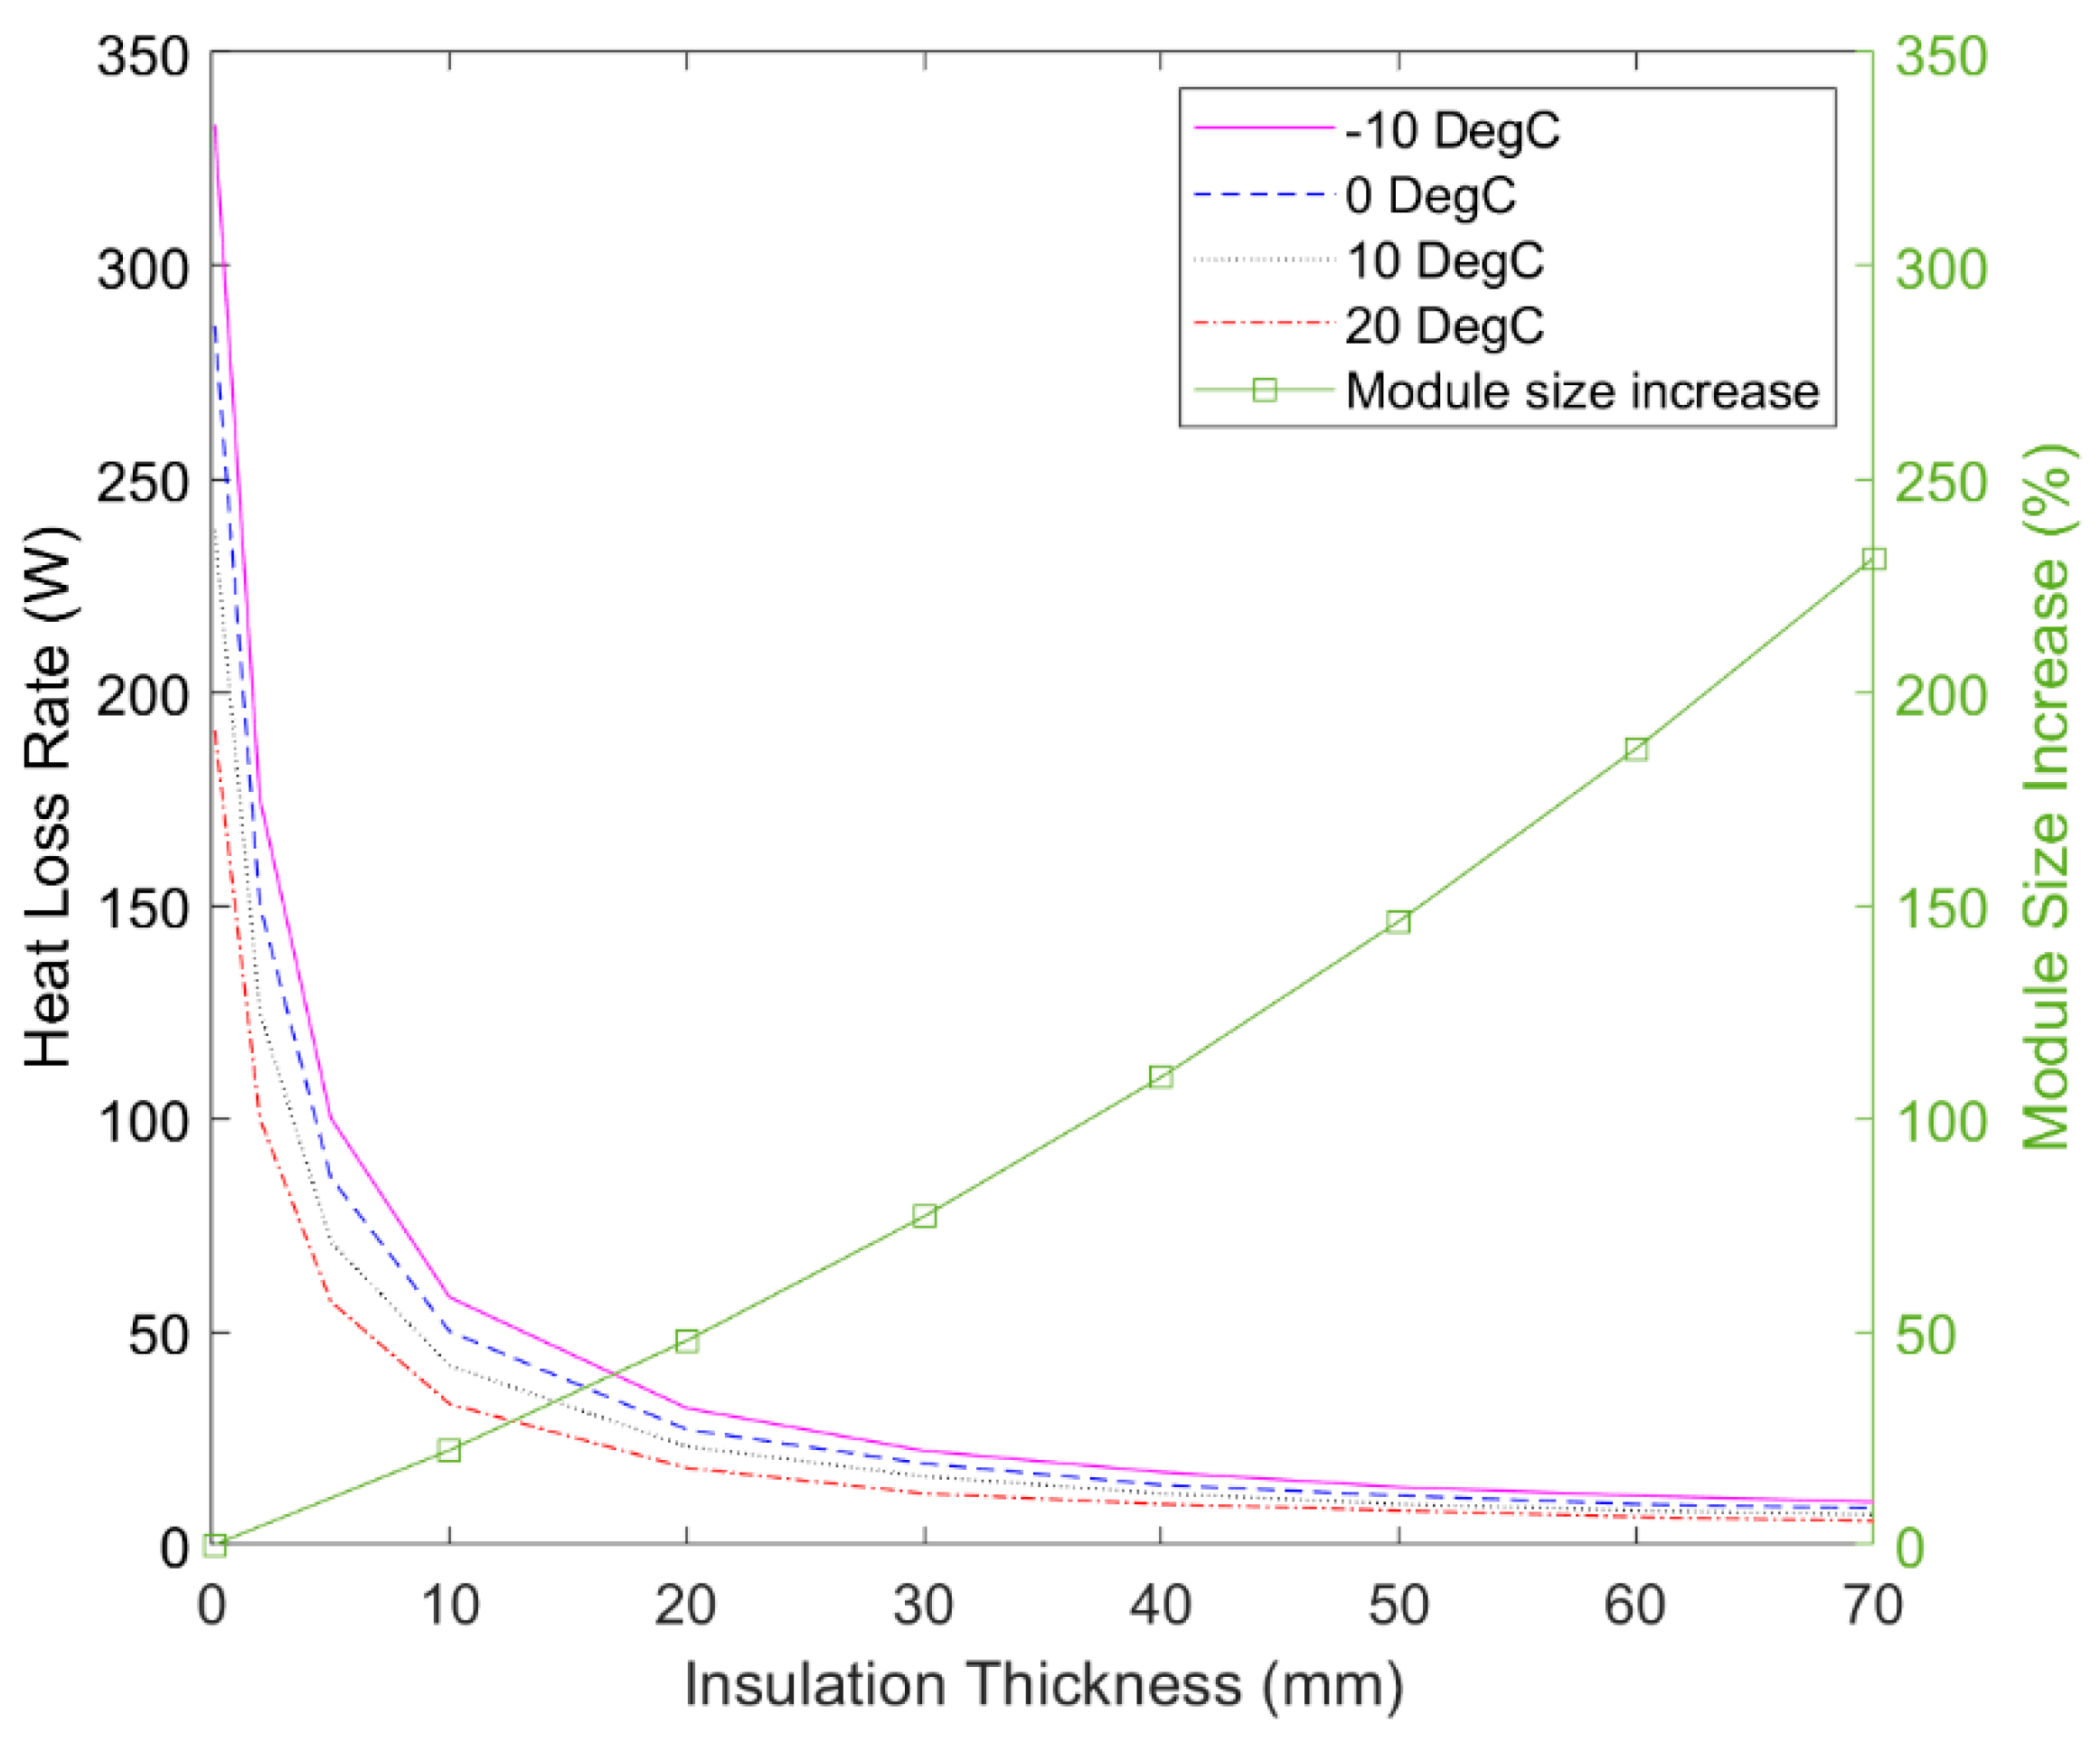
4.2. Sub-Pack Insulation

Insulation is essential for thermally isolating the sub-packs. However, the degree to which each sub-pack is insulated provides trade-offs, most notably relating to the volume of the sub-packs and the amount of heat that is lost from them. Figure 7 graphically illustrates these key trade-offs at various ambient temperatures, helping to guide the best choice for any given scenario. It can be seen that the heat loss rate quickly drops up to an insulation thickness of 20 mm, where the average heat loss is in the order of 20–35 W depending on ambient conditions. However, with 20 mm of insulation, the sub-pack increases in volume by 50%, resulting in a net 25% volumetric increase over competing liquid electrolyte LiB systems. Nevertheless, due to the negligible mass of the insulation, this would still achieve a 25% improvement in gravimetric energy density. This is still highly valuable as mass reduction can be more important in many scenarios.
Although 10 mm of insulation may be sufficient for many applications, as waste heat from the powertrain could easily compensate for the corresponding heat losses, 20 mm insulation was chosen for the following simulations. This is because the 20 mm insulation may enable some sub-packs to remain heated in between uses, as discussed in Section 5.

4.3. WLTP Cold Start Testing

By comparing the energy requirements for the vehicle with the available energy in the battery system, defined as the initial LFP battery capacity plus any heated ASSB sub-packs, we can determine whether the ASSB can be heated quickly enough in a cold start procedure. The results for the WLTP drive cycle are presented in Figure 8, which show that, with an initial 10 kWh available from the LFP pack, there is sufficient time and energy available to heat each sub-pack before it is required in all ambient conditions considered. This is apparent because the Capacity Available traces stay above the Energy Consumed trace, whereas insufficient energy availability would be shown by the Energy Consumed trace exceeding the Capacity Available at some point. The minimum remaining capacity (margin) at any point is approximately 8 kWh. Hence, the starter pack could be smaller, however this buffer is required for more demanding use cases, shown in Section 4.4.
The 10 kWh available from the LFP starter pack does not account for performance degradation over time or due to sub-optimal temperatures. Therefore, the 10 kWh is assumed to be the required capacity deliverable from the module and hence allowances may be required in certain operating conditions. This can be in the form of a larger total capacity or other mitigation methods seen within the literature [25,26,27,28].
The variation in time for each sub-pack to heat up arises as some begin to be heated before the previous one reaches operational temperature. This occurs when the first sub-pack is unable to accept all the available heat due to the set maximum heating rate. Therefore, it is redirected to the second sub-pack.
To provide further insights into the transfers of energy within the system, Figure 9a shows the cumulative energy used from each source and Figure 9b shows the available heating power from each source as a percentage of the total heating power.
Figure 9a shows how the cumulative split of each heat source changes throughout the drive cycle. As the drive cycle progresses, the share of heating energy shifts from solely the PTC to primarily the motor and preheated batteries. Specifically, after 7500 s, which is approximately the time taken to fully heat the system in 20 °C ambient conditions, the PTC, motor, and ASSBs provided 17.9%, 57.1%, and 25%, respectively.
Figure 9b further highlights the initial dependence on the PTC heater, which is subsequently switched off after the first sub-pack is heated. Due to the relatively low aggressivity of the WLTP, when the PTC heater is switched off at 500 s the motor temperature is still too cold to provide thermal energy to the ASSB sub-packs. All the thermal energy at this time comes as waste heat from the first ASSB sub-pack, which comes online at this point.
Once the motor temperature exceeds 60 °C, at around 1900 s, it becomes the main source of thermal power within the system since its losses are several times higher than those of the battery. At this point, waste heat from the motor is directed to the ASSB modules in addition to the heat they generate themselves, which causes the sudden decrease in the proportion of heating power coming from the battery modules at 1900 s, not any actual reduction in their absolute contribution to heating power. It can also be observed that throughout the remainder of the drive cycle the share of thermal power from the preheated batteries gradually reduces further. This is a result of the increased efficiency within the cells as the C-rate decreases due to more ASSB sub-packs reaching operational temperatures.

4.4. Motorway Cold Start Testing

The motorway use case is more challenging due to the increased rate of energy consumption. Figure 10 uses the same format as Figure 8 to illustrate the feasibility of the proposed system for the motorway drive cycle.
Despite the intensity of the motorway drive cycle, with the use of a 10 kWh LFP starter battery, the system enables the battery to meet the energy demands of the vehicle at all points, even in the coldest ambient conditions. However, the spare capacity (margin) available during the early portion of the cold start procedure is almost certainly too low when operating in cold ambient temperatures. Specifically, the spare capacity ranges from a minimum of 4.8 kWh at 20 °C, to 0.7 kWh at −10 °C. The inconstant rise in available capacity after the second one is heated happens due to the large amount of heat generated by the powertrain, enabling multiple sub-packs to be heated simultaneously. This is exaggerated for module 3 as there is increased waste heat due to the high discharge C-rate from the first module which lowers its efficiency. The high waste heat is apparent in Figure 11a from the initially steep gradient.
Figure 11 illustrates the transfers of energy within the system during the motorway drive cycle, using the same format as Figure 9. As with the WLTP simulation, the initial heating power all comes from the PTC. However, due to the more intensive drive cycle, the motor heats up much faster, providing usable thermal energy from 600 s when the ambient temperature is 20 °C, as seen in Figure 11b.
As with the WLTP simulation, clear reductions in the proportion of heating from the ASSB system happen throughout the drive cycle, representing the increase in efficiencies as the C-rate decreases.
Despite the motor providing thermal power earlier into the drive cycle, Figure 11a shows that the overall percentage of thermal energy it provides up until the sub-packs reach operational temperature is less than for the WLTP scenario. Specifically, after 2100 s, the PTC, motor, and ASSBs provided 17.5%, 52.7%, and 29.8%, respectively. This is due to the higher load and therefore lower efficiency of the ASSB sub-packs.

5. Discussion

5.1. System Considerations and Limitations

In this section, we consider the real-world applicability of the results and the proposed system, sighting design considerations and limitations, with potential methods for minimizing them. The first such consideration is the maximum allowable heating rate of the ASSB sub-packs. This has a large effect on how quickly sub-packs are heated, and hence the feasibility of the system. To increase the heating rate the thermal management system must be carefully engineered, whilst also focusing on the cell design. For example, smaller cells may present an advantage over large cells as their higher surface area to volume ratio would allow faster heating whilst limiting temperature gradients within cells and within the sub-pack.
It is clear from the results that during the motorway drive cycle, at temperatures below −10 °C, the proposed system struggles to maintain enough spare capacity. Increasing the maximum heating rate would resolve this; however, it may also be possible to start preheating the first sub-pack before departure. Alternatively, the first sub-pack could be maintained at, or close to, operational temperature while not in use. For this, the first sub-pack could have thicker insulation and draw heat from the PTC, powered by the battery system itself. Alternatively, it is possible a small solar panel may be able to supplement or completely support the heating of a sub-pack. For this, a 200 W panel would have to operate with a capacity factor of 16% to support a sub-pack with 20 mm of insulation at −10 °C ambient temperature. This is below the global average of 18% so could be achieved in many scenarios [51]. However, other considerations including panel placement, shading, fouling, and geographic location must also be accounted for to conclude the viability of such a system.
The ~0.5 kWh energy used to electrically heat the first ASSB sub-pack will need to be spent each time the battery is heated. It may therefore be an acceptable proportion of the battery energy on a long journey, but much less so on repeated short journeys. Whilst this could present a problem, it is possible that good foreknowledge of the journey would greatly diminish this, and interest in predictive thermal management of powertrains has grown recently, drawing on the methods often applied to predictive energy management.
A limitation of the proposed system is the aging effect increased discharged rates would have on the ASSB sub-packs. To combat this, it would be recommended to alternate the order in which the sub-packs are heated, ensuring all sub-packs are used an equal amount in each configuration. Additionally, this reinforces the notion the proposed system would be best suited, but not limited to, less strenuous drive cycles.
The management of charge levels within each sub-pack is of high importance, as using energy to heat a largely depleted sub-pack is far less worthwhile than heating one that is full. Also, the LFP starter battery capacity must be kept as near fully charged as possible to ensure enough energy is available to warm the first sub-pack using the PTC. To combat these issues, it would be possible to reallocate energy within the sub-packs before the system cools to ensure energy is consolidated into fewer sub-packs and that the LFP battery is fully charged.

5.2. Applications of Findings

This work has demonstrated that it is possible to benefit from the increased gravimetric energy density of SPE ASSBs, without requiring the whole system to be kept warm or to go through a lengthy pre-heating phase. While the benefit of a lighter battery system remains, due to the insulation requirements, the volumetric energy density will likely be equal to or lower than a liquid electrolyte counterpart. Therefore, this system would be best considered where battery mass is more important than volume.
Beyond SPE batteries, the findings of this work have clear applications to the developments of CSE battery systems. Although not yet commercialized, these systems show good operational performance at lower, albeit still elevated, temperatures. Zhang et al. [52] and Sun et al. [53] report running CSE cells at 30–45 °C, and this moderate reduction in operating temperatures would greatly increase the viability of the proposed system in many more applications. Similarly, the use of the proposed cold start methodology could also be applied to any cell chemistry requiring elevated operating temperatures, including ionic liquid and sodium–sulphur cells. Finally, findings from this study may also be used to inform the heating of liquid electrolyte LiB systems from sub-zero temperatures in a modular manner.
Other pre-heating solutions include Phase Change Materials (PCM), however the architecture presented in this paper carries two key advantages over this alternative. Firstly, the LFP battery stores significant tractive energy and so adds relatively little mass for the same energy requirement, whereas PCM stores no tractive energy and so increases mass for the same tractive energy. Secondly, PCM would not allow an immediate start from cold, as the LFP battery does.

5.3. Future Work

Thermal management of ASSBs in vehicle applications is a nascent area of research with several opportunities for future work. Firstly, more detailed and accurate modelling of each component of the thermal management system is needed to understand how best to transfer the thermal energy to and from each sub-system. Secondly, the control and optimization of the heating order and capacity distribution of the modules will be important, with the results having applications to other battery systems of various chemistries. Thirdly, experimental validation of the proposed system will enable implementation challenges to be addressed, though availability of automotive sized solid-polymer electrolyte cells remains a challenge. Validation of the waste heat capture for heating a body of equivalent thermal mass may be an easier intermediate objective. Fourthly, means of maintaining sub-packs at operational temperatures for extended periods of time in between use will be important; this may require a small continuous heating load which could be supplied by a small solar panel or otherwise. This may also include the optimization of sub-pack insulation, for example with shared walls. Finally, exploring the applicability of the approach presented here to systems with other battery chemistries and properties, for example those with lower operational temperatures or higher energy densities.

6. Conclusions

This work outlines the development and analysis of a lumped capacitance thermal model for an electric vehicle powertrain, utilizing thermally isolated SPE ASSB sub-packs. This work shows there is enough waste heat available from an electric powertrain to heat solid-state sub-packs, from a cold start, quickly enough to ensure there is always enough energy available for tractive power demands. However, this relies on the use of a resistive heating element to heat the first solid-state sub-pack, which must be supplied by a liquid electrolyte battery pack. This was sized at 10 kWh within this work, though it could be reduced in warmer and less demanding use cases. The insulation thickness required for each ASSB module means the proposed system would be unable to compete in volumetric energy density with liquid electrolyte cells. However, the improved gravimetric energy density will benefit mass critical applications. These benefits will be increased with future improvements in cathode materials, which may also enable sequentially heated SPE ASSBs to compete volumetrically with their liquid electrolyte counterparts. The findings of this study could remove barriers to the adoption of solid-state batteries with elevated operational temperatures. This is specifically applied to SPE systems in this work, but also applies to those utilizing CSE cells. Thermally isolated and sequentially heated modules appear to provide a viable solution for using elevated operational temperature solid-state batteries in automotive applications.

Author Contributions

Conceptualization, C.V. and R.H.; methodology, C.V. and R.H.; software, R.H.; validation, R.H.; formal analysis, R.H.; investigation, R.H.; resources, C.V.; data curation, R.H.; writing—original draft preparation, R.H.; writing—review and editing, C.V.; supervision, C.V.; project administration, C.V. All authors have read and agreed to the published version of the manuscript.

Funding

This research received no external funding.

Institutional Review Board Statement

Not applicable.

Informed Consent Statement

Not applicable.

Data Availability Statement

Not applicable.

Acknowledgments

R.H. is supported by a scholarship from the EPSRC Centre for Doctoral Training in Advanced Automotive Propulsion Systems (AAPS), under the project EP/S023364/1.

Conflicts of Interest

The authors declare no conflict of interest.

References

  1. The Faraday Institution. Solid-State Batteries: The Technology of the 2030s but the Research Challenge of the 2020s; The Faraday Institution: Cambridge, UK, 2021. [Google Scholar]
  2. Chen, S.; Dai, F.; Cai, M. Opportunities and Challenges of High-Energy Lithium Metal Batteries for Electric Vehicle Applications. ACS Energy Lett. 2020, 5, 3140–3151. [Google Scholar] [CrossRef]
  3. United Nations. Paris Agreement; UN: Paris, France, 2015. [Google Scholar]
  4. HM Government Department for Transport. ‘The Road to Zero’ Next Steps towards Cleaner Road Transport and Delivering Our Industrial Strategy; Department for Transport: London, UK, 2018.
  5. California Governor’s Office of Business and Economic Development. California Zero-Emission Vehicle Market Development Strategy; GO-Biz: Sacramento, CA, USA, 2021.
  6. Zhang, T.; He, W.; Zhang, W.; Wang, T.; Li, P.; Sun, Z.; Yu, X. Designing composite solid-state electrolytes for high performance lithium ion or lithium metal batteries. Chem. Sci. 2020, 11, 8686–8707. [Google Scholar] [CrossRef]
  7. Janek, J.; Zeier, W. A solid future for battery development. Nat. Energy 2016, 1, 16141. [Google Scholar] [CrossRef]
  8. BlueSolutions. Lmp® (Lithium Metal Polymer) Technology, Unique All-Solid-State Battery; Bolloré Group: Puteaux, France, 2019. [Google Scholar]
  9. Citroen. 2016 Citroën E-Méhari—Owner’s Manual; Citroën: Paris, France, 2016. [Google Scholar]
  10. Pasta, M.; Armstrong, D.; Brown, Z.L.; Bu, J.; Castell, M.R.; Chen, P.; Cocks, A.; Corr, S.A.; Cussen, E.J.; Darnbrough, E.; et al. 2020 roadmap on solid-state batteries. J. Phys. Energy 2020, 2, 032008. [Google Scholar] [CrossRef]
  11. Zhang, D.; Xu, X.; Qin, Y.; Ji, S.; Huo, Y.; Wang, Z.; Liu, Z.; Shen, J.; Liu, J. Recent Progress in Organic–Inorganic Composite Solid Electrolytes for All-Solid-State 68 Lithium Batteries. Chem. A Eur. J. 2020, 26, 1720–1736. [Google Scholar] [CrossRef]
  12. Zhang, S.; Li, Z.; Guo, Y.; Cai, L.; Manikandan, P.; Zhao, K.; Li, Y.; Pol, V.G. Room-temperature, high-voltage solid-state lithium battery with composite solid polymer electrolyte with in-situ thermal safety study. Chem. Eng. J. 2020, 400, 125996. [Google Scholar] [CrossRef]
  13. Oh, J.; He, L.; Chua, B.; Zeng, K.; Lu, L. Inorganic sodium solid-state electrolyte and interface with sodium metal for room-temperature metal solid-state batteries. Energy Storage Mater. 2021, 34, 28–44. [Google Scholar] [CrossRef]
  14. Zhou, Q.; Ma, J.; Dong, S.; Li, X.; Cui, G. Intermolecular Chemistry in Solid Polymer Electrolytes for High-Energy-Density Lithium Batteries. Adv. Mater. 2019, 31, 1902029. [Google Scholar] [CrossRef]
  15. Zhu, Y.; Pande, V.; Li, L.; Wen, B.; Pan, M.S.; Wang, D.; Ma, Z.-F.; Viswanathan, V.; Chiang, Y.-M. Design principles for self-forming interfaces enabling stable lithium-metal anodes. Proc. Natl. Acad. Sci. USA 2020, 117, 27195–27203. [Google Scholar] [CrossRef]
  16. Khurana, R.; Schaefer, J.; Archer, L.; Coates, G. Suppression of Lithium Dendrite Growth Using Cross-Linked Polyethylene/Poly(ethylene oxide) Electrolytes: A New Approach for Practical Lithium-Metal Polymer Batteries. J. Am. Chem. Soc. 2014, 136, 7395–7402. [Google Scholar] [CrossRef]
  17. Li, S.; Wang, H.; Cuthbert, J.; Liu, T.; Whitacre, J.; Matyjaszewski, K. A Semiliquid Lithium Metal Anode. Joule 2019, 3, 1637–1646. [Google Scholar] [CrossRef]
  18. Xia, S.; Wu, X.; Zhang, Z.; Cui, Y.; Lui, W. Practical Challenges and Future Perspectives of All-Solid-State Lithium-Metal Batteries. Chem 2019, 5, 753–785. [Google Scholar] [CrossRef]
  19. Liu, H.; Cheng, X.; Huang, J.; Yuan, H.; Lu, Y.; Yan, C.; Zhu, G.; Xu, R.; He, C. Controlling Dendrite Growth in Solid-State Electrolytes. ACS Energy Lett. 2020, 5, 833–843. [Google Scholar] [CrossRef]
  20. Pesaran, A.; Santhanagopalan, S.; Kim, G. Addressing the Impact of Temperature Extremes on Large Format Li-Ion Batteries for Vehicle Applications. In Proceedings of the 30th International Battery Seminar, Ft. Lauderdale, FL, USA, 11–14 March 2013. [Google Scholar]
  21. Guo, L.; Wang, Z.; Wang, J.; Luo, Q.; Liu, J. Effects of the environmental temperature and heat dissipation condition on the thermal runaway of lithium ion batteries during the charge-discharge process. J. Loss Prev. Process. Ind. 2017, 49, 953–960. [Google Scholar] [CrossRef]
  22. Agwu, D.; Opara, F.; Chukwuchekwa, N.; Dike, D.; Uzoechi, L. Review of Comparative Battery Energy Storage Systems (Bess) For Energy Storage Applications in Tropical Environments. In Proceedings of the IEEE NIGERCON2017—3rd International Conference on Electro-Technology for National Development, Owerri, Nigeria, 7–10 November 2017. [Google Scholar]
  23. Wang, Q.; Jiang, B.; Li, B.; Yan, Y. A critical review of thermal management models and solutions of lithium-ion batteries for the development of pure electric vehicles. Renew. Sustain. Energy Rev. 2016, 64, 106–128. [Google Scholar] [CrossRef]
  24. An, Z.; Jia, L.; Ding, Y.; Dang, C.; Li, X. A review on lithium-ion power battery thermal management technologies and thermal safety. J. Therm. Sci. 2017, 26, 391–412. [Google Scholar] [CrossRef]
  25. Ji, Y.; Wang, C. Heating strategies for Li-ion batteries operated from subzero temperatures. Electrochim. Acta 2013, 107, 664–674. [Google Scholar] [CrossRef]
  26. Hu, X.; Zheng, Y.; Howey, D.; Perez, H.; Foley, A.; Pecht, M. Battery warm-up methodologies at subzero temperatures for automotive applications: Recent advances and perspectives. Prog. Energy Combust. Sci. 2020, 77, 100806. [Google Scholar] [CrossRef]
  27. Yates, M.; Akrami, M.; Javadi, A. Analysing the performance of liquid cooling designs in cylindrical lithium-ion batteries. J. Energy Storage 2021, 33, 100913. [Google Scholar] [CrossRef]
  28. Fan, R.; Zhang, C.; Wang, Y.; Ji, C.; Meng, Z.; Xu, L.; Ou, Y.; Chin, C.S. Numerical study on the effects of battery heating in cold climate. J. Energy Storage 2019, 26, 100969. [Google Scholar] [CrossRef]
  29. Jiang, G.; Zhuang, L.; Hu, Q.; Liu, Z.; Huang, J. An investigation of heat transfer and capacity fade in a prismatic Li-ion battery based on an electrochemical-thermal coupling model. Appl. Therm. Eng. 2020, 171, 115080. [Google Scholar] [CrossRef]
  30. Wang, Y.; Rao, Z.; Liu, S.; Li, X.; Li, H.; Xiong, R. Evaluating the performance of liquid immersing preheating system for Lithium-ion battery pack. Appl. Therm. Eng. 2021, 190, 116811. [Google Scholar] [CrossRef]
  31. Tzermias, G.; Akehurst, S.; Burke, R.; Brace, C.; George, S.; Bernards, J.; Smith, C. Methodology for the Optimisation of Battery Hybrid Energy Storage Systems for Mass and Volume Using a Power-To-Energy Ratio Analysis. Batteries 2021, 7, 37. [Google Scholar] [CrossRef]
  32. Omar, N.; Bossche, P.; Coosemans, T.; Mierlo, J. Peukert Revisited—Critical Appraisal and Need for Modification for Lithium-Ion Batteries. Energies 2013, 6, 5625–5641. [Google Scholar] [CrossRef]
  33. PowerStream Technology. Introduction of INR18650-25R; PowerStream Technology: Orem, UT, USA, 2013; Available online: https://www.powerstream.com/p/INR18650-25R-datasheet.pdf (accessed on 1 October 2021).
  34. Fiori, C.; Ahn, K.; Rakha, H. Power-based electric vehicle energy consumption model: Model development and validation. Appl. Energy 2016, 168, 257–268. [Google Scholar] [CrossRef]
  35. Spanoudakis, P.; Tsourveloudis, N.; Doitsidis, L.; Karapidakis, E. Experimental Research of Transmissions on Electric Vehicles’ Energy Consumption. Energies 2019, 12, 388. [Google Scholar] [CrossRef] [Green Version]
  36. Sato, Y.; Ishikawa, S.; Okubo, T.; Abe, M.; Tamai, K. Development of High Response Motor and Inverter System for the Nissan LEAF Electric Vehicle. SAE Tech. Pap. Ser. 2011, 7. [Google Scholar] [CrossRef]
  37. Rassolkin, A.; Orlova, S.; Kallaste, A.; Gevorkov, L. Re-Use and Recycling of Different Electrical Machines. Latv. J. Phys. Tech. Sci. 2018, 55, 13–23. [Google Scholar] [CrossRef] [Green Version]
  38. Schnell, J.; Gunther, T.; Knoche, T.; Vieder, C.; Kohler, L.; Just, A.; Keller, M.; Passerini, S.; Reinhart, G. All-solid-state lithium-ion and lithium metal batteries—paving the way to large-scale production. J. Power Sources 2018, 382, 160–175. [Google Scholar] [CrossRef]
  39. Blue Solutions. Lithium Metal Polymer Battery Having a High Energy Density; US 2019/0088997; Blue Solutions: Ergué Gabéric, France, 2019. [Google Scholar]
  40. Silveria, A.; Santana, M.; Tanabe, E.; Bertuol, D. Recovery of valuable materials from spent lithium ion batteries using electrostatic separation. Int. J. Miner. Process. 2017, 169, 91–98. [Google Scholar] [CrossRef]
  41. Gratz, E.; Sa, Q.; Apelian, D.; Wang, Y. A closed loop process for recycling spent lithium ion batteries. J. Power Sources 2014, 262, 255–262. [Google Scholar] [CrossRef]
  42. Herrmann, M. Packaging—Materials review. AIP Conf. Proc. 2014, 1597, 121–133. [Google Scholar]
  43. Maleki, H.; Hallaj, S.; Selman, R.; Dinwiddie, R.; Wang, H. Thermal Properties of Lithium-Ion Battery and Components. Electrochem. Soc. 1999, 146, 947. [Google Scholar] [CrossRef]
  44. Saw, L.; Tay, A.; Zhang, L. Thermal management of lithium-ion battery pack with liquid cooling. In Proceedings of the 2015 31st Thermal Measurement, Modeling & Management Symposium (SEMI-THERM), San Jose, CA, USA, 15–19 March 2015. [Google Scholar]
  45. Villano, P.; Carewska, M.; Passerini, S. Specific heat capacity of lithium polymer battery components. Thermochim. Acta 2003, 402, 219–224. [Google Scholar] [CrossRef]
  46. Randau, S.; Weber, D.A.; Kötz, O.; Koerver, R.; Braun, P.; Weber, A.; Ivers-Tiffée, E.; Adermann, T.; Kulisch, J.; Zeier, W.G.; et al. Benchmarking the performance of all-solid-state lithium batteries. Nat. Energy 2020, 5, 259–270. [Google Scholar] [CrossRef]
  47. Stan, A.; Swierczynski, M.; Stroe, D.; Teodorescu, R.; Andreasen, S.J.; Moth, K. A comparative study of lithium ion to lead acid batteries for use in UPS applications. In Proceedings of the 2014 IEEE 36th International Telecommunications Energy Conference (INTELEC), Vancouver, BC, Canada, 28 September–2 October 2014. [Google Scholar]
  48. Löbberding, H.; Wessel, S.; Offermanns, C.; Kehrer, M.; Rother, J.; Heimes, H.; Kampker, A. From Cell to Battery System in BEVs: Analysis of System Packing Efficiency and Cell Types. World Electr. Veh. J. 2020, 11, 77. [Google Scholar] [CrossRef]
  49. Kuipers, M.; Friedrich, E.; Meier, S.; Dirk, U. An in-depth View into the Tesla Model S Module Part Two: Module Characterization and Comparison to Other State of the Art EV Battery Systems. In Proceedings of the 9th Battery Power Conference, Aachen, Germany, 29–30 March 2017. [Google Scholar]
  50. Kosky, P.; Balmer, R.; Keat, W.; Wise, G. Exploring Engineering, 5th ed.; Elsevier: Amsterdam, The Netherlands, 2020. [Google Scholar]
  51. IRENA. Renewable Power Generation Costs in 2019; International Renewable Energy Agency: Abu Zabi, United Arab Emirates, 2020. [Google Scholar]
  52. Zhang, D.; Xu, X.; Huang, X.; Shi, Z.; Wang, Z.; Liu, Z.; Hu, R.; Liu, J.; Zhu, M. A flexible composite solid electrolyte with a highly stable interphase for dendrite-free and durable all-solid-state lithium metal batteries. J. Mater. Chem. A 2020, 8, 18043–18054. [Google Scholar] [CrossRef]
  53. Sun, Y.; Jin, F.; Li, J.; Liu, B.; Chen, X.; Dong, H.; Mao, Y.; Gu, W.; Xu, J.; Shen, Y.; et al. Composite Solid Electrolyte for Solid-State Lithium Batteries Workable at Room Temperature. ACS Appl. Energy Mater. 2020, 3, 12127–12133. [Google Scholar] [CrossRef]
Figure 1. Architecture of the electric vehicle powertrain considered. The LFP battery sub-pack supplies the tractive energy requirement until the first SSB sub-pack is at operating temperature.
Batteries 08 00013 g001
Figure 2. Diagram of a thermal management system model incorporating a solid polymer electrolyte ASSB system.
Batteries 08 00013 g002
Figure 3. Efficiency map of motor and inverter for the Nissan Leaf; used with permission from Sato et al. [36].
Batteries 08 00013 g003
Figure 4. Diagram of solid-state battery layers with two thicknesses provided for each layer to represent different cell configurations of (a) [38] and (b) [39].
Batteries 08 00013 g004
Figure 5. Round-trip energy efficiency curve for a LFP battery and estimated curve for an ASSB sub-pack at various cycling rates.
Batteries 08 00013 g005
Figure 6. Velocity-time graph for the two drive cycles investigated: WLTP and motorway drive cycle.
Batteries 08 00013 g006
Figure 7. Effect of insulation thickness on the volume and heat loss rate of the solid-state battery sub-packs at different ambient temperatures.
Batteries 08 00013 g007
Figure 8. Energy consumed and available energy capacity during a cold start procedure for the WLTP simulation.
Batteries 08 00013 g008
Figure 9. Analysis of heating power during the WLTP at 20 °C ambient conditions. (a) Cumulative heating power by source; (b) Relative contribution of heat from each source; the heat contribution from the battery decreases during the drive cycle firstly as the motor passes 60 °C, and then as more subpacks come online, reducing the C-rate and improving their efficiency.
Batteries 08 00013 g009
Figure 10. Energy consumed and available energy capacity during a cold start procedure for the motorway simulation.
Batteries 08 00013 g010
Figure 11. Analysis of heating power during the motorway drive cycle at 20 °C ambient conditions. (a) Cumulative heating power by source; (b) Relative contribution of heat from each source; the heat contribution from the battery decreases during the drive cycle firstly as the motor passes 60 °C, and then as more subpacks come online, reducing the C-rate and improving their efficiency.
Batteries 08 00013 g011
Table 1. Parameters for Vehicle Model.
ParameterValue
Mass, m V e h 1580 kg
Frontal Area, A f 2.33 m2
Drag Coefficient, C d 0.28
Rolling Resistance Coefficient, C r 0.02
Table 2. Parameters for the Motor Model.
ParameterValue
Tire Diameter0.64 m
Drivetrain gear ratio8.19
Motor mass56 kg
Motor specific heat856 J/kg∙K
Table 3. Properties and mass percentage of materials in two Solid Polymer Electrolyte Batteries: (a) [38] and (b) [39].
ComponentMaterialDensity
(kg/m3)
Layer Percentage (%)Specific Heat
(J/kg∙K)
(a)(b)
Solid electrolyteP(EO)20LiBETI90010.844.61730 [45]
AnodeLithium53412.338.23550
CathodeV2O5–C–PEG–PEO300067.77.6935 [45]
Collector (+/−)Aluminum27009.29.6900
CaseAluminum 900
Average Specific Heat Capacity (J/kg∙K)10101550
Table 4. Parameters for the Solid-State Battery Model.
ParameterValue
Sub-pack capacity10 kWh
Number of sub-packs6
Sub-pack mass40.6 kg
Sub-pack volume23 L
Sub-pack surface area0.49 m2
ASSB specific heat capacity1010 J/kg∙K
Maximum heating power132.7 W/L
Natural convective heat transfer10 W/m2K
Insulation conductivity0.02 W/m∙K
Insultation thickness0.02 m
Publisher’s Note: MDPI stays neutral with regard to jurisdictional claims in published maps and institutional affiliations.

