Article

Cycling of Double-Layered Graphite Anodes in Pouch-Cells

Electrical Energy Storage Systems, Institute for Photovoltaics, University of Stuttgart, Pfaffenwaldring 47, 70569 Stuttgart, Germany
*
Author to whom correspondence should be addressed.
Batteries 2022, 8(3), 22; https://doi.org/10.3390/batteries8030022
Submission received: 16 December 2021 / Revised: 18 January 2022 / Accepted: 24 February 2022 / Published: 1 March 2022

Abstract

:
Incremental improvement to the current state-of-the-art lithium-ion technology, for example regarding the physical or electrochemical design, can bridge the gap until the next generation of cells are ready to take Li-ions place. Previously designed two-layered porosity-graded graphite anodes, together with Li x Ni 0.6 Mn 0.2 Co 0.2 O 2 cathodes, were analysed in small pouch-cells with a capacity of around 1 Ah. For comparison, custom-made reference cells with the average properties of two-layered anodes were tested. Ten cells of each type were examined in total. Each cell pair, consisting of one double-layer and one single-layer (reference) cell, underwent the same test procedure. Besides regular charge and discharge cycles, electrochemical impedance spectroscopy, incremental capacity analysis, differential voltage analysis and current-pulse measurement are used to identify the differences in ageing behaviour between the two cell types. The results show similar behaviour and properties at beginning-of-life, but an astonishing improvement in capacity retention for the double-layer cells regardless of the cycling conditions. Additionally, the lifetime of the single-layer cells was strongly influenced by the cycling conditions, and the double-layer cells showed less difference in ageing behaviour.

1. Introduction

There is a lot of effort put towards the next generation of batteries, for example all-solid-state batteries [1] with certain advantages. However, it will still take time until the next-gen technology will potentially replace the current lithium-ion (Li-ion) cells. Until then, state-of-the-art Li-ion technology will be the go-to and still have potential to improve. Those improvements can include the active material, the electrolyte and also the interface in between. An example for active material related energy density improvement is the addition of silica into the graphite anode. Silica offers a higher capacity than graphite, but suffers from mechanical issues [2]. An increased electrochemical stability window of the electrolyte can allow for high-energy high-voltage Li-ion cells with different electrode materials [3]. The electrochemical stability of the electrolyte is already an issue and will be more important regarding future high-voltage cathode materials [4]. Switching to a tailored solid electrolyte increases safety by suppressing dendrite formation [5]. At the interface between electrolyte and graphite active material, the so-called solid electrolyte interface (SEI) forms. The SEI is crucial for cell performance, consists of solid products from reductive decomposition of the liquid electrolyte and shows properties of an electrolyte—a high ionic with low electronic conductivity [6]. Therefore, Li-ion systems could be considered the first commercial hybrid solid–liquid batteries (HySolLiq).
Within this work, we investigate the ageing behaviour of lithium-ion pouch-cells based on a common composition—graphite anode, lithium nickel manganese cobalt oxide (NMC) cathode with a lithium hexafluorophosphate (LiPF 6 ) based electrolyte. Different electrochemical tests are employed to help with the interpretation of the gathered data. In literature, frequently used in situ techniques to analyse the ageing behaviour are the electrochemical impedance spectroscopy (EIS) [7], the incremental capacity analysis (ICA) [8], the differential voltage analysis (DVA) [9] and also pulse tests [10]. The novelty of this work is the study of the degradation of two-layered anodes in pouch-cells. Based on our previous simulative study, we created anodes which consists of two layers with different porosities, coated on top of each other. The intention behind this design is to reduce the effect of the inhomogeneous layer growth across the anode, by increasing the initial porosity on the separator side. This layer growth results in a reduction of porosity, hindered ion transport and potentially a sudden drop in useable capacity. Additionally, the two-layered electrode design provides a more homogeneous overpotential across the electrode [11] and therefore can contribute to the formation of a more homogeneous and better SEI.
Layered electrodes haven been studied by other researches in simulation and optimisation studies as well as in experiments. A multi-layered porosity in the cathode was studied by simulation and achieved improved energy and power of the cell [12]. It was also experimentally shown that porosity grading in the cathode of high-voltage cells can reduce ageing [13]. A component-graded graphite anode, with different binder fractions coated simultaneously by a slot-die process, was investigated in [14] and resulted in increased mechanical stability and better performance. The use of different particle sizes in the layers of anode and cathode increased the performance by a factor of two [15]. The layered design has also been applied to different anode materials like nanostructured titanium oxide [16].
To our knowledge, there has been no experimental ageing study of graphite anodes with graded porosity in pouch-cells yet.

2. Methodology

Within this section, details regarding the cells used in this work as well as the testing procedure are explained.

2.1. Pouch-Cells

The pouch-cells were build at CIDETEC Energy Storage (Donostia-San Sebastian, Spain) through contract work and in accordance with standard processes and procedures. A detailed description on the production process can be found in our previous paper [17]. The experimental manufacturing with two subsequent coating steps resulted in a two-layered graphite anode with a porosity of 32.5% in the low porosity layer and 73.5% in the high porosity layer. For comparison a one-layered reference electrode with a porosity of 53% was manufactured. For both anode designs, the counter electrode in full-cell configuration consists of Li x Ni 0.6 Mn 0.2 Co 0.2 O 2 (NMC622). In the previously mentioned paper [17], we analysed the cast electrodes in small half- and full-coin-cell setup. Compared to the coin-cells, we use an electrode stack in the pouch-cells and a different separator (Celgard) was employed. The stack consists of 12 electrode pairs, 6 double-sided cathodes and 7 double-sided anodes. The cathodes had a size of 4.8 × 5.9 cm 2 and anodes 5.0 × 6.1 cm 2 . After the electrolyte was added, they were subject to formation cycles and thereafter they were opened again for degassing. After formation, their initial capacity was around Q = 900 mAh for both cell types. The cells with two-layered anode are labelled with ’DL’ for double-layer and are additionally identified with an number (CID) between 1 and 10. The reference cells with single-layered anode are labelled with ’SL’ and have an identification number (CID) between 11 and 20.

2.2. Electrochemical Characterisation

We tested and analysed the cell batch with different equipment under different conditions. For cycling and characterisation, BaSyTec Cell Test System in combination with Gamry Reference 3000 and a PEC Module Tester SBT4560 were used. Because the PEC cell-tester has no built in EIS measurement, cells tested with this setup have no EIS analysis. The following electrical equivalent circuit R 0 - ( R 1 | | Q 1 ) - ( R 2 | | Q 2 ) -W is used for fitting parameters to the EIS data, where R 0 represents the inner resistance, R 1 | | Q 1 the contribution of a surface layer (SEI) and R 2 | | Q 2 a charge transfer component. All cell-tests were not conducted at the same time, but each pair of cells was treated equally—i.e., same cycling conditions, same test procedure and same start date. In the following part, we will describe the electrochemical test used for analysis sorted by the cell ID.
The first three cell pairs—CID 1/11, CID 2/12 and CID 3/13—were tested with a PEC cell tester. They were cycled continuously without regular interruptions expect when the maximum number of iterations for the loop was reached. Cycling consisted of a constant current followed by constant voltage (CC/CV) charge with three different currents I ch = {300, 500, 800} mA until the upper cut-off voltage E max = 4.2 V was reached. The CV part of the charge was terminated by either reaching the set current value of I min = 50 mA or a maximum duration of t CV = 4 h. The cells were discharge by constant current of I dch = {300, 500, 500} mA until the lower cut-off voltage E min = 2.8 V. Between each charge and discharge phase, there was a pause of t pause = 10 min.
Cell pairs CID 4/14, CID 5/15, CID 6/16, CID 8/18+19 were subject to the most comprehensive test procedure. This was conducted with Basytec and Gamry. Cycling with CC/CV charge and CC discharge was interrupted by a check-up routine every 25 cycles. The details are shown in Table 1. In total, there were four combination of cycling conditions based on the parameters I cyc = { 450 , 900 } mA and T = { 25 , 40 } ° C tested. The cyclic ageing (Table 1 loop-3) was conducted between E min = 2.8 V and E max = 4.2 V with constant current of I cyc in both directions and a CV phase only for charging. The check-up routine (Table 1) consists of a C/20 CC charge, an EIS and a current pulse measurement. In preparation for the C/20 charge, we included a CC/CV discharge to ensure a more complete discharge as well as a pause. The C/20 charge step was mainly included for accurate calculation of ICA and DVA, peaks in the ICA show phase equilibria while active material phase transitions produce peaks in the DVA [18]. This step can however also be used to minimise the resistive limitation during charging and therefore as a way to determine a remaining capacity. In an intermediate step, the cell is set to a state of charge of S o C = 50% based on the charge throughput during the previous C/20 charge Q C / 20 . EIS produces the frequency-dependent complex impedance of the cell. Since certain processes in the cell occur at different timescales, this technique provides insight into the development of these time-dependent processes. The measurement was conducted between the frequencies of f min = 10 mHz and f max = 10 kHz with an excitation alternating-current of I EIS = 90 mA. EIS is followed by the current pulse measurement. Therein, short charge and discharge current pulses with I p = { 1 , 2 , 3 , 4 , 5 } C are applied to measure the voltage response of the cell. These are either terminated by the voltage or time limits, E min = 2.8 V, E max = 4.2 V or t p = 15 s.
Last but not least, CID 10/20 were also cycled with a CC/CV-CC protocol at I cyc = 300 mA while the CV cut-off current was set to I min = 50 mA. EIS was conducted every 10 cycles from f = 0.1 Hz to f = 10 kHz at a fixed voltage of E EIS = 3.93 V.
Table 2 gives an overview for all the conditions and techniques used for the specific cells tested in this work.

3. Results

In the following section, the results obtained by cycling the pouch-cells are analysed. First, we look at the state of health based on the discharge capacity during the ageing cycles as a value to quantify ageing behaviour of the cells. The second subsection contains the analysis of beginning-of-life (BoL) cell data, to check if there are differences between SL and DL before degradation. Finally, the ageing behaviour of the two anode design during the cycle tests is evaluated more closely.

3.1. Discharge Capacity

The average value of the state of health based on the discharge capacity S o H C during the ageing cycles for each cell type including the standard deviation is displayed in Figure 1. For better visibility, only every fifth value is pictured. At the beginning ( n = 0 ) there are 8 DL cells and 9 SL cells averaged. Since not all were cycled for the same number of cycles, there are some visible features in the graph where the number of cells is reduced. This can be seen for the DL curve between 600 and 700 cycles. The erratic gradient of the SL average is caused by the cells with check-up routine. The CV discharge and the C/20 charge cause an increased discharge capacity during the first couple of ageing cycles after each check-up. All DL cells performed significantly better than SL cells, while the capacity retention of the SL cells was poor. The SL cells also show a greater variation between the different cases, which results in a bigger standard deviation for these cells. This indicates that the SL cells were more affected by the different cycling parameters like C-rate and temperature. While the SL cells at low C-rates offer some form of capacity retention, at higher rates the discharge capacity degrades quickly. The below expected behaviour of the SL cells is surprising, especially since they were built with standard components. While it is possible that the poor performance originates from badly built cells, any faults inside the SL pouch-cells should also be present in the DL cells, since they were built from the same materials, in the same facilities and with the same procedure. Comparing the results of the pouch-cells with the results obtained with coin-cells in the previous study [17], we can clearly see a difference. In coin-cells, the two cell-types performed similarly and both reached a S o H , based on the discharge capacity, of around 80% after approximately 400 cycles. In case of the cells in pouch format, the SL cells reached S o H = 80% after around 100 cycles and the DL cells after roughly 600 cycles. We used the same materials in both cell formats, aside from a different separator. Differences unrelated to the materials are the pressure experienced by the electrodes, a stack of electrode pairs versus a single pair, a different fraction of edge versus area and different tools used to cut the electrodes. The ratio of edge to area equals e / a = 113 m 1 for the coin-cell and e / a = 73 m 1 for the pouch-cell electrode.

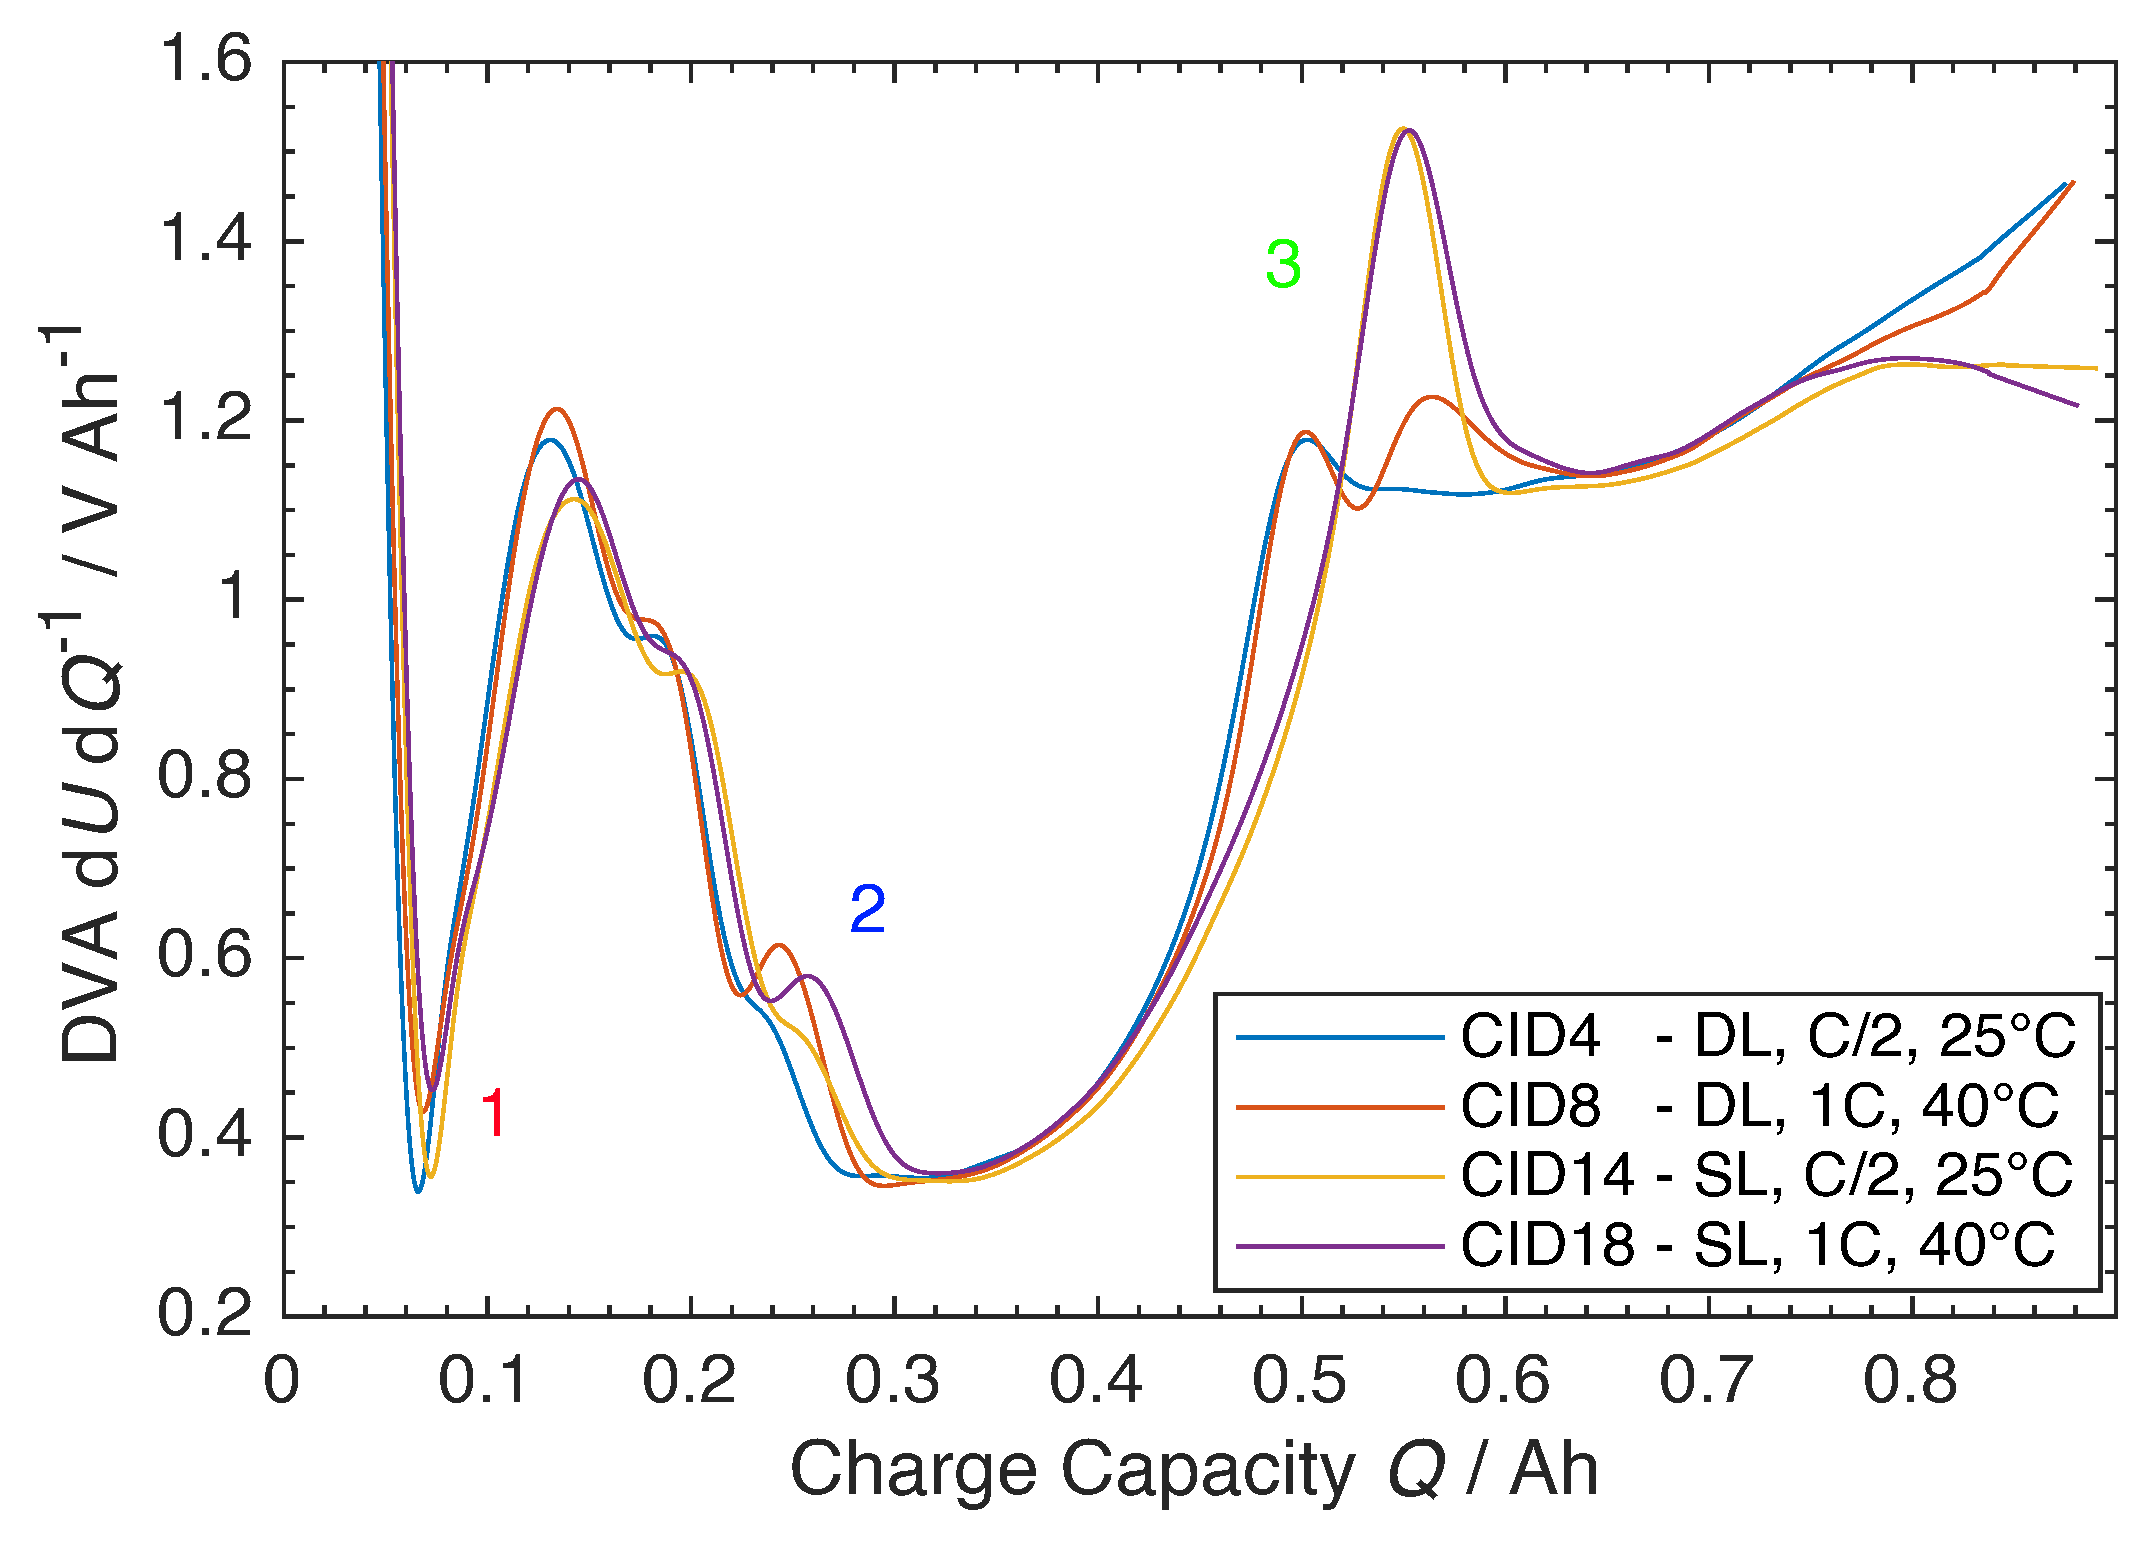
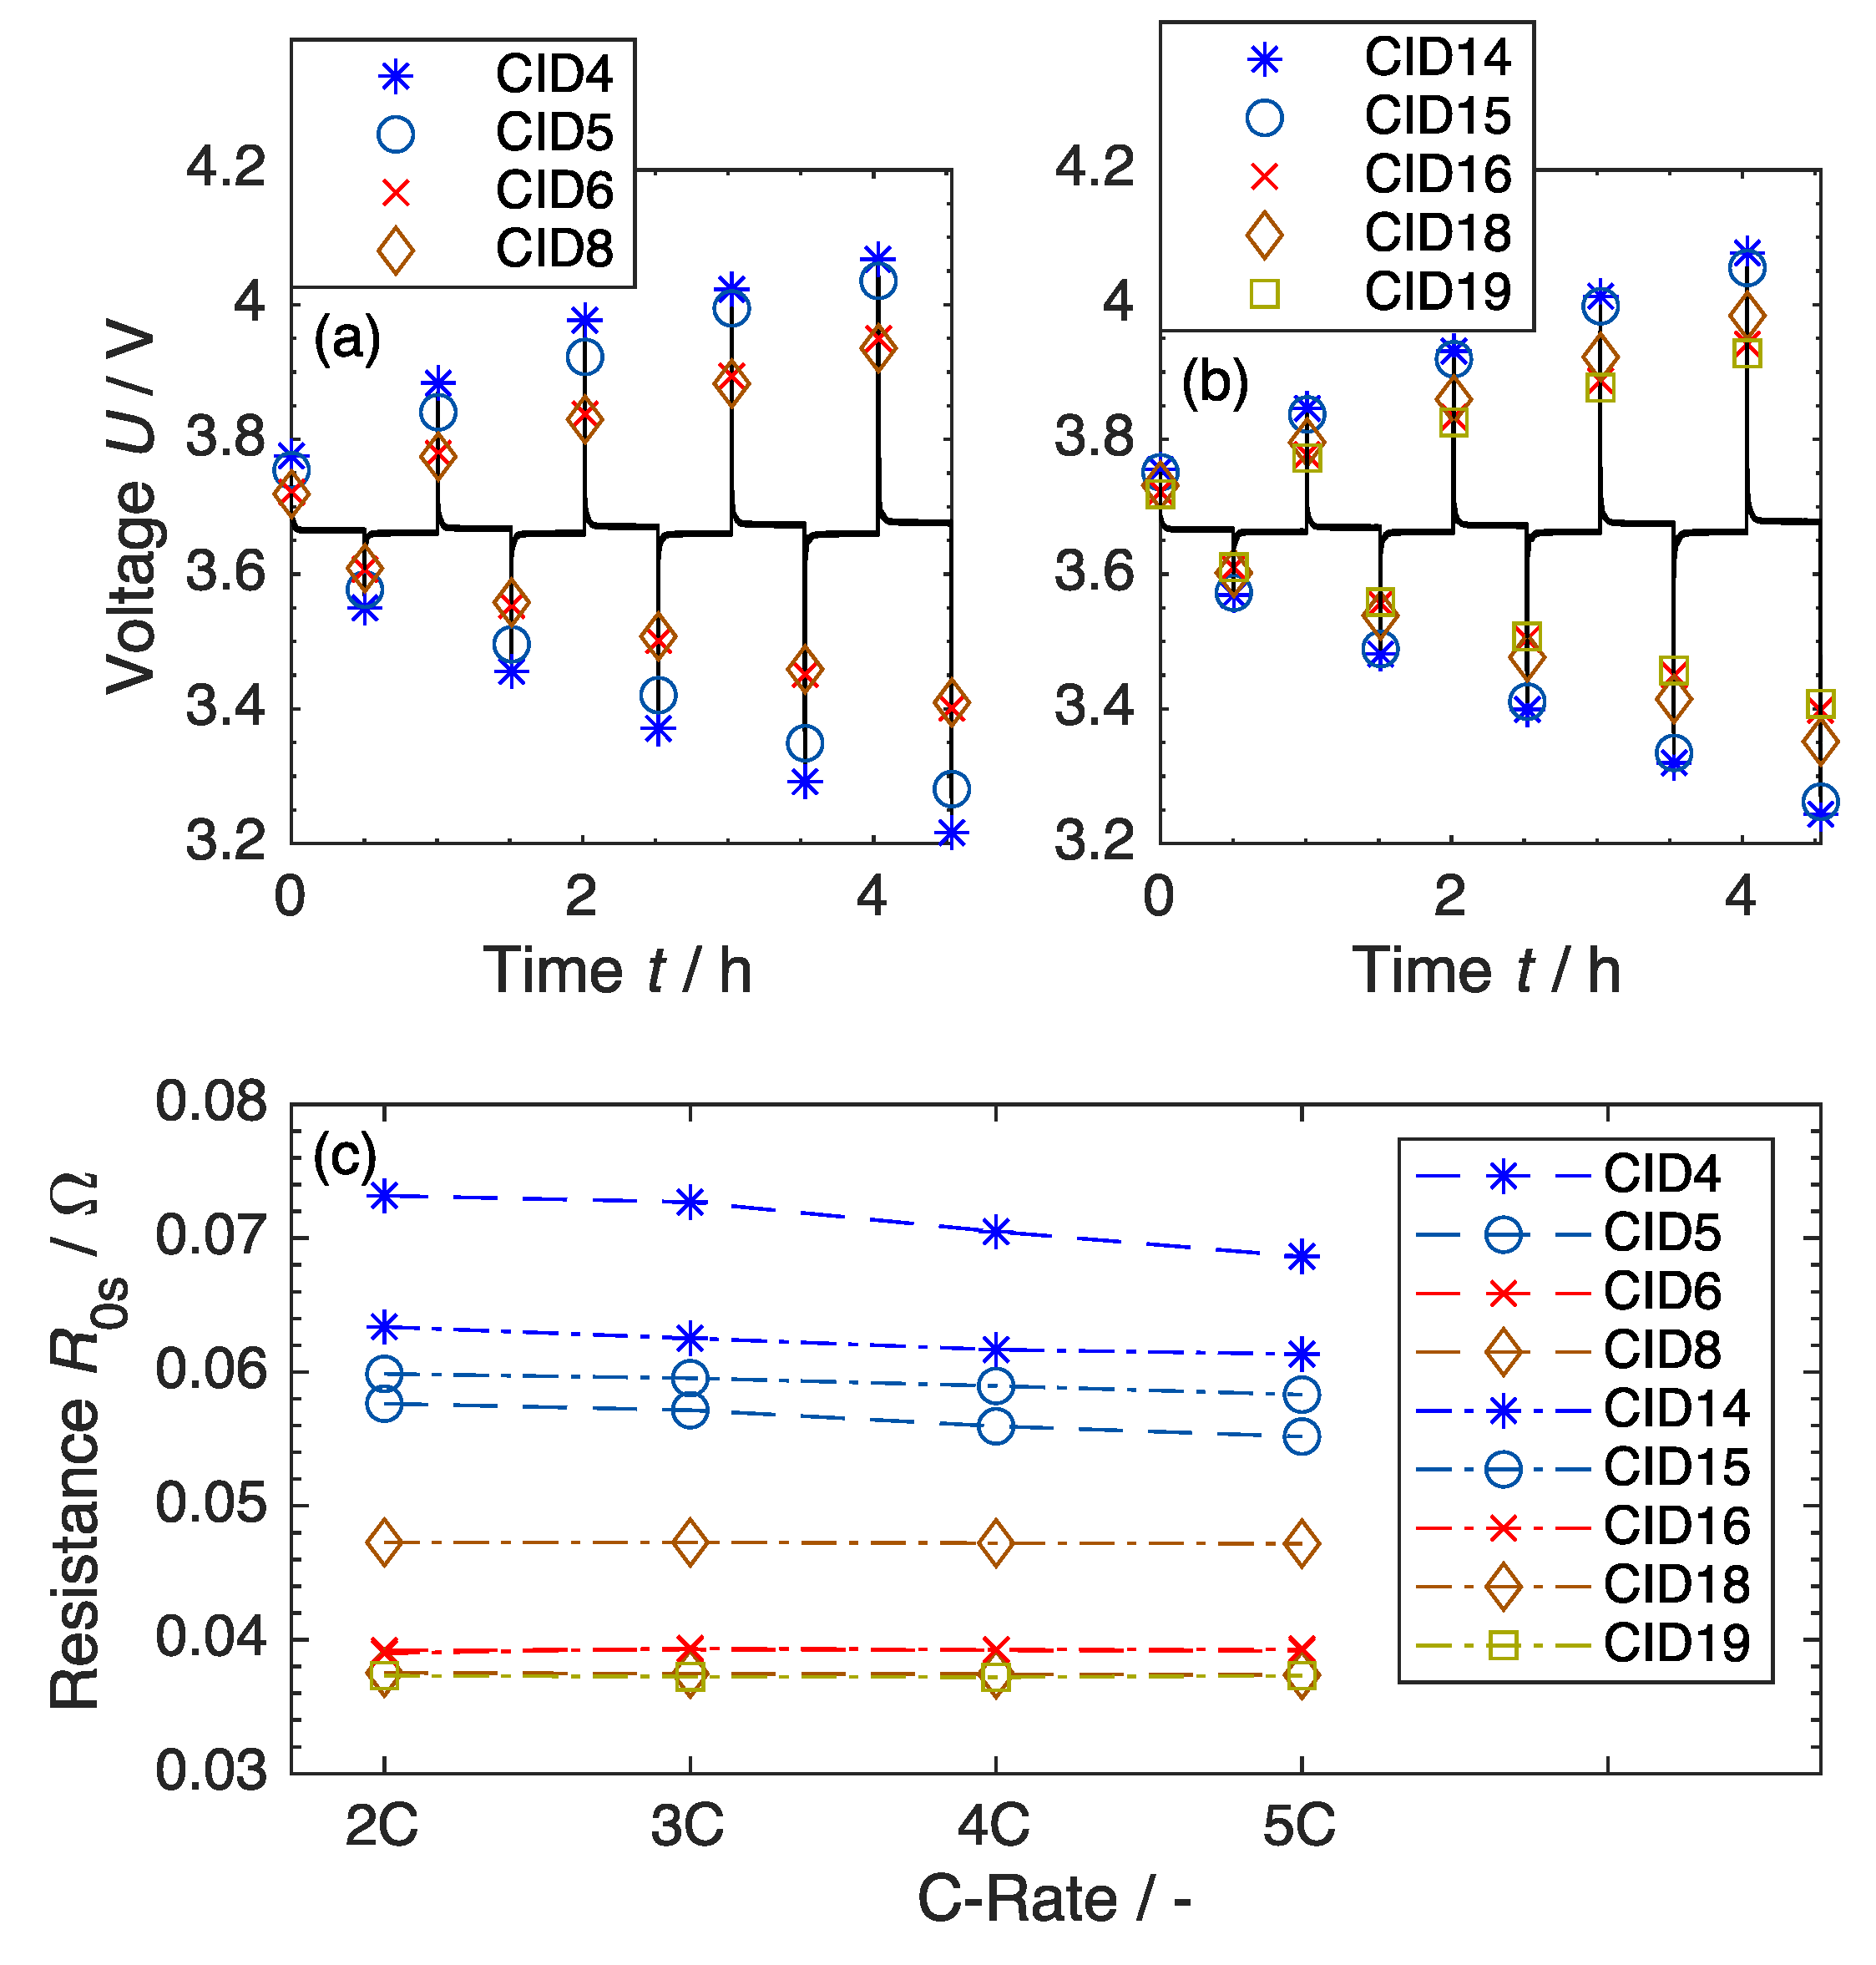
3.2. Beginning-of-Life
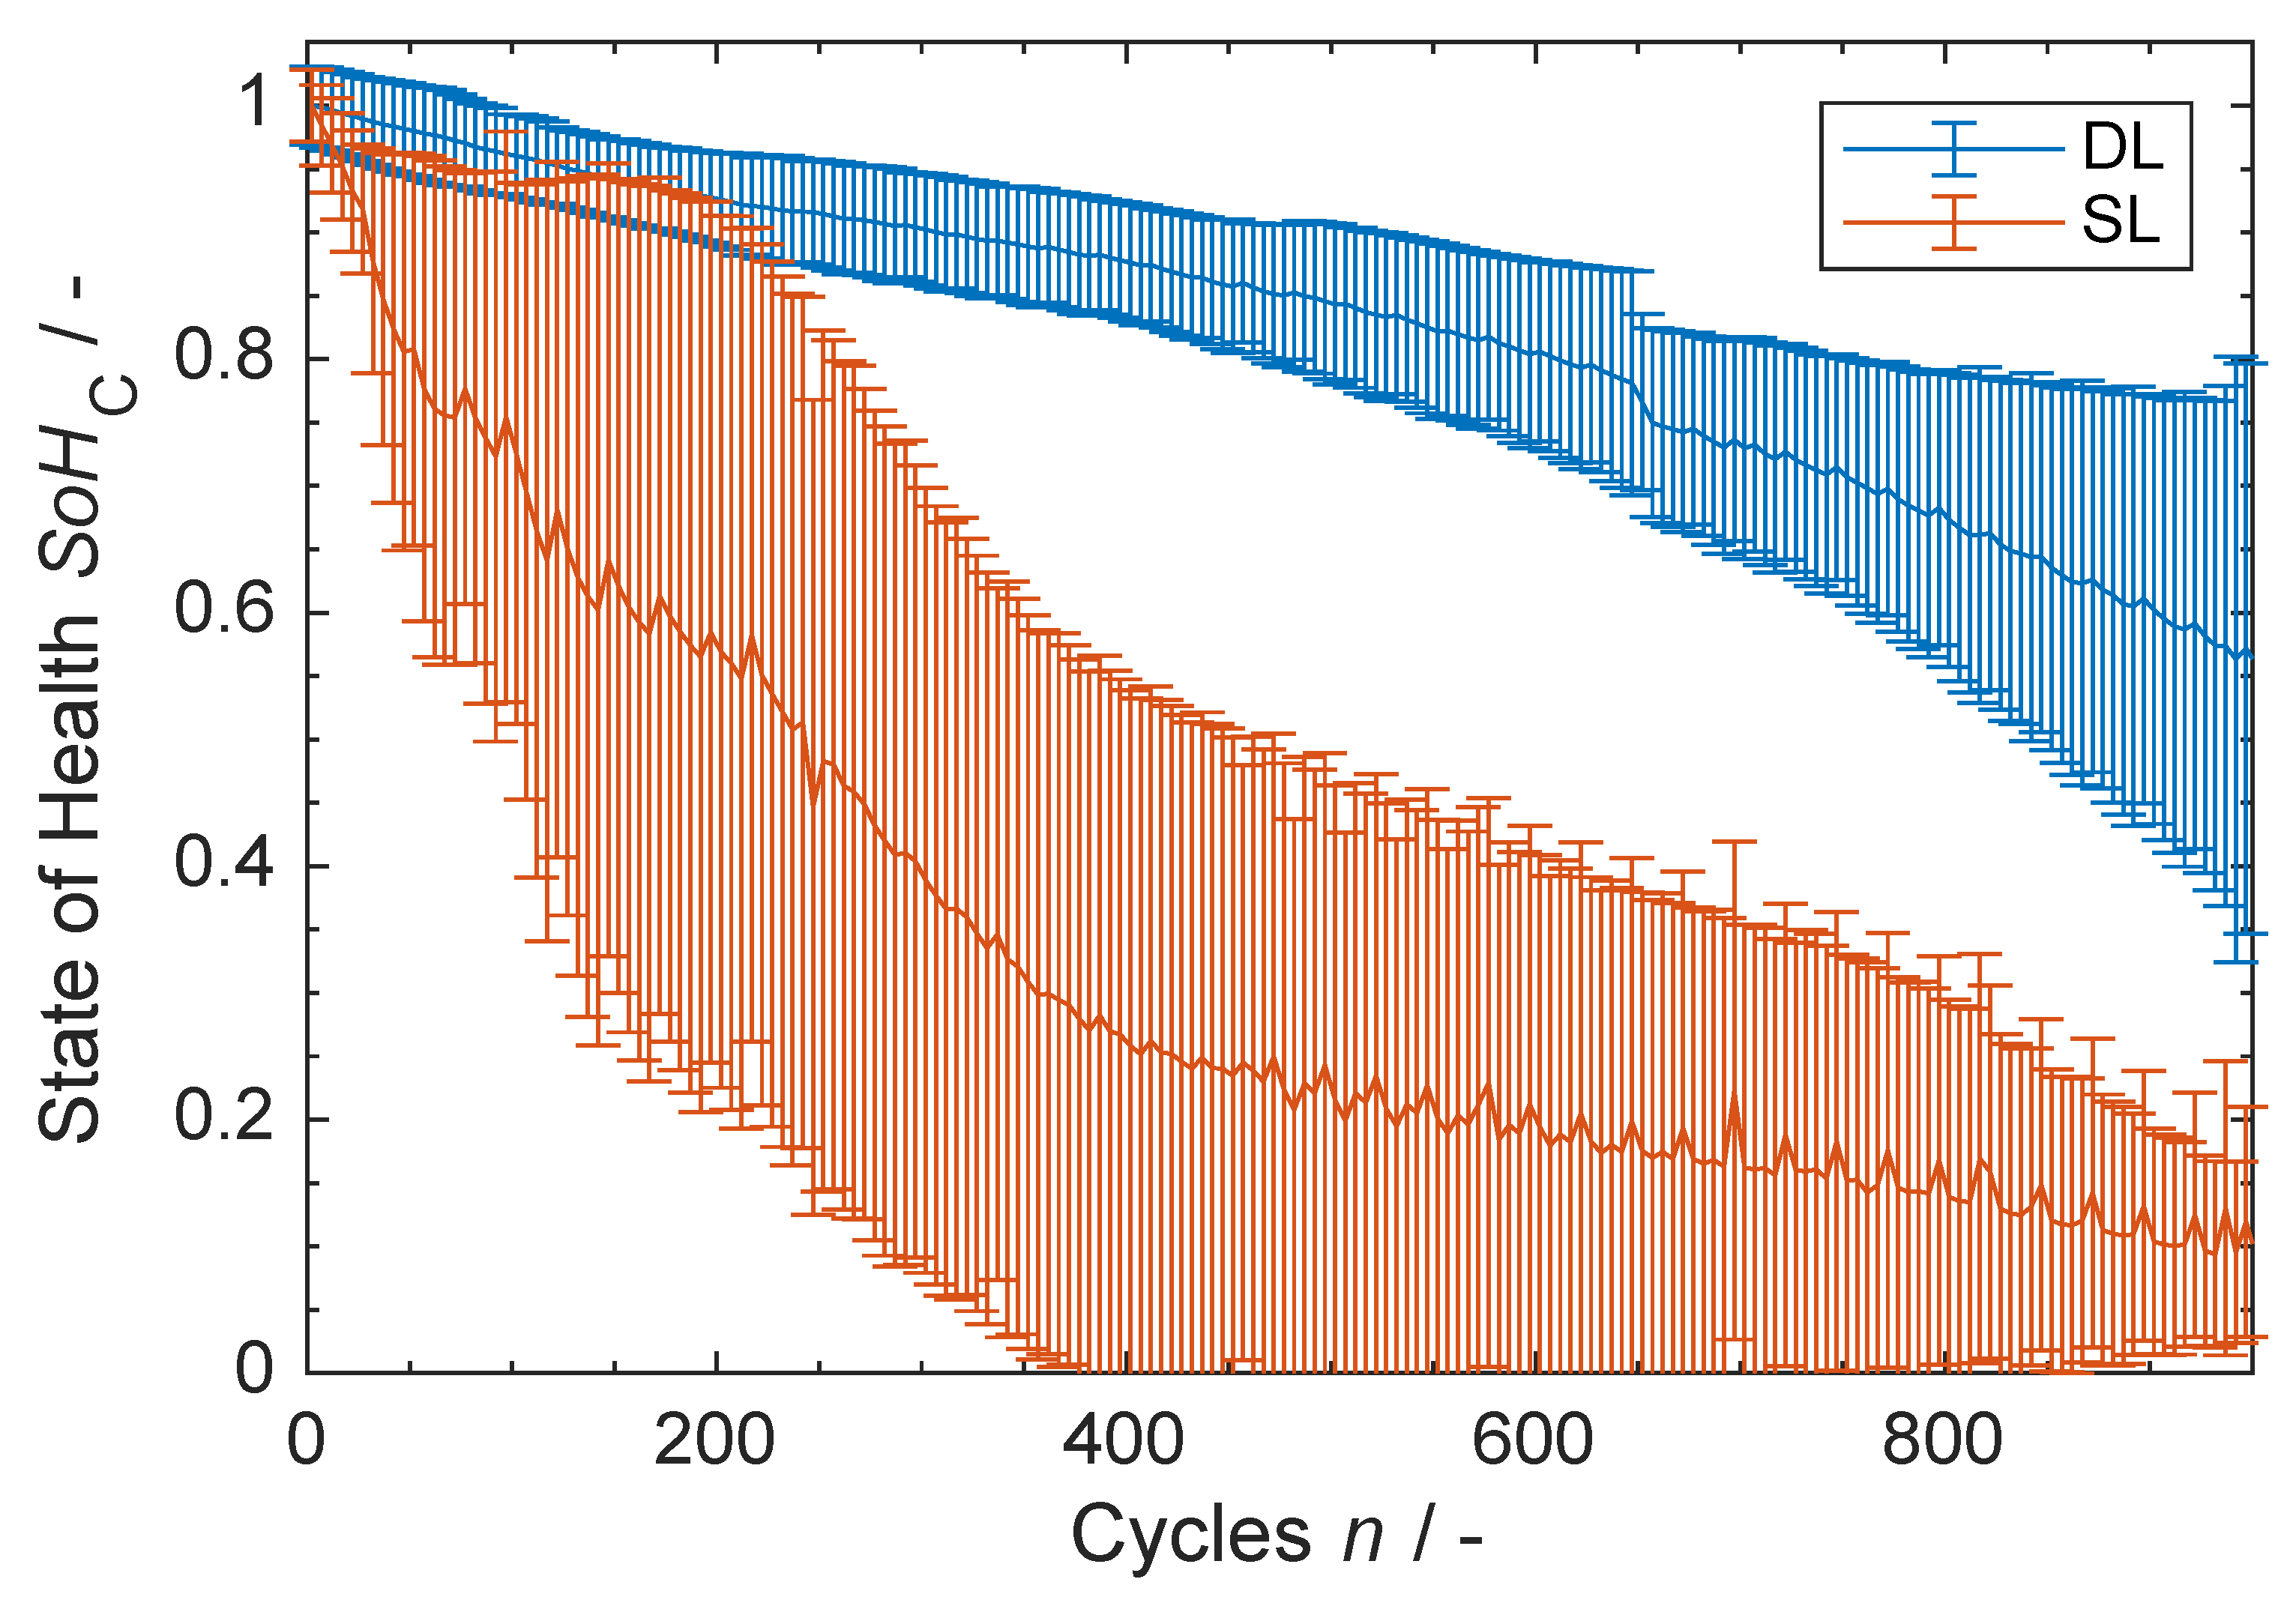
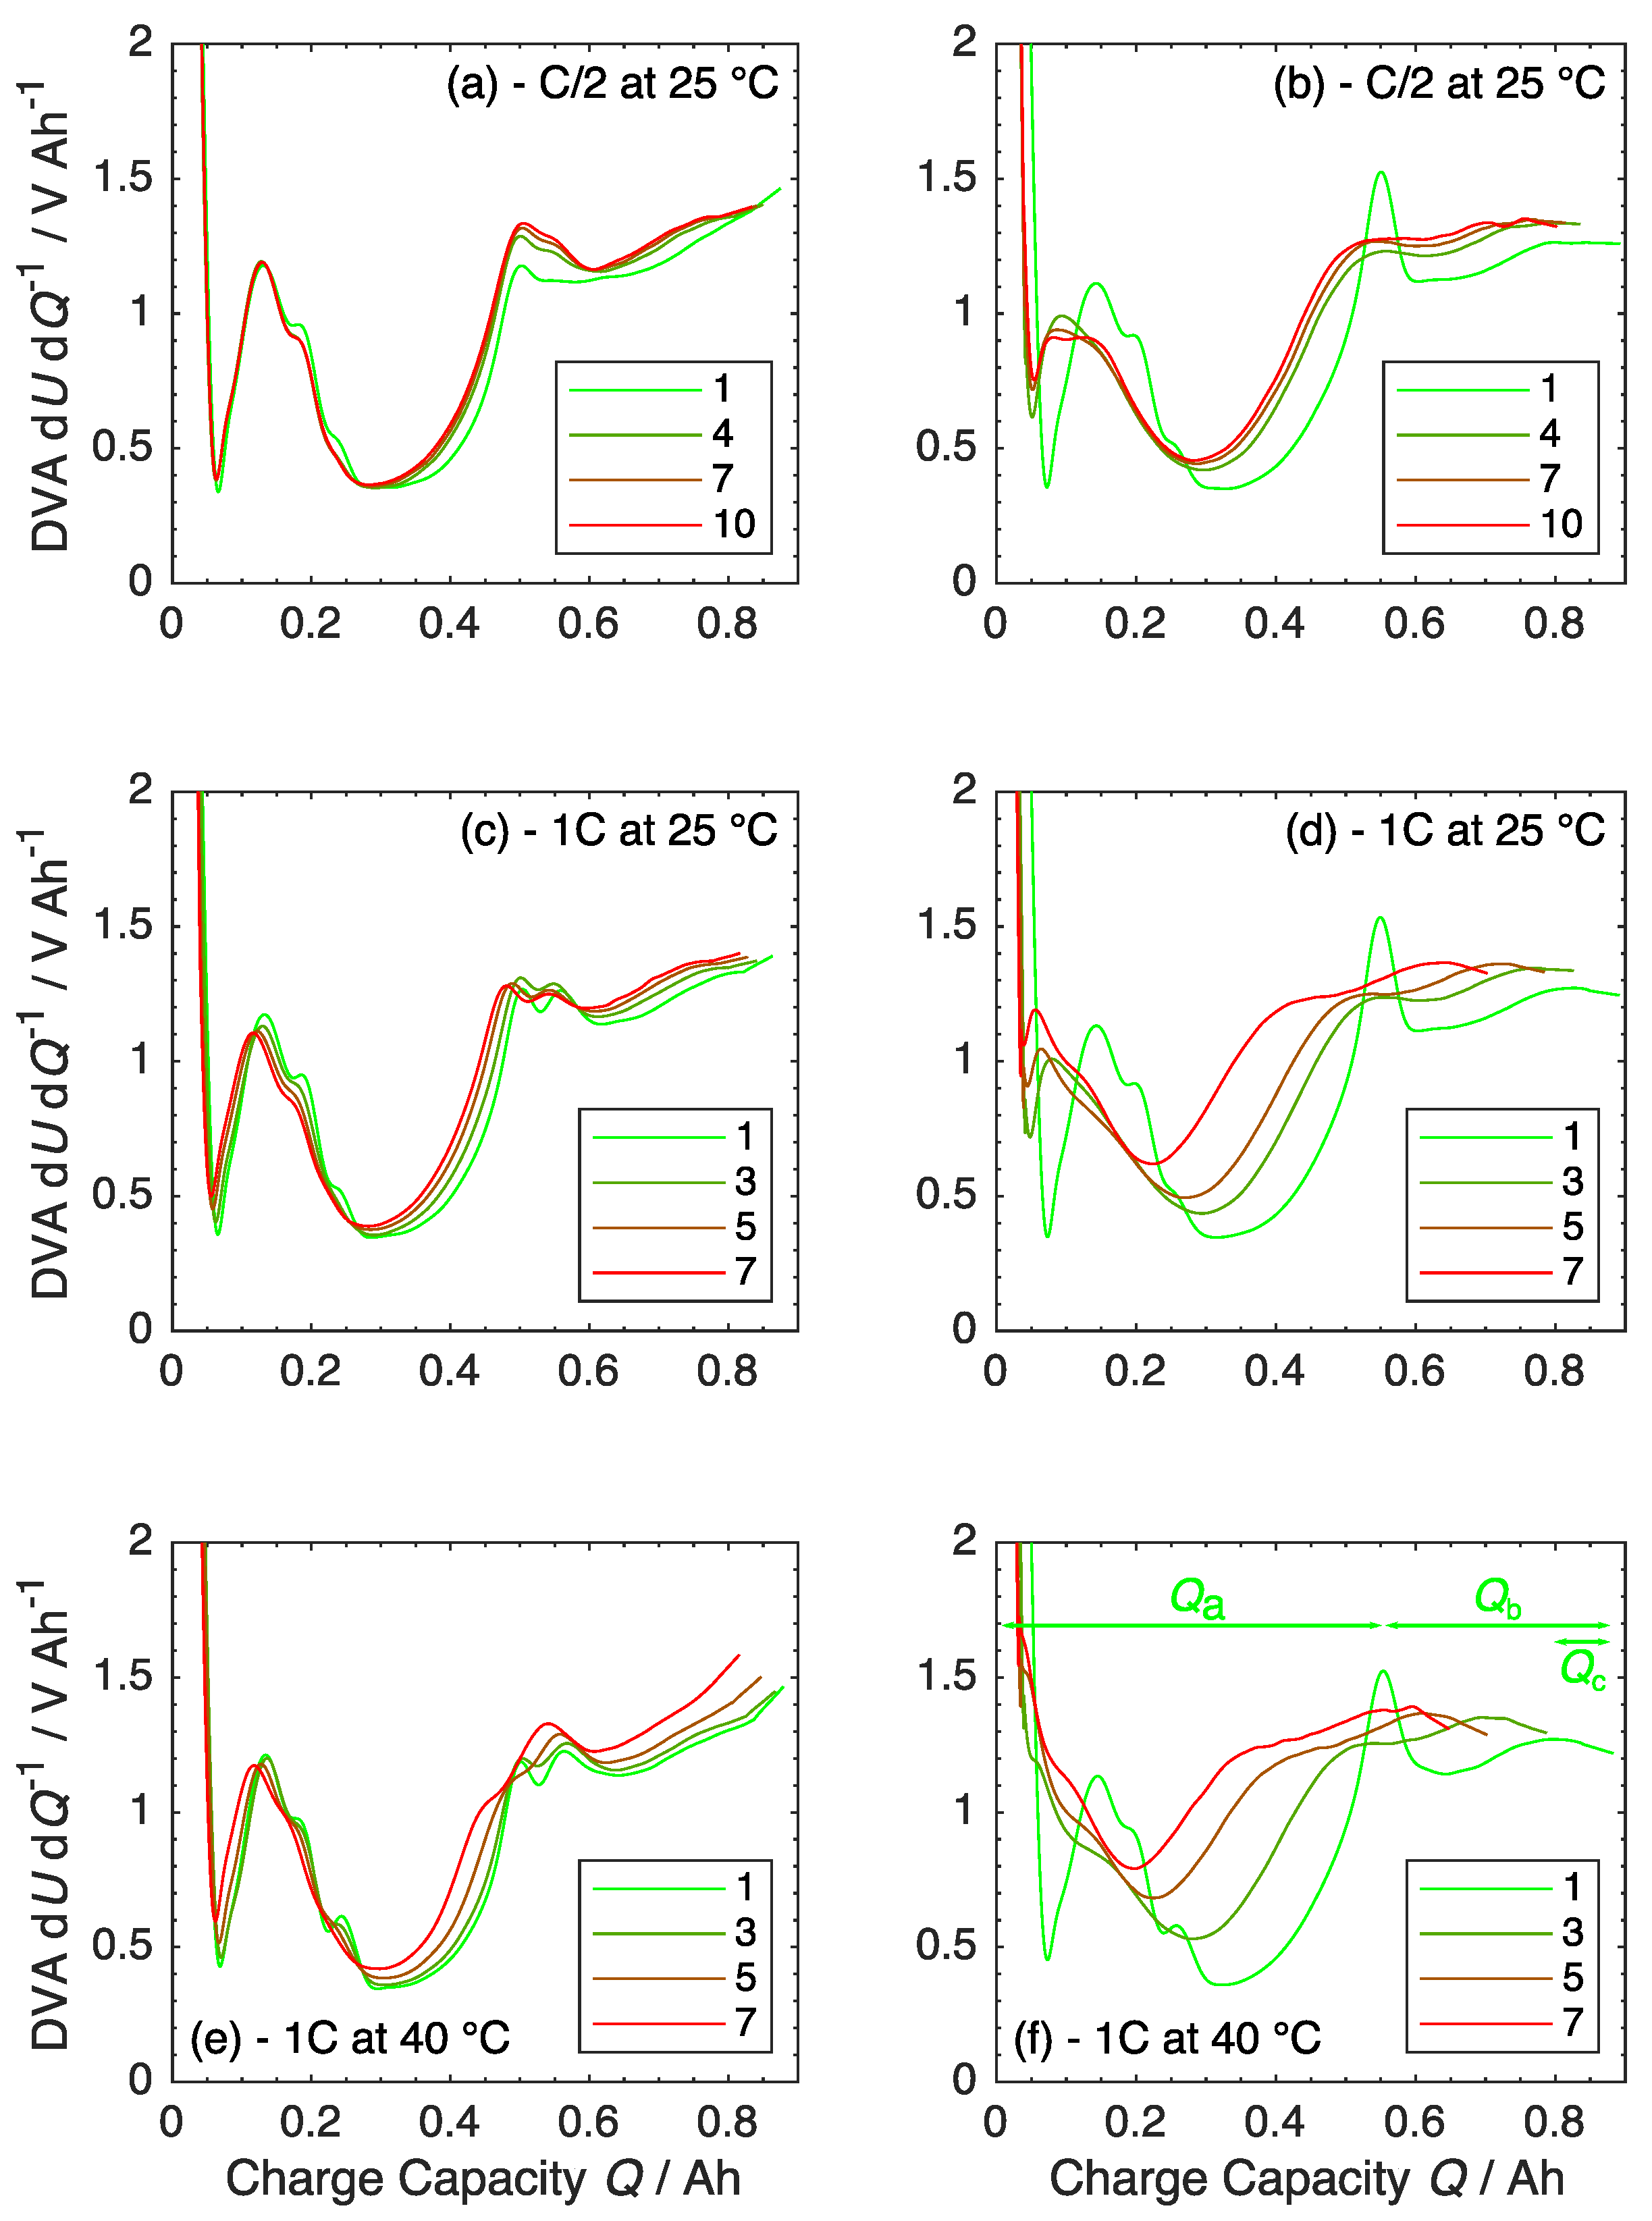
The recorded impedance data after the first two initial cycles is displayed as Nyquist plot in Figure 2. The upper Figure 2a contains the data of the DL cells and the lower Figure 2b the data of the SL cells. At both temperatures, the shape of the curves as well as the pure ohmic impedance is similar for most cells. CID 20 differs in regard to the ohmic part, the most likely reason being that this cell was tested at a different SoC. When looking closely, it is possible to adumbrate the combination of two separate super-positioned circuit elements for some curves, even though at first glance it looks like one compressed semicircle. The average of the fitted inner resistance R 0 values differ by 0.004 Ω between the groups (CID 20 excluded). In general, it seems like the plots are slightly more compact for the SL cells. This means that the contributions from the SEI and/or charge transfer component are less. It is possible that CID 4 has an issue with the distribution of the electrolyte in the low porosity layer (wetting) and therefore a more pronounced semicircle due to less active surface area. Another explanation is the occurrence of irregularities because of the early stages of life.
ICA and DVA plots in Figure 3 are calculated from the C/20 charge during the check-up routine
ICA = d Q d U , DVA = d U d Q .
The ICA is usually plotted against the cell voltage U and the DVA versus the cumulative charge throughput Q. The data is recorded at 5 mV increments and smoothed by moving average with a locally estimated scatterplot smoothing method.
The top row shows the dQ/dU plots for the (a) DL and (b) SL cells. While the bottom row shows dU/dQ plots also separated by anode type. If we look at the dQ/dU plot for the DL cells in Figure 3a, we can identify three differences between the cycling conditions. (1) For the cells cycles at T = 20 °C the first peak A is more intense. (2) There is an additional feature B at U 3.6 V for the cells at T = 40 °C. (3) Lastly, at U 3.8 V there is an additional maxima C for the cells cycled with higher C-rates, this is not as clearly developed for the low C-rate. For the SL cells in Figure 3b the observations (1) and (2) for features A and B also hold true. The main difference between the DL and the SL cells is the distinct depression at U 3.8 V for all the SL cells C. The first peak A is attributed to the intercalation of lithium in the graphite anode. The second major peak originates in the phase transition of the NMC cathode—to be more precise, the phase transition from hexagonal to a monoclinic lattice. In literature, the following feature C is either assigned to a following cathodic phase transition or it is speculated that this feature could also be the result of non-reversible side-reactions like SEI formation [19]. The features A, B and C can be identified in the dU/dQ plots. In Figure 3c the corresponding feature 1 can be found at Q 0.08 Ah where the minimal value is less for the cells at T = 25 °C. The additional feature 2 for cells cycles at T = 40 °C can be found at Q 0.25 Ah. The difference 3 between the DL and SL cells is visible at Q 0.55 Ah. In subplot Figure 3d the features 1, 2 and 3 are located at Q 0.08 Ah, Q 0.25 Ah and Q 0.6 Ah respectively. At high SoCs, an additional feature is visible for the SL cells which is barely observable in the DL cells. Since the only difference between the tested cells is the layout of the anode, it seems likely that features C or 3 show the influence of the double layer anode. However, the area C is usually linked to an NMC phase transition in the dQ/dU plot [20]. On the other hand, in the dU/dQ representation, 3 is commonly used as the central anode marker [18]. We believe that two separated peaks in Figure 3c relate to separated phase transition of the two layers in DL anode.
Figure 4 shows the dU/dQ plots of four selected cells to demonstrate the difference at 1, 2 and 3 more clearly. There are two cells for each parameter, DL versus SL, C versus C/2 and 25 °C versus 40 °C. Each of the previously discussed differences can be found in this graph. Additionally, the tail end of the plot also looks different between the DL and the SL cells. In this area, a cathode marker has been reported for NCA but not all different NMC types (NMC111, NMC622 and NMC811) [21,22].
Figure 5a,b shows the voltage response of the cells to current-pulse excitation. The general voltage time-series are coloured in black, while the maximum voltage values at the end of the pulse are highlighted by differently coloured markers for each cell. As expected and in accordance to the previous results, there are no significant differences between DL (Figure 5a) and SL (Figure 5b) cells. At T = 25 °C, the SL cells perform marginally better, while at T = 40 °C they are equal. The cells at higher temperature show a smaller voltage response, due to the reduced impedance of the cell. For all cell pairs at the same temperature, the cell with a higher current in the previous cycles performs slightly better. Subplot Figure 5c shows the resistance R 0 s calculated from the voltage response according to Equation (2) with the voltage difference before U ( 0 s ) and immediately after U ( 0 s + Δ t ) the start of the current pulse
R 0 s = | U ( 0 s ) U ( 0 s + Δ t ) | I p .
The values barely change depending on the C-rate of the pulses. The cells at the higher temperature (shown in reddish colours) are tightly grouped together, while at lower temperature (shown in blue colours) the cells are more spread apart. There is no distinct difference between the DL and SL setup.

3.3. Ageing

Now we look only at the cells which were tested with the complete check-up routine. Figure 6 shows the four pairs of cells tested under different cycling conditions: 1/2C at 25 °C, 1C at 25 °C, 1/2C at 40 °C and 1C at 40 °C. There is a difference between the different temperatures and C-rates visible, but since there is only one cell(-pair) for most cases it is difficult to generalise the results. A visible trend is, the higher the temperature and the higher the C-rate, the faster the degradation. The findings from Figure 1 also apply here—the DL cells show a higher capacity retention than the SL cells. In the following analysis, the pair CID 6/16 will be excluded. This decision was made based on the irregular behaviour of the SL cell (CID 16) and at the same time the failure of the EIS measurements of the DL cell (CID 6) due to high contact resistance. On the same note, CID 18 and CID 19 were treated identically during the tests and behaved similar; therefore, CID 19 will also be neglected from this point.
The impedance analysis in Figure 7 reveal several highlights by the advance of the cycling. Firstly, while there was barely a second component visible during the first impedance measurement, with increasing age, two contributions are visible for all the cells. The overlapping of both depressed semicircles at BoL is not uncommon [7]. It is also obvious, that the first EIS for CID 4, and to a lesser extent CID 5, do not fit well with the observable trend. Again, this is most likely due to the early stages of lifetime. Secondly, the increase of the impedance for the SL cells is more pronounced than for the DL cells. The increase of the inner resistance R 0 relative to the first measurement is listed in Table 3.
The spectra of CID 8/18 were hard to fit after as little as 50 cycles. We decided to use the real part of the impedance at f = 10 kHz Z real , 10 kHz for comparison instead. A decent agreement of the relative change based on the fitting parameter R 0 and the measured Z real , 10 kHz can be shown exemplary for CID 15. The relative change of the inner resistance Δ R 0 = { 23 , 62 , 184 } % after { 50 , 100 , 150 } cycles is in good agreement with the change of Δ Z real , 10 kHz = { 22 , 64 , 198 } % . A bigger increase of the impedance for SL cells can also be shown for the two RQ circuit elements. On average, for DL cells CID 4/5, the sum of R 1 + R 2 gains an additional 10% and 9% from the second to the third and the third to the fourth measurement, while the growth is 22% and 36% for SL cells CID 14/15. Thirdly, the growth of the depressed semicircles is higher for the SL cells. At the same time, the contribution at the higher frequencies is less affected once developed than the contribution at medium frequencies. Table 4 shows the fitted values for R 1 and R 2 averaged over the DL cells CID 4/5 and SL cells CID 14/15 for the second, third and fourth EIS measurement.
We can see that in both absolute values and relative change, that there is more degradation happening in the SL cells—more SEI formation ( R 1 ) and more electrolyte consumption ( R 0 ), more mechanical degradation ( R 0 , R 2 ) and loss of active material ( R 2 ) [23]. For all cells, the contribution can be sorted the same way: R 1 < R 0 < R 2 .
Figure 8 shows the incremental capacity analysis of the cell pairs. To no surprise, there is a distinct difference between the DL and the SL cells. At the same time, the cells within each group, DL or SL, behave similarly. While the DL group mostly retains its shape and only loses some smaller features, the SL group changes more drastically—even some major features are gone. When comparing the evolution of peak 1, for the DL cells {CID 4, CID 5, CID 8} there is an reduction of the intensity with a slight shift, but the reduction is more than twice as much for the SL cells {CID 14, CID 15, CID 18} with an larger shift. The relative changes of the intensity amount to { 9 % , 29 % , 29 % } for the DL cells while they amount to { 51 % , 62 % , / } for the SL cells after 150 cycles. For cell CID 18 there is no peak 1 anymore. The corresponding shift of the peak position is { + 0.3 % , + 0.3 % , + 0 % } and { + 0.58 % , + 0.58 % , / } for the DL and SL cells, respectively. The valley or the minimum between the two major peaks shifts to higher voltages slightly in case of the DL cells. However, in the SL case, the minimum shifts to lower voltages. Therefore the area assigned to peak 1 is in the SL case not only reduced by the reduction in intensity but also the reduced width due to the shift of the minimum. After the same cycles, the intensity of peak 2 decreased by { 1 % , 11 % , 18 % } for the DL cells and { 21 % , 44 % , 55 % } for the SL cells. Features between peak 1 and peak 2 got blurred and are partly not recognisable anymore. The peak shift is for both cell types similar to the shift of peak 1. The development of the last feature of interest, the combination of a local minimum and maximum, at around U 3.8 V also displays a distinct difference between DL and SL cells. After the 150 cycles, this feature still exists for the DL cells. There is a shift to higher voltages and in case of CID 4 the feature developed a more clear shape. For all SL cells, this feature disappears rapidly during cycling. The minimum as well as the small maximum next to is equalise and also shift to higher voltages. Based on the previous described results and the literature, where different ageing mechanism are linked to specific changes in the features, two conclusions can be drawn [24,25]. Loss of cyclable Lithium (LLI) seems to be the dominant ageing mechanism, which is directly correlated to an increased inner resistance and a lower utilisation of the active material. The shift of the features could be due to loss of active material (LAM) either in the anode or the cathode.
For the differential voltage analysis in Figure 9 the information is contained in certain areas between the peaks. Instead of analysing the peaks itself, we look at the distance between them, Q a , Q b and Q c [18,22,26]. Q a represents a development in the anode, while Q c represents the cathode. If Q b changes without a change in Q c , the balancing of the electrodes changed. As marker for the double peak, which we suspect is related to the double-layer anode, the second peak at higher voltage is used. In some cases the identification of the peaks to determine the distances is difficult. In these we decided to assume the points with the lowest gradient as peak. The relative changes of the before mentioned Qs between the first measurement and after 150 cycles is listed in Table 5. As already mentioned, the feature used to determine Q c has not been reported for this cell chemistry in the literature before. Since we do not have half-cell data for the electrodes, we are not able to verify if this feature is a contribution of the cathode or not. Therefore, the interpretation of Q c has to be taken with a grain of salt.
After 150 cycles, CID4 shows only a reduction in Q b with no changes in Q a and Q c . This correlates to a change in electrode balancing, through the loss of cyclable lithium. The corresponding SL cell CID 14 also shows the loss of cyclable lithium as dominant ageing mechanism, while only minor changes are visible for the anode value Q a and no changes for the cathode value Q c . The reduction of the capacity for {CID 4, CID 14} is Δ Q tot = { 3 % , 9 % } at this point, which is still in the linear ageing phase and most likely dominated by the formation of new SEI. For the cell pairs CID 5/CID 15 and CID 8/CID 18, there is an increasing reduction in each parameter visible except for Q b of cell CID 5. This is most likely based on the cell-to-cell variations or caused by some inaccuracy at the determination of the peak. The pairs {CID 5, CID 15} and {CID 8, CID 18} show a degradation in capacity of Δ Q tot = { 5 % , 21 % } and Δ Q tot = { 7 % , 26 % } for the DL and SL cell, respectively. When comparing this capacity at C/20-rate with the capacity retention from Figure 6, which was measured during cycling operation at much higher rates, it becomes obvious that a major part of the reduction in discharge capacity is due to an increased resistance of the SL cells and decreasing usage of the active material.
The influence of the inner resistance on the capacity can be estimated from Figure 10. It shows the CC discharge capacity Q dis during cycling (for comparison, Figure 6) and the charge capacity of the C/20 step Q C / 20 during the check-up phase, exemplary for two cycling conditions (a) and (b). Obviously, the charge throughput is higher during the C/20 charge than the 1C or C/2 discharge. The reason is the lower influence of the ohmic resistance at lower currents. The difference evidences the strong influence of the increased inner resistance on the cycling performance, especially for the SL cells.

4. Conclusions

The comparison of the two different anode design in pouch-cell format show an overwhelming difference between them. The cell types behaved quite similar at BoL, but the capacity retention was significantly improved for the two-layered anode design. On average, there was a difference of several hundreds cycles before reaching S o H C = 80 % . All identified modes of ageing were more severe in the SL cells. In the previous study, which was conducted on the same electrodes but with coin-cells, we could not observe such an improvement. This could be related to the size and format of the electrodes and the way they were cut. Even though the cells were built from the same materials and with the same procedure, it is difficult to explain the observed disparity in the pouch-cells. Further experiments are needed to check the reproducibility, the coating procedure and the anode porosity needs to be adjusted to more conventional values. Besides that, there are more parameters which can be investigated, the composition of the two anode layers (the amount of active material, binder, conductive agent) as well as potentially the particle size in each one.

Author Contributions

Conceptualisation, D.M. and K.P.B.; methodology, D.M. and A.F.; investigation, D.M.; formal analysis, D.M.; visualisation, D.M.; writing—original draft preparation, D.M.; writing—review and editing, D.M., A.F. and K.P.B.; supervision, A.F. and K.P.B.; funding acquisition, K.P.B. All authors have read and agreed to the published version of the manuscript.

Funding

This research was funded by Robert Bosch GmbH.

Institutional Review Board Statement

Not applicable.

Informed Consent Statement

Not applicable.

Data Availability Statement

The data presented in this study are available on request from the corresponding authors.

Acknowledgments

The authors thank Robert Bosch GmbH for financial support through the Bosch Promotionskolleg.

Conflicts of Interest

The authors declare no conflict of interest. The funders had no role in the design of the study; in the collection, analyses, or interpretation of data; in the writing of the manuscript, or in the decision to publish the results.

References

  1. Reddy, M.V.; Julien, C.M.; Mauger, A.; Zaghib, K. Sulfide and oxide inorganic solid electrolytes for all-solid-state Li batteries: A Review. Nanomaterials 2020, 10, 1606. [Google Scholar] [CrossRef] [PubMed]
  2. He, S.; Huang, S.; Wang, S.; Mizota, I.; Liu, X.; Hou, X. Considering critical factors of silicon/graphite anode materials for practical high-energy lithium-ion battery applications. Energy Fuels 2020, 35, 944–964. [Google Scholar] [CrossRef]
  3. Yang, J.; Liu, Q.; Pupek, K.Z.; Dzwiniel, T.L.; Dietz Rago, N.L.; Cao, J.; Dandu, N.; Curtiss, L.; Liu, K.; Liao, C.; et al. Molecular Engineering to Enable High-Voltage Lithium-Ion Battery: From Propylene Carbonate to Trifluoropropylene Carbonate. ACS Energy Lett. 2021, 6, 371–378. [Google Scholar] [CrossRef]
  4. Liang, G.; Peterson, V.K.; See, K.W.; Guo, Z.; Pang, W.K. Developing high-voltage spinel LiNi0.5Mn1.5O4 cathodes for high-energy-density lithium-ion batteries: Current achievements and future prospects. J. Mater. Chem. A 2020, 8, 15373–15398. [Google Scholar] [CrossRef]
  5. Ji, X.; Hou, S.; Wang, P.; He, X.; Piao, N.; Chen, J.; Fan, X.; Wang, C. Solid-State Electrolyte Design for Lithium Dendrite Suppression. Adv. Mater. 2020, 32, 2002741. [Google Scholar] [CrossRef]
  6. An, S.J.; Li, J.; Daniel, C.; Mohanty, D.; Nagpure, S.; Wood, D.L., III. The state of understanding of the lithium-ion-battery graphite solid electrolyte interphase (SEI) and its relationship to formation cycling. Carbon 2016, 105, 52–76. [Google Scholar] [CrossRef] [Green Version]
  7. Liu, W.; Delacourt, C.; Forgez, C.; Pelissier, S. Study of graphite/NCA Li-ion cell degradation during accelerated aging tests—Data analysis of the SIMSTOCK project. In Proceedings of the 2011 IEEE Vehicle Power and Propulsion Conference, Chicago, IL, USA, 6–9 September 2011. [Google Scholar] [CrossRef]
  8. Schaltz, E.; Stroe, D.I.; Nørregaard, K.; Ingvardsen, L.S.; Christensen, A. Incremental capacity analysis applied on electric vehicles for battery state-of-health estimation. IEEE Trans. Ind. Appl. 2021, 57, 1810–1817. [Google Scholar] [CrossRef]
  9. Keil, P.; Jossen, A. Calendar aging of NCA lithium-ion batteries investigated by differential voltage analysis and coulomb tracking. J. Electrochem. Soc. 2016, 164, A6066. [Google Scholar] [CrossRef]
  10. Waag, W.; Käbitz, S.; Sauer, D.U. Experimental investigation of the lithium-ion battery impedance characteristic at various conditions and aging states and its influence on the application. Appl. Energy 2013, 102, 885–897. [Google Scholar] [CrossRef]
  11. Qi, Y.; Jang, T.; Ramadesigan, V.; Schwartz, D.T.; Subramanian, V.R. Is there a benefit in employing graded electrodes for lithium-ion batteries? J. Electrochem. Soc. 2017, 164, A3196. [Google Scholar] [CrossRef] [Green Version]
  12. Hosseinzadeh, E.; Marco, J.; Jennings, P. The impact of multi-layered porosity distribution on the performance of a lithium ion battery. Appl. Math. Model. 2018, 61, 107–123. [Google Scholar] [CrossRef]
  13. Liu, L.; Guan, P.; Liu, C. Experimental and simulation investigations of porosity graded cathodes in mitigating battery degradation of high voltage lithium-ion batteries. J. Electrochem. Soc. 2017, 164, A3163. [Google Scholar] [CrossRef]
  14. Diehm, R.; Kumberg, J.; Dörrer, C.; Müller, M.; Bauer, W.; Scharfer, P.; Schabel, W. In Situ Investigations of Simultaneous Two-Layer Slot Die Coating of Component-Graded Anodes for Improved High-Energy Li-Ion Batteries. Energy Technol. 2020, 8, 1901251. [Google Scholar] [CrossRef]
  15. Wood, M.; Li, J.; Du, Z.; Daniel, C.; Dunlop, A.R.; Polzin, B.J.; Jansen, A.N.; Krumdick, G.K.; Wood Iii, D.L. Impact of secondary particle size and two-layer architectures on the high-rate performance of thick electrodes in lithium-ion battery pouch cells. J. Power Sources 2021, 515, 230429. [Google Scholar] [CrossRef]
  16. Huang, C.; Young, N.P.; Zhang, J.; Snaith, H.J.; Grant, P.S. A two layer electrode structure for improved Li Ion diffusion and volumetric capacity in Li Ion batteries. Nano Energy 2017, 31, 377–385. [Google Scholar] [CrossRef]
  17. Müller, D.; Landa-Medrano, I.; Eguia-Barrio, A.; Boyano, I.; Urdampilleta, I.; de Meatza, I.; Fill, A.; Birke, P. Electrochemical characterization of bi-layered graphite anodes combining high and low porosity in lithium-ion cells to improve cell performance. Electrochim. Acta 2021, 391, 138966. [Google Scholar] [CrossRef]
  18. Keil, P. Aging of Lithium-Ion Batteries in Electric Vehicles. Ph.D. Thesis, Technische Universität München, Munich, Germany, 2017. [Google Scholar]
  19. Landa-Medrano, I.; Eguia-Barrio, A.; Sananes-Israel, S.; Lijó-Pando, S.; Boyano, I.; Alcaide, F.; Urdampilleta, I.; de Meatza, I. In Situ Analysis of NMC graphite Li-Ion Batteries by Means of Complementary Electrochemical Methods. J. Electrochem. Soc. 2020, 167, 090528. [Google Scholar] [CrossRef]
  20. Jung, R.; Metzger, M.; Maglia, F.; Stinner, C.; Gasteiger, H.A. Oxygen Evolution and Its Effect on the Cycling Stability of LiNixMnyCozO2 (NMC) Cathode Materials for Li-Ion Batteries; ECS Meeting Abstracts: New Orleans, LA, USA, 2017; Volume MA2017-01. [Google Scholar]
  21. Keil, P.; Schuster, S.F.; Wilhelm, J.; Travi, J.; Hauser, A.; Karl, R.C.; Jossen, A. Calendar aging of lithium-ion batteries. J. Electrochem. Soc. 2016, 163, A1872. [Google Scholar] [CrossRef]
  22. Schindler, M.; Sturm, J.; Ludwig, S.; Schmitt, J.; Jossen, A. Evolution of initial cell-to-cell variations during a three-year production cycle. eTransportation 2021, 8, 100102. [Google Scholar] [CrossRef]
  23. Pastor-Fernández, C.; Widanage, W.D.; Marco, J.; Gama-Valdez, M.Á.; Chouchelamane, G.H. Identification and quantification of ageing mechanisms in Lithium-ion batteries using the EIS technique. In Proceedings of the 2016 IEEE Transportation Electrification Conference and Expo (ITEC), Dearborn, MI, USA, 27–29 June 2016. [Google Scholar]
  24. Berecibar, M.; Dubarry, M.; Omar, N.; Villarreal, I.; Van Mierlo, J. Degradation mechanism detection for NMC batteries based on Incremental Capacity curves. World Electr. Veh. J. 2016, 8, 350–361. [Google Scholar] [CrossRef] [Green Version]
  25. Dubarry, M.; Truchot, C.; Liaw, B.Y. Synthesize battery degradation modes via a diagnostic and prognostic model. J. Power Sources 2012, 219, 204–216. [Google Scholar] [CrossRef]
  26. Li, Y.; Abdel-Monem, M.; Gopalakrishnan, R.; Berecibar, M.; Nanini-Maury, E.; Omar, N.; van den Bossche, P.; Van Mierlo, J. A quick on-line state of health estimation method for Li-ion battery with incremental capacity curves processed by Gaussian filter. J. Power Sources 2018, 373, 40–53. [Google Scholar] [CrossRef]
Figure 1. State of health S o H C of all cells tested. Mean value ± standard deviation averaged over the different cycling conditions, for each cell type (DL and SL).
Batteries 08 00022 g001
Figure 2. Spectra of the first (BoL) electrochemical impedance measurement displayed in Nyquist plot and separated by (a) DL and (b) SL. Cells at T = 25 °C are plotted in blue, while cells at T = 40 °C are plotted in red.
Batteries 08 00022 g002
Figure 3. Incremental capacity dQ/dU and differential voltage dU/dQ plots for the available cells. (a) dQ/dU for DL cells, (b) dQ/dU for SL cells, (c) dU/dQ for DL cells and (d) dU/dQ for SL cells. A/1, B/2 and C/3 highlight differences of interesting features.
Batteries 08 00022 g003
Figure 4. DVA dU/dQ of four selected cells which show the differences more clearly. Two cells each for DL, SL, C/2, 1C, 25 °C and 40 °C.
Batteries 08 00022 g004
Figure 5. Voltage response of the cells—(a) DL cells and (b) SL cells—to subsequent increasing current pulses 1C, 2C, 3C, 4C and 5C alternating between charge and discharge direction. (c) Calculated resistance R 0 s for 2C, 3C, 4C and 5C pulses in charge direction.
Batteries 08 00022 g005
Figure 6. State of Health S o C C (smoothed) of four cell pairs at different cycling conditions—C-rate and temperature. (a) CID 4/14, (b) CID 5/15, (c) CID 6/16 and (d) CID 8/18+19.
Batteries 08 00022 g006
Figure 7. Impedance spectra of the remaining cell pairs after certain amount of cycles. The numbers in the legends are the number of the EIS measurement. There are 25 ageing cycles between each EIS. Top row (a) CID 4/(b) CID 14, middle row (c) CID 5/(d) CID 15 and bottom row (e) CID 8/(f) CID 18.
Batteries 08 00022 g007
Figure 8. ICA of the cells after certain amount of cycles. Top row (a) CID 4/(b) CID 14, middle row (c) CID 5/(d) CID 15 and bottom row (e) CID 8/(f) CID 18. Legend represents the number of the check-up procedure. There are 25 cycles between each one.
Batteries 08 00022 g008
Figure 9. DVA of the cells after certain amount of cycles. Top row (a) CID 4/(b) CID 14, middle row (c) CID 5/(d) CID 15 and bottom row (e) CID 8/(f) CID 18. Legend represents the number of the check-up procedure. There are 25 cycles between each one.
Batteries 08 00022 g009
Figure 10. Comparison of the discharge capacity Q dis during cycling with the C/20 charge capacity Q C / 20 during check-up. (a) CID 4/14 and (b) CID 8/18.
Batteries 08 00022 g010
Table 1. Measurement procedure with check-ups for cells CID 4/5/6/8/14/15/16/18/19.
LoopStepParameterExitNote
CC/CV Ch. I cyc E max = 4.2 V/ I min = 90 mA/ t max = 2.5  hinitial three cycles
CC Disch. I cyc E min = 2.8 V
Start-1 Start check-up
CC Ch.450 mA E max = 4.2 V/ t max = 30  min
CC/CV Disch.450 mA E min = 2.8 V/ I min = 45 mA/ t max = 3  hDisch. before C/20
Pause
t = 1  h
C/20 CC Ch.45 mA E max = 4.2 Vfor ICA and DVA. Q C / 20
CC Disch.450 mA Q C / 20 /2Discharge to S o C = 50 %
Pause
t = 2  h
EIS f = 10 mHz– 10 kHz I EIS = 90 mA
Start-2 I p = {1, 2, 3, 4, 5} C
Pause
0.5 h
CC Pulse
I p E max = 4.2 V/ t max = 15  s
Pause
0.5 h
DC Pulse
I p E min = 2.8 V/ t max = 15  s
End-2 End check-up
Start-3 25 times Cyclic ageing
CC/CV Ch. I cyc E max = 4.2 V/ I min = 90 mA/ t max = 2.5  h
CC Disch. I cyc E min = 2.8 V
End-3
End-1
Table 2. List of all cells tested, including the charge- and discharge current, operating temperature and which electrochemical tests were performed at which intervals.
Cell Pair (Cell ID)Cycling (CC/CV-CC)at TEISC/20 ChargePulse Test
1/11300 mA–300 mA25 °C---
2/12500 mA–500 mA25 °C---
3/13800 mA–500 mA25 °C---
4/14450 mA–450 mA25 °C25 cyc25 cyc25 cyc
5/15900 mA–900 mA25 °C25 cyc25 cyc25 cyc
6/16450 mA–450 mA40 °C25 cyc25 cyc25 cyc
7/17----
8/18900 mA–900 mA40 °C25 cyc25 cyc25 cyc
9/-----
-/19900 mA–900 mA40 °C25 cyc25 cyc25 cyc
10/20300 mA–300 mA25 °C 10 cyc--
Table 3. Relative change of inner resistance Δ R 0 after n cycles, for CID 8/18 Δ Z real , 10 kHz is shown instead. The number of cycles n differs for the cell pairs—CID 4/14 ( x = 75 , y = 150 , z = 225 ) while CID 5/15 and CID 8/18 ( x = 50 , y = 100 , z = 150 ).
n Δ R 0 CID 4 Δ R 0 CID 14 Δ R 0 CID 5 Δ R 0 CID 15 Δ Z 0 CID 8 Δ Z 0 CID 18
x + 47 % + 62 % + 5 % + 23 % + 16 % + 80 %
y + 58 % + 98 % + 10 % + 62 % + 33 % + 137 %
z + 60 % + 130 % + 15 % + 184 % + 48 % + 203 %
Table 4. Values of fitted parameters R 1 and R 2 averaged over DL (CID 4/5) and SL cells (CID 14/15) for the second, third and fourth EIS.
DL CID 4/5SL CID 14/15
Measurement R 1 / m Ω R 2 / m Ω R 1 / m Ω R 2 / m Ω
II26202834
III22292947
IV19364063
Table 5. Relative change of Q a , Q b and Q c , as indicators for loss of anode active material, a shift in electrode balancing (loss of cyclable lithium) and loss of cathode active material respectively, between the cycle 3 and 153. The dominant mode is highlighted for each cell.
CID 4CID 14CID 5CID 15CID 8CID 18
Δ Q a /%0−2−4−16−4−24
Δ Q b /%−9−21−7−29−12 −30
Δ Q c /%000−14−20−25
Δ Q tot /%−3−9−5−21−7−26
Publisher’s Note: MDPI stays neutral with regard to jurisdictional claims in published maps and institutional affiliations.

