Article

Auger- and X-ray Photoelectron Spectroscopy at Metallic Li Material: Chemical Shifts Related to Sample Preparation, Gas Atmosphere, and Ion and Electron Beam Effects

Leibniz Institute for Solid State and Materials Research (IFW) Dresden, Institute for Complex Materials, Helmholtzstr. 20, 01069 Dresden, Germany
Batteries 2022, 8(3), 24; https://doi.org/10.3390/batteries8030024
Submission received: 13 October 2021 / Revised: 25 January 2022 / Accepted: 7 March 2022 / Published: 15 March 2022

Abstract

:
Li-based batteries are a key element in reaching a sustainable energy economy in the near future. The understanding of the very complex electrochemical processes is necessary for the optimization of their performance. X-ray photoelectron spectroscopy (XPS) is an accepted method used to improve understanding around the chemical processes at the electrode surfaces. Nevertheless, its application is limited because the surfaces under investigation are mostly rough and inhomogeneous. Local elemental analysis, such as Auger electron spectroscopy (AES), could assist XPS to gain more insight into the chemical processes at the surfaces. In this paper, some challenges in using electron spectroscopy are discussed, such as binding energy (BE) referencing for the quantitative study of chemical shifts, gas atmospheric influences, or beam damage (including both AE and XP spectroscopy). Carefully prepared and surface-modified metallic lithium material is used as model surface, considering that Li is the key element for most battery applications.

1. Introduction and Motivation

Lithium-ion batteries are, meanwhile, an indispensable element used for both portable electronics and for automotive and storage application in order to make energy harvesting more and more renewable. Although already in routine application, improvements for an enhanced performance are still important. This alludes to both the optimization of well-known battery chemistry and also the search for new working principles. Furthermore, the electrical characterization of the cycling performance, especially the understanding of the complex cell chemistry, is unavoidable. Among others, electron spectroscopic methods are an inherent part for these efforts.
For a long time, X-ray photoelectron spectroscopy (XPS) is a standard in this field. The main advantage of XPS is the possibility of studying chemical species at the electrode surfaces which can be easily applied at the often electrically poor conducting materials. Thus, over the decades, thousands of papers were published, including also some review articles with special view to XPS analysis [1,2,3,4]. Whereas XPS works well at laterally homogeneous samples, due to the lack of lateral resolution for the mostly rough, porous, and multicomponent sample surfaces of real battery materials, XPS delivers only integrated information.
However, often local phenomena at the complex interfaces between the electrodes and the electrolyte (solid electrolyte interphase = SEI) are of interest and local analysis is welcome. Because of the use of focused electron beams for excitation, Auger electron spectroscopy (AES) is one potential method to fulfill these demands. Nevertheless, AES in the Li battery field has been mainly used to investigate solid-state batteries [5,6,7], which include an ionic liquid as electrolyte and combine with XPS. Rarely applications are found for SEI investigation on both anodes [8] or cathodes [9,10] at particle-based materials. Often the AES technique was only used to demonstrate element depth distributions with sputter depth profiling [8,11,12,13].
Despite the knowledge of the danger of e-beam damage [14,15], especially for oxides (and particularly for alkaline elements), it currently plays no important role in the Li battery community [16] in low-energy scanning-electron microscopy. Recent work with cryo-techniques applied in situ [17,18,19] discuss the possibilities of minimizing heat and beam damage, similar to the case of the sensitive Li battery materials. Furthermore, the use of other metals as anode material (Na, Zn, Al, Mg, see e.g., [20,21,22,23]) is of growing interest, which also leads to the need for reliable surface analysis in these cases.
Our motivation for the actual work is based on two aspects. On the one side, a clear strategy for the referencing of the binding energy (BE) scale is necessary, since commonly observed charging phenomena influences the serious identification of chemical states from XPS measurements. This is commonly performed using the carbonaceous contamination which is always present on real-world samples; a reference value in the range of 284.5–285 eV is widely accepted. However, several groups reported [24,25,26,27] that, depending on the chemical nature of the element Li in the surface region, the results of the carbon reference can vary up to 3 eV. Our own studies suggest that characteristic shifts occur when non-conducting species come into contact with elemental Li or lithiated graphite. These shifts are not caused simply by charging effects; however, they must be connected with a kind of potential barrier between Li and the thin overlayers.
On the other side, beam damage effects during electron spectroscopic investigations may occur. This can be caused by both ion beams used for surface cleaning or element depth profiling and by high-energetic electron beams, especially in the case of AES measurements. Up to now, Ar+ sputtering is used in combination with XPS for Li carbonate (on Li foil) and lithiated graphite (HOPG) [24]. The carbonate on Li foil is then decomposed to Li oxide and then partly to Li metal. Li in the lithiated graphite shows strong surface enrichment after Ar+ bombardment, which obviously is connected with the disordering of the graphite layer structure and an out-diffusion of Li [28,29]. The behavior of the reference elements (carbonaceous contamination, Au deposit, and Ar implant) depends on the concentration and chemical state of lithium in the surface near region [24]. The first investigations of e-beam effects were performed during AES measurements at Li carbonate covered with Li foils. Similar to ion bombardment, carbonate is reduced to Li oxide and Li metal [30]. With the help of Auger mapping, lateral diffusion could also be detected [28].
In summary, the following main conclusions can followed up in light of previous work.
  • Thin electrical non-conducting deposits (oxides, fluorides, carbonates, and implanted Ar) on surfaces with a high amount of elemental Li (e.g., Li foil, highly lithiated graphite, LiAl/LiAlZn anode material) showed characteristic XP peaks which shifted by around 3 eV to higher BE, irrespective of simple charging [24,31];
  • Differently from conducting deposits (e.g., Au, Cu, adventitious carbon) which show the “normal” BE positions, artificial carbon (graphite powder) is not clearly well defined at Li-metal containing surfaces;
  • The amount of the effect depends on the concentration of elemental Li at the surface. Thus, the BE positions of the components of similar SEI layers at lithiated and delithiated graphite also completely differ in their BE position [24,32];
  • This effect is caused by a potential barrier, also observed for other alkaline metals (Na). The use of the position of adventitious carbon C1s peak at around 285 eV leads to misinterpretation in these cases [24,25];
  • Typical Li metal foil used for model experiments of battery research is mainly covered with Li carbonate [24,28]. Sputter cleaning or sputter depth profiling with Ar+ ions leads to the decomposition of the carbonate to Li oxide and further to Li metal [24];
  • Electron bombardment (AES) of Li carbonate (on Li foil) also leads to the decomposition of the carbonate to Li oxide. This effect has a critical dose. In the presence of adventitious carbon contamination, even metallic Li can be produced [28,30]. With only X-ray excitation (XPS), no significant damage can be observed at this point;
  • Ar+ bombardement (depth profiling) of graphite that is not fully lithiated (HOPG) leads to the enrichment of Li at the surface. A partly carbide formation is assumed. After the measurements are electron-induced (AE spectra or mapping), out-diffusion (lateral and in-depth) of the Li from the measurement region is observed [28,29].
In the present paper, we try to underline some of these findings with specific experimental procedures.
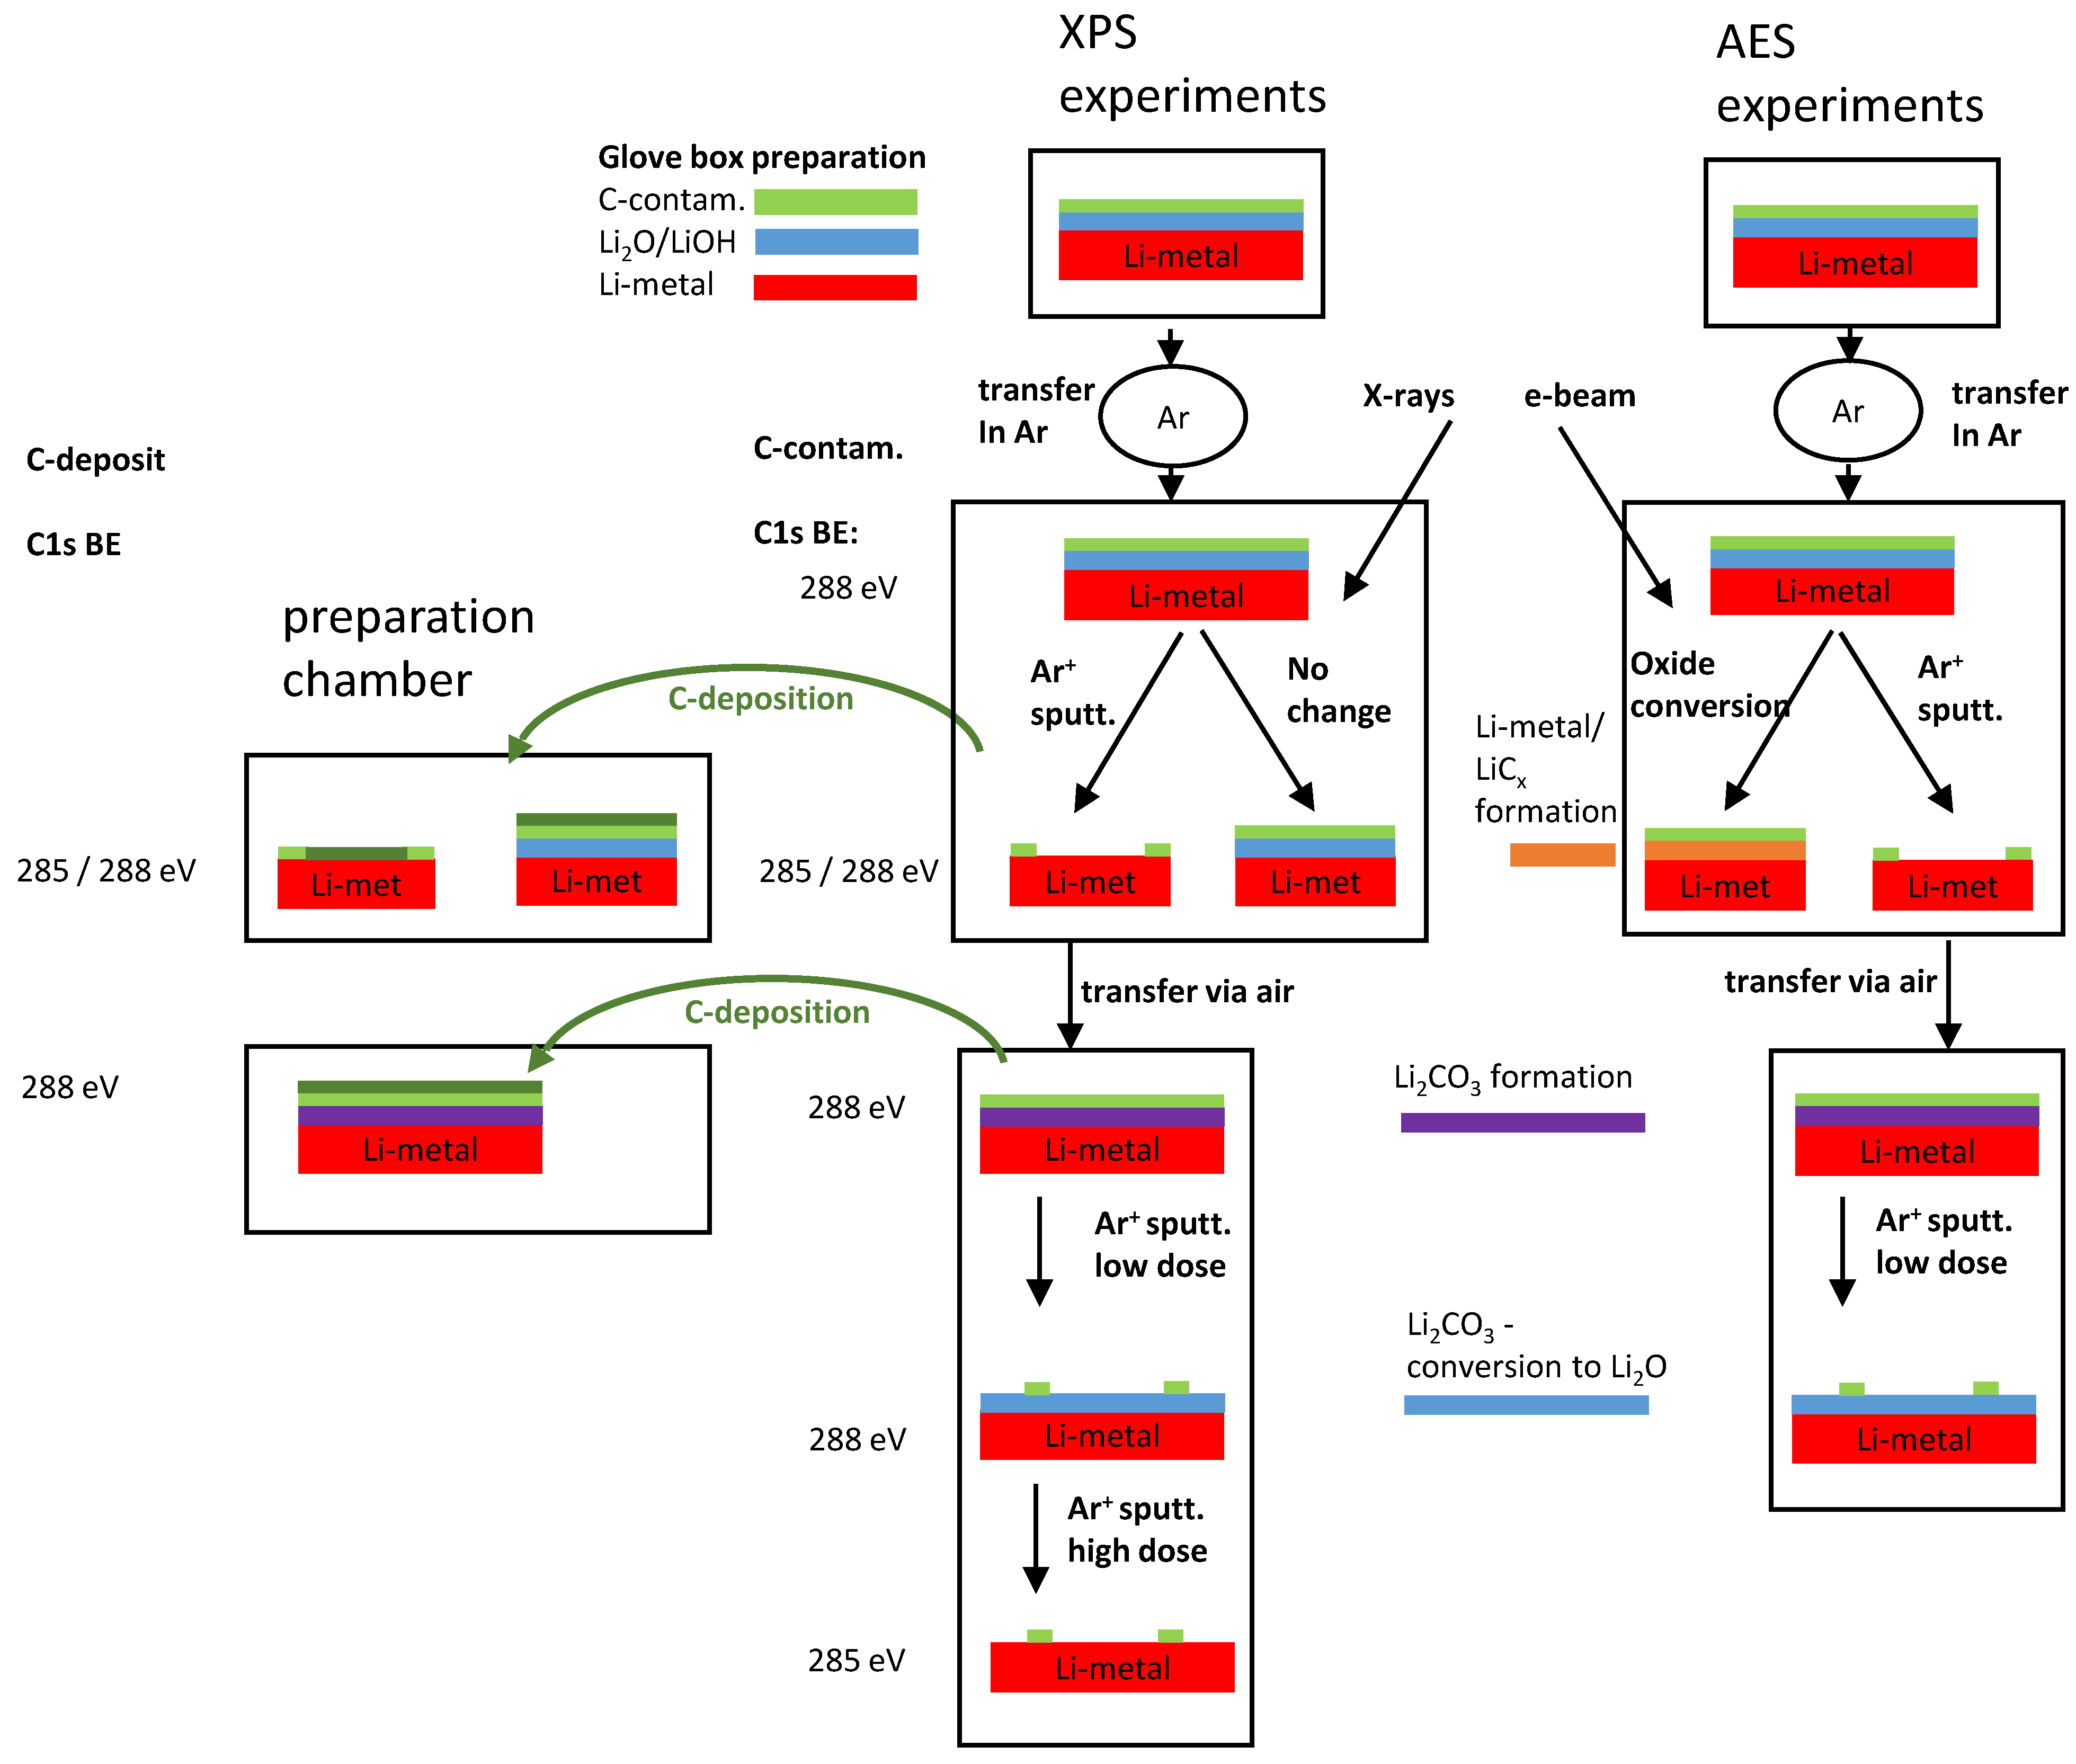
  • Preparation of well-defined sample states comparable for both XP and AE analysis: We decided to use metallic Li as an experimental basis because it is the natural “key element” for materials used in all kinds of Li batteries. Because the previously used commercial Li foil was often contaminated with different species (mostly carbonate, partly oxy-fluorides, phosphates), we used Li massive material freshly cut in the glove box. Afterwards, the analysis chambers are transferred using an Ar filled transfer chamber. Careful analysis of the states is then performed, depending on vacuum and storage conditions. Metallic Li surfaces are then prepared with Ar+ sputtering, pure carbonate is formed with short exposition to air, and both XPS and AES are investigated at similar sample states.
  • Introducing of new “internal standards” for BE referencing: Referencing carbon contamination is still the most common method. Because the first experiments with graphite powder as an artificial standard did not turn out to be unequivocal, we then tried to use (quasi) in situ thin film carbon deposition in preparation chambers coupled with the XPS apparatus. We used two different deposition methods: magnetron sputtering from a graphite target (only fine vacuum conditions) and thermal deposition of C60 (ultra-high vacuum conditions). Differently prepared surface states were considered for the C deposition experiments.
  • Classification of e-beam and ion beam damage and its consequence for XP and AE analysis: In general, the damage by electron or ion radiation is well known, especially for oxide-type materials. Otherwise, such beams are commonly used for the excitation of analytical signals or for sample cleaning or element depth profiling. For the alkaline elements (as lithium), a high mobility is to be expected, even in the presence of near-surface electrical fields. Consequences for changes in the chemical states and the energy referencing are discussed for both XPS and AES, and area dependencies are also considered.

2. Experiments

Samples were prepared in a glove box (LabMaster SP, MBRAUN, Garching, Germany) in a monitored Ar atmosphere (O2 < 0.1 ppm, H2O < 1 ppm). To avoid any contact of the samples with air and moisture, Ar-filled transfer chambers [28,33] were used to transfer the sample between the glove box and the spectrometer chambers.
The Li samples were cut from a 12.7 mm-diameter metal rod (Alpha Aeasar, 99.9% pureness, product no.: 10733, lot no.: I21Y027, Thermo Fisher, Waltham, MA, USA) with a cleaned ceramic scalpel, fixed on the sample holders and scraped finally with a scalpel to make the surface as clean as possible.
The electron spectroscopic investigations were carried out in two separate commercial systems: a PHI-5600 CI XP spectrometer (Physical Electronics, ULVAC-PHI, Osaka, Japan) spectrometer and a JAMP 9500 F (JEOL, Tokyo, Japan) scanning Auger system. Typical base pressures of the systems are 2 × 10⁻⁸ Pa and 5 × 10⁻⁷ Pa, respectively. More information on the equipment, including schemata, can be found in [28,34].
The PHI system is equipped with a hemispherical analyzer operated at a typical pass energy of 29 eV and a diameter analysis area of 800 µm. Monochromatic Al-Kα excitation (350 W) was used. Sputter cleaning was performed using Ar+ ions at 3.5 keV and an erosion rate of around 3 nm/min was standardized to SiO2.
The JEOL system was run with a field emission source (typical parameters include: 10 keV, 10 nA, 100 nm beam diameter). The analyzer was also of a hemispherical type, however, without a focusing entrance lens. This resulted in a large acceptance area for the analyzed electrons. For XP analysis, the system was equipped with an X-ray source (SPECS 18/30, Mg-Kα, 300 W, SPECS, Berlin, Germany). To minimize the measuring area, the source was furnished with a conical collimator head (Cu, 1 mm end-hole), leading to an approx. 2 mm-diameter X-ray spot on the samples. The analyzer was operated in a fixed retarding ratio (FRR) mode (0.32%) for both AE and FAT (fixed analyzer transmission) modes (pass energy 50 eV) for XP analysis. Sputter cleaning was carried out with Ar+ ions (2 keV, 18 nm/min at 1 mm × 1 mm).
The BE scale of both the spectrometers was calibrated using Au4f7/2 at 84.0 eV, and Cu2p3/2 at 932.7 eV were used as reference energies.
Data treatment for both XPS and AES spectra was performed with the PHI-MULTIPAK software (ULVAC-PHI, Osaka, Japan) [35], whereby sensitivity factors for the PHI analysis systems were implemented (XPS for a PHI 5600-type hemispherical analyzer, AES for a PHI 25-130-type cylindrical mirror analyzer). Because a different electron analyzer was used in the JEOL system, calculated concentrations could vary systematically.
Two self-built UHV preparation chambers, with a magnetic sample transfer and pumping systems with turbomolecular pumps, were directly coupled to the PHI 5600 system. In one of these chambers (base pressures of around 3 × 10⁻⁶ Pa), an RF magnetron sputter source (2 inch target) can be used for thin film preparation [34]. For the actual experiments, a graphite target was used, as well as the following experimental parameters: gas Ar—10 sccm, chamber pressure during deposition—1 Pa, and power—50 W.
The second chamber (base pressures of around 1 × 10⁻⁷ Pa) was equipped with thermal evaporators, and C60 was used as an evaporating material. Experimental parameters were as follows: temperature—430 °C and chamber pressure during evaporation—7 × 10⁻⁶ Pa.

3. Results and Discussion

As an introductory remark, it should be mentioned that surface charging effects could never be observed in all presented measurements, which was often suspected from reviewers of our previous papers. This was regularly proven by taking comparative XP measurements with and without a low-energy electron flood gun or by changing between monochromatic and non-monochromatic X-ray sources.
This means that all the observed abnormal peak shifts (indicated by shifted C1s peaks from the C contamination species) are related to real surface phenomena caused by the above-mentioned potential gradients at the Li-containing surfaces.
All the shown XP spectra (if not explicitly mentioned) are normalized with respect to intensity and shifted as “waterfall-plots” to allow an easier comparison of peak shift or peak shape changes. Thus, the peak intensities do not represent intensity changes during sample treatments. To make the comparison between the plots easier, all the BE scales of the shown electron peaks are identical. The AE spectra are presented as usual with the kinetic energy (KE) scale and most have differentiated curves, which automatically implies a kind of “background suppression” and allows an easy comparison of peak shape changes as well. Unless the valence band is involved in the emission process for the light elements, the Auger transition is named “KLL”, similar to “KVV”.
The sample denominations are highlighted in the text in bold italics; in the figures, they are given as insets on the right and assigned in appropriate color.

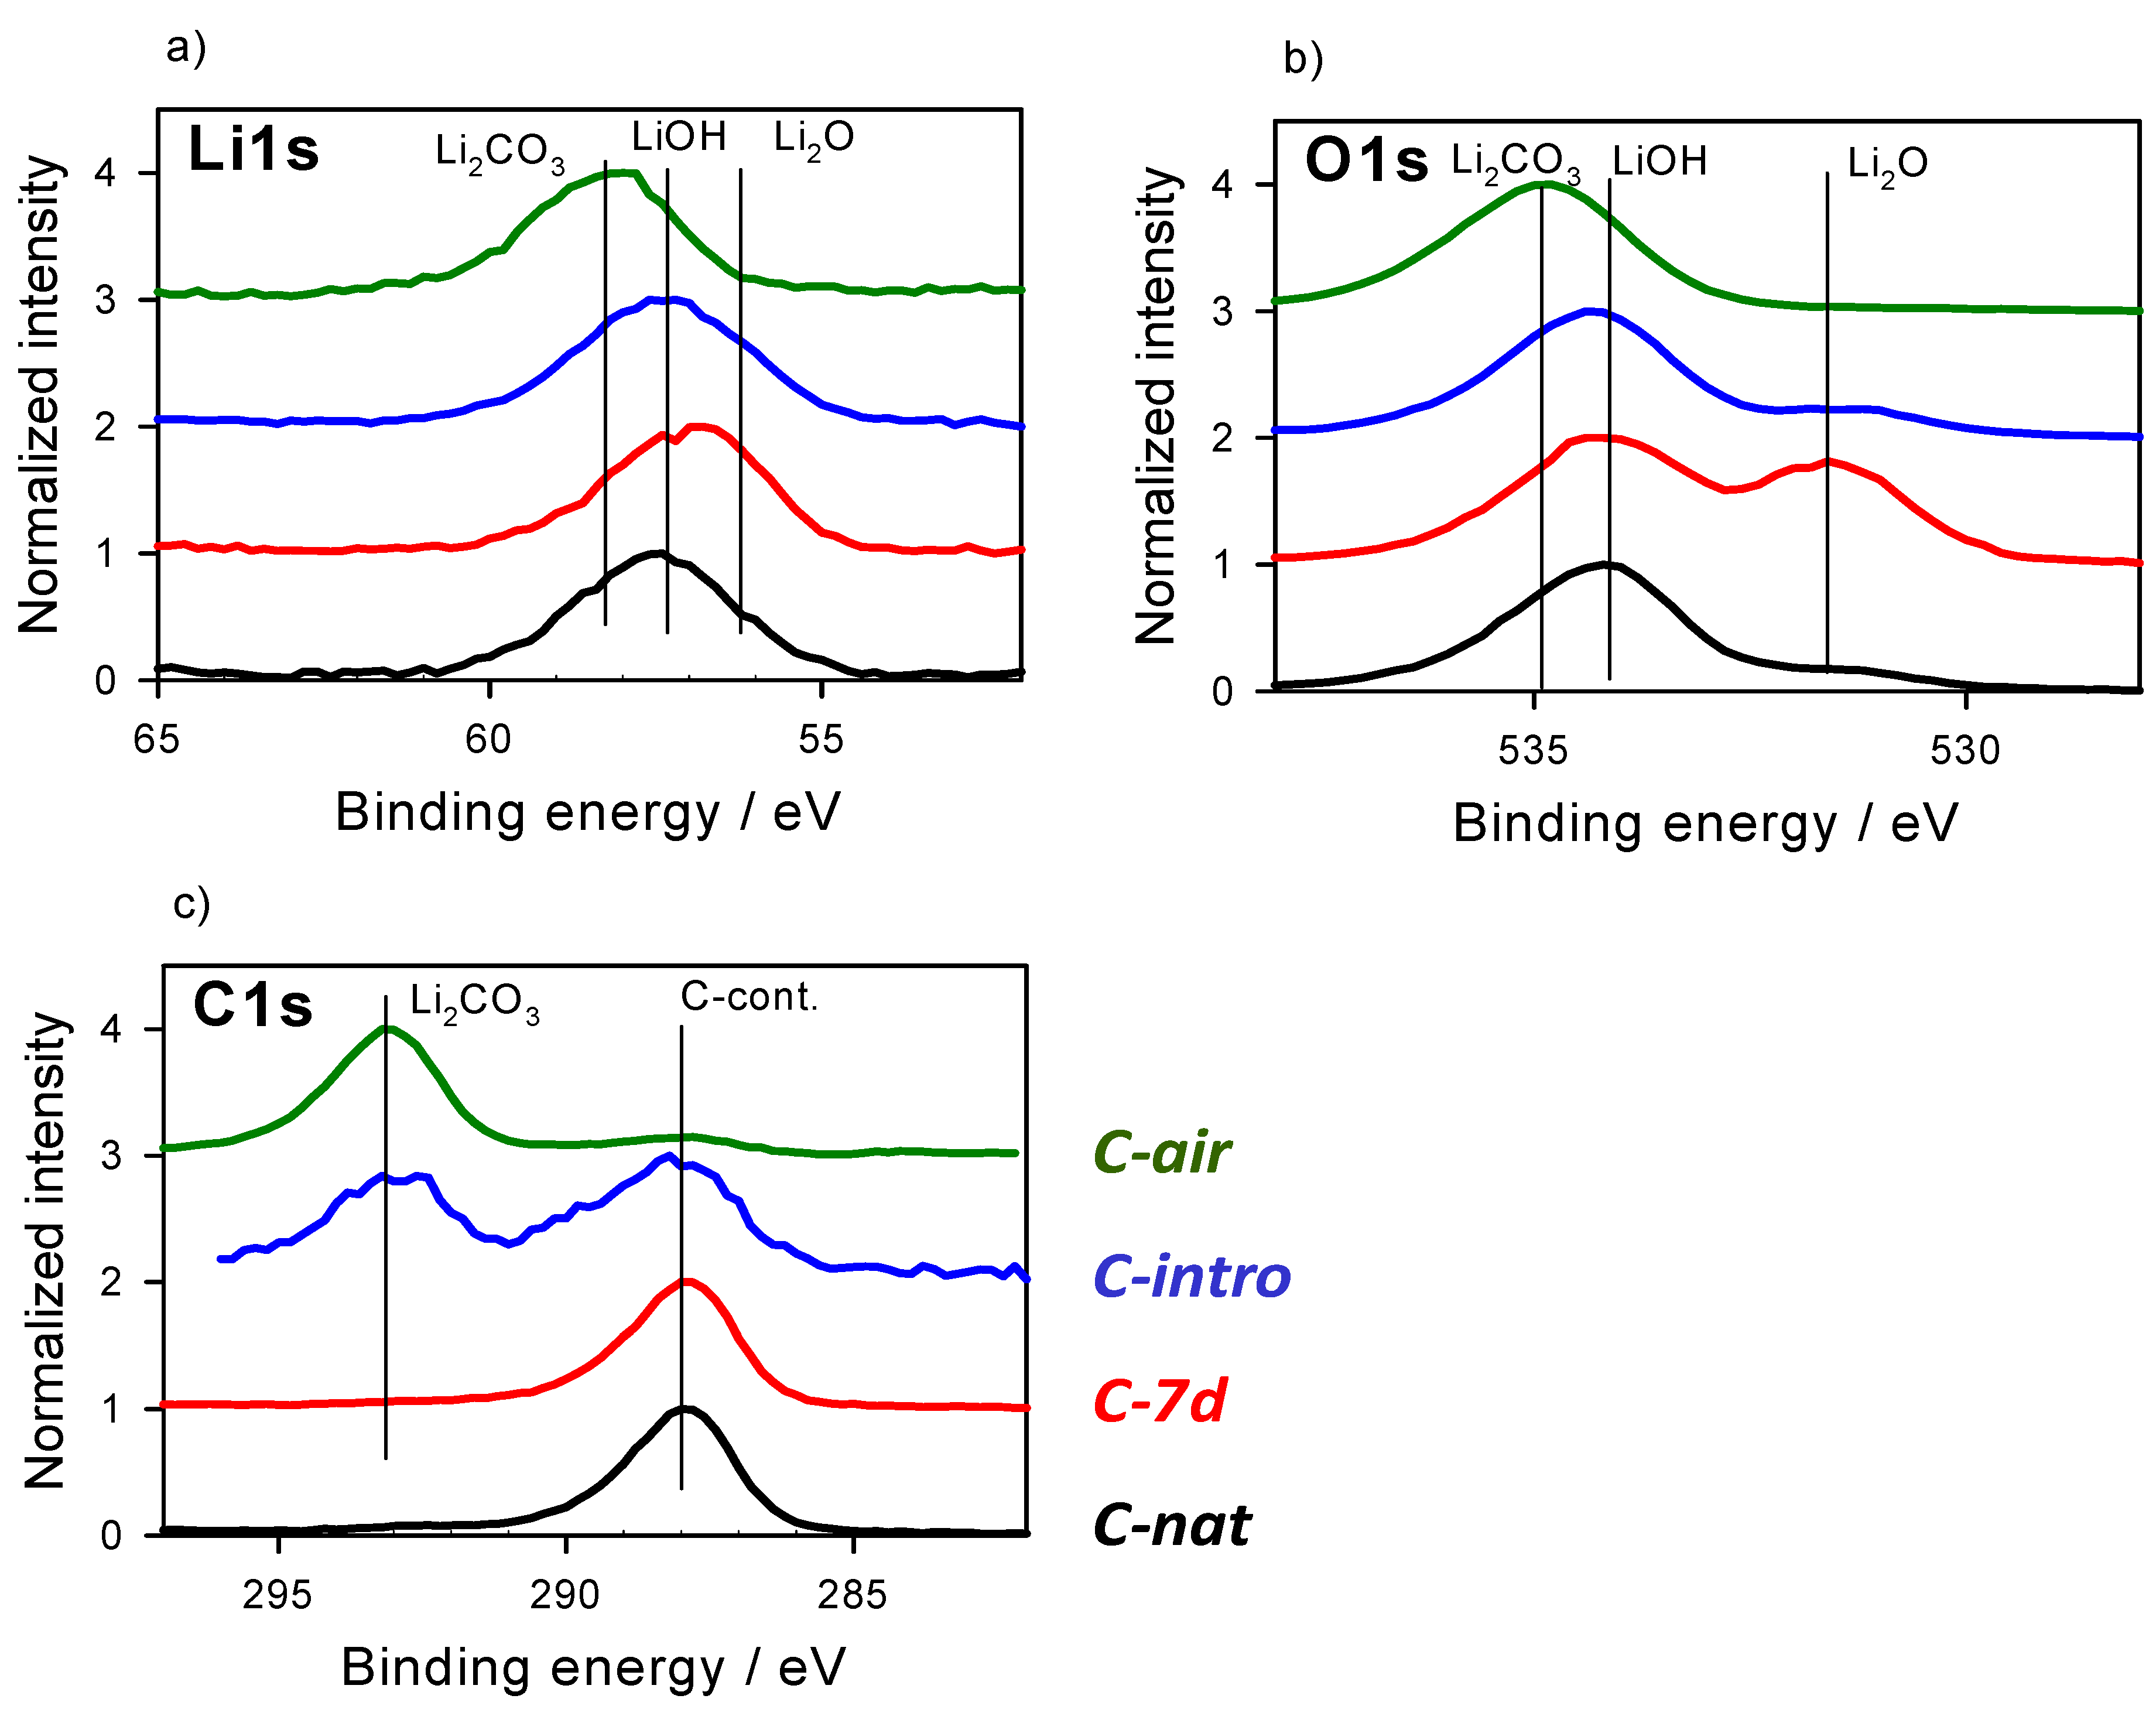
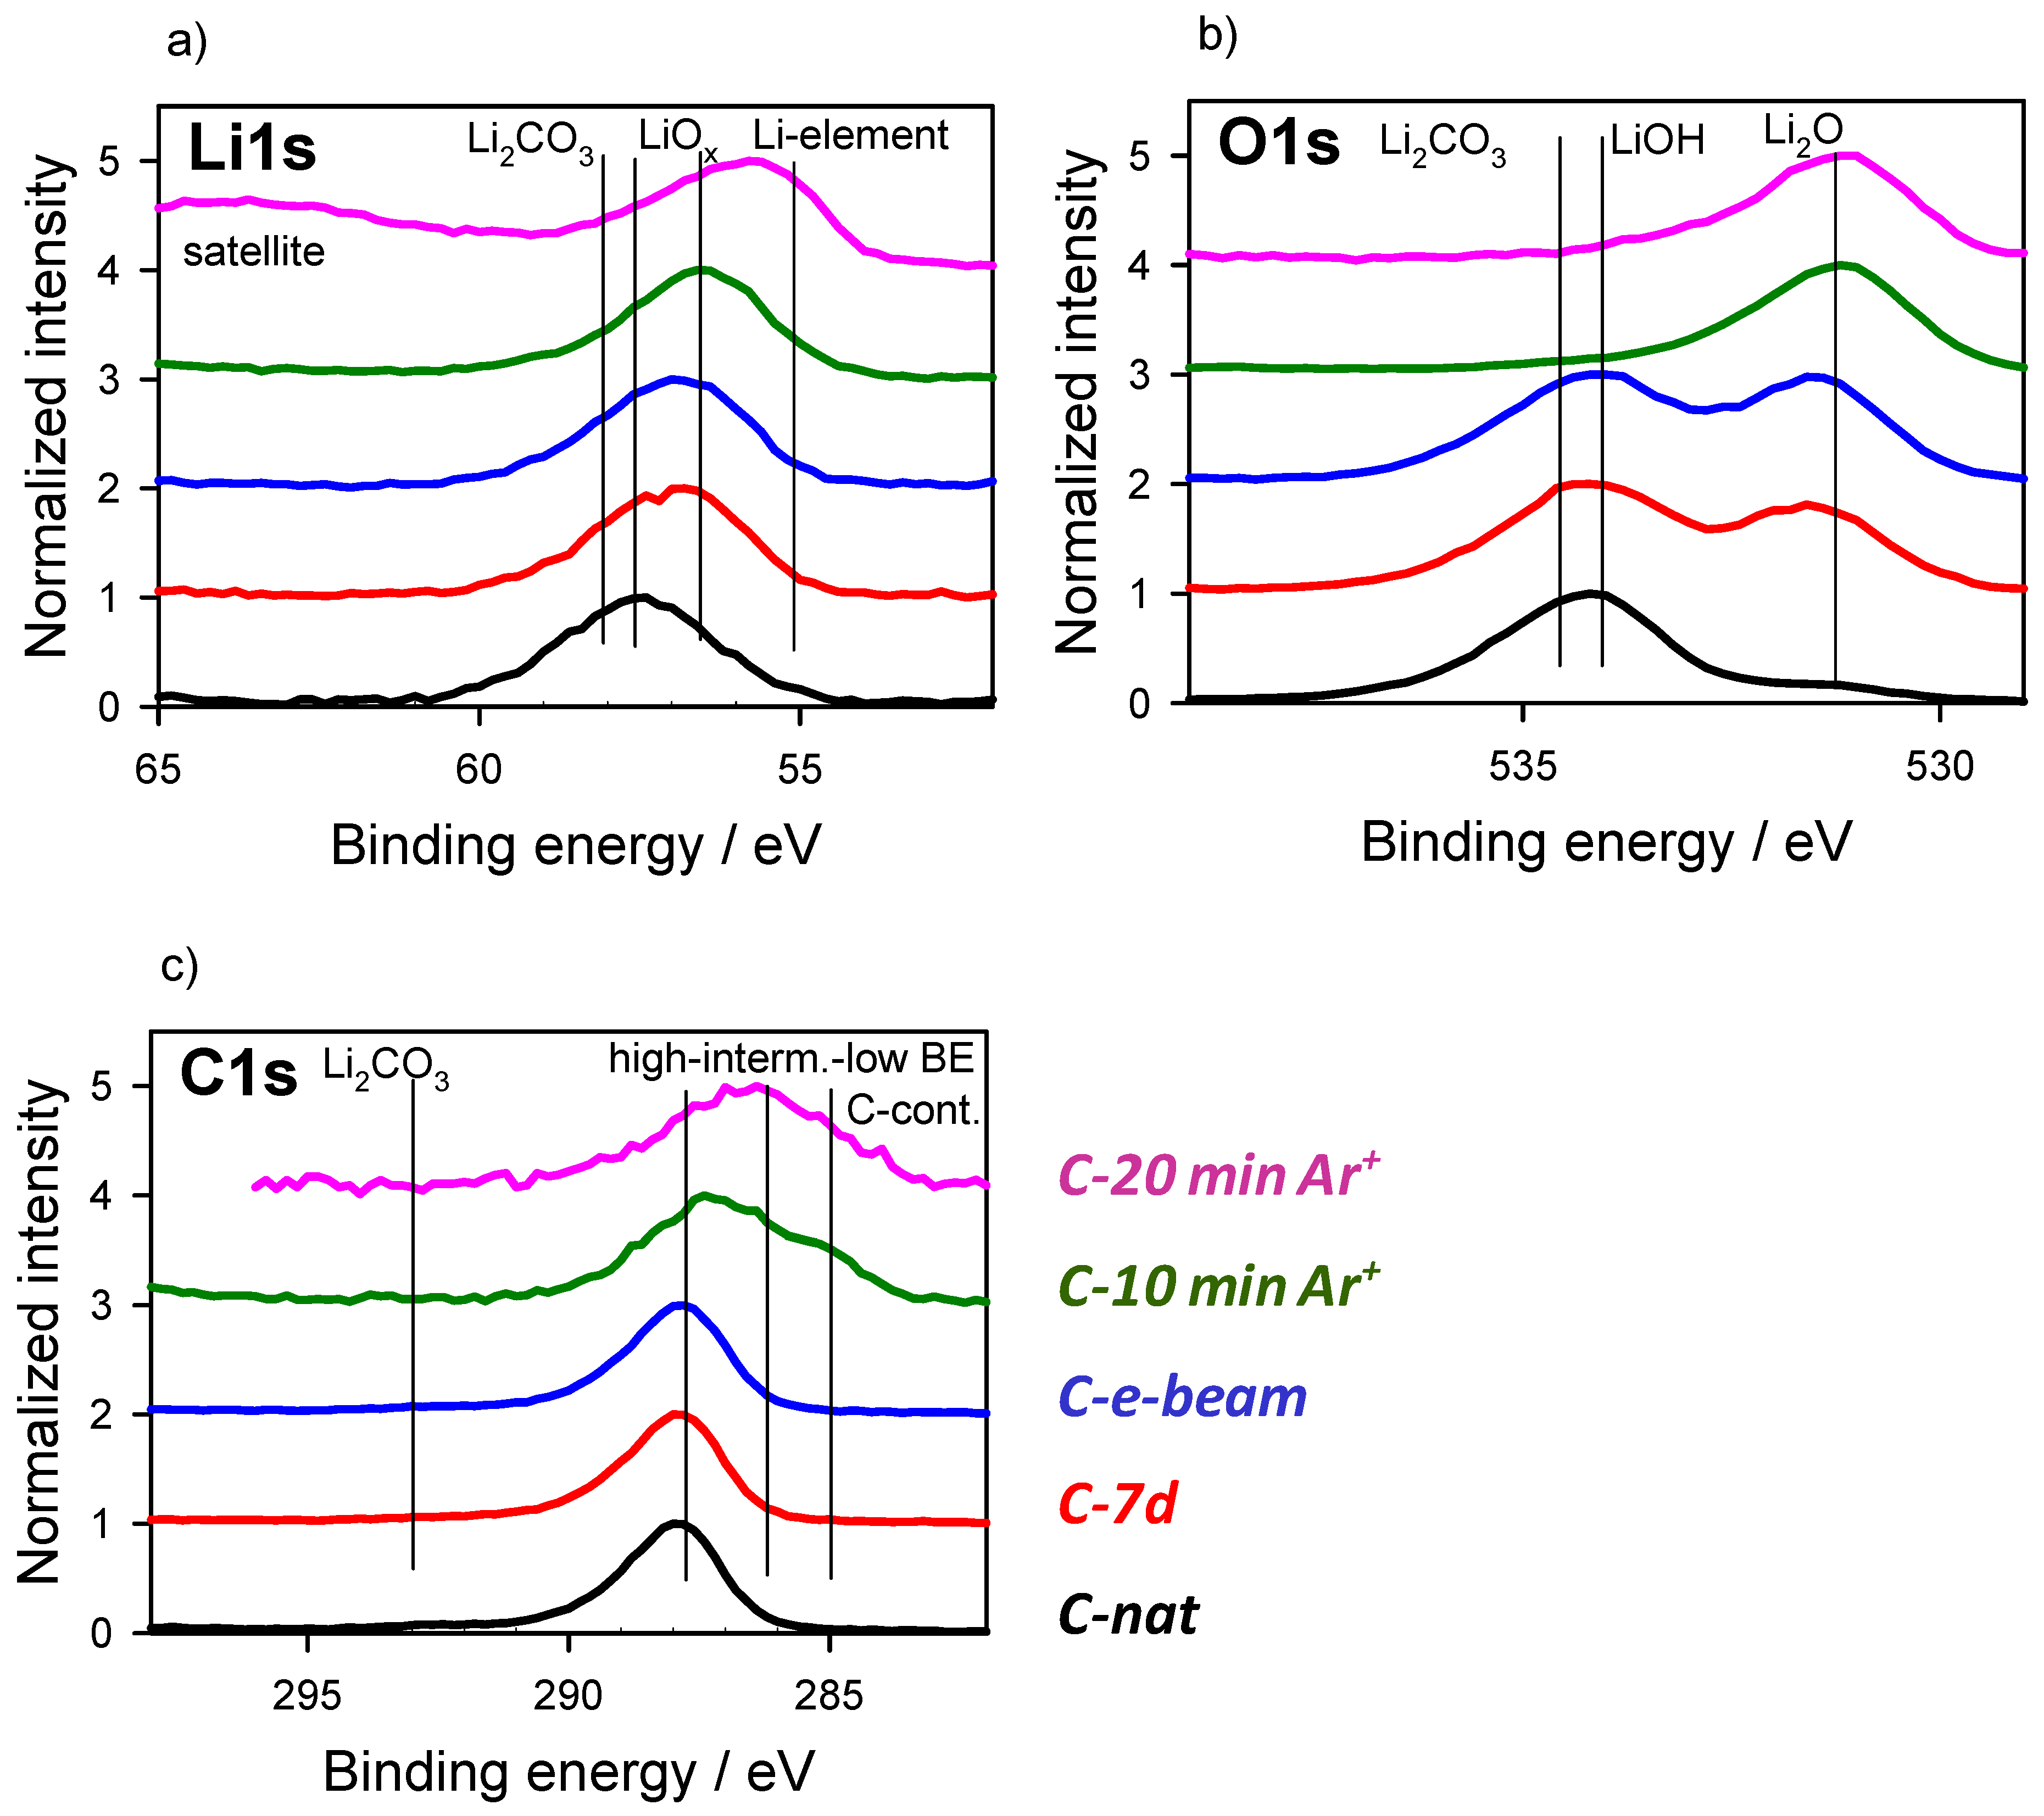
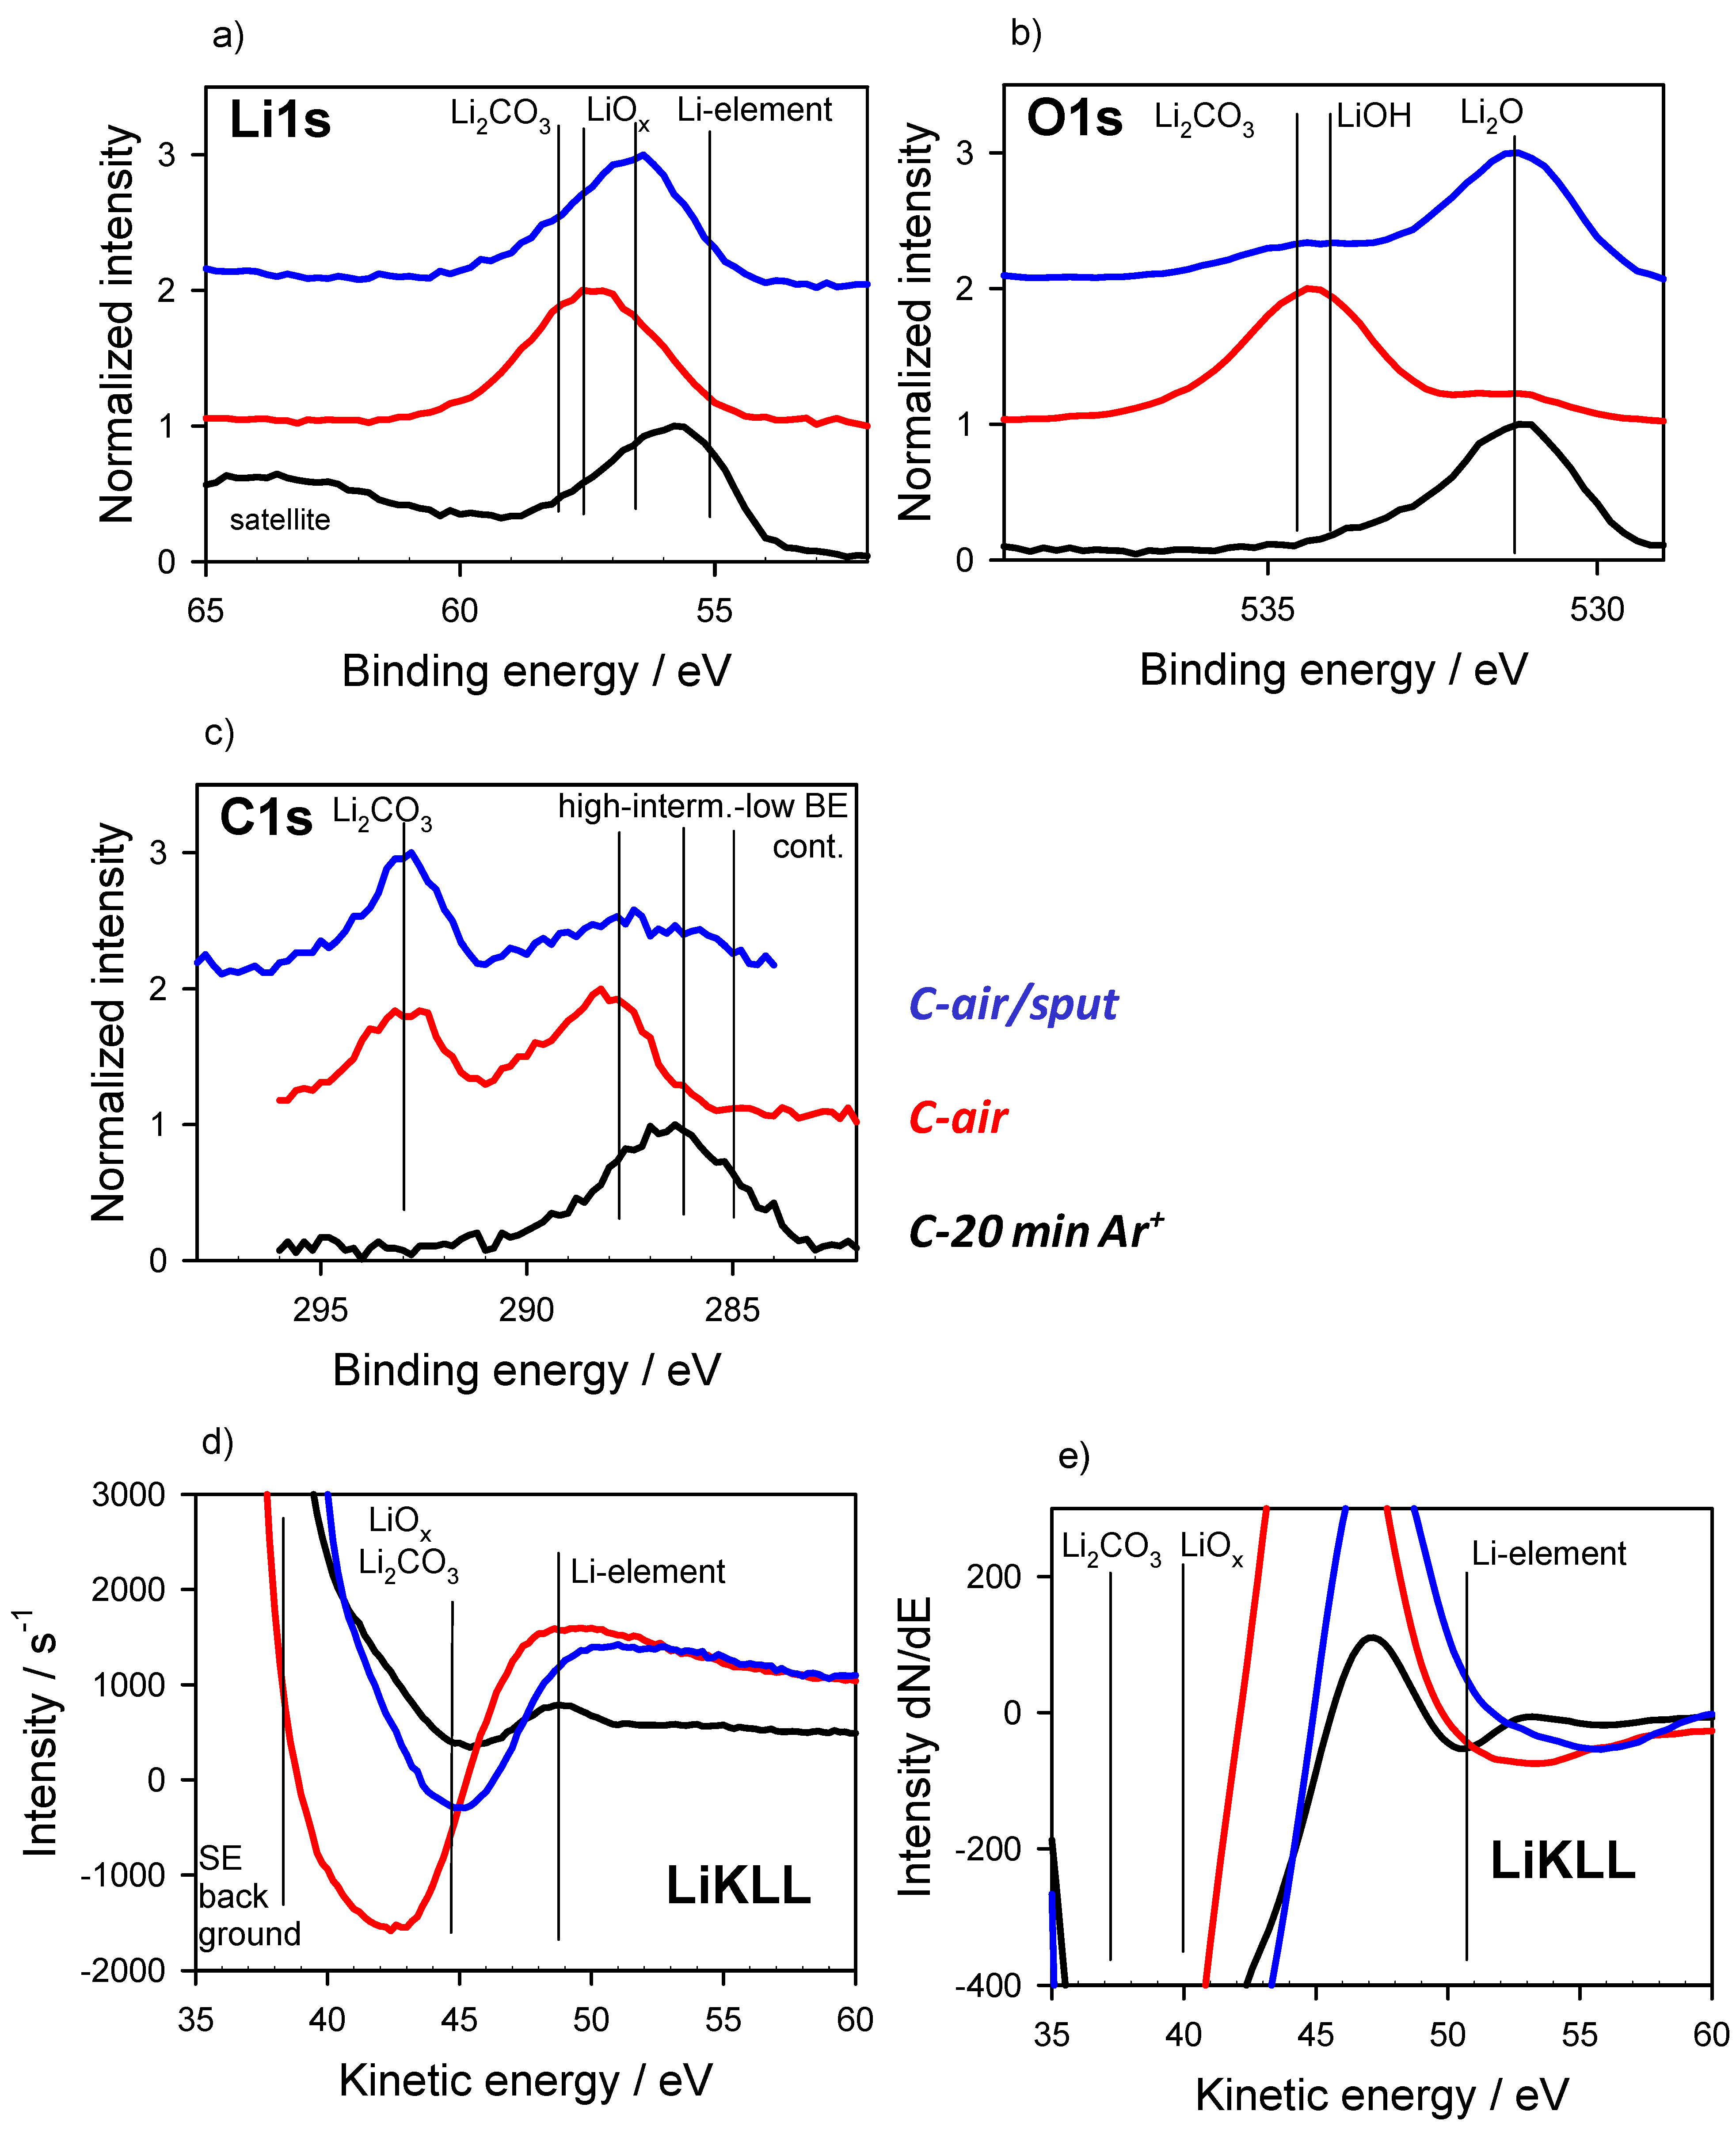
3.1. Chemical States as Prepared and with Gas Interaction

Firstly, the chemical state of the freshly prepared Li surfaces from the glove box was of interest. In previous investigations of Li foils [24,30], typical surface contamination was Li carbonate, often in combination with cross contamination of fluorine or phosphorous, which came from manufacturing or transport issues. In the present measurements, however, beside Li, only O and C were found in each XP spectrum. All the investigated samples similarly showed that metallic Li could never be found at the surfaces by XPS; even for glove-box-treated samples, the fresh Li surfaces immediately reacts with residual oxygen or water.
Figure 1 shows the spectra measured in the PHI XPS system of two separately prepared (identical Li base materials, similar cutting procedures, approx. two-week time-span) fresh samples (A-nat and B-nat) in comparison with a pure carbonate surface reference (on-air) self-prepared with a sputter-cleaned Li surface which was shortly transported through air. Qualitatively, in the O1s spectrum, two clearly separated peaks (Figure 1b) with a high BE peak for carbonate are found, while Li1s shows similar but smaller shifts (Figure 1a) and broadening in accordance with the O1s changes. For C1s, two separate peaks (Figure 1c) are found, which are attributed to C contamination (low BE) and carbonate (high BE) species.
Because of the absence of other main elements (such as F or P), in agreement with the literature [26,36], the Li species Li2O, LiOH (Li2O2?), and Li2CO3 dominate the three states in combination with C contamination. Because of the sample history, we assume LiOH as 2+ valency species [36]; however, distinguishing this from Li2O2 is complicated because of the same Li:O stoichiometry and low peak shifts [27,37]. Moreover, other studies (e.g., [27,37]) do not try to separate LiOH/Li2O2 for that same reason. Wood et al. [27] propose using the valence-band cut-off to distinguish between the two species, which is also not straightforward for the mostly mixed states existing in real world samples.
Assuming the peak positions mentioned in Table 1, a satisfying peak fit (peaks with broken lines in Figure 1) can be carried out, which clearly shows the difference in the three states: only LiOH with some carbonate in the A-nat sample, a mixture of LiOH and Li2O (no carbonate) in the B-nat sample, and only carbonate in the on-air sample. The fit of the “C-cont.” peak is not perfect, and the contamination obviously does not contain only one chemical state. However, the C1s peak fit here is mainly used to estimate the carbonate portion in the spectra. By using the estimated partial intensities from the peak fits given in Table 1 and the calculated total elemental concentrations, the specific concentrations of the different species can be determined [35]. These values are given in Table 2 and support the idea that the calculated atomic ratios are in satisfying agreement with the stoichiometry of the different compound species.
The BE values from other studies [27,36] given in Table 1 (lines “Reference energies”) as comparison values to our fit (line “Our fit-energies”) should be shortly discussed in more detail. The BE referencing methods differ in both papers, which results in non-consistent peak position data. In [27], starting from sputtered clean metallic Li (54.97 eV) in situ, artificial Li2O is prepared and the O1s peak is used later on as the reference value (531.2 eV). All the other values are the results of peak fits of sample states with mostly mixed species. These experiments are similar to our approach, as metallic Li foil is covered with thin reaction layers and no charging shifts are observed. Thus, it is acceptable that the BE values almost exactly agree in both studies. Looking at the LiOH/Li2O2 values in our results, a trend to the Li2O2 values fitted in [27] is visible; nevertheless, the uncertainties in identifying both species discussed above should be kept in mind.
In [36], a different approach for BE calibration was used. Because of the high purity of the prepared materials and the absence of C contamination, the O1s peak for Li2O at 528.5 eV was used. The use of this BE value is based on a study of reference powders [37] where the C1s peak at 285.0 eV from C contamination was used as a BE reference. Thus, indirectly C1s at 285.0 eV can be assumed as BE for the peak value of C1s in Table 1 for the values from [36]. By looking at the differences from our values to that in [36] for nearly all species, an equal difference of around 2.7 eV can be found. This agrees with the conclusions in [27] that different peak values published by several authors are only the result of linear BE shifts from charging shifts and a non-equivalent BE calibration. Only two values (O1s-LiOH, C1s–C-cont.) show larger differences. This may come from the concurrence of LiOH and Li2O2 and different carbonaceous species at the two kinds of sample.
Because no charging was observed in our samples, it is obvious that these constant peak shifts, in comparison with the classical BE calibration (C1s–285 eV), result from a surface potential barrier in the XP experiment between the thin insulation overlayers and the metallic Li underneath, as previously stated [24,25].
Figure 1. XP spectra (a)—Li1s spectra, (b)—O1s spectra, (c)—C1s spectra normalized in intensity of two native Li foils (A-nat, B-nat) from the glove box and after short contact with air (on-air). Depending on the glove box conditions, a mixture of LiOH and Li2O is found; Li2CO3 dominates the surface after contact to air (a,b). Using peak fitting, the species (LiOH/C-cont.—blue curves, Li2O—green curves, and Li2CO3—red curves) can be separated in agreement with literature values (Table 1) and represent their stoichiometry (Table 2) really well. The C species (namely the C1s peak at 288 eV from contamination) are found at the high BE positions (c).
Batteries 08 00024 g001
Table 1. Results of the peak fit procedure for the spectra shown in Figure 1. All BE values are given in eV. The fit values calculated from our experimental data for the different species agree well with the results published in a recent detailed work [27]. In contrast values from an other work [36] based on BE referencing with C1s carbon contamination at 285 eV shows a constant shift around 2.7 eV.
ElementLi O C Comment
Li1sLi1sLi1sO1sO1sO1sC1sC1s
SpeciesLi2CO3LiOH
{Li2O2}
Li2OLi2CO3LiOH
{Li2O2}
Li2OLi2CO3C-cont.
Peak areas %
on-air973099<1<18514
B-nat<1366305347595
A-nat22780138413070
BE values
Our fit energies58.057.556.4534.6534.1531.3292.8288.2
Reference energies58.0557.4
{57.5}
56.4534.67533.77
{534.15}
531.2292.9288.0Ref [27]
Reference energies55.554.853.7532531.0528.5 *290.1285.0 ***Ref [36]
Difference to [27]2.52.72.72.63.1 **2.72.73.2 ***
{energy} values for Li2O2 from [27]. * peak used as BE reference based on [37]. ** different value points possibly linked to Li2O2. *** C reference based on [37] and possible various C species.
Table 2. Estimated partial concentrations for the samples and peak fit results from Table 1. The values agree well with the stoichiometries of the supposed surface species. Concentration values are presented in %.
Conc.-TotalLi
-Total
O
-Total
C
-Total
Comment
Conc.-fitLi1sLi2CO3LiOHLi2OO1sLi2CO3LiOHLi2OC1sLi2CO3C-cont.
on-air36360049490015141Li2CO3
B-nat5502134370191880.57LiOH + Li2O
A-nat459360486420734LiOH + (Li2CO3)
Figure 2 shows XP spectra of the materials measured in the JEOL system: fresh sample (C-nat), 1 week at 3 × 10⁻⁷ Pa (C-7d), sputter-cleaned sample in the intro-chamber at 1 × 10⁻⁴ Pa (C-intro), and transferred (C-air). Because of the inferior vacuum, the originally nearly LiOH-containing sample (C-nat, similar to A-nat from Figure 1) changes during one-week storage with an increase in the Li2O amount. Furthermore, the C-intro sample shows mainly LiOH (water from the fore-pump) and a low carbonate amount, while the C-air sample is carbonate-dominated, as shown in Figure 1. All these findings can be followed by similar peak shape changes, as seen in Figure 1. All the peaks are in higher BE position (see C1s at 288 eV).

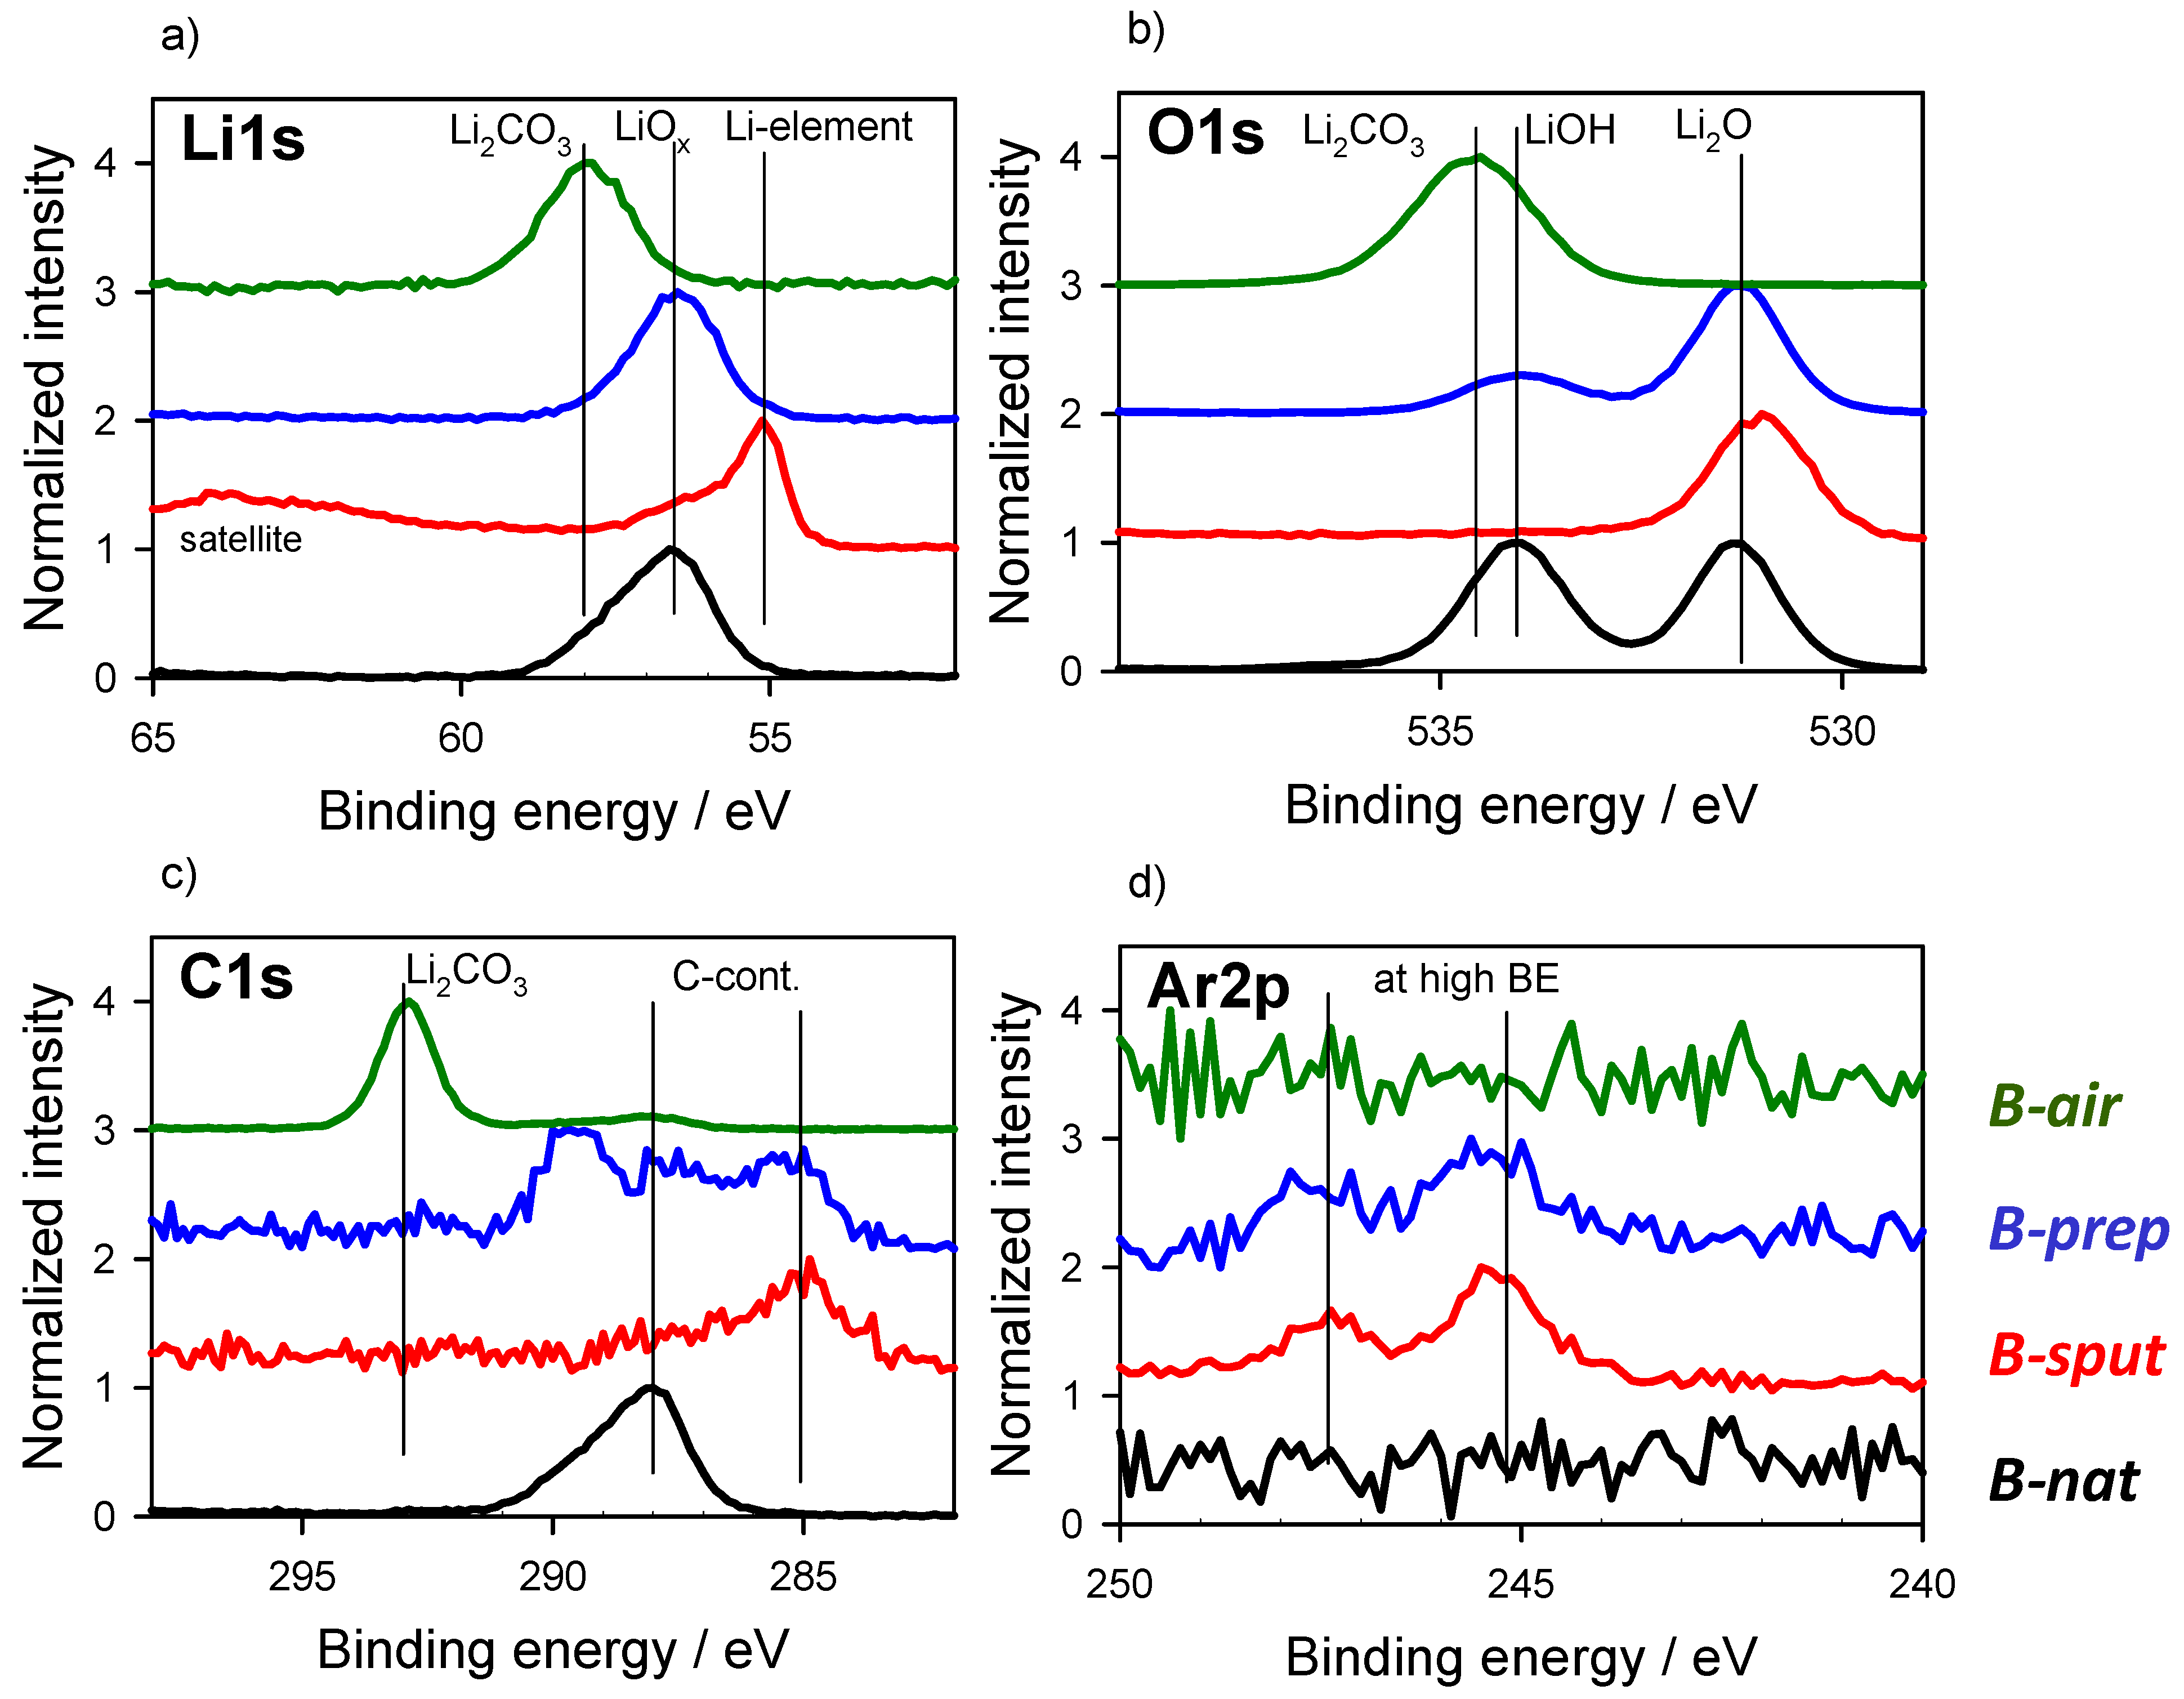
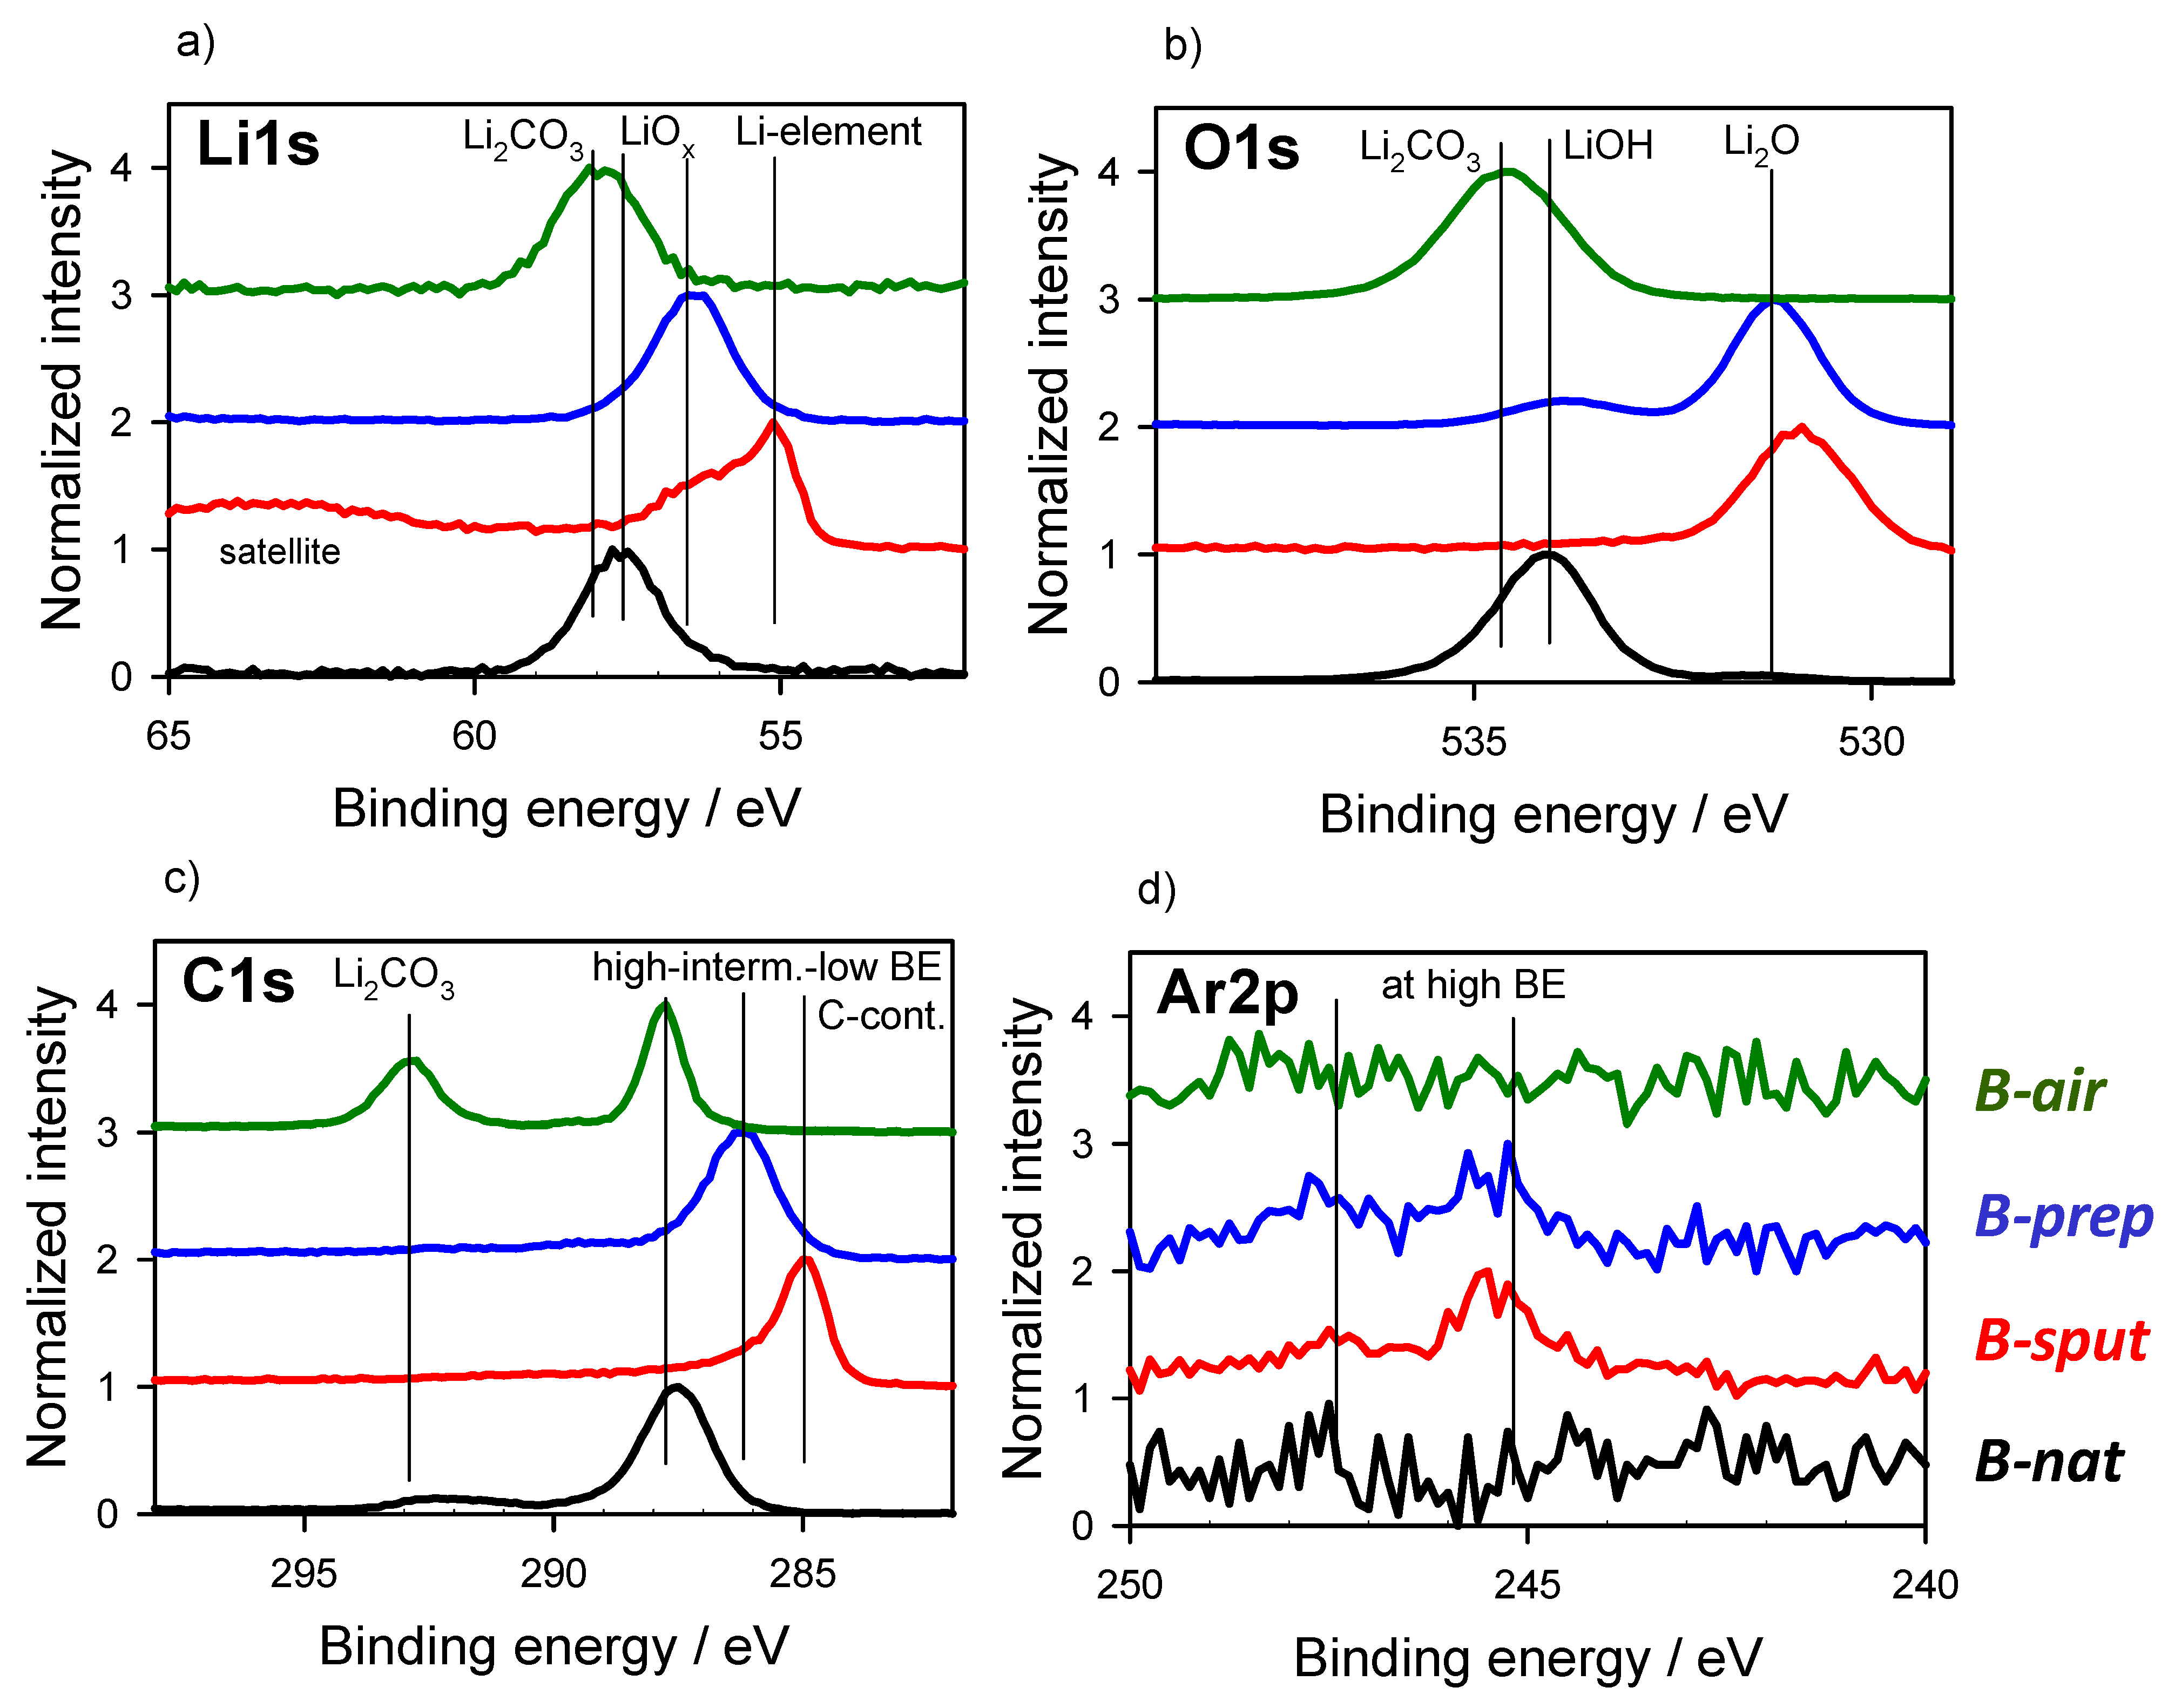
3.2. Energy Referencing for Sputter and Gas Modification: Artificial C and Ar

In Figure 3 a series of surface modifications is shown investigated by means of the PHI 5600 analysis system starting from the LiOH/Li2O (B-nat) native surface: long time Ar+ sputtering (B-sput), some minutes in the residual vacuum (3 × 10⁻⁶ Pa) of the sputter-preparation chamber (B-prep) and after air contact (B-air).
The Li1s peak shape changes (Figure 3a) describe the following chemical modifications: as-prepared mixed oxide, elemental state (also the satellite peak is visible) after sputter cleaning, partial surface oxidation (mainly Li2O) in the prep chamber, and carbonate formation at air. Appropriate changes can be followed in the O1s peaks (Figure 3b).
C1s from the contamination (Figure 3c) starts at the high BE value (288 eV), while residual carbon is found in the metallic Li at the “normal position” at 285 eV. After partial surface oxidation (thin oxide layer), it looks like C/C-O/carbonate is at the normal or partly shifted position (broad peak between 285 to 290 eV). After contact with air, C1s peaks are found at higher BE positions (293 eV—carbonate, 288 eV—contamination), as displayed in Figure 1 and Figure 2.
If the Ar signal from the implanted ions is visible (Figure 3d), the Ar2p peak position remains at a high position, i.e., at 245 eV. Ar as “inert” element is also in elemental Li, shifted to a higher BE. This agrees with the expectations from our previous model experiments published earlier [24].
The experiments documented in Figure 4 provide further information, where the same surface states, as discussed in Figure 3, are covered in situ artificially with a thin carbon layer. This was carried out (see “experiments”) in preparation chambers directly coupled to the XPS system, either with RF magnetron sputtering from a graphite target (B-nat) or C60 thermal evaporation in UHV (B-sput, prep, air).
The Li1s and O1s peaks (Figure 4a,b) are not significantly changed, alongside the formation of LiOH (O1s change) in B-nat during sputter deposition due to the inferior vacuum and a slightly Li oxidation (Li1s broadening) in B-sput.
The behavior of the C1s from the additional carbon (Figure 4c) agrees well with the expectations from the residual natural carbon contamination, as discussed in Figure 3. In the samples with a thick reaction layer (B-nat = oxide, B-air = carbonate), the additional carbon is found at the high BE position of C1s around 288 eV. For the elemental Li (B-sput), the additional carbon is at the “normal position” at exactly 285 eV. In this case, the surface is only covered with a very thin oxide layer (B-prep), and C1s is found at an intermediate position at around 286 eV. The Ar2p peaks (Figure 4d) stay as expected at the high BE position of 245 eV.

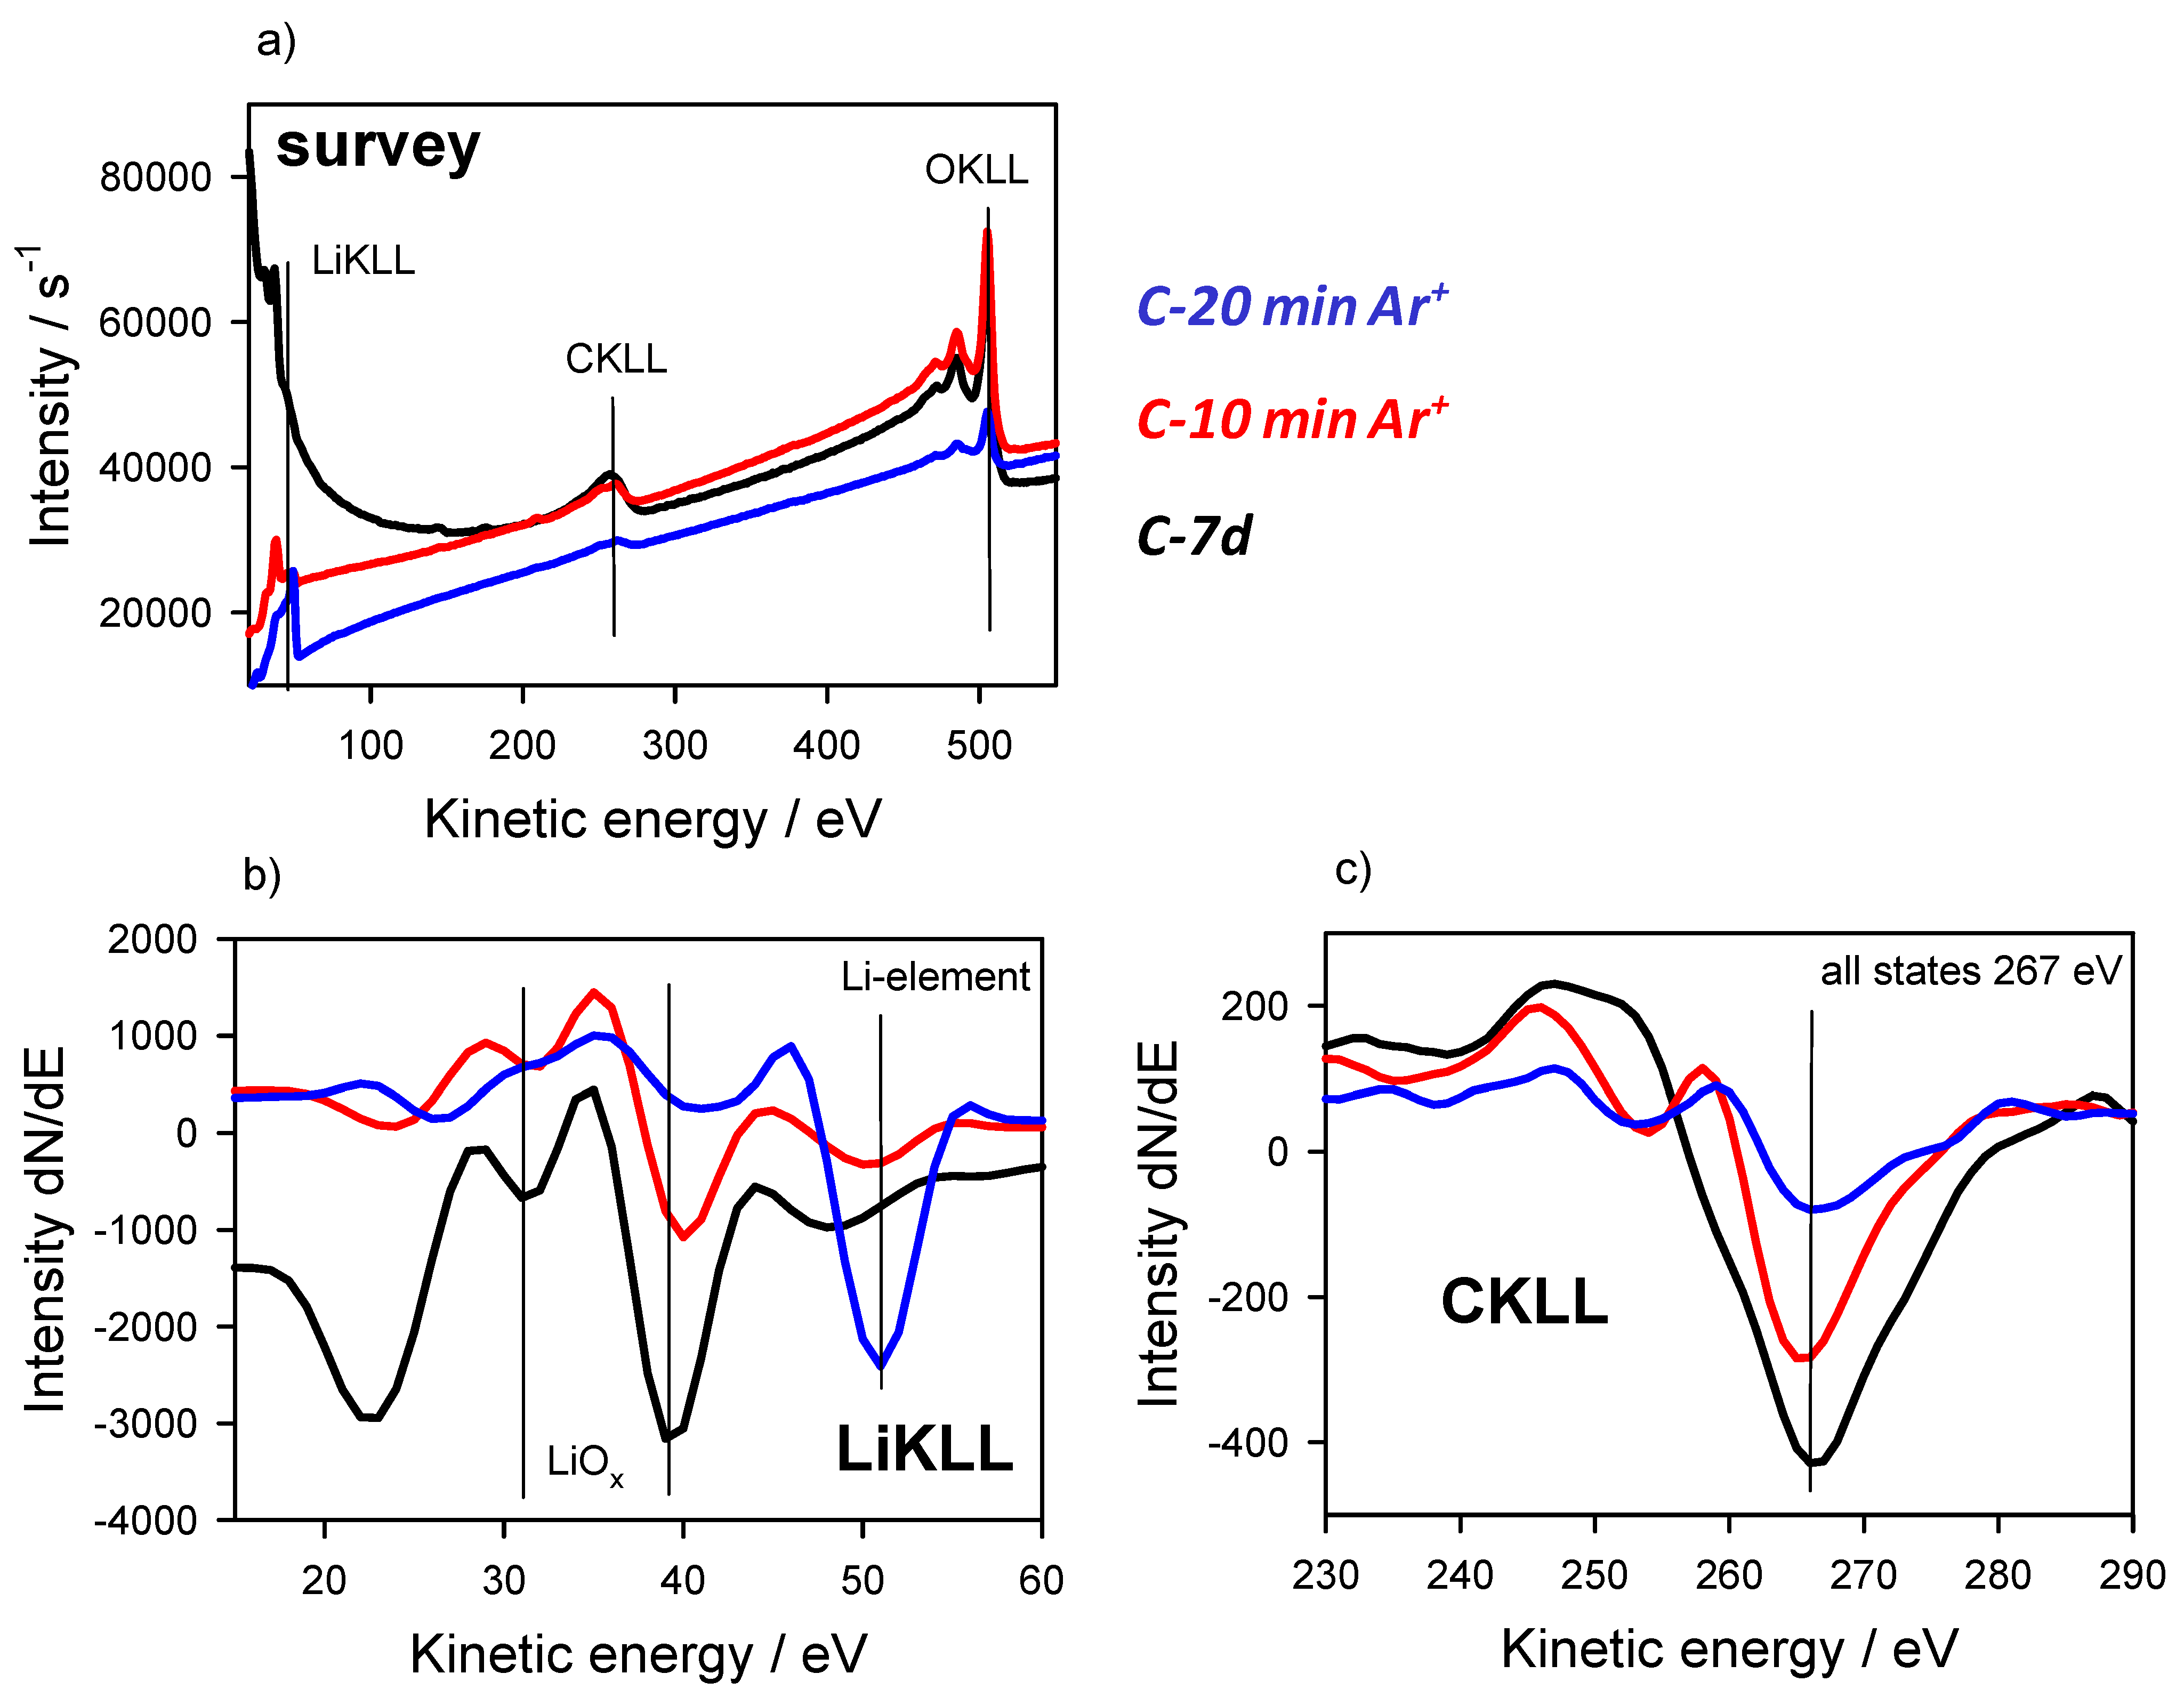
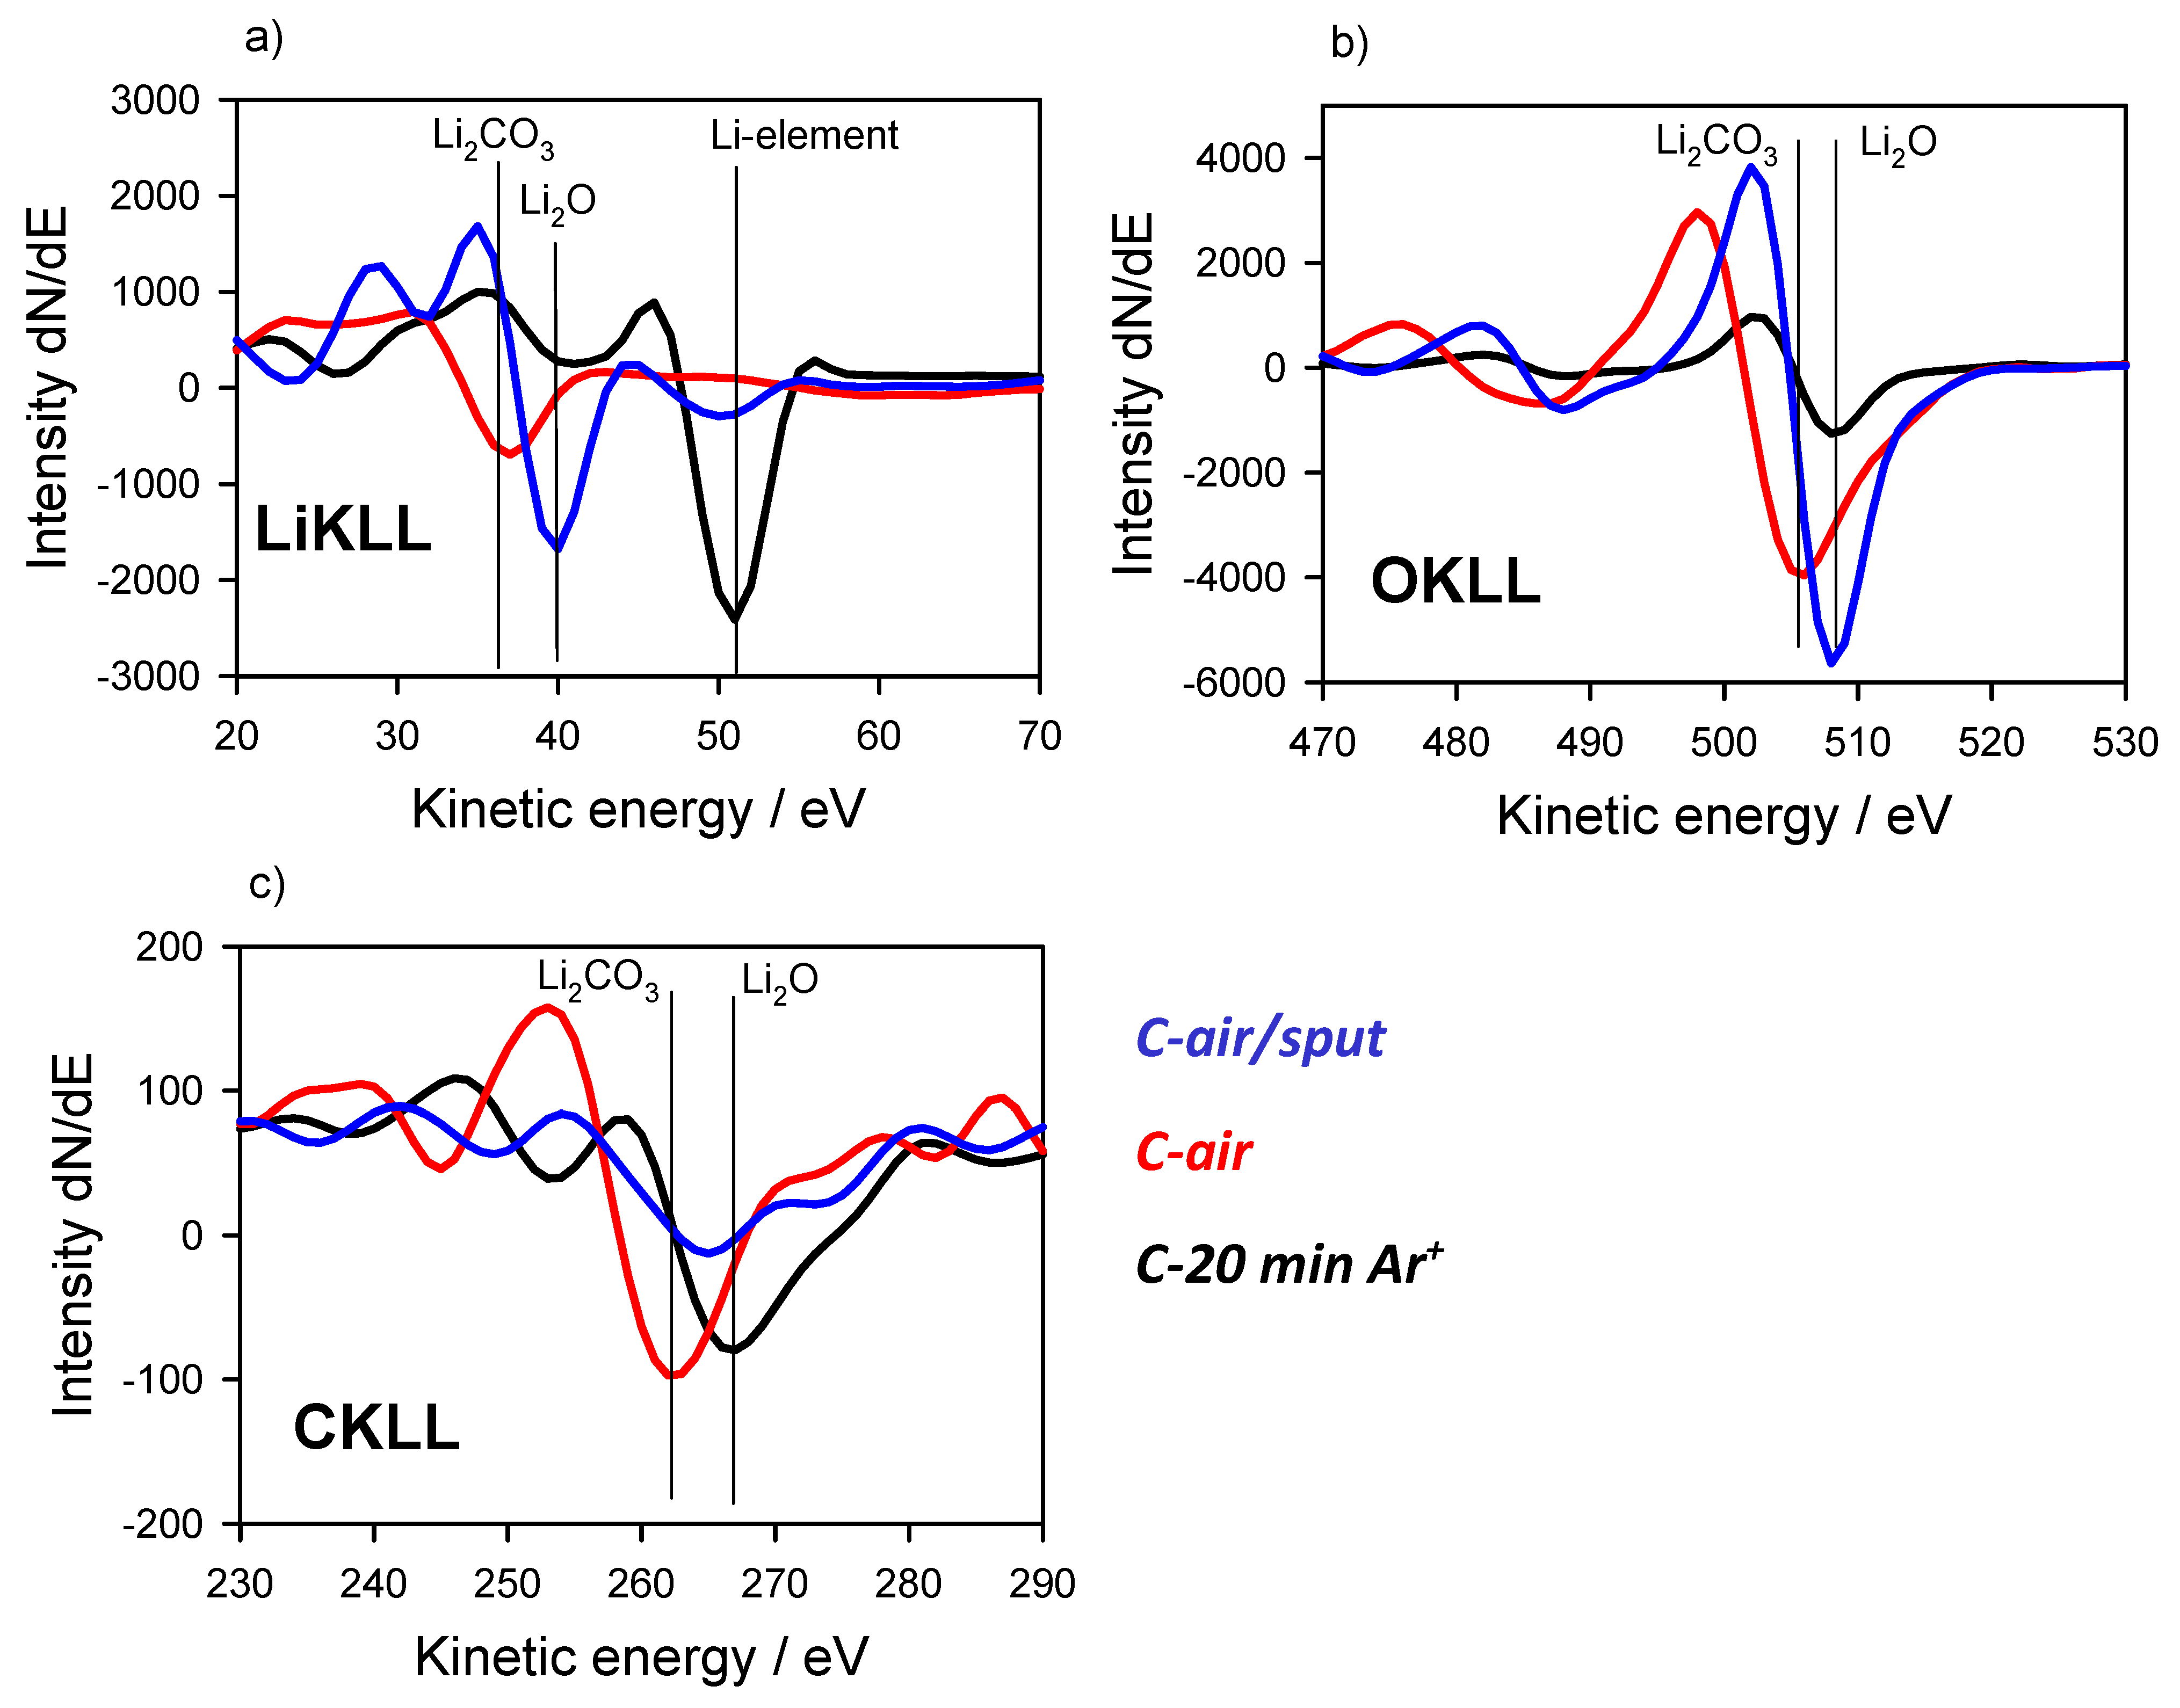
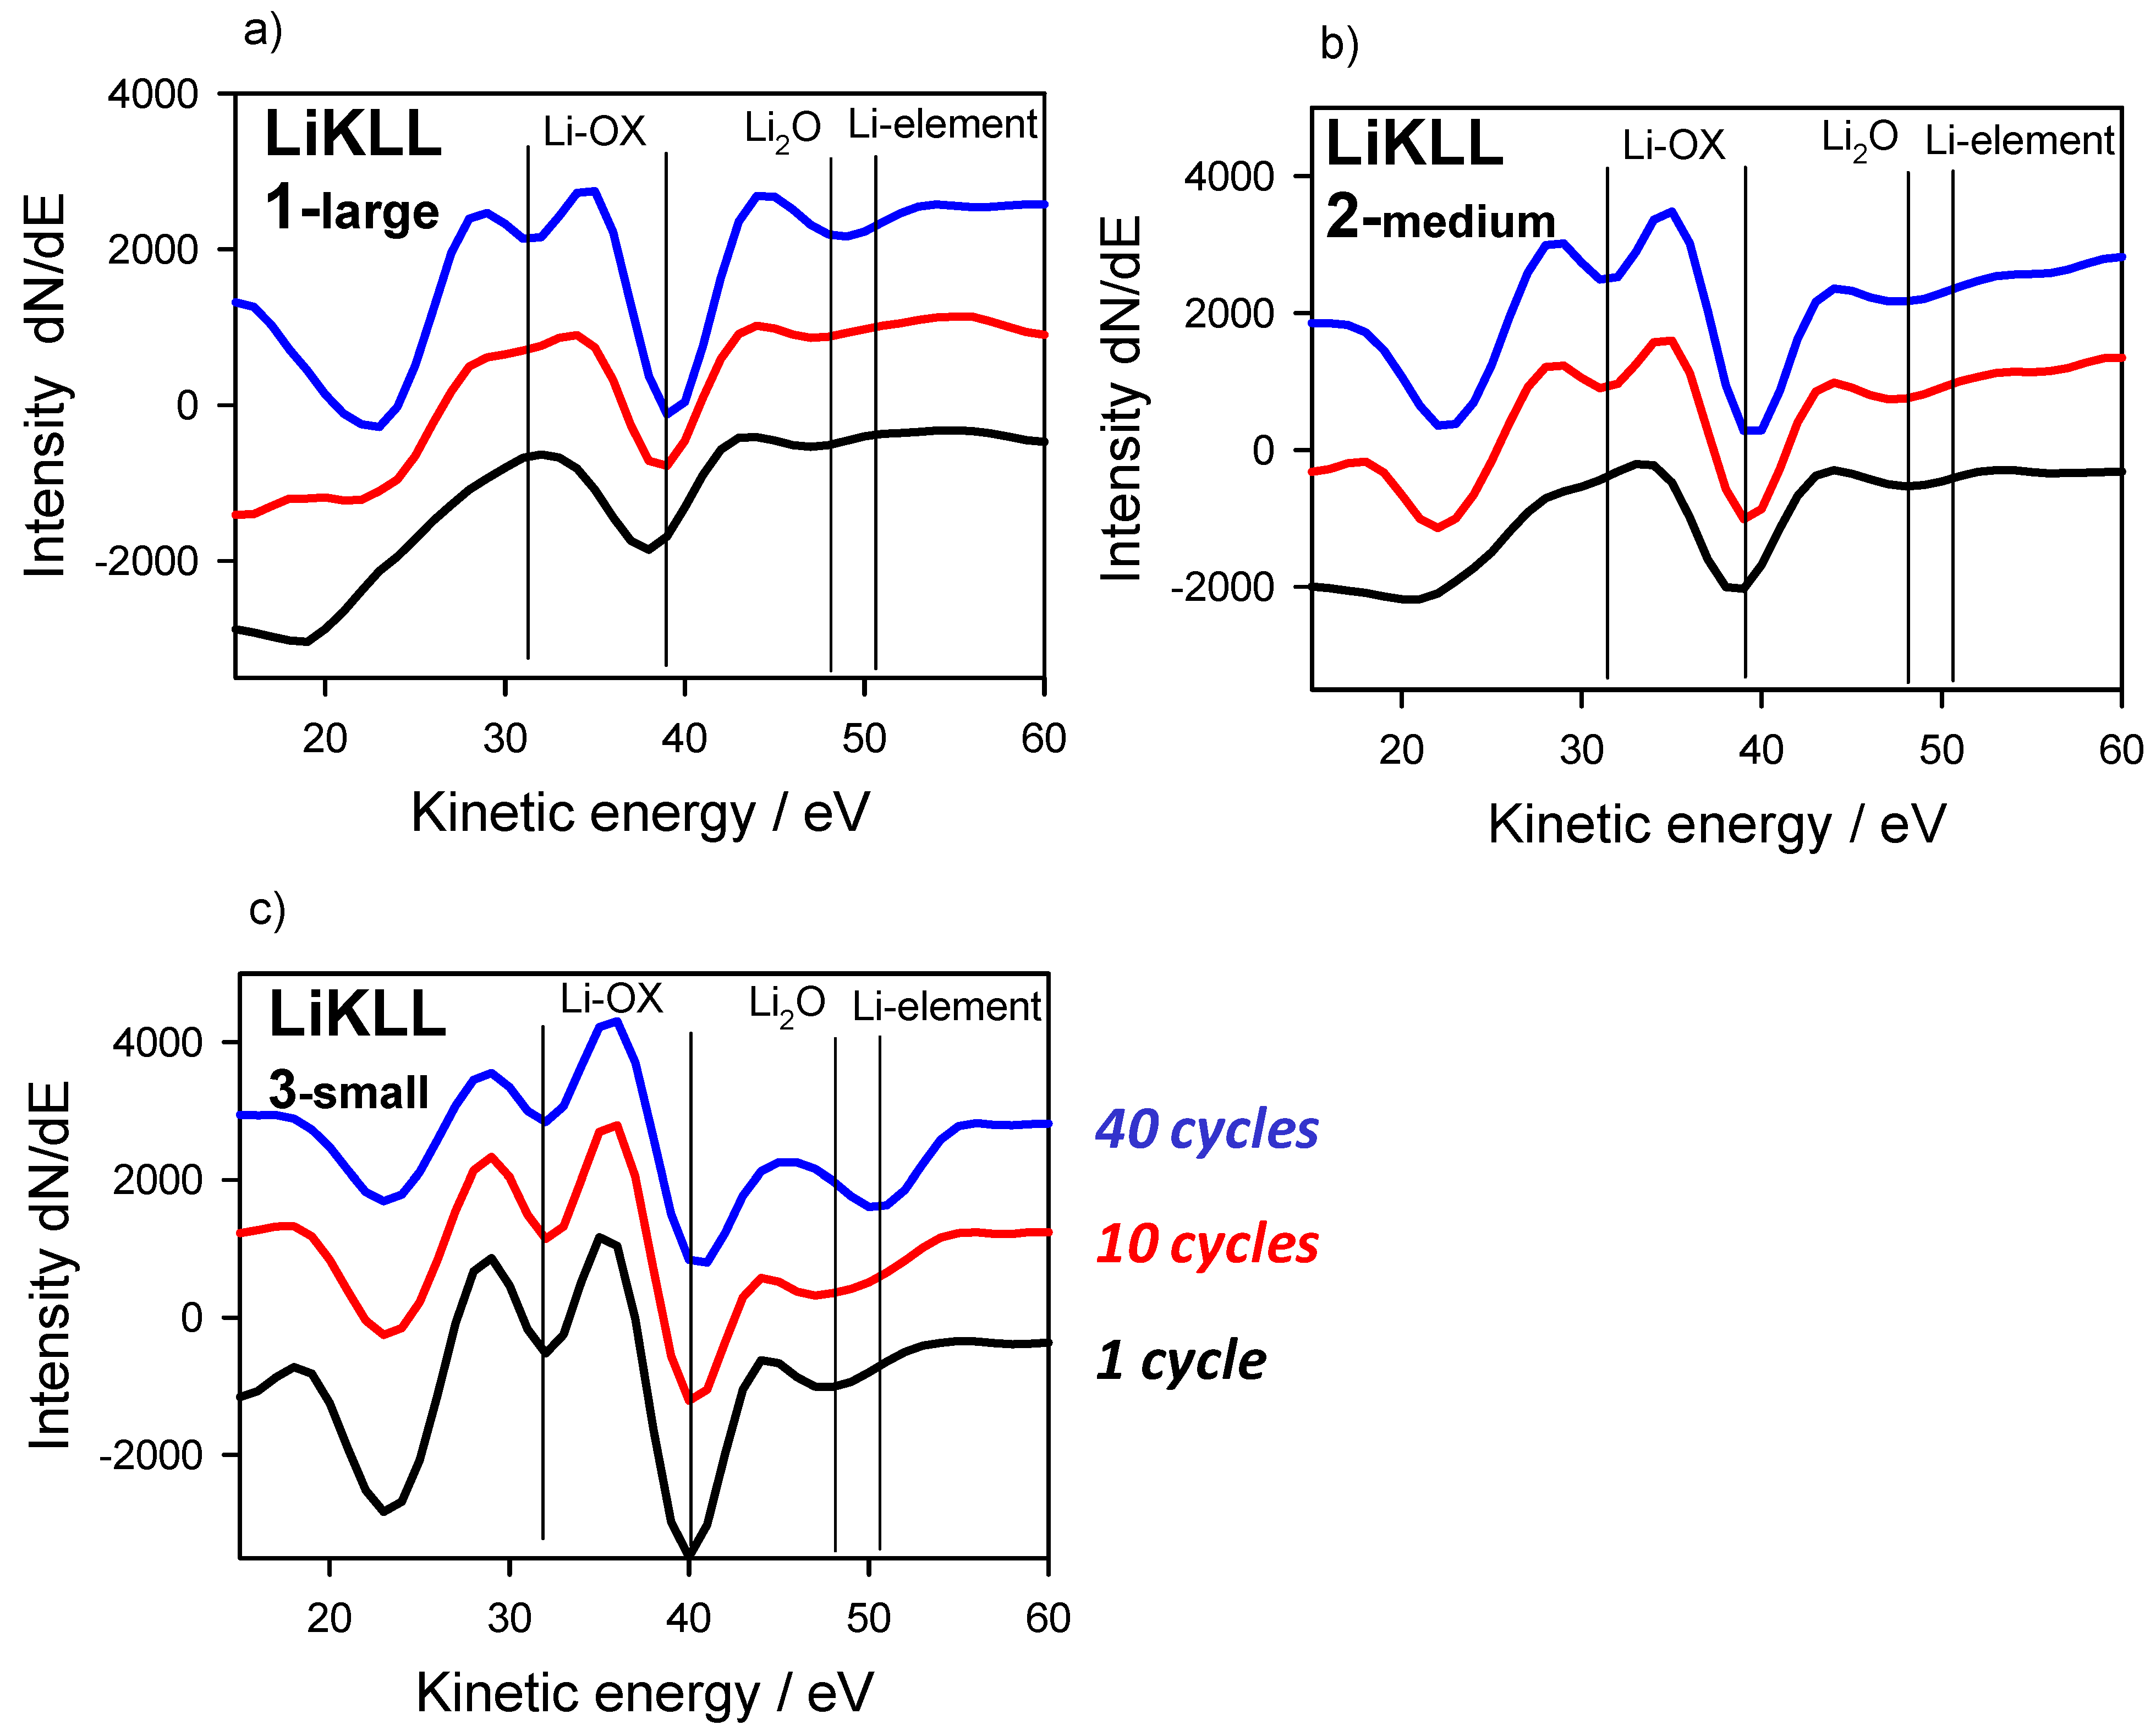
3.3. Large-Area Beam Modification in XP and AE Spectra

Results of beam modification experiments in the JEOL AES apparatus are expected to significantly depend on the size of the radiation area [28]. When considering X-ray-excited electron spectroscopy (XPS) in this JEOL equipment, there is a need for large-area beams, because the measurement area is not determined by an analyzer entrance with a focusing lens (as in the PHI XPS-system), but from the X-ray beam itself. In our collimator system, the beam size is expected to be around 2 mm.
For measurements around the Li sample, a region was selected, where a relatively smooth and freshly cut surface was visible. In Figure 5, a secondary electron (SE) picture (size 2 mm × 2 mm) of this region is shown, which roughly agrees with the area exposed to X-rays.
Figure 6 summarizes some observations after e-beam and Ar+ ion beam treatment with XPS in the JEOL system. The starting point was a sample state (C-7d) shown already in Figure 2, characterized by a mixture of LiOH and Li2O, which was observed after a 7-day vacuum period (3 × 10⁻⁷ Pa) from the original LiOH-dominated sample (C-nat).
The e-beam-modified state (C-e-beam) was measured after a series of small area AE measurements (discussed later in Section 3.4) and a final long-time large-area (20 min, 1 mm × 1mm, 10 nA) e-beam radiation treatment. Under these conditions no significant changes in the XP spectra are observed, only the portion of Li2O is slightly increased in comparison with LiOH. In all these three sample states, the C1s carbon contamination peak is found at around 288 eV, i.e., the previously discussed “high energy” BE position. Additionally, no carbonate is found/formed.
After 10 min, with large-area ion beam sputtering (C-10 min Ar+), corresponding to around 10 nm thickness erosion (around 3 mm × 3 mm, Ar+, 3 × 10⁻⁶ A, 3 keV), only Li2O is found and a broadening of the C1s peak to a lower BE (285 eV) is observed. After additional 20 min (C-20 min Ar+) of sputtering with a lower scan size (around 1.5 mm × 1.5 mm), corresponding to around 100 nm erosion, partially elemental Li is found (Li peak at 55 eV, satellite) and the residual C contamination further shifts towards the 285 eV position.
In the AE measurements using only a large-area e-beam radiation, no change in the spectra was observed for the Li samples. If any, these changes must appear immediately after first e-beam bombardment.
Thus, only the changes occurring due to Ar+ sputtering will now be discussed. In Figure 7, AE survey spectra for the starting sample state (C-7d) and the two sputtered samples (C-10/20 min Ar+) are compared, and the measurement area is 1 mm × 1mm. As expected, the signals for C and O (Figure 7a,c) decrease after sputtering. In the low KE region, the changes are drastic. Thus, as visible in the non-differentiated spectra (Figure 7a), the SE peak decreases (0 to 30 eV) after sputtering, and an additional peak appears at 52 eV, later on described as elemental Li, in the differentiated spectra in the LiKLL region (Figure 7b) for the long-time sputtered sample (C-20 min Ar+).
To gain further insight into comparisons of AE and XP spectra for different Li states, such spectra are shown in Figure 8 and Figure 9 for a sputtered Li sample (C-20 min Ar+, see also Figure 7, last spectrum), representing mainly elemental Li, which was afterwards brought to air (C-air) for carbonate formation and finally sputtered once more shortly (C-air/sput).
For the AE spectra (Figure 8), it becomes clear that the LiKLL (Figure 8a) peak positions are significantly different for the elemental (52 eV), carbonate (38 eV), and sputtered carbonate (40 eV). For OKLL (Figure 8b), the carbonate position (506 eV) is different from that of the other two cases (509 eV). CKLL (Figure 8c) shows characteristic peaks at 268 eV for the residual carbon after sputtering and at 262 eV for the carbonate.
For the XP spectra (Figure 9), beside the transformation of elemental (C-20 min Ar+) to carbonate Li (C-air), it is obvious (Figure 9a,b) that the carbonate is converted to Li2O due to sputtering (C-air/sputt). This can be concluded by the peak positions of Li1s and O1s (Figure 9a,b). After sputtering, they are in agreement with the positions discussed earlier, e.g., from Figure 1 and Figure 3. It confirms the conclusions made from AES of the same samples in Figure 8. In the C1s spectra (Figure 9c), the behavior, as previously discussed, is found for the carbonate-containing samples (C-air, partly C-air/sput) C1s from the residual C contamination in the high-energy BE position (288 eV). For the sputter-cleaned state (C-20 min Ar+), a tendency to a low BE (285 eV) is visible.
The X-ray-excited spectra, measured in the LiKLL Auger spectra containing spectral region (Figure 9d), are dominated up to 45 eV KE by the peak of the secondary electrons, and no characteristic AE spectra can be isolated. However, in agreement with Figure 7b, for the sputter cleaned sample (C-20 min Ar+), the LiKLL Auger peak for elemental Li at around 51 eV (differentiated spectra, Figure 9e) becomes clearly visible.

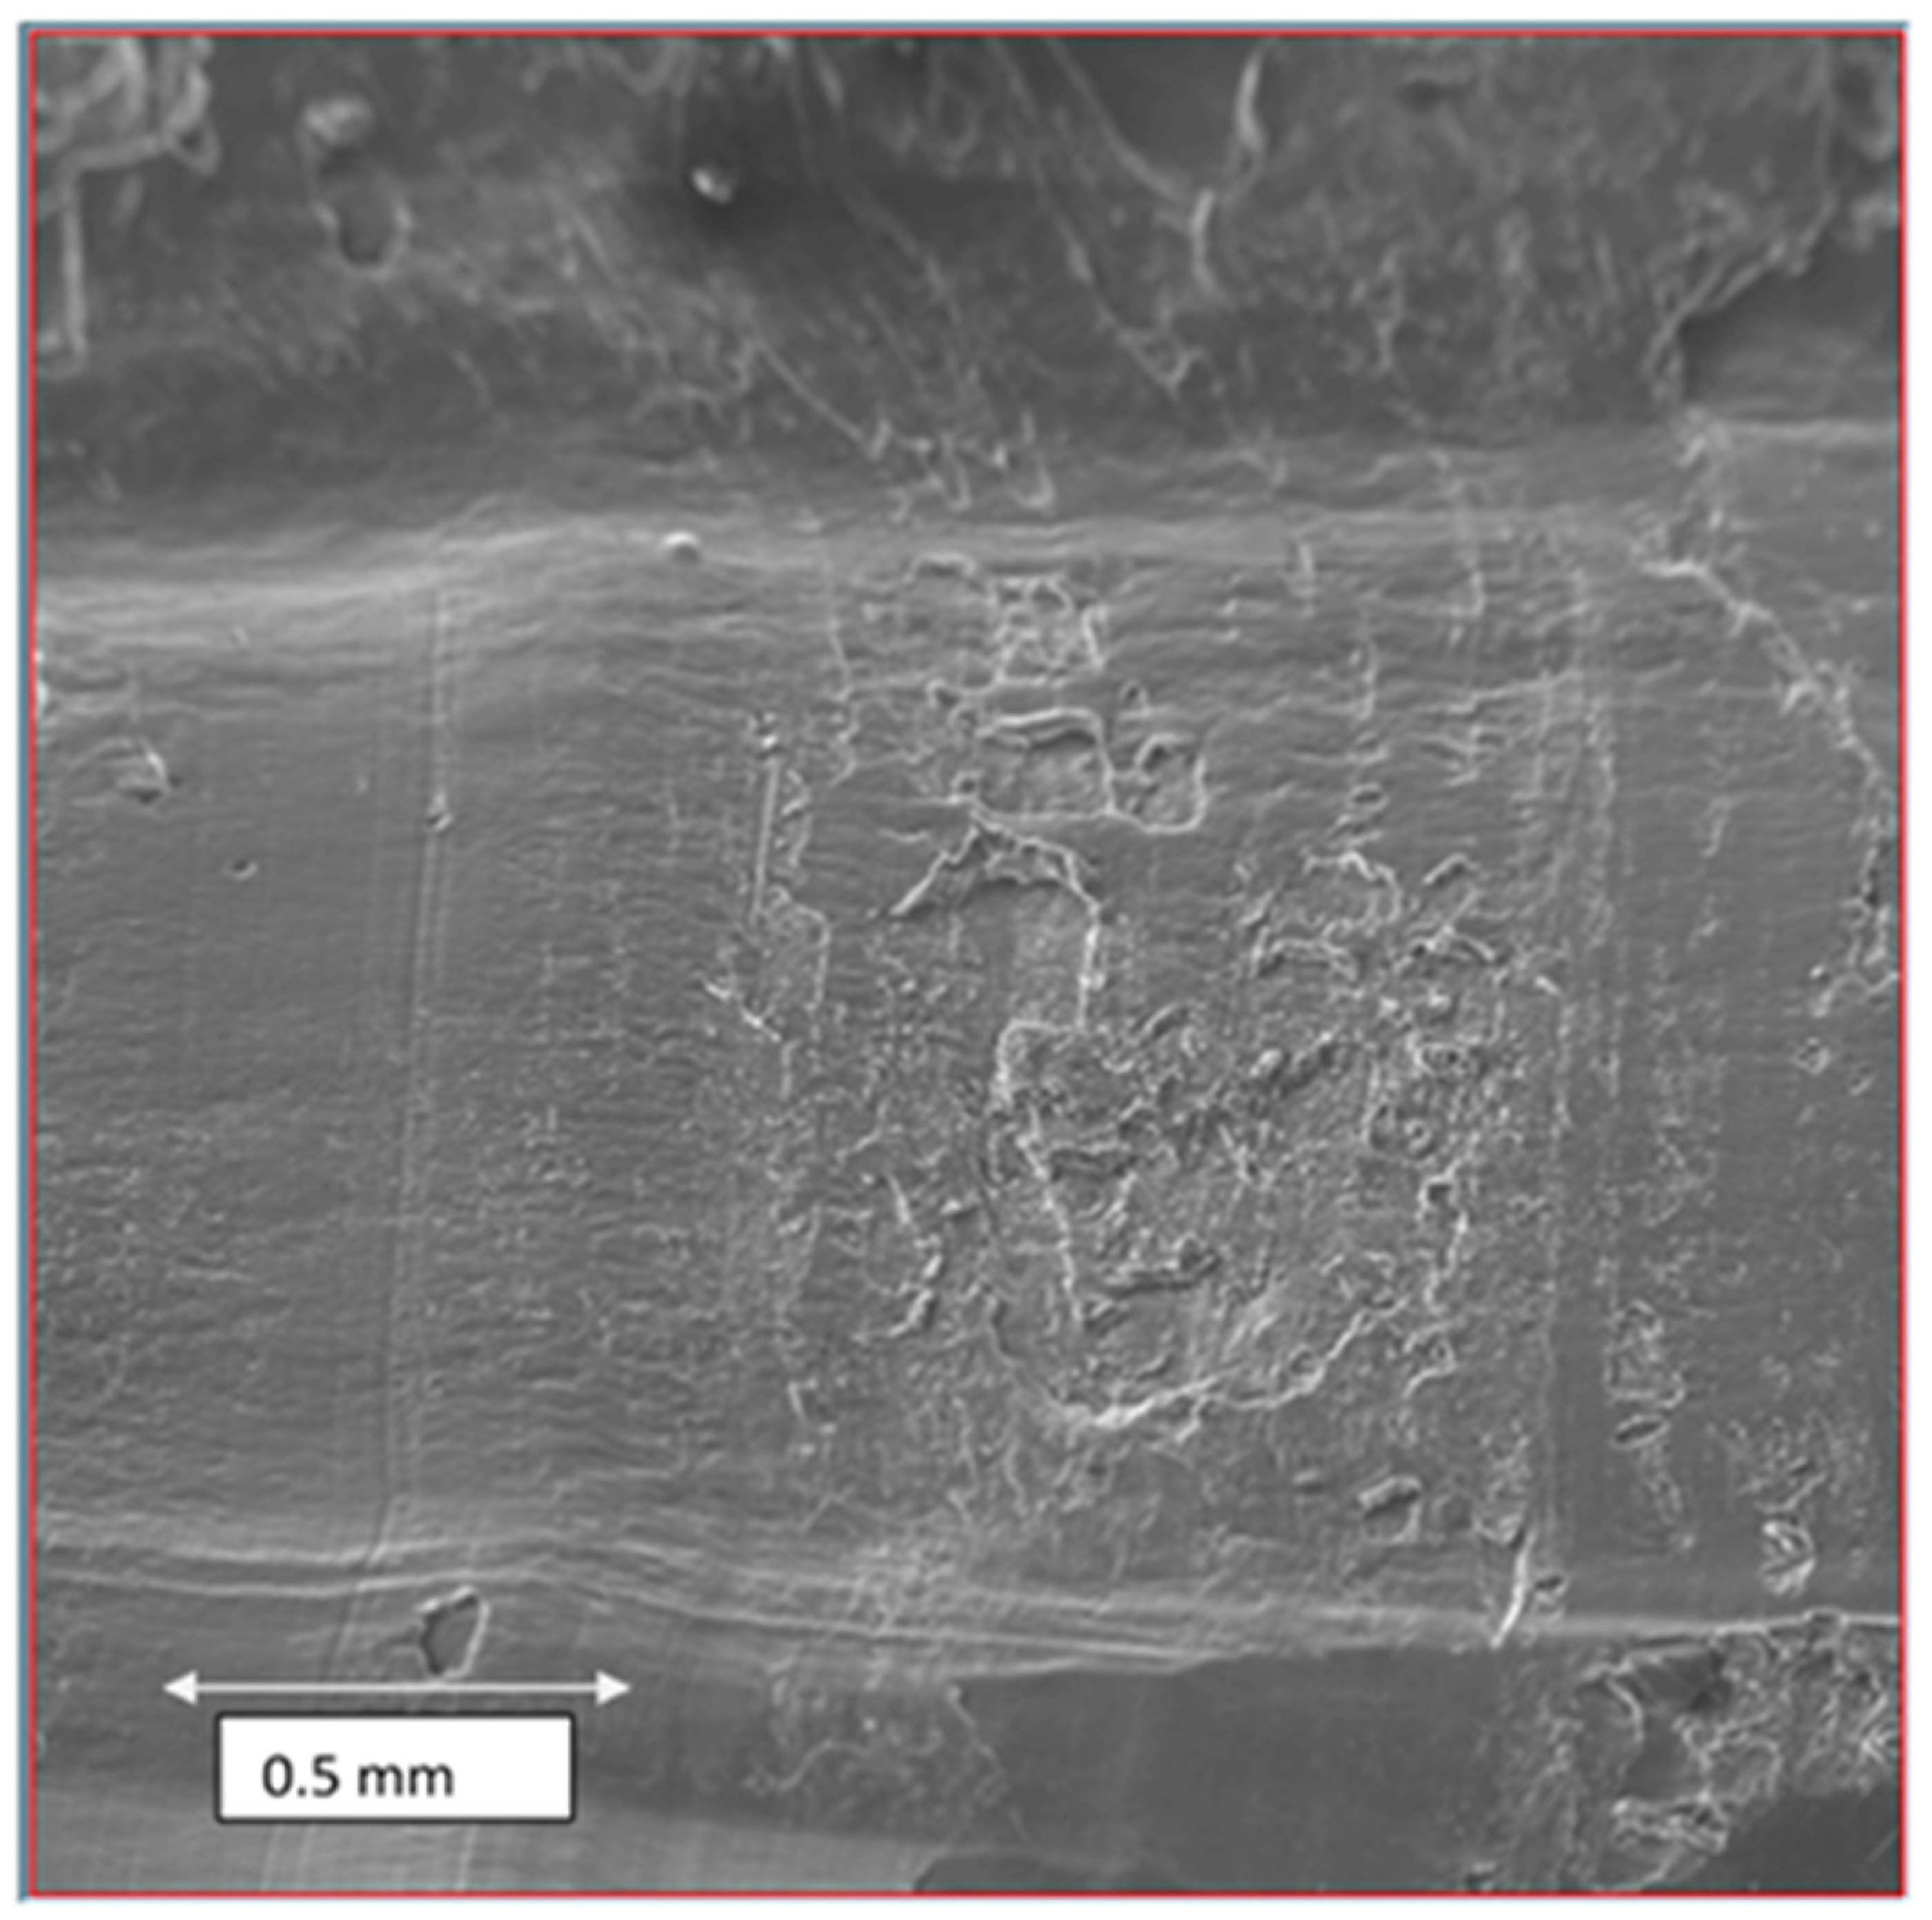
3.4. Area Dependent E-Beam Modification in AE Analysis

Whereas, according to Section 3.3, no beam damage was observed for large-area e-beam radiation, the situation for local analysis with AE spectroscopy should be more complicated [28].
To verify the observed chemical changes of the previously fluoride- and carbonate-dominated surfaces at Li foils, similar area-dependent experiments were conducted at the newly prepared Li oxide material.
Figure 10 shows a SE picture (0.8 mm × 0.8 mm) of the area under investigation; the same sample position as in Figure 6, but with higher magnification. On the left three measuring areas with different sizes are marked: 1-large (120 µm × 120 µm), 2-medium (56 µm × 56 µm), and 3-small (spot, approx. 100 nm beam diameter).
In Figure 11, AE spectra of the surface states at these areas after approx. 8 min e-beam exposure (after the measurements discussed with Figure 12) compared with a sputter-cleaned surface (sput) are shown. In the non-differentiated survey spectra (Figure 11a), a drastic decrease in the low-energy SE region is already visible. With stepwise lowering the size of the area, a change in the LiKLL peaks is observed. Clearly visible is also the decrease in carbon after sputtering. In addition, a CKLL double-peak appears in the 3-small area. Looking at the differentiated spectra in the LiKLL, OKLL, and CKLL spectral regions (Figure 11b–d), more details become visible. The LiKLL spectra for the 1-large and 2-medium areas are dominated by a double peak structure (31, 39 eV), previously assigned to various Li OX species often found at the Li surfaces [28]. For the 3-small and sput region, a new peak appears at 51 eV, which is clearly separated from the Li2O side peak at 48 eV. Previously this peak was assigned to elemental Li, which agrees also with the dominance of this peak at the sput sample. Looking at the changes in CKLL (Figure 11d), it becomes clear that at the 3-small measuring area, C did not disappear. On the contrary, the intensity and visibility in the double peak structure characteristic for metal carbides are consolidated [38,39]. Thus, the LiKLL peak observed at 51 eV can also be connected with Li carbide.
In Figure 12, cyclic measurement results of the LiKLL spectral window for the three different areas are presented. Spectra for cycle 1, 10, and 40 are shown, representing the surface state at 0, 1:50, and 7:20 min e-beam exposure time, respectively. For the 1-large area (Figure 12a), the typical Li OX double-peak structure is slowly reached, as well as the Li2O side peak at 48 eV. For the 2-medium area (Figure 12b), the spectra are similar, and only the double peak structure is visible after 2 min. For the spot (3-small) measurement (Figure 12c), the oxide-type structure (double and side peak) is fully formed already during the first cycle. After 7:20 min, the elemental (or carbide-type) peak at 52 eV is clearly visible.

4. Summary and Conclusions

This paper follows a series of experimental XPS works which have observed abnormal peak shifts in the presence of elemental Li. In our opinion, this is a major breakthrough for battery research using XPS. In recent years, some inconsistent peak position data have been published in the battery community for this reason. This was recently demonstrated by Wood et al. [27], with an impressive comparison of data from various publications. However, for a large variety of cathode materials, as well as for anode materials, the BE referencing and careful peak fitting plays an important role [31,40,41]. In a detailed review [42], possible uncertainties using the C1s BE reference of adventitious carbon have been discussed.
In our recent study, we started from more well-defined Li metal surfaces, which were not covered with Li carbonate as main species. The reaction layers formed spontaneously in the glove box atmosphere (or modified in the vacuum chambers) are thin enough that charging phenomena never influenced our measurements. As a result, we could clearly identify the species Li2O and LiOH/Li2O2 (Li carbonate after contact with air), and found that the peak positions in peak fit procedures agreed well with other publications. Furthermore, the stoichiometry of the species can be confirmed. We found very sensitive surface reactions in our vacuum analysis systems and preparation chambers, and could qualitatively explain them, depending on the vacuum conditions.
Figure 13 displays a flow chart which summarizes the main experimental procedures and the subsequent conclusions. On the left, the XPS experimental part, including the C deposition in a preparation chamber, is shown. On the right, the AES experimental part is outlined. For the XPS experiments, the C1s BEs found for C contamination and C deposit are mentioned for every partial step. In both parts, as mentioned above, the starting point was a Li oxide-dominated surface (blue color), including C contamination (light green color), found after preparation in the glove box on the Li foil (red color), i.e., a state which was preserved via Ar transport to the measuring chambers.
During the XPS measurements (left) using X-ray radiation for excitation, no change in the oxide was found, and Ar+ sputtering metal-like Li surfaces could be observed: C1s BEs were found at 288 and 285 eV, respectively. The same C1s BEs were found for the artificial C deposit (dark green color). The transfer of the metal-like surface led to the formation of Li carbonate (violet color) with a C1s BE of the C contamination at 288 eV. As for the oxide above, the same BE was found for the artificial C deposit. Low-dose Ar+ sputtering led to a conversion of the carbonate to Li2O (C1s BE remains at 288 eV), while high-dose sputtering to Li metal (C1s as above at 285 eV).
During the AES measurements (right), the e-beam exposure led to a fast (exposure-area dependent) conversion/reduction of Li carbonate up to Li metal and partially Li carbide (orange color). After Ar+ sputtering, Li metal was found. The formation of Li carbonate on air and its conversion to Li2O after sputtering was also confirmed.
For the first time, we succeeded in covering different Li-containing surfaces, from elemental Li over several oxides to carbonate, in situ with artificial thin carbon layers. This carbon on top can be used as a secure BE reference material. Using this procedure, we could completely confirm our previous findings of a nearly 3 eV peak shift of the XP peaks of insulating Li species when covering metallic Li, which was based previously on the observation of residual carbonaceous surface contamination only. Furthermore, the observation of the peak position of implanted Ar from surface cleaning by ion sputtering confirms this statement. Using such experimental procedures, the XP positions at battery material could be explicitly and exactly defined. In particular, the C60 evaporation can be simply integrated in a standard UHV analysis system.
A comparison of XPS and AES measurements at identical samples in one analysis apparatus represents a powerful tool to study both influences of residual gases and the electron beam (AES investigations) onto the sensitive Li species. Observations previously made on carbonate-dominated surfaces could be confirmed at carbonate-free and Li oxide-dominated surfaces; there is a fast decomposition of Li oxide during electron bombardment, even up to partly elemental Li. Dose-(or equivalent to an area-)dependent behavior is confirmed for these samples. The peak shape change in the carbon Auger peak points to the formation of Li carbide in the presence of the natural carbon contamination.
In summary, this work, on the one hand, makes a step towards improving XPS interpretation for Li battery materials and, on the other hand, shows how carefully the results of electron beam analysis should be interpreted when looking at such materials. As mentioned in a recent review by Cheng et al. [43], the surface properties of the Li metal surface play an instant role for safe Li metal anodes. Thus, according to our present work, we believe that sputter cleaning during Li foil production, also in combination with subsequent deposition of thin protective films, can be a step to well-defined Li anode surfaces. Such surfaces are also candidates for further studies of interaction with electrolytes [44,45,46] in order to form stable SEI films and to avoid the disadvantages of dendrite growth.

Funding

The publication of this article was funded by the Open Access Fund of the Leibniz Association.

Acknowledgments

I am indebted to T. Schmeida for preparation of the Li samples and M. Hantusch for assistance with the C60 deposition apparatus. Thanks to L. Giebeler for discussion during the preparation of the manuscript.

Conflicts of Interest

The author declares no conflict of interest.

References

  1. Daniel, C.; Besenhard, J.O. (Eds.) Handbook of Battery Materials, 2nd ed.; Wiley-VCH: Weinheim, Germany, 2011. [Google Scholar]
  2. Yabuuchi, N.; Kubota, K.; Dahbi, M.; Komaba, S. Research development on sodium-ion batteries. Chem. Rev. 2014, 114, 11636–11682. [Google Scholar] [CrossRef] [PubMed]
  3. Verma, P.; Maire, P.; Novák, P. A review of the features and analyses of the solid electrolyte interphase in Li-ion batteries. Electrochim. Acta 2010, 55, 6332–6341. [Google Scholar] [CrossRef]
  4. Peled, E.; Menkin, S. Review—SEI: Past, present and future. J. Electrochem. Soc. 2017, 164, A1703–A1719. [Google Scholar] [CrossRef]
  5. Tang, C.-Y.; Leung, K.; Haasch, R.T.; Dillon, S.J. LiMn2O4 Surface Chemistry Evolution during Cycling Revealed by in Situ Auger Electron Spectroscopy and X-ray Photoelectron Spectroscopy. ACS Appl. Mater. Interfaces 2017, 9, 33968–33978. [Google Scholar] [CrossRef] [PubMed]
  6. Tang, C.-Y.; Feng, L.; Haasch, R.T.; Dillon, S.J. Surface redox on Li[Ni1/3Mn1/3Co1/3]O2 characterized by in situ X-ray photoelectron spectroscopy and in situ Auger electron spectroscopy. Electrochim. Acta 2018, 277, 197–204. [Google Scholar] [CrossRef]
  7. Wood, N.K.; Steirer, K.X.; Hafner, S.E.; Ban, C.; Santhanagopalan, S.; Lee, S.-H.; Teeter, G. Operando X-ray photoelectron spectroscopy of solid electrolyte interphase formation and evolution in Li2S-P2S5 solid-state electrolytes. Nat. Comm. 2018, 9, 2490. [Google Scholar] [CrossRef]
  8. Abe, K.; Yoshitake, H.; Kitakur, T.; Hattori, T.; Wang, H.; Yoshio, M. Additives-containing functional electrolytes for suppressing electrolyte decomposition in lithium-ion batteries. Electrochim. Acta 2004, 49, 4613–4622. [Google Scholar] [CrossRef]
  9. Shima, M.; Tsutsumi, K.; Tanaka, A.; Onodera, H.; Tazawa, T. Quantitative Analysis of a Lithium Ion Battery Cathode Material with X-ray Photoelectron Spectroscopy and Auger Electron Spectroscopy. Microsc. Microanal. 2015, 21, 1356–1357. [Google Scholar] [CrossRef] [Green Version]
  10. Morigaki, K.-I.; Ohta, A. Analysis of the surface of lithium in organic electrolyte by atomic force microscopy, Fourier transform infrared spectroscopy and scanning Auger electron microscopy. J. Power Sources 1998, 76, 159–166. [Google Scholar] [CrossRef]
  11. Mori, S.; Asahina, H.; Suzuki, H.; Yonei, A.; Yokoto, K. Chemical properties of various organic electrolytes for lithium rechargeable batteries 1. Characterization of passivating layer formed on graphite in alkyl carbonate solutions. J. Power Sources 1997, 68, 59–64. [Google Scholar] [CrossRef]
  12. Kominato, A.; Yasukawa, E.; Sato, N.; Ijuuin, T.; Asahina, H.; Mori, S. Analysis of surface films on lithium in various organic electrolytes. J. Power Sources 1997, 68, 471–475. [Google Scholar] [CrossRef]
  13. Kalaga, K.; Shkro, I.A.; Haasch, R.T.; Peebles, C.; Bareño, J.; Abraham, D.P. Auger Electrons as Probes for Composite Micro- and Nanostructured Materials: Application to Solid Electrolyte Interphases in Graphite and Silicon-Graphite Electrodes. J. Phys. Chem. C 2017, 121, 23333–23346. [Google Scholar] [CrossRef]
  14. Pantano, C.G.; Madey, T.E. Electron beam damage in Auger electron spectroscopy. Appl. Surf. Sci. 1981, 7, 115–141. [Google Scholar] [CrossRef]
  15. Ohuchi, F.; Oginot, M.; Holloway, P.H.; Pantano, C.G., Jr. Electron Beam Effects During Analysis of Glass Thin Films with Auger Electron Spectroscopy. Surf. Interface Anal. 1980, 2, 85–90. [Google Scholar] [CrossRef]
  16. Ishida, N.; Fujita, D. Chemical-state imaging of Li using scanning Auger electron microscopy. J. Electron Spectrosc. Relat. Phenom. 2013, 186, 39–43. [Google Scholar] [CrossRef]
  17. Wang, X.; Zhang, M.; Alvarado, J.; Wang, S.; Sina, M.; Lu, B.; Bouwer, J.; Xu, W.; Xiao, J.; Zhang, J.G.; et al. New Insights on the Structure of Electrochemically Deposited Lithium Metal and Its Solid Electrolyte Interphases via Cryogenic TEM. Nano Lett. 2017, 17, 7606–7612. [Google Scholar] [CrossRef]
  18. Li, Y.; Li, Y.; Pei, A.; Yan, K.; Sun, Y.; Wu, C.L.; Joubert, L.M.; Chin, R.; Koh, A.L.; Yu, Y.; et al. Atomic Structure of Sensitive. Battery Materials and Interfaces Revealed by Cryo−Electron Microscopy. Science 2017, 358, 506–510. [Google Scholar] [CrossRef] [PubMed] [Green Version]
  19. Lee, J.Z.; Wynn, T.A.; Schroeder, M.A.; Alvarado, J.; Wang, X.; Xu, K.; Meng, Y.S. Cryogenic Focused Ion Beam Characterization of Lithium Metal Anodes. ACS Energy Lett. 2019, 4, 489–493. [Google Scholar] [CrossRef] [Green Version]
  20. Liu, P.; Mitlin, D. Emerging Potassium Metal Anodes: Perspectives on Control of the Electrochemical Interfaces. Acc. Chem. Res. 2020, 53, 1161–1175. [Google Scholar] [CrossRef]
  21. Zheng, J.; Archer, L.A. Controlling electrochemical growth of metallic zinc electrodes: Toward affordable rechargeable energy storage systems. Sci. Adv. 2021, 7, eabe0219. [Google Scholar] [CrossRef] [PubMed]
  22. Lin, M.-C.; Gong, M.; Lu, B.; Wu, Y.; Wang, D.Y.; Guan, M.; Angell, M.; Chen, C.; Yang, J.; Hwang, B.-J.; et al. An ultrafast rechargeable aluminium-ion battery. Nature 2015, 520, 325–328. [Google Scholar] [CrossRef] [PubMed]
  23. Li, D.; Yuan, Y.; Liu, J.; Fichtner, M.; Pan, F. A review on current anode materials for rechargeable Mg batteries. J. Magnes. Alloys 2020, 8, 963–979. [Google Scholar] [CrossRef]
  24. Oswald, S. Binding energy referencing for XPS in alkali metal-based battery materials research (I): Basic model investigations. Appl. Surf. Sci. 2015, 351, 492–503. [Google Scholar] [CrossRef]
  25. Maibach, J.; Lindgren, F.; Eriksson, H.; Edström, K.; Hahlin, M. Electric Potential Gradient at the Buried Interface between Lithium-Ion Battery Electrodes and the SEI Observed Using Photoelectron Spectroscopy. J. Phys. Chem. Lett. 2016, 7, 1775–1780. [Google Scholar] [CrossRef] [PubMed] [Green Version]
  26. Lindgren, F.; Rehnlund, D.; Källquist, I.; Nyholm, L.; Edström, K.; Hahlin, M.; Maibach, J. Breaking Down a Complex System: Interpreting PES Peak Positions for Cycled Li-Ion Battery Electrodes. J. Phys. Chem. C 2017, 121, 27303–27312. [Google Scholar] [CrossRef]
  27. Wood, K.N.; Teeter, G. XPS on Li-Battery-Related Compounds: Analysis of Inorganic SEI Phases and a Methodology for Charge Correction. ACS Appl. Energy Mater. 2018, 1, 4493–4504. [Google Scholar] [CrossRef] [Green Version]
  28. Hoffmann, M. Auger Elektronenspektroskopie an Lithium. Ph.D. Thesis, Technische Universität Dresden, Dresden, Germany, 2019. [Google Scholar]
  29. Hoffmann, M.; Oswald, S.; Zier, M.; Eckert, J. Auger and X-ray photoelectron spectroscopy on lithiated HOPG. Surf. Interface Anal. 2016, 48, 501–504. [Google Scholar] [CrossRef]
  30. Hoffmann, M.; Zier, M.; Oswald, S.; Eckert, J. Challenges for lithium species identification in complementary Auger and X-ray photoelectron spectroscopy. J. Power Sources 2015, 288, 434–440. [Google Scholar] [CrossRef]
  31. Oswald, S.; Thoss, F.; Zier, M.; Hoffmann, M.; Jaumann, T.; Herklotz, M.; Nikolowski, K.; Scheiba, F.; Kohl, M.; Giebeler, L.; et al. Binding Energy Referencing for XPS in Alkali Metal-Based Battery Materials Research (II): Application to Complex Composite Electrodes. Batteries 2018, 4, 36. [Google Scholar] [CrossRef] [Green Version]
  32. Oswald, S.; Hoffmann, M.; Zier, M. Peak position differences observed during XPS sputter depth profiling of the SEI on lithiated and delithiated carbon-based anode material for Li-ion batteries. Appl. Surf. Sci. 2017, 401, 408–413. [Google Scholar] [CrossRef]
  33. Vogel, U.; Brachmann, E.; Oswald, S.; Menzel, S.; Gemming, T.; Eckert, J. Evaluation of a mobile vacuum transfer system for in vacuo XPS analysis using as-deposited Ti thin-films. Vacuum 2015, 117, 81–84. [Google Scholar] [CrossRef]
  34. Vogel, U. Grenzflächenausbildung zwischen LiNbO3 (LiTaO3) und Barriereschichten für den Einsatz bei Metallisierungssystemen für SAW-Strukturen. Ph.D. Thesis, Technische Universität Dresden, Dresden, Germany, 2016. [Google Scholar]
  35. MultiPak, Software Package, V. 9.5; ULVAC-PHI: Osaka, Japan, 1994–2014.
  36. Kozen, A.C.; Pearse, A.J.; Lin, C.-F.; Schroeder, M.A.; Noked, M.; Lee, S.B.; Rubloff, G.W. Atomic layer deposition and in situ characterization of ultraclean lithium oxide and Lithium hydroxide. J. Phys. Chem. 2014, 118, 27749–27753. [Google Scholar] [CrossRef]
  37. Yao, K.P.C.; Kwabi, D.G.; Quinlan, R.A.; Mansour, A.N.; Grimaud, A.; Lee, Y.-L.; Lu, Y.-C.; Shao-Horn, Y. Thermal Stability of Li2O2 and Li2O for Li-Air Batteries: In Situ XRD and XPS Studies. J. Electrochem. Soc. 2013, 160, A824–A831. [Google Scholar] [CrossRef]
  38. Lesiak, B.; Mrozek, P.; Jablonski, A.; Jozwik, A. Analysis of the Auger KLL Spectra of Carbon by the Pattern Recognition Method. Surf. Interface Anal. 1986, 8, 121–126. [Google Scholar] [CrossRef]
  39. Smetyukhova, T.N.; Druzhinin, A.V.; Podgorny, D.A. Features of the Auger Spectra of Ti2C, SiC, and WC. J. Surf. Investig. X-ray Synchrotron Neutron Tech. 2017, 11, 414–419. [Google Scholar] [CrossRef]
  40. Bondarchuk, O.; LaGrow, A.P.; Kvasha, A.; Thieu, T.; Ayerbe, E.; Urdampilleta, I. On the X-ray photoelectron spectroscopy analysis of LiNixMnyCozO2 material and electrodes. Appl. Surf. Sci. 2021, 535, 147699. [Google Scholar] [CrossRef]
  41. Azmi, R.; Trouillet, V.; Strafela, M.; Ulrich, S.; Ehrenberg, H.; Bruns, M. Surface analytical approaches to reliably characterize lithium ion battery electrodes. Surf. Interface Anal. 2018, 50, 43–51. [Google Scholar] [CrossRef]
  42. Greczynski, G.; Hultman, L. X-ray photoelectron spectroscopy: Towards reliable binding energy referencing. Prog. Mater. Sci. 2020, 107, 100591. [Google Scholar] [CrossRef]
  43. Cheng, X.B.; Zhang, R.; Zhao, C.-Z.; Zhang, Q. Toward Safe Lithium Metal Anode in Rechargeable Batteries: A Review. Chem. Rev. 2017, 117, 10403–10473. [Google Scholar] [CrossRef]
  44. Maibach, J.; Källquist, I.; Andersson, M.; Urpelainen, S.; Edström, K.; Rensmo, H.; Siegbahn, H.; Hahlin, M. Probing a battery electrolyte drop with ambient pressure photoelectron spectroscopy. Nat. Commun. 2019, 10, 3080. [Google Scholar] [CrossRef] [Green Version]
  45. Wang, A.; Kadam, S.; Li, H.; Shi, S.; Qi, Y. Review on modeling of the anode solid electrolyte interphase (SEI) for lithium-ion batteries. NPJ Comput. Mater. 2018, 4, 15. [Google Scholar] [CrossRef] [Green Version]
  46. Menkin, S.; O’Keefe, C.A.; Gunnarsdóttir, A.B.; Dey, S.; Pesci, F.M.; Shen, Z.; Aguadero, A.; Grey, C.P. Toward an Understanding of SEI Formation and Lithium Plating on Copper in Anode-Free Batteries. J. Phys. Chem. C 2021, 125, 16719–16732. [Google Scholar] [CrossRef] [PubMed]
Figure 2. XP spectra (a)—Li1s spectra, (b)—O1s spectra, (c)—C1s spectra normalized in intensity of a native Li foil (C-nat) from the glove box and after short contact to air (C-air) measured in the JEOL JAMP 9500 system. As in Figure 1, at the beginning, a mixture of LiOH and Li2O is found (b), and Li2CO3 dominates the surface after contact to air (c). The influence of the residual atmosphere (C-7d = one week in the analysis chamber at 3 × 10⁻⁷ Pa; C-intro = in the intro chamber at 1 × 10⁻⁴ Pa after sputter cleaning) is visible with a change in the LiOH/Li2O ratio and the occurrence of Li2CO3. The C species are found at the high BE positions (c).
Batteries 08 00024 g002
Figure 3. XP spectra (a)—Li1s spectra, (b)—O1s spectra, (c)—C1s spectra, (d)—Ar2p spectra normalized in intensity of a native Li foil (B-nat) from the glove box and after some sample treatment measured in the JEOL JAMP 9500 system. After Ar+ sputter cleaning (B-sput), elemental Li is visible (a), high-vacuum (B-prep = 3 × 10⁻⁶ Pa) reoxidation starts (b), and air carbonate is formed (B-air) (c). The C species are found at the low BE positions only at the elemental Li-containing samples (c).
Batteries 08 00024 g003
Figure 4. XP spectra (a)—Li1s spectra, (b)—O1s spectra, (c)—C1s spectra, (d)—Ar2p spectra normalized in intensity of the sample states presented already in Figure 3 after decoration with artificial thin carbon films in the preparation chambers. The additional carbon species for the oxide and carbonate (B-nat, B-air)-dominated samples are in a high BE position (288 eV), in a normal low BE position (285 eV) for the sputter cleaned sample (B-sput), and in an intermediate position (286.5 eV) for the partly reoxidized sample (B-prep) (c).
Batteries 08 00024 g004
Figure 5. SE image of the freshly cut Li sample measured in the JEOL JAMP 9500 F system. The area represents the area for collecting the XP spectral results for Figure 2 and Figure 6.
Batteries 08 00024 g005
Figure 6. XP spectra (a)—Li1s spectra, (b)—O1s spectra, (c)—C1s spectra normalized in intensity of a series of different sample treatments carried out in the JEOL JAMP 9500 system. Holding the fresh sample (C-nat) for one week in the analysis chamber (C-7d) leads to Li2O formation (b). No changes are observed after large-area e-beam radiation (C-e-beam). With low-dose Ar+ radiation (C-10 min Ar+), the change in LiOH to Li2O is observed (b); with higher dose (C-20 min Ar+), partial elemental Li also becomes visible (a).
Batteries 08 00024 g006
Figure 7. AE spectra (a)—non-differentiated survey spectra, (b)—differentiated LiKLL spectra, (c)—differentiated CKLL spectra) from a 1 mm × 1 mm area for sample states presented already in Figure 6 are shown. After sputtering, a clear decrease in the C and O signals is observed (a,c). For the high-dose sample (C-20 min Ar+), the LiKLL spectrum (differentiated data in Figure 7b) is dominated by a new peak at 52 eV, attributed to elemental Li.
Batteries 08 00024 g007
Figure 8. AE spectra (a)—LiKLL spectra, (b)—OKLL spectra, (c)—CKLL spectra; all differentiated) of 3 different sample states for comparison with XP spectra (see Figure 9) at the same samples: sputter cleaned sample (C-20 min Ar+), sample on air (C-air), and sample from air sputter cleaned (C-air/sput). Changes, as expected, can be observed: elemental Li (a), Li carbonate, and decomposition to Li2O (a,b).
Batteries 08 00024 g008
Figure 9. XP spectra (a)—Li1s spectra, (b)—O1s spectra, (c)—C1s spectra, (d)—X-ray excited LiKLL AE spectral region; as measured, (e)—X-ray excited LiKLL AE spectral region; differentiated normalized in intensity of 3 different sample states for comparison with AE spectra (see Figure 8) at the same samples: sputter cleaned sample (C-20 min Ar+), sample on air (C-air), and sample from air sputter cleaned (C-air/sput). Changes as expected can be observed: elemental Li, Li carbonate, decomposition to Li2O (a,b). Carbon contamination is only in the sputter cleaned sample (C-20min Ar+) in low BE position (c). In the sputter-cleaned sample, the X-ray-excited LiKLL Auger peak for elemental Li at around 51 eV (e) can be observed.
Batteries 08 00024 g009
Figure 10. SE picture of the region under investigation (area from Figure 6, with higher magnification). Three measurement areas of different size are marked (1-large, 2-medium, and 3-small); spectra results are seen in Figure 11 and Figure 12.
Batteries 08 00024 g010
Figure 11. AE spectra (a)—non-differentiated survey spectra, (b)—differentiated LiKLL spectra, (c)—differentiated OKll spectra, (d)—differentiated CKLL spectra for the 3 measurement areas marked in Figure 10 and a sputter-cleansed sample (sput). For LiKLL, besides the typical peaks (31, 39eV) of Li-OX species for the spot measurement and the sputter cleaned sample, an elemental Li peak (51 eV) is found (b). In the CKLL spectra, for the spot measurement, a peak behavior similar to metal carbide can be observed (d).
Batteries 08 00024 g011
Figure 12. Series of LiKLL AE spectra (a)—large radiation area, (b)—medium radiation area, (c)—small radiation area; all spectra are differentiated) for the 3 measurement areas marked in Figure 10 are shown. Spectra after different number of measurement cycles (1, 10, and 40 cycles), representing 0, 1:50, and 7:20 min exposure time, respectively, are plotted. Spectral changes coming from beam-induced oxide damage are faster for low-area exposure (b,c), resulting in partial formation of elemental Li for the spot measurement (c).
Batteries 08 00024 g012
Figure 13. Schematic view of the experimental procedures with the main results. On the right side, the AES measuring procedures are outlined; on the left side, the XPS procedures, including the implementation of deposition of artificial C in a preparation chamber, are outlined. The C1s BE positions found for C contamination and the C deposit are given as numbers; the identified chemical species are coded with color boxes: red—Li metal, blue—Li oxide, orange—Li metal–Li carbide, light green—C contamination, and dark green—C deposit.
Batteries 08 00024 g013
Publisher’s Note: MDPI stays neutral with regard to jurisdictional claims in published maps and institutional affiliations.

