Article

Influence of Switching on the Aging of High Power Lithium-Ion Cells

Research Group Electromobility and Learning Systems, Technische Hochschule Ingolstadt, D-85049 Ingolstadt, Germany
*
Author to whom correspondence should be addressed.
Batteries 2022, 8(4), 33; https://doi.org/10.3390/batteries8040033
Submission received: 22 February 2022 / Revised: 23 March 2022 / Accepted: 29 March 2022 / Published: 12 April 2022

Abstract

:
For intelligent battery systems that are able to control the current flow for each individual cell, the multilevel inverter is an interesting approach to replace the bidirectional AC/DC-converter and improve flexibility of charging system and signal quality in both directions. Therefore, the cells are modulated by switching varying the duty cycle, the current and the frequency up to the kHz-range. This is only beneficial if the switching does not lead to a significant additional aging. The scientific gap to assess and understand the impact of switching is investigated in this paper by testing 22 high-power 18650 lithium-ion cells (Samsung 25R). The cells are tested at 50 Hz and 10 kHz switching frequency during charge, discharge and charge/discharge at 50% duty cycle. The tests are compared to eight reference tests with continuous current flow performed at the average and the maximum current for charge and discharge, respectively. The results are obtained by evaluating the remaining capacity, resistance, electrochemical impedance spectroscopy and dV/dQ analysis. Before reaching rollover, the investigated cells lose homogeneity and cathode capacity but no significant difference for the aging parameters are found. After rollover, the cell-to-cell variation is greater than the aging induced by the different cycling parameters.

Graphical Abstract

1. Introduction

The application of multilevel inverters (MLI) in high voltage batteries has gained increased attention in research [1,2,3] and industry (e.g., SAX Power Systems, STABL Energy). Using MLI, a higher signal quality of the voltage output is obtainable. The application benefits from the modularity of the MLI and the high efficiency especially in partial load situations [4,5]. Moreover, MLI provides the flexibility for charging station with respect to voltage level, DC or AC and bidirectional charging [6,7].
For the MLI battery application, the batteries need to be modulated. Therefore, each cell or module can be switched on or bypassed by MOSFET bridges [8]. In real applications of the duty cycle, the frequency and the current rate vary over time. These parameters thereby vary for the specific application, operation point and MLI topology. However, to date, there is an open question as to whether the switching has a negative impact on the battery lifetime.
So far, to best of our knowledge, there are only two publications by Uno et al. [9] and by Chang et al. [10] that investigate the influence of MLI-like profiles on the cell lifetime. Uno et al. [9] investigated 24 2 Ah LiCoO2/Graphite cells with a square wave current with an amplitude of ±1 A and varying the frequency from 1 Hz to 100 kHz. At frequencies of higher than 100 Hz, no additional aging was measured as the ripple current mainly charges and discharges the electrochemical double layers. For frequencies of 10 Hz or lower, an additional capacity drop of about 7% was observed due to micro cycles. Therefore, Uno et al. concluded that ripples in cascaded multilevel topologies are significantly detrimental to the batteries when the frequency is lower than the corner frequency.
Chang et al. [10] tested five 3 Ah-NMC/Graphite cells at switching frequencies of 2 and 10 kHz. The experiment showed that the current ripple in the cascaded H-bridge (CHB) had no influence on internal resistance but increased the capacity reduction of the battery cells by 2.1%, independent of the applied frequency. Finally, they suggested that switching is harmful if it contains micro cycles combined with a high charge throughput or a higher RMS (root mean squared) at a frequency of lower than 10 Hz.
A review was published by Qin et al. [11] studying fundamental Li-metal deposition to a real world application to stabilize the grid or to achieve fast charging. However, the question of appropriate reference tests and issues to compare the aging of pulsed and not pulsed scenarios are not addressed in this review.
Beside these publications, there are several publications that research the influence of current ripples and pulsed fast charging. The outcomes are very contradictory, since different publications report that pulsing in the kHz range has a negative [12], no significant [13] or a positive [14] effect on aging. Korth Pereira Ferraz et al. [15] found a slightly stronger capacity retention for 5 kHz at a 10% depth-of-discharge (DOD) while no impact was observed for cycling at 100% DOD. Thus, a clear understanding of the influence of switching and fast current variation is still missing. In our opinion, the controversy generally arises from the fact that there is no straight-forward reference measurement protocol that allows for a direct comparison. Thereby, the selection of the reference measurement conditions has a crucial impact on the outcome if current ripples and pulses are harmful to the lithium-ion cells.
This publication is aimed at closing the gap regarding the influence of uniform switching operations on the service life of the cell as a first step towards MLI application. Therefore, a high power 18650 cell is investigated by varying the frequency and the switching depending on charging and discharging direction. To assess the difference to a non-MLI application, multiple reference tests are performed. By varying the test parameters, the average and the maximum currents deviate alongside the test time and with this the cell temperature. Our approach is to compare the switching test results with several constant current reference tests that are conducted at average or maximum current reached during switching to assess the main dependences of this cell type.
The paper begins by presenting the reference test results in Section 3.1. These results are then compared to switching tests at 50 Hz in Section 3.2 by evaluating the capacity, resistance, differential voltage analysis and electrochemical impedance spectroscopy over aging. Finally, the reference cells are compared to 50 Hz and 10 kHz switches during discharging in Section 3.3.

2. Materials and Methods

In this experimental set-up, 22 cylindrical 18650 cells of the type Samsung 25R were investigated. The two-battery cell test benches from Arbin Instruments 0–5 V were used. The LBT21084 system is limited to 60 A and the LBTa2030 system to 5 A.
The cells were placed in a Binder temperature chamber (KB 115). All tests ere performed at a constant chamber temperature of 30 °C. In the work from Lain et al. [16] a post mortem study for the used cells was conducted. The results of their work and the cell datasheet are listed in Table 1. By comparing the dV/dQ analysis (see Figure 6) to Keil et al. [17], we assume that due to a clear additional peak at high state-of-charge (SOC)the major fraction of the cathode consists of NCA (Li(Ni0.8Co0.15Al0.05)O2).
The test cells passed the following test schedule. First, as displayed in Figure 1, the check-up starts with a CCCV (constant current constant voltage) charge at 1 C and up to 4.2 V, until the current drops below 0.25 A (0.1 C). After a 15 min break, a 1 C (2.5 A) discharge down to 2.5 V is executed, followed by another 15 min break before the cell is recharged with 1 C CCCV up to 4.2 V. After another 15 min break, the cells are discharged and charged with 0.1 C (0.25 A) in a constant current mode. In the next step, two pulse tests are performed at 4.2 V and 3.7 V to determine the internal resistance. The internal resistance is calculated after a 2.5 A pulse by evaluating the voltage drop after 10 s. After the pulse test, the cells are fully discharged at 0.1 C to 2.5 V.
The cells are aged by cycling according to the test matrix in Table 2. At first, the cells are fully charged with the current Imax(cha) specified in the test matrix. Instead of a constant voltage phase, the cells are further charged with a lower current rate of 0.2 C (0.5 A). Then, the cells are discharged with the current Imax(dsc) provided in the second column of Table 2. The bold numbers refer to pulsed currents. To assess the significance of the maximum and the average current to aging, four different reference tests are performed. They cover the maximum and the average charge and discharge current (Table 2).
The reference tests were then compared for three different scenarios of pulsed charging, pulsed discharging and pulsed charging/discharging according to Table 2. The switching frequency was found to be 50 Hz, which is the limit that can be realized solely with the used Arbin test benches. The duty cycle was set to 50%. Thus, the current rate during pulsing is half the current rate in average. Every 50 cycles the check-up was repeated.
By comparing the influence of switching frequency, additional tests were performed at a frequency of 10 kHz during discharge. Therefore, we designed a switching board controlled by a digital I/O. The setup of the switching board with the connected test bench by means of the voltage and current sensors and auxiliary board is demonstrated graphically in Figure 2a. The used switching board consists of a 12 V voltage source, a plus and minus pole and a third switched pole. The voltage (sense+, sense−) was measured directly at the poles of the cell, whereas the current carrying connections (I+, I−) were attached to the negative pole and the switched plus pole of the board. The cells were soldered on an auxiliary board. Finally, the switching board was mounted on top. The ground of the switching board was connected with the ground of the auxiliary board and the digital output of the test bench was connected via a pull-up resistor on the auxiliary board with the digital input of switching board. A photograph of the test setup is given in Figure 2b.
With an oscilloscope and a current probe CP030A, the cell current during switching was measured. To avoid current peaks of significantly higher than the maximum current of 5 A, an inductor with an inductance of 56 µH was found to be optimum and was included in the test setup. The currents obtained with 56, 100 and 560 µH for switching with 10 kHz are presented in Figure 3.

3. Results and Discussion

3.1. Reference Tests

Since there is no direct reference test that is generally comparable to the switching protocols, the cells were subjected to various C-rates corresponding to the maximum and average C-rate occurring during the pulsed aging tests. In Figure 4, the relative discharge capacity at 1 C and the relative internal resistance are presented as a function of the full cycle equivalents (FCE) for the cells. The cells were cycled for 600 FCE until a remaining capacity of less than 80% was reached. A clear effect of the anode overhang is observed in the first 100 FCE by an initial drop in the capacity for all cells. According to previous studies, the overhang effect occurs as intercalated lithium-ions migrate from the active anode to the anode overhang due to the SOC-induced potential difference within the anode [18,19]. This effect is apparent for fresh cells, with low delivery SOC or when cells are stored for a long time at a SOC of lower than the average SOC during check-up or cycling. The following part shows a linear capacity decline during the first 400 FCE for all cells independent of the aging protocol. After 400–450 FCE, a knee point is apparent, whereby the capacity decrease shows steeper slope. After the knee point, the trends split into two groups; however, a clear dependence of the charge or discharge currents is not apparent. Lewerenz et al. [19] explained in their work that the linear-like part is associated in general to normal aging such as in SEI formation, whereas the fast decline is linked to a massive deactivation of an active surface by massive lithium plating, dense covering layer formation or strong gas formation.
The relative internal resistance, measured after ten seconds of the pulse test at 3.7 V, shows a linear increase until about 400 full cycle equivalents (FCE), followed by a stronger increase. At up to 400 FCE, there is no significant difference in the pulse resistance values between all test conditions. Except for the anode overhang effect at the beginning of the tests, the results of the pulse measurements correlate strongly with the irreversible capacity losses. All reference cells reach their typical end of life with a 200% resistance increase and with 80% remaining capacity at about 450–550 FCE.
Thus, we conclude that the aging represented by the linear-like part is independent of the magnitude of the applied charge and discharge currents for the studied cells. However, previous studies reported that for high-energy NCA cells, capacity fade decreases with an increasing discharge rate [20]. We attribute this discrepancy to the high power capability of the cells examined within this study. Moreover, according to the literature [16], the studied cell contains a fraction of NMC on the cathode that may improve their aging behavior.

3.2. Switching Tests at 50 Hz

3.2.1. Capacity and Internal Resistance

In Figure 5, the relative discharge capacity at 1 C (a) and the relative internal resistance (b) is presented for the nine pulsed cells operated with current switching at 50 Hz. All cells have a maximum charge current of 2.5 A (1 C) and discharge current of 5 A (2 C). Similar to the reference cells, the first 100 FCE of the plot depicts a transient phase due to the overhang effect. In the following section, the slope of the linear-like part of the capacity curve is nearly constant from 100 FCE to 400 FCE and shows a strong spreading after 400 FCE. Thus, the first 400 FCE are not significantly influenced by all three switching strategies or cell-to-cell variations, similar to the findings obtained from reference tests.
The cells pulsed during charge reach 80% SOH at 505 FCE, the cells pulsed during discharge between 445 FCE and 495 FCE and the cells pulsed during charge/discharge do so at 455 FCE. Thus, the pulsed charge curves exhibit the highest remaining capacity. The cells pulsed during discharge display the highest cell-to-cell variation. By comparing the switching with the reference tests, we found no clear dependence of the average or maximum charging current during the rollover part.
Similar to the reference test, for the cells aged with switching protocols, the relative resistance shows a linear increase of up to 400 FCE, ensued by a higher increase. Here, the gradients of all curves independent of their switching strategies remain constant. After 400 FCE, the cells pulsed during charge/discharge exhibit the strongest increase in resistance, followed by the cells pulsed during discharge. The cells pulsed during charge show the smallest increase in resistance until the end of the test is reached. The trend of resistance correlates strongly to the capacity loss.
We conclude that until about 400 FCE, no significant difference between the pulsed tests and the reference tests are observed. After rollover, the cell-to-cell variations are as high as the spread by the aging conditions. This is supported by the contradicting results for reference cells and pulse tests. For the reference cells, a higher charging current is found to be beneficial. For pulsing for cha and cha/dsc, the lowest average charge current is achieved, whereby the aging results demonstrate the highest and the lowest aging values.

3.2.2. Differential Voltage Analysis

To evaluate the aging behavior of the cells phenomenologically, a differential voltage analysis (DVA) of the charging sequence at 0.1 C was performed. The results of the full cell DVA is plotted in solid black and is shown in Figure 6a. The DVA shows four characteristic points, where two of them belong to the anode and two to the cathode. The corresponding half-cell curves are provide in blue for the cathode and in red for the anode. The DVA pattern was evaluated by fitting the characteristic peaks of the full cell and the half-cell curves by stretching and shifting the half-cell curves. The loss of active material in the anode correlates to the distance between the first peak on the left and the minimum in the middle. The loss of active material in the cathode is associated with the distance between the minimum and the maximum on the right. By comparing the distances between these characteristics relative to the initial curve, we calculated the percentage difference in the losses or in the slippage between anode and cathode [21]. The DVA trends over aging are shown in Figure 6b and c exemplarily. Over aging, the shape of the DVA is not preserved as it is visualized by the deviation of the solid to the dashed black curve representing the sum of anode and cathode half-cell curves. The shape loss is caused by a reduced homogeneity of lithium distribution (HLD) over the electrode area as reported previously by Lewerenz et al. [19,22]. This lower HLD can be attributed to meta-stable SOC distribution after cycling at high currents [23,24,25] and/or by local strong aging leading to, e.g., the evolution of dense µm-thick cover layers [26] (passivated lithium metal deposition). The HLD is measured here by the ratio MinHiy of the actual peak height at ca. 1.5 Ah (solid line) and the expected peak height after shifting and stretching the half-cell curves (dashed line). MinHiy is therefore a measure for the HLD as well as the reliability of the fit for the DVA aging parameters.
The total loss of lithium inventory (LLI), quantified by the slippage between anode and cathode curves, is displayed in Figure 7a. The homogeneity of lithium distribution (HLD) or lateral SOC coherence during charge is displayed in Figure 7b. The normalized loss of active material in the cathode is provided in Figure 7c, and the loss of active material in the anode is shown in Figure 7d. The evaluated data of the pulsed protocols are compared to the reference cells. Thereby, the results of the seven reference cells are averaged and summarized.
LLI usually occurs due to irreversible reactions such as surface film formation, electrolyte decomposition and lithium plating [27]. As a consequence, active lithium-ions are no longer available and the capacity of the cell is fading. For this cell chemistry, elevated temperatures, high SOC and high charging currents typically increase LLI [28]. Due to derating down to 0.2 C at the end of charge for all switching tests, the upper voltage and the maximum charge currents during switching have no relevant influence on the LLI. As the additional resistive heating during cycling for all test strategies remains below 5 K, the temperature does not influence LLI magnitude by the C-rate or switching strategy.
The LAM of the anode and cathode in Figure 7c,d show an initial drop from the first to the second check-up. Thereafter, the curves present a linear behavior. The drop is likely linked to charge redistribution due to the anode overhang effect and is therefore not associated with the aging of active materials.
The results of the LAM at the cathode show a similar and strong degradation for all aging protocols (Figure 7c). As cathode aging is mainly influenced by the temperature and periods at higher SOCs during cycling, the aging is not expected to differ significantly. The reasons are low resistive heat and the same derating phase without switching, as outlined before. This is confirmed by similar trends over all test protocols. As the aging of NCA is very sensitive to higher SOCs, the aging rate is a result of the long phase at higher SOCs during derating being generally strong. Compared to the cathode, the LAM on the anode side is significantly lower (Figure 7d).
Benavente-Araoz et al. [29] examined the same cell type and also obtained a significantly higher capacity loss at the cathode in comparison to the anode capacity loss by evaluating DVA half-cells. The authors also report, that in cells operated up to SOCs of 95%, the cathodes show particle cracking, deagglomeration and the presence of micro-cracks. According to different studies, the appearance of the micro-cracks in the NCA-particles can be an indication of the formation of a new NiO-type phase, leading to a loss of active material (LAM) at the cathode [30,31,32].
Another important parameter, which can be estimated from the DVA, is the homogeneity of the lithium distribution over the electrode area using the MinHiY- value (Figure 6). MinHiY shows a constant decline before the rollover at 400 FCE. The cells pulsed during discharge exhibit the lowest average homogeneity until the end of the test. All other test strategies have a comparable trend considering the cell-to-cell variation.
By summarizing the DVA results, it is apparent that all switched and reference cells show a similar trend with comparable small cell-to-cell variation. The highest deviation is shown in the homogeneity of lithium distribution. The losses in LLI are the highest with a remaining capacity of 60% after 500 FCE. The loss in active material in the cathode is 12% higher than in the anode. The cells age mainly in the cathode and by LLI and no significant impact of the switching on the aging mechanism and aging rate is apparent.

3.2.3. EIS

To further asses the influence of load switching at the end of every checkup, an electrochemical impedance spectroscopy at 100% SOC was performed in the range of 10 kHz–100 mHz. A representative development of the impedance spectra with cycling for a reference and a cell pulsed during charging (pulsed cha) is shown in Figure 8. The initial spectra show an Ohmic resistance of ~15.0 ± 0.2 mΩ and a suppressed semicircle in the mid-high frequency range for all cells, followed by a diffusion branch at low frequencies. For both cells, it can be seen that the total impedance rises with cycling. This is in good agreement with the pulse-resistance measurements. As the aging progresses, the development of two semicircles is apparent. It is generally accepted that the high frequency semicircle is attributed to the solid–electrolyte interphase (SEI) formed on the anode, whereas the arc in the mid frequency region corresponds to the kinetics of the faradic reactions [33,34].
During cycling, independent of the aging protocol, there is a continuous shift in the charge transfer processes towards lower frequencies. As a consequence, the diffusion branch, representing the diffusion of lithium-ions in the active material, successively diminishes (Figure 8). Due to this effect, the development of the diffusion resistance with cycling was not further analyzed in depth in this study. Shifts towards lower frequencies by reducing SOH for the charge transfer and diffusion processes have also been reported for NMC/Graphite cells [35].
To quantify the aging effects, the impedance spectra of all cells are analyzed using the equivalent circuit, provided in Figure 9a. The values are normalized for each cell by the values of the corresponding initial spectrum. The obtained averaged values of the relative ohmic resistance as a function of the cycle number for the different cells are shown in Figure 9b. Independent of the aging procedure, the ohmic resistance linearly increases with the same slope up to the 400th FCE for all cell types. After 400 FCE, a knee point is visible, which is in good agreement with the pulse resistance measurements. It is apparent that with increasing cycling the standard deviation between the cells of the same type increases, so that no effect of the switching can be distinguished beyond the cell-to-cell variation.
In Figure 9c, the behavior of the relative average RSEI during aging for the different cells is shown. It can be seen that during the first 400 cycles until the rollover, the resistance for all cells rises continuously with increasing FCE. Therefore, the aging rate in terms of RSEI seams slower for cells operated with current switching during the charging, whereas the switching during discharge has no apparent influence. Earlier works report for LiCoO2(LCO)/Graphite cells that the graphite anodes show significantly less SEI formation for the case of pulse charging profiles [36]. It has been suggested [37] that during the rest period of the pulse charging, the concentration polarization is mitigated, which increases the power transfer rate and improves the active material utilization. This would suppress side reactions during charging such as lithium plating [38].
However, the highest resistance increase is observed for the mid frequency range semicircle (Figure 9d). Therefore, the charging protocols seem to have no influence on the development of the charge transfer resistance over aging. It has been shown for NCA-Graphite and NCA/Graphite-Si, that the rise in the mid frequency semicircle is mainly attributed to the growth of the positive electrode charge-transfer resistance [39]. Similar observations were also reported for LCO-NMC/Graphite cells [39]. These considerations are in line with the observation from the performed DVA, showing faster cathode aging in comparison to the anode.
The performed EIS analysis shows that the examined load switching is generally not harmful to the test cells. Moreover, the pulsing during charging reduces the aging of the anode side.

3.3. Comparison of the Switching Frequency

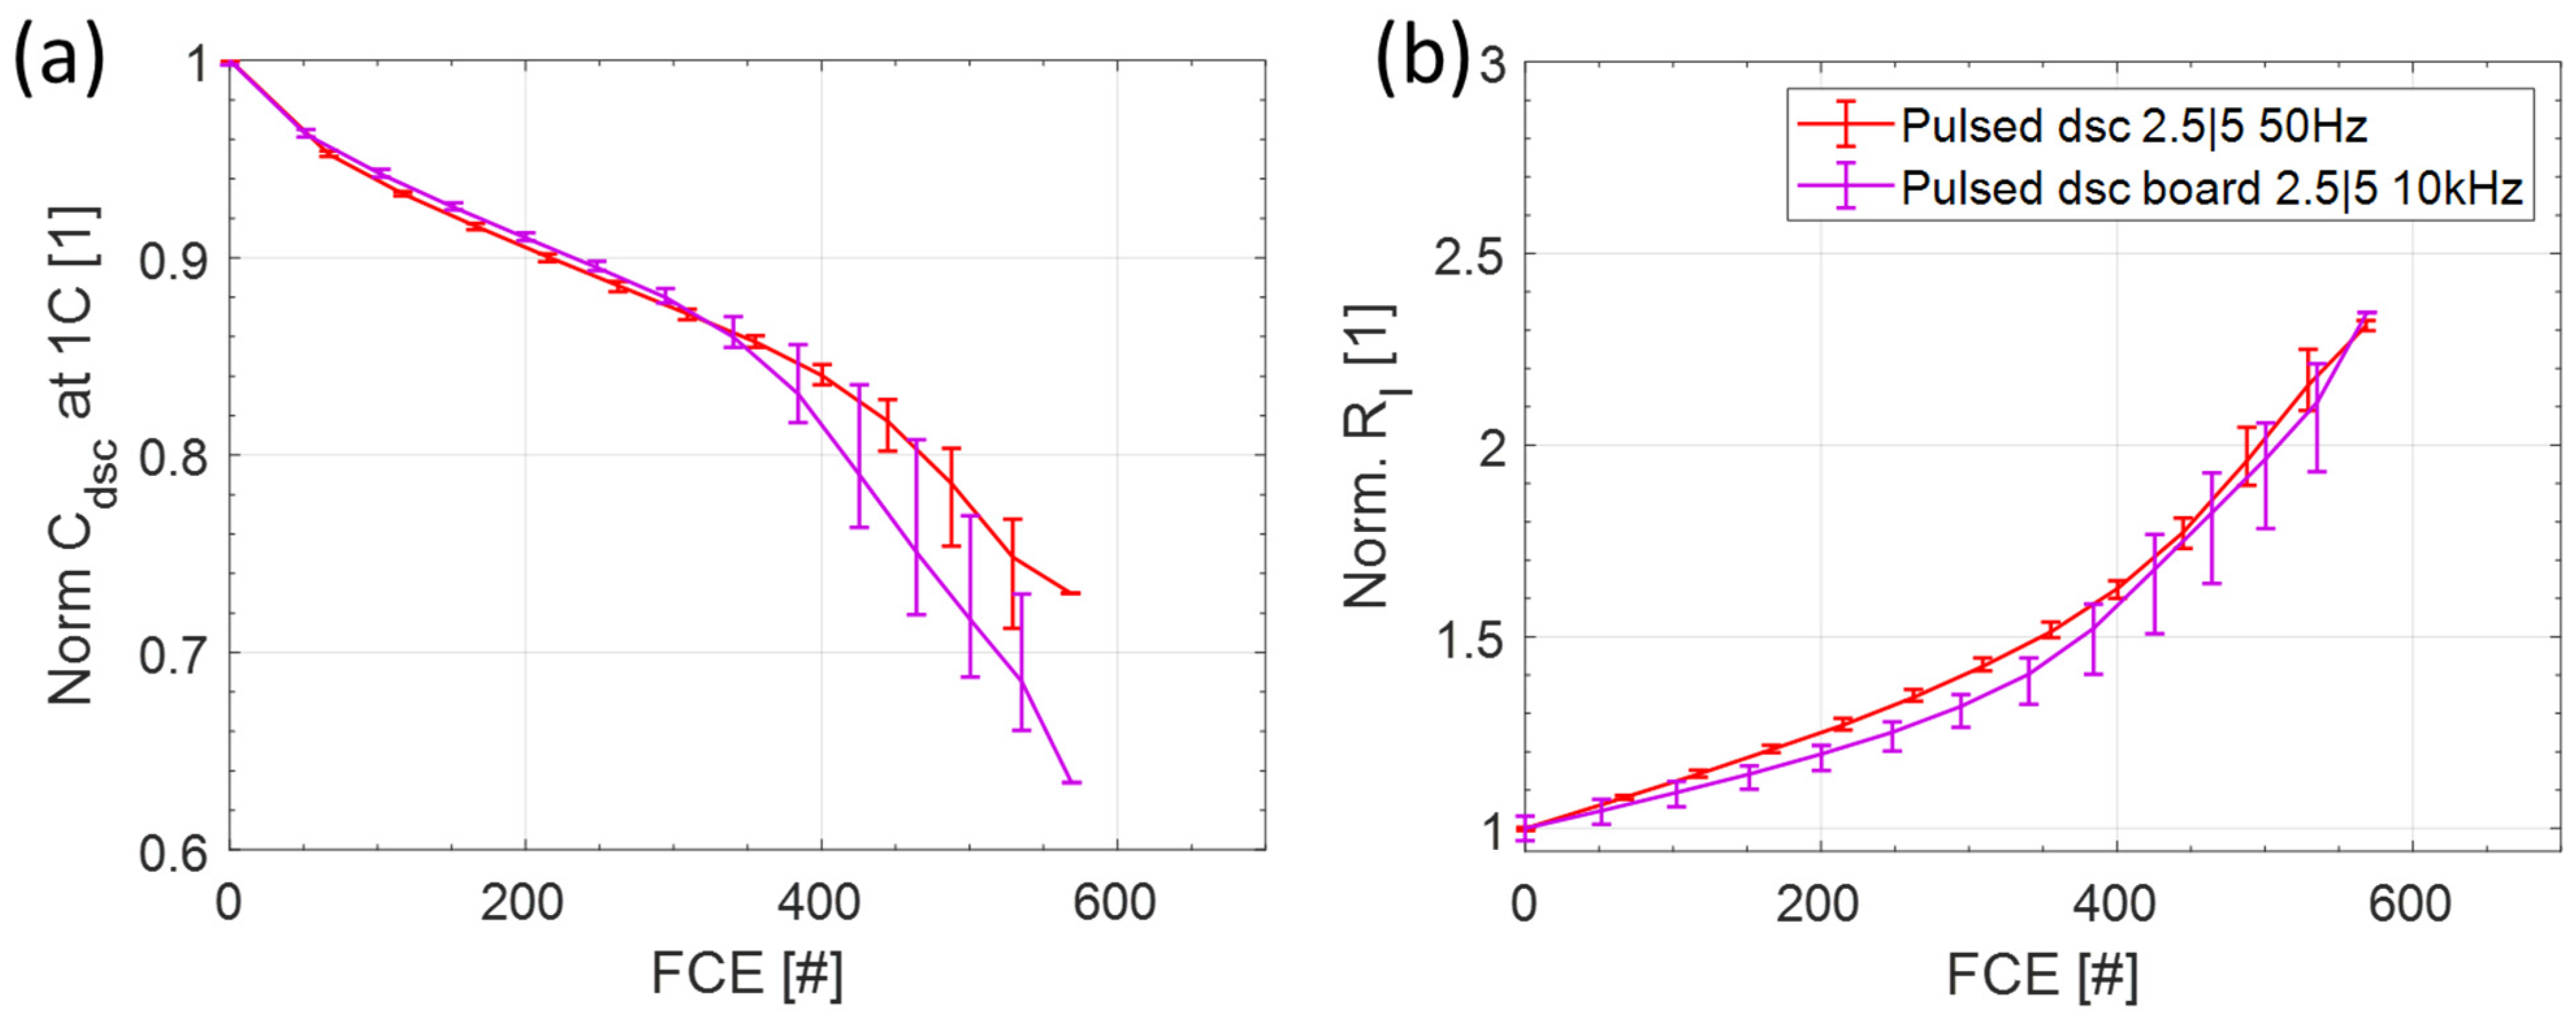
3.3.1. Capacity and Internal Resistance

In order to assess whether the switching frequency has a negative effect on the aging behavior of the cells, three additional cells were switched during discharge at a frequency of 10 kHz and a duty cycle of 50%. Figure 10 shows a comparison of the cells pulsed during discharge at frequencies of 50 Hz and at 10 kHz. As expected for both aging protocols in the first 50 FCE, the capacity declines faster due to the anode overhang effect discussed in the previous sections. The relative charge capacity for both frequencies has a constant gradient, followed by a faster decline.
For an evaluation of the irreversible aging during an application, the slopes of the linear-like part are considered. As the slopes for the first 350 FCE are comparable, we conclude that the switching frequency has no significant influence on the capacity loss for the studied cells. After 400 FCE, all cells showed a higher gradient and deviation and the cells switched with a frequency of 50 Hz to exhibit a higher remaining capacity. The cells switched with 10 kHz reached 80% SOH at 410 FCE and 500 FCE and the cells switched with 50 Hz to reach 80% SOH at 450 FCE and 500 FCE.
The resistance shows an increasing trend until the end of the test. The gradient in the first 400 FCE is constant and increases after 400 FCE. The curves split into two groups, depending on the switching frequency, right from the beginning. The cells that switched with a frequency of 50 Hz show a faster rise in resistance, while at 10 kHz the rise is faster from about 350 FCE on. At the end of test, the increase in resistance for both frequencies is comparable. Finally, in the first 350 FCE, the capacity loss does not significantly deviate for both switching frequencies, while the resistance increase is slightly higher at 50 Hz.
The peak temperature (not shown here) is first influenced by the discharge current and secondly by the charge current. However, the average temperature during cycling remains nearly constant in the range of 32 and 34 °C. The pulsing frequency itself has no significant influence on the measured cell temperature.

3.3.2. Differential Voltage Analysis

Figure 11 shows the evaluation of the DVA curves for the six cells switched with frequencies of 50 Hz (red) and 10 kHz (purple) over 550 FCE. Figure 11a shows the relative capacity loss of active lithium (LLI). The LLI trend for the 50 Hz cells shows less cell-to cell variation and a higher average value from about 400 FCE when compared to the 10 kHz cells. For both frequencies, we observe a constant gradient between 100 FCE and 400 FCE. From 400 FCE onward, the slopes of the linear-like part for all cells are comparable considering the cell-to-cell variation.
Figure 11b shows the characteristic point MinHi over 500 FCE, where the peak is detectable. For both frequencies, the results are in the same order at the beginning. It is only after 350 FCE that the cells switched with 50 Hz have a higher homogeneity compared to the 10 kHz. MinHi is characteristic for the HLD of the anode. So, the 10 kHz cells have a more inhomogeneous lithium distribution in the anode than the 50 Hz cells towards the end of life, which can explain the earlier rollover in the capacity decline.
The capacity loss in the cathode is depicted in Figure 11c and decreases to about 80% over 400 FCE. The progress has a constant decreasing trend and shows no differences in switching frequency.
The loss of the capacity in the anode is demonstrated in Figure 11d. All cells have almost the same capacity loss. The trend is nearly linear and the slope is compared to the cathode losses before for 50 Hz and the reference tests as discussed. This is reasonable as the switching frequency has no influence on the derating phase at the end of charge.

4. Conclusions

We presented the results of evaluating the influence of pulsed cycling on the aging of a high power lithium-ion cell. After the anode overhang effect concluded and before the rollover, we observed a reproducible linear-like capacity fade and a linear-like increase in the pulse resistance for all aging protocols. The slope of this linear-like part for capacity and resistance did not show any significant influence of the applied current rates or of the pulsing at 50 Hz during charging, discharging or charging/discharging. Moreover, no significant influence before the rollover was found when comparing pulsing during discharge at 10 kHz with pulsing at 50 Hz. These findings are in line with differential voltage analysis and EIS, as no significant influence of the switching operation strategy was found for any evaluated parameter. Nevertheless, switching during charging seems to have a rather positive effect on the aging behavior of the anode in terms of the increase in SEI resistance. However, the effect is rather marginal for the studied high power cell. Changes after the rollover did not show a clear correlation beyond the cell-to-cell variation within one test. Finally, we conclude that for this high power cell and the applied test protocols, no significant influence of switching was observed, so multilevel inverter applications are not associated with faster aging. As the reference cells did not exhibit a current dependency in charge or discharge direction before rollover, we assume that high power cells are less prone to being affected by additional aging caused by pulses as occurs for applications such as multilevel inverters. Considering the e-mobility application, the applied charge rates are, at 0.5–1 C, in the range of continuous moderate fast charging and the discharge rates are, at 1–2 C, far higher than the typical average operational use of 0.5 C and lower. Therefore, the cells are investigated at already high current rate levels.
As a consequence, we will investigate the influence of switching for high energy cells in an upcoming publication, which are more sensitive to the C-rate, so as to assess whether the cell’s aging is more closely related to an average or maximum current application.

Author Contributions

Conceptualization, M.L. and C.E.; methodology, M.L.; validation, M.L., L.K., G.W.N., M.T., C.H. and X.S.; formal analysis, M.L., L.K., G.W.N. and X.S.; investigation, M.L., G.W.N., X.S., C.H. and M.T.; resources, M.L., C.E.; data curation, M.L., L.K., G.W.N., X.S.; writing—original draft preparation, M.L., L.K., G.W.N. and X.S.; writing—review and editing, M.L. and L.K.; supervision, M.L.; project administration, L.K., C.E.; funding acquisition, L.K., C.E. All authors have read and agreed to the published version of the manuscript.

Funding

The research is funded by the Audi AG.

Institutional Review Board Statement

Not applicable.

Informed Consent Statement

Not applicable.

Data Availability Statement

For data please refer to the corresponding author.

Acknowledgments

Special thanks for the fruitful discussion and support provided by Michael Hinterberger, Christoph Hartmann, Julia Stöttner, Christoph Terbrack and Markus Hölzle.

Conflicts of Interest

The authors declare no conflict of interest.

References

  1. El-Hosainy, A.; Hamed, H.A.; Azazi, H.Z.; El-Kholy, E.E. A review of multilevel inverter topologies, control techniques, and applications. In Proceedings of the 2017 Nineteenth International Middle East Power Systems Conference (MEPCON), Cairo, Egypt, 19–21 December 2017; IEEE: Piscataway, NJ, USA, 2017; pp. 1265–1275, ISBN 978-1-5386-0990-3. [Google Scholar]
  2. Hasan, N.S.; Rosmin, N.; Osman, D.A.A.; Hatib, A. Reviews on multilevel converter and modulation techniques. Renew. Sustain. Energy Rev. 2017, 80, 163–174. [Google Scholar] [CrossRef]
  3. Hanzl, C.; Hartmann, C.; Hölzle, M.; Liebhart, B.; Schmid, M.; Endisch, C. Current Commutation in a Switched Lithium-Ion Cell used in Cascaded Half-Bridge Multilevel Inverters. IET Power Electron 2021, 14, 1073–1088. [Google Scholar] [CrossRef]
  4. Korth Pereira Ferraz, P.; Schmidt, R.; Kober, D.; Kowal, J. A high frequency model for predicting the behavior of lithium-ion batteries connected to fast switching power electronics. J. Energy Storage 2018, 18, 40–49. [Google Scholar] [CrossRef]
  5. Korte, C.; Specht, E.; Hiller, M.; Goetz, S. Efficiency evaluation of MMSPC/CHB topologies for automotive applications. In Proceedings of the 2017 IEEE 12th International Conference on Power Electronics and Drive Systems (PEDS), Honolulu, HI, USA, 12–15 December 2017; IEEE: Piscataway, NJ, USA, 2017; pp. 324–330, ISBN 978-1-5090-2364-6. [Google Scholar]
  6. Bughneda, A.; Salem, M.; Richelli, A.; Ishak, D.; Alatai, S. Review of Multilevel Inverters for PV Energy System Applications. Energies 2021, 14, 1585. [Google Scholar] [CrossRef]
  7. Jiang, X.; Doumbia, M.L. Comparative Study of Grid-Connected Multilevel Inverters for High Power Phtovoltaic Systems. In Proceedings of the 2019 IEEE 7th International Conference on Smart Energy Grid Engineering (SEGE), Oshawa, ON, Canada, 12–14 August 2019; IEEE: Piscataway, NJ, USA, 2019; pp. 184–190, ISBN 978-1-7281-2440-7. [Google Scholar]
  8. Komsiyska, L.; Buchberger, T.; Diehl, S.; Ehrensberger, M.; Hanzl, C.; Hartmann, C.; Hölzle, M.; Kleiner, J.; Lewerenz, M.; Liebhart, B.; et al. Critical Review of Intelligent Battery Systems: Challenges, Implementation, and Potential for Electric Vehicles. Energies 2021, 14, 5989. [Google Scholar] [CrossRef]
  9. Uno, M.; Tanaka, K. Influence of High-Frequency Charge–Discharge Cycling Induced by Cell Voltage Equalizers on the Life Performance of Lithium-Ion Cells. IEEE Trans. Veh. Technol. 2011, 60, 1505–1515. [Google Scholar] [CrossRef]
  10. Chang, F.; Roemer, F.; Lienkamp, M. Influence of Current Ripples in Cascaded Multilevel Topologies on the Aging of Lithium Batteries. IEEE Trans. Power Electron 2020, 35, 11879–11890. [Google Scholar] [CrossRef]
  11. Qin, Y.; Chen, X.; Tomaszewska, A.; Chen, H.; Wei, Y.; Zhu, H.; Li, Y.; Cui, Z.; Huang, J.; Du, J.; et al. Lithium-ion batteries under pulsed current operation to stabilize future grids. Cell Rep. Phys. Sci. 2022, 3, 100708. [Google Scholar] [CrossRef]
  12. Wong, D.; Shrestha, B.; Wetz, D.A.; Heinzel, J.M. Impact of high rate discharge on the aging of lithium nickel cobalt aluminum oxide batteries. J. Power Source 2015, 280, 363–372. [Google Scholar] [CrossRef]
  13. Soares, R.; Bessman, A.; Wallmark, O.; Lindbergh, G.; Svens, P. An Experimental Setup with Alternating Current Capability for Evaluating Large Lithium-Ion Battery Cells. Batteries 2018, 4, 38. [Google Scholar] [CrossRef] [Green Version]
  14. Prasad, R.; Namuduri, C.; Kollmeyer, P. Onboard unidirectional automotive G2V battery charger using sine charging and its effect on li-ion batteries. In Proceedings of the 2015 IEEE Energy Conversion Congress and Exposition (ECCE), Montreal, QC, Canada, 20–24 September 2015; pp. 6299–6305. [Google Scholar]
  15. Korth Pereira Ferraz, P.; Kowal, J. A Comparative Study on the Influence of DC/DC-Converter Induced High Frequency Current Ripple on Lithium-Ion Batteries. Sustainability 2019, 11, 6050. [Google Scholar] [CrossRef] [Green Version]
  16. Lain, M.J.; Brandon, J.; Kendrick, E. Design Strategies for High Power vs. High Energy Lithium Ion Cells. Batteries 2019, 5, 64. [Google Scholar] [CrossRef] [Green Version]
  17. Keil, P.; Schuter, S.F.; Wilhelm, J.; Travi, J.; Hauser, A.; Katl, R.C.; Jossen, A. Calendar Aging of Lithium-Ion Batteries: I. Impact of the Graphite Anode on Capacity Fade. J. Electrochem. Soc. 2016, 163, A1872–A1880. [Google Scholar] [CrossRef]
  18. Gyenes, B.; Stevens, D.A.; Chevrier, V.L.; Dahn, J.R. Understanding Anomalous Behavior in Coulombic Efficiency Measurements on Li-Ion Batteries. J. Electrochem. Soc. 2015, 162, A278–A283. [Google Scholar] [CrossRef]
  19. Lewerenz, M.; Fuchs, G.; Becker, L.; Sauer, D.U. Irreversible calendar aging and quantification of the reversible capacity loss caused by anode overhang. J. Energy Storage 2018, 18, 149–159. [Google Scholar] [CrossRef]
  20. Cui, D.; Wang, J.; Sun, A.; Song, H.; Wei, W. Anomalously Faster Deterioration of LiNi0.8Co0.15Al0.05O2/Graphite High-Energy 18650 Cells at 1.5 C than 2.0 C. Scanning 2018, 2018, 2593780. [Google Scholar] [CrossRef] [Green Version]
  21. Safari, M.; Delacourt, C. Aging of a Commercial Graphite/LiFePO4 Cell. J. Electrochem. Soc. 2011, 158, A1123. [Google Scholar] [CrossRef]
  22. Lewerenz, M.; Rahe, C.; Fuchs, G.; Endisch, C.; Sauer, D.U. Evaluation of shallow cycling on two types of uncompressed automotive Li (Ni1/3Mn1/3Co1/3)O2-Graphite pouch cells. J. Electrochem. Soc. 2020, 30, 10159. [Google Scholar] [CrossRef]
  23. Lewerenz, M.; Dechent, P.; Sauer, D.U. Investigation of capacity recovery during rest period at different states-of-charge after cycle life test for prismatic Li(Ni1/3Mn1/3Co1/3)O2-graphite cells. J. Energy Storage 2019, 21, 680–690. [Google Scholar] [CrossRef]
  24. Epding, B.; Rumberg, B.; Jahnke, H.; Stradtmann, I.; Kwade, A. Investigation of significant capacity recovery effects due to long rest periods during high current cyclic aging tests in automotive lithium ion cells and their influence on lifetime. J. Energy Storage 2019, 22, 249–256. [Google Scholar] [CrossRef]
  25. Spingler, F.B.; Naumann, M.; Jossen, A. Capacity Recovery Effect in Commercial LiFePO4/Graphite Cells. J. Electrochem. Soc. 2020, 167, 40526. [Google Scholar] [CrossRef]
  26. Lewerenz, M.; Warnecke, A.; Sauer, D.U. Post-mortem analysis on LiFePO4|Graphite cells describing the evolution & composition of covering layer on anode and their impact on cell performance. J. Power Source 2017, 369, 122–132. [Google Scholar] [CrossRef]
  27. Birkl, C.R.; Roberts, M.R.; McTurk, E.; Bruce, P.G.; Howey, D.A. Degradation diagnostics for lithium ion cells. J. Power Source 2017, 341, 373–386. [Google Scholar] [CrossRef]
  28. Baghdadi, I.; Briat, O.; Delétage, J.-Y.; Gyan, P.; Vinassa, J.-M. Lithium battery aging model based on Dakin’s degradation approach. J. Power Source 2016, 325, 273–285. [Google Scholar] [CrossRef]
  29. Benavente-Araoz, F.; Varini, M.; Lundblad, A.; Cabrera, S.; Lindbergh, G. Effect of Partial Cycling of NCA/Graphite Cylindrical Cells in Different SOC Intervals. J. Electrochem. Soc. 2020, 167, 40529. [Google Scholar] [CrossRef]
  30. Bloom, I.; Christophersen, J.P.; Abraham, D.P.; Gering, K.L. Differential voltage analyses of high-power lithium-ion cells. J. Power Source 2006, 157, 537–542. [Google Scholar] [CrossRef]
  31. Watanabe, S.; Hosokawa, T.; Morigaki, K.; Kinoshita, M.; Nakura, K. Prevention of the Micro Cracks Generation in LiNiCoAlO2 Cathode by the Restriction of ΔDOD. ECS Trans. 2012, 41, 65–74. [Google Scholar] [CrossRef]
  32. Abraham, D.P.; Reynolds, E.M.; Sammann, E.; Jansen, A.N.; Dees, D.W. Aging characteristics of high-power lithium-ion cells with LiNi0.8Co0.15Al0.05O2 and Li4/3Ti5/3O4 electrodes. Electrochim. Acta 2005, 51, 502–510. [Google Scholar] [CrossRef]
  33. Deshpande, R.D.; Ridgway, P.; Fu, Y.; Zhang, W.; Cai, J.; Battaglia, V. The Limited Effect of VC in Graphite/NMC Cells. J. Electrochem. Soc. 2015, 162, A330–A338. [Google Scholar] [CrossRef] [Green Version]
  34. Zilberman, I.; Ludwig, S.; Schiller, M.; Jossen, A. Online aging determination in lithium-ion battery module with forced temperature gradient. J. Energy Storage 2020, 28, 101170. [Google Scholar] [CrossRef]
  35. Westerhoff, U.; Kurbach, K.; Lienesch, F.; Kurrat, M. Analysis of Lithium-Ion Battery Models Based on Electrochemical Impedance Spectroscopy. Energy Technol. 2016, 4, 1620–1630. [Google Scholar] [CrossRef] [Green Version]
  36. Li, J.; Murphy, E.; Winnick, J.; Kohl, P.A. The effects of pulse charging on cycling characteristics of commercial lithium-ion batteries. Electrochem. Solid-State Lett. 2001, 102, 302–309. [Google Scholar] [CrossRef]
  37. Bloom, I.; Walker, L.K.; Basco, J.K.; Abraham, D.P.; Christophersen, J.P.; Ho, C.D. Differential voltage analyses of high-power lithium-ion cells. 4. Cells containing NMC. J. Power Source 2010, 195, 877–882. [Google Scholar] [CrossRef]
  38. Lee, S.; Cho, W.; Do, V.; Choi, W. Effects of Pulse Current Charging on the Aging Performance of Commercial Cylindrical Lithium Ion Batteries. Appl. Sci. 2021, 11, 4918. [Google Scholar] [CrossRef]
  39. Weber, R.; Louli, A.J.; Plucknett, K.P.; Dahn, J.R. Resistance Growth in Lithium-Ion Pouch Cells with LiNi0.80Co0.15Al0.05O2 Positive Electrodes and Proposed Mechanism for Voltage Dependent Charge-Transfer Resistance. J. Electrochem. Soc. 2019, 166, A1779–A1784. [Google Scholar] [CrossRef]
Figure 1. Check-up test to assess the aging.
Batteries 08 00033 g001
Figure 2. (a) Setup of the test device with the switching board and the connected test bench by means of the current and voltage sensors and an auxiliary board. (b) Picture of the test including switching board, coil, sensors and wiring.
Batteries 08 00033 g002
Figure 3. Current measurement during switching at 10 kHz with an inductor of 56, 100 and 560 µH.
Batteries 08 00033 g003
Figure 4. Relative discharge capacity (a) and relative pulse resistance (b) of the reference cells at different charge and discharge currents as a function of the full cycle equivalents.
Batteries 08 00033 g004
Figure 5. Relative discharge capacity (a) and relative internal resistance (b) of the switched cells by 50 Hz during discharge (dsc), charge (cha) and charge/discharge (cha/dsc).
Batteries 08 00033 g005
Figure 6. Exemplary dV/dQ-curve of the test cells to highlight the characteristic features of the anode and the cathode for three aging states measured at (a) check-up 1, (b) check-up 5 and (c) check-up 11.
Batteries 08 00033 g006
Figure 7. Trends in the loss of active lithium CLLI (a), the minimum at high SOC (MinHi) (b), the cathode CC (c) and the relative capacity of the anode CA (d) for the reference cells and the pulsed cells.
Batteries 08 00033 g007
Figure 8. Development of the electrochemical impedance spectra measured at 100% SOC over 600 FCE (a), reference 2—2.5 A/2.5 A and (b) pulsed cha—50 Hz.
Batteries 08 00033 g008
Figure 9. (a) schematic presentation of the electric circuit used for the quantitative evaluation of the electrochemical impedance spectra at 100% SOC over 550 FCE; development of the (b) relative Ohmic resistance, (c) relative SEI resistance and (d) relative charge transfer resistance, as a function of the FCE.
Batteries 08 00033 g009
Figure 10. Relative discharge capacity at 1 C (a) and relative internal resistance (b) of cells switched during discharge (dsc) with a frequency of 50 Hz and 10 kHz.
Batteries 08 00033 g010
Figure 11. Trends of the loss of active lithium CLLI (a) and of the minimum at high SOC (MinHi) (b), the cathode CC (c) and the relative capacity of the anode CA (d) for pulsed discharge at frequencies of 50 Hz (red) and 10 kHz (purple).
Batteries 08 00033 g011
Table 1. Specifications of the used Samsung battery.
ProducerSamsung
Cell typeINR18650-25R
CathodeNCA: Li(Ni0.8Co0.15Al0.05)O2 +
NMC: Li(Ni0.6Mn0.2Co0.2)O2
AnodeGraphite + Silicon
Nom. Capacity at 0.5 C2.5 Ah
Max. discharge voltage2.5 V
Max. charge voltage4.2 V
Max. discharge current 20 A
Energy density216 Wh/kg
Storage voltage (SOC) before test 3.52 V (20%)
Table 2. Test matrix.
Test-Name# Test CellsImax [A]Iavg [A]
chadscchadsc
Ref 122.552.55
Ref 222.52.52.52.5
Ref 311.252.51.252.5
Ref 421.2551.255
Pulsed cha—50 Hz32.551.255
Pulsed cha/dsc—50 Hz32.551.252.5
Pulsed dsc—50 Hz32.552.52.5
Pulsed dsc—10 kHz32.552.52.5
Publisher’s Note: MDPI stays neutral with regard to jurisdictional claims in published maps and institutional affiliations.

