1. Introduction
Over the past few decades, the demand for high-energy batteries has rapidly expanded from small consumer information technology (IT) electronics to large-scale electronic systems such as electric vehicles (EVs) and energy storage systems (ESSs). These demands have prompted intensive research and development of Li secondary batteries with environmentally friendly properties, high energy density, long lifespan, and low self-discharge properties compared to other competitive secondary battery systems such as Ni-Cd batteries and Ni-MH batteries [
1,
2,
3]. As the performance of Li secondary batteries has significantly improved, the roles of the active materials (cathode and anode materials) and electrolytes are considered to be very important. However, the role of separators, one of the main components of batteries, has been underestimated because they are regarded as merely preventing direct short circuits between cathodes and anodes [
4,
5]. However, in recent years, the role of separators has become more important than ever because the standards for battery safety are gradually increasing for the successful implementation of high-energy-density Li secondary batteries [
6,
7].
Commercialized porous separators are made of polyolefin materials, such as polyethylene (PE), polypropylene (PP), and their laminates [
8]. Polyolefin porous separators are hydrophobic and have low wettability to commercialize polar carbonate-based liquid electrolytes [
9]. Furthermore, polyolefin separators are prone to thermal shrinkage when exposed to high temperatures owing to the internal stress generated during the stretching process while manufacturing. The dimensional shrinkage of separators causes a short circuit between the cathodes and anodes, resulting in catastrophic safety issues for Li secondary batteries [
10,
11,
12]. Ceramic-coated separators (CCSs) are considered the most efficient and promising approach for overcoming the shortcomings of polyolefin separators [
8,
9]. Ceramic coating layers consist of various types of inorganic powders entangled using polymeric binders. For quite a long time from the beginning of development, non-polar organic solvents such as
N–methyl–2–pyrrolidone, acetone, and tetrahydrofuran have been widely used due to the hydrophobic properties of polyolefin separators. Whereas, recently, to minimize the use of flammable, toxic, expensive, and non-environmental organic solvents in manufacturing CCSs, CCSs prepared using an aqueous ceramic coating slurry have been attracted interest [
1,
3,
13,
14].
The main problems with aqueous ceramic coating slurries for polyolefin separators are poor coating quality on the separator surface and poor dispersion stability of the ceramic coating slurries [
3,
15]. The inherent hydrophobicity of polyolefin separators repels polar aqueous solutions, and inorganic ceramic particles are easily sedimented and flocculated owing to the coherent force of the inorganic particles. To overcome these shortcomings, many attempts have been made to develop improved ceramic coating components and compositions [
1,
3,
13,
14]. Such efforts are necessary and natural because the properties of CCSs depend on the properties and composition of the ceramic coating components, i.e., ceramic materials, binders, and solvents.
We believe that the CCSs preparation process should also be considered an important factor as it governs the morphology of the ceramic coating layers [
15,
16]. In this study, we investigated the effect of CCSs preparation skills by controlling the mixing order of ceramic coating components in the same slurry composition and component. Aqueous ceramic slurries consist of a polymeric binder (CMC), ceramic particles (Al
2O
3), dispersion stabilizer (disodium laureth sulfosuccinate, DLSS), and D.I. water (CMC/Al
2O
3/DLSS/D.I. water = 1/38.9/0.1/60 by weight). The dispersion stability of the aqueous ceramic slurries according to each mixing order and the physical and electrochemical properties of the prepared CCS were investigated using quantitative measurement methods.
2. Experimental Section
2.1. Materials
Sodium carboxymethyl cellulose (CMC, WS-C, Dai–Ichi Kogyo Seiyaku. Co., Ltd., Tokyo, Japan) was used as the water-soluble polymeric binder for the aqueous ceramic coating slurries. Aluminum oxide (Al2O3, D50 = 430 nm, AES–11 Sumitomo Chemical Co., Tokyo, Japan) were the ceramic particles. N-methyl-2-pyrrolidone (NMP, Duksan, Gyeonggi-do, Korea), acetone (purity > 99.9%, water content < 0.005%, Merck, Darmstadt, Germany), and D.I. water from a Milli-Q system (Millipore Co., Billerica, MA, USA, > 18.2 MΩ cm−1) were used without further purification. Disodium laureth sulfosuccinate solution (DLSS, 28 wt.% ASCO®, AK Chemtech Co., Ltd., Daejeon, Korea), Li metal foil (thickness = 100 µm, Honjo Metal, Osaka, Japan), Li manganese oxide (LiMn2O4, LMO, Iljin Materials Co., Seoul, Korea) and carbon black (Super–P, Timcal, Bodio, Switzerland) were used as anodes, cathodes, and conductive materials, respectively. 1.15 M Li hexafluorophosphate (LiPF6) in ethylene carbonate/ethyl methyl carbonate (EC/EMC = 3/7 v/v) (Enchem Co., Ltd., Chungcheongnam-do, Korea) and polyethylene (PE) microporous separators (porosity = 40%, thickness = 20 μm, Asahi Kasei E-Materials, Tokyo, Japan) were used as liquid electrolyte and separator, respectively.
2.2. Preparation of Aqueous Ceramic Coating Slurries
To produce aqueous ceramic slurries, a base slurry was prepared by mixing CMC, Al2O3, and D.I. water (CMC/Al2O3/DLSS/D.I. Water = 1/39−x/x/60 by weight). Different concentrations of DLSS (0.0, 0.1, 0.5, and 1.0 wt.%) were added to the base slurry, and the mixture was stirred constantly at 450 rpm with magnetic bars (for 24 h at 25 °C), followed by ball milling using zirconia balls (diameter = 2 mm) for 2 h at a speed of 450 rpm at 25 °C. After removing the zirconia balls, the slurries were ultrasonicated for 15 min (at 25 °C) to remove air bubbles and ensure better homogeneity.
2.3. Evaluation of Dispersion Stability of Aqueous Ceramic Coating Slurries
Aqueous ceramic coating slurries (4 mL) were injected into rectangular cuvettes (made of synthetic polyamide) of identical optical path lengths (2 mm), and dispersion stability was evaluated using a dispersion analyzer (LUMisizer 610, LUM GmbH, Berlin, Germany). Cuvettes were exposed to centrifugal force at a rotation speed of 2500 rpm at 25 °C, and the near-infrared (NIR) light (wavelength = 870 nm) transmission profiles across the entire sample and testing duration were recorded at 10 s intervals using a light ratio of 1.0. SEPView software (LUM GmbH, Berlin, Germany) was used to calculate the instability index of the slurries within a region of interest range of 10 mm along the cuvettes. The instability index quantifies the clarification of transmission at a given time divided by the maximum clarification possible.
The viscosity and zeta potential of the aqueous ceramic coating slurries were measured using a cone and plate viscometer (SV-10, A&D Company Ltd., Tokyo, Japan) and zeta potentiometer (Nano ZSP/ZEN5602, Malvern Instruments, Malvern, UK), respectively.
2.4. Evaluation of Mixing Orders for Aqueous Ceramic Coating Slurries
Different types of aqueous ceramic coating slurries were prepared using different mixing orders with the same slurry composition and components (CMC/Al
2O
3/DLSS/D.I. water = 1/38.9/0.1/60 by weight). The mixing sequences are denoted as A, B, and C. In sequence A, Al
2O
3 was first mixed with the DLSS surfactant solution, and CMC polymeric binder was added last. In sequence B, the DLSS surfactant solution and CMC polymeric binder were first mixed, and Al
2O
3 was added. In sequence C, the CMC polymeric binder and Al
2O
3 were mixed first, and the DLSS surfactant solution was added last. For each mixing step, marked as the first mixing and second mixing, the samples were processed as described in
Section 2.2. To further investigate the sedimentation phenomenon of the ceramic slurries, the as-prepared samples were kept in glass vials at 25 °C for 30 days and the sedimentation patterns of the particles under gravity were observed.
2.5. Preparation of CCSs
A ceramic coating slurry with the composition (CMC/Al2O3/DLSS/D.I. water = 1/38.9/0.1/60 by weight) was prepared by mixing sequence A. Subsequently, the PE separator was cleaned with acetone and dried in a fume hood for 5 min before use. The Al2O3 ceramic slurry was cast on a PE separator via a simple gravure method using a doctor blade. After coating, the CCSs were dried in a fume hood (for 1 h at 25 °C) and then further dried in a vacuum oven (for 6 h at 60 °C) to remove residual moisture. The thickness of the Al2O3 ceramic coating was maintained at 6 µm.
2.6. Characterization of CCSs
The surface morphologies of the bare PE separators and CCSs were analyzed using a field-emission scanning microscope (FE-SEM, S-4800, Hitachi, Tokyo, Japan). The electrolyte wettability of the separators was evaluated by dropping a drop of liquid electrolyte on the surface of a separator of the same size (radius = 0.9 cm) and comparing the size of the wetted area. Air permeability was determined by measuring the Gurley number of bare PE separators and CCSs using a densometer (4100N, Thwing-Albert, West Berlin, NJ, USA) according to the procedure JIS-P8117 (Japanese Industrial Standards) by measuring the time (s) for 100 cm3 of air to pass through the membrane under constant air pressure (6.52 psi). The hydrophilicity of the separators was determined by measuring the contact angles between the separators and a droplet of D.I. water using an optical tensiometer (Surface Electro-Optics Co., Ltd., Suwon, Korea).
2.7. Electrode Preparation
The LMO cathode was prepared by casting an NMP-based slurry of the LMO (90 wt.%) as active material, Super-p (5 wt.%) as a conductive additive, and PDVF (5 wt.%) as polymeric binder material onto Al foil (thickness = 15 µm, Sam-A Aluminum, Seoul, Korea) using a doctor blade. The electrode was then dried in a conventional oven at 80 °C for 2 h. The anode was prepared by casting an NMP-based electrode slurry (graphite/Super-P/PVdF = 93/2/5 by weight) on a Cu foil (thickness = 10 µm, Nippon Foil, Tokyo, Japan) using a doctor blade and then dried in an oven at 80 °C for 2 h. After drying, the electrodes were calendared using a gap control roll presser (CLP-2025, CIS, Daegu, Korea) and cut into circles (For LMO cathodes, thickness = 55 µm, loading level = 12.967 mg cm−2, density = 2.087 g cm−3, diameter = 12 mm, for graphite anodes, thickness = 67 µm, loading level = 5.8 mg cm−2, density = 0.88 g cm−3, diameter = 14 mm). The electrodes were further dried in a vacuum oven (at 60 °C for 24 h) and transferred to an Ar-filled glove box.
2.8. Electrochemical Performance Measurement
The ionic conductivities (σ) of the bare PE and CCSs were measured using electrochemical impedance spectroscopy (EIS). The impedance measurements were performed on the electrolyte-soaked separators sandwiched between two stainless steel electrodes (radius = 0.8 cm, are = 2.01 cm
2) over a frequency range of 100 kHz to 1 MHz with an AC amplitude of 10 mV. The ionic conductivities were then calculated using the following Equation [
3]:
, where
l is the thickness of the separators,
S is the effective contact area between the separator and stainless-steel electrodes, and
R is the bulk resistance of the wet separator.
R was measured using AC complex impedance analysis (VSP, Bio-Logic, Claix, France).
To evaluate the electrochemical performance of the CCSs, 2032 coin-type full cells (LMO/graphite) and half cells (LMO/Li metal) were prepared in an argon-filled glove box. After the cell assembly, the coin cells were aged (for 12 h at 25 °C) and then precycled in two steps: (i) Cell formation: cells were charged and discharged at a rate of C/10 (0.128 mA cm−2 and 0.142 mA cm−2 for half cells and full cells, respectively) in a constant current (CC) mode for one cycle. (ii) Cell stabilization: Cells were charged in CC/constant voltage (CV) mode at C/5 and discharged at C/5 in CC mode. The rate capability was evaluated by varying both the charging current densities (operated in CC/CV mode) and discharging current densities (operated in CC mode) as follows; (C/2 → 1C → 3C → 5C → 7C → 10C → C/2) for both full and half cells. The cycle performance was evaluated by charging the cells in CC/CV mode at 1 C (1.28 and 1.42 mA cm−2 for full cells and half cells, respectively) and discharging in CC mode at 1 C. The cycle performance was conducted in the voltage range between 3.0 and 4.3 V and in the potential range between 3.0 and 4.3 V vs. Li/Li+ using a charge/discharge cycler (PNE Solution, Seoul, Korea) at 25 °C for full cells and half cells, respectively.
3. Results and Discussion
The LUMisizer is an instrument that uses light scattering and accelerated centrifugal force, which can provide rapid quantitative measurements of dispersion stability in contrast to traditional storage and natural gravity-based methods, which require weeks and can only perform qualitative stability assessments. Furthermore, it can evaluate complex phenomena in suspensions and slurries, such as flocculation, creaming, particle sedimentation, and phase invasion [
17]. The instability index, measured by the LUMisizer, is a useful tool for quantitatively evaluating the dispersion stability of aqueous ceramic coating slurries. The instability index, a stability quantifier determined as the ratio of clarification at a given separation time to the maximum clarification in a dispersed system, is a unitless parameter that ranges between 0 and 1. Because lower instability index values indicate higher system stability, an index of ‘0’ indicates a very stable dispersed system, and a ‘1’ indicates complete phase separation [
18,
19,
20].
Although we first suggested the use of DLSS, a negative surfactant, as an excellent dispersion stabilizer for aqueous ceramic coating slurries in a previous study [
3], we did not recognize the importance of optimizing the amount of DLSS used. The DLSS amount and mixing order of the aqueous ceramic coating slurries were optimized by measuring the instability index of various types of slurries.
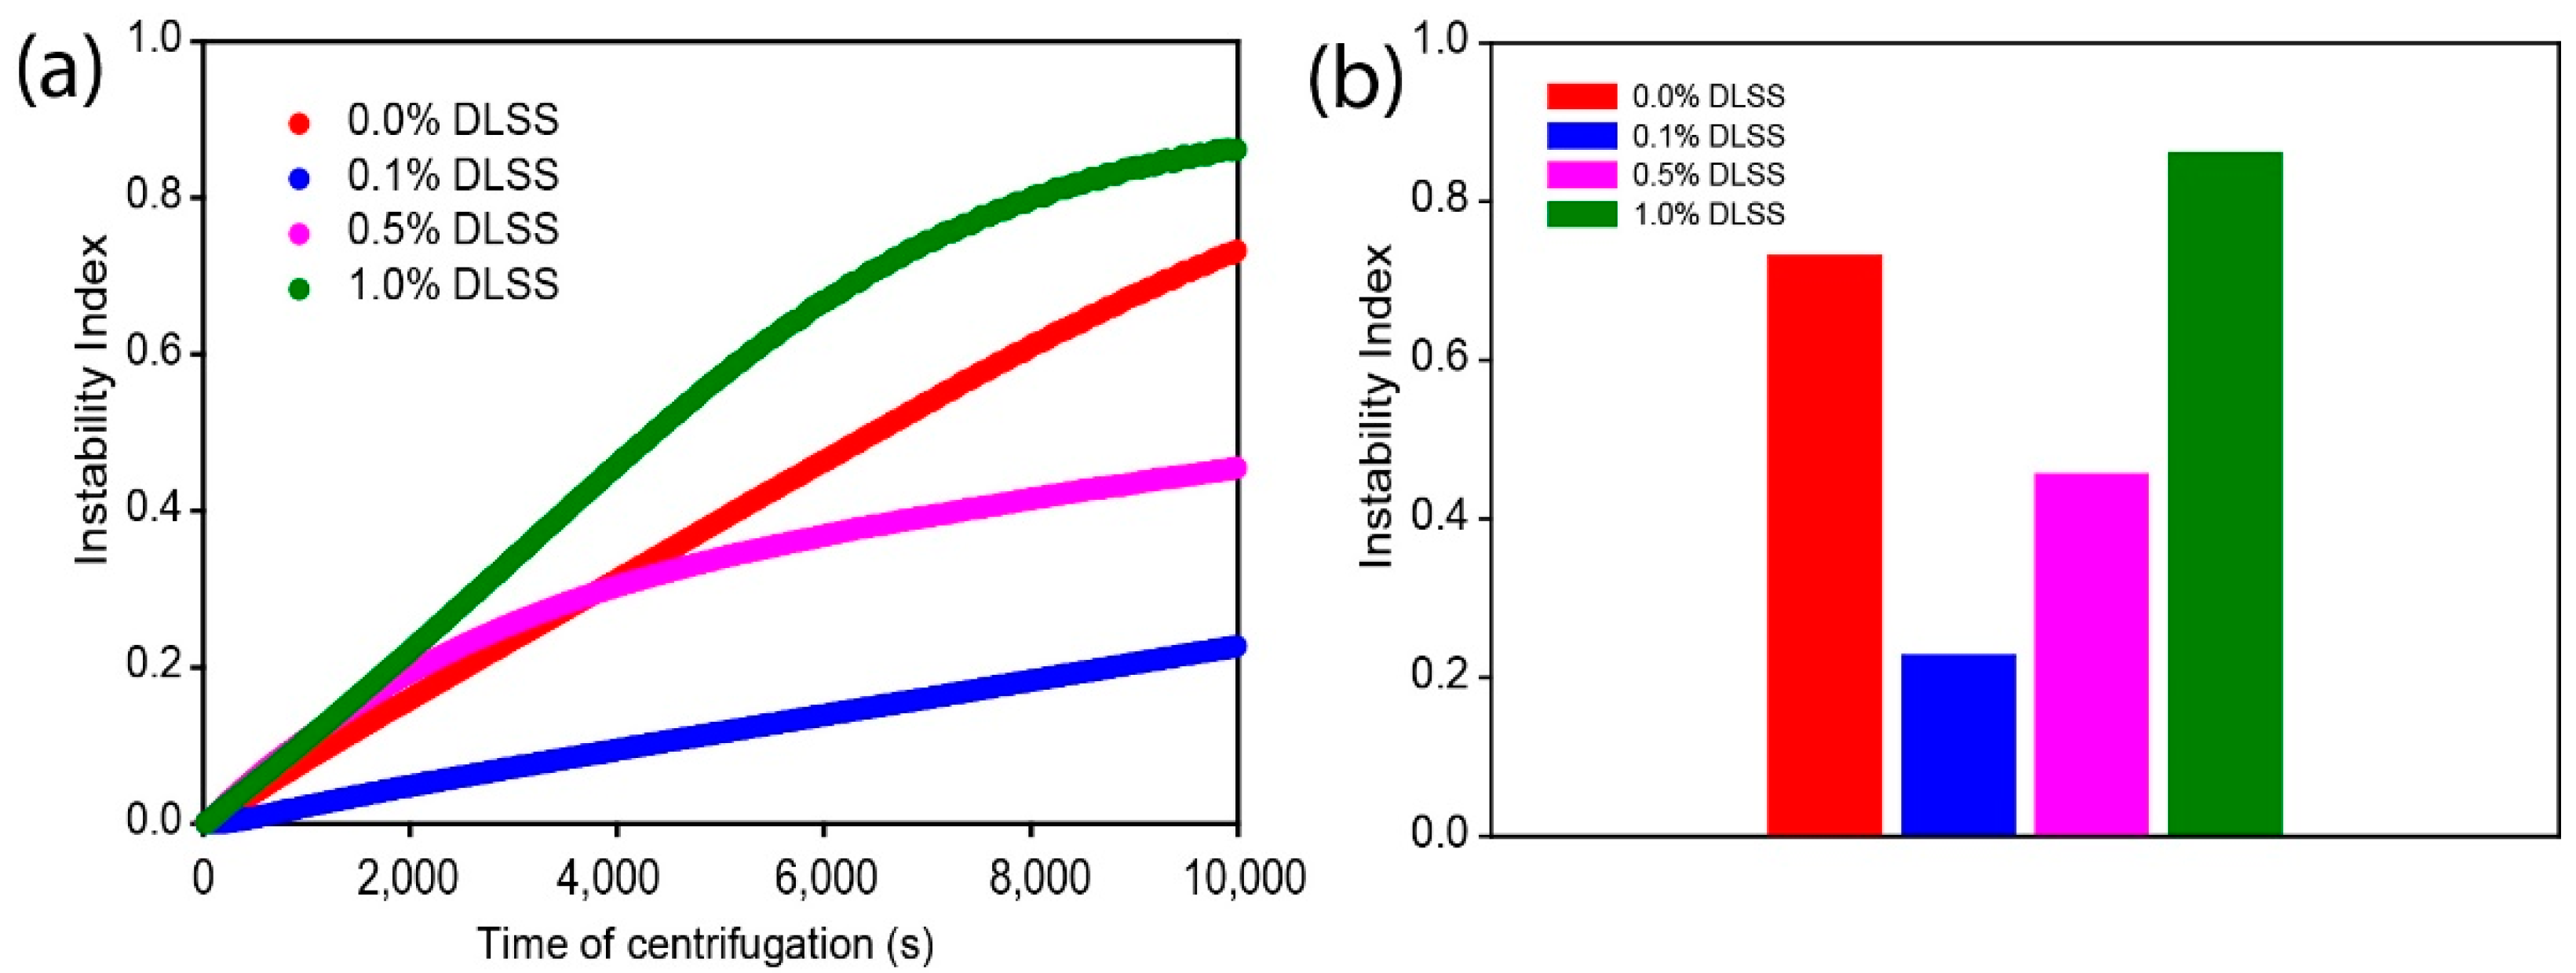
As the amount of DLSS varied from 0 to 1.0 wt.%, the dispersion stability of the aqueous ceramic coating slurries (CMC/Al
2O
3/DLSS/D.I. water = 1/39−x/x/60 by weight) changed significantly (
Figure 1a). 0.1 wt.% of DLSS demonstrated the lowest instability index over 10,000 s of centrifugation. When a small amount of the DLSS (0.1 wt.% of DLSS) was added, the dispersion stability of the aqueous ceramic coating slurry was significantly improved compared to the case without DLSS. 0.1 wt.% of DLSS demonstrated the lowest instability index (0.227) and slowest particle sedimentation (0.310 µm) at 10,000 s of centrifugation (
Figure 1b,
Table S1 in Supplementary Materials). The increase in light transmission (clarification) owing to phase separation by sedimentation is proportional to the decrease in particle concentration in any part of the slurry over time. As shown in
Figure S1 (Supplementary Materials), 0.1 wt.% of DLSS had the minimum light transmission indicating a uniform ceramic dispersion. Interestingly, the dispersion stability of the aqueous ceramic coating slurry decreased as the amount of DLSS was increased above 0.1 wt.%. For 1.0 wt.% DLSS, the instability index of aqueous ceramic slurry even exceeded that without DLSS. This phenomenon might be due to the following reasons: (1) With the addition of DLSS, DLSS adsorbed on the Al
2O
3 surface, causing an improvement in dispersion stability. (2) As the DLSS concentration increases after the saturation point (0.1 wt.% in our experiments), the reversed micelles are formed, and they can promote the aggregation of Al
2O
3 to achieve the largest entropy, reducing dispersion stability [
21,
22,
23].
Surface interactions between inorganic particles and surfactant molecules form the basis for slurry stabilization [
23,
24]. Al
2O
3 particles have a net positive surface charge (20.30 ± 4.98 mV). In contrast, DLSS has negatively charged anionic sulfonate heads, and CMC has a negative surface charge density (−58.40 ± 3.76 mV). This implies that both DLSS and CMC can be adsorbed to the Al
2O
3 surface, so the properties of the aqueous ceramic coating slurries are affected by various factors: (1) the mixing order of slurry components and (2) the interaction between the slurry components (i.e., the interaction between Al
2O
3 and DLSS, and the interaction between Al
2O
3 and CMC) [
24,
25,
26].
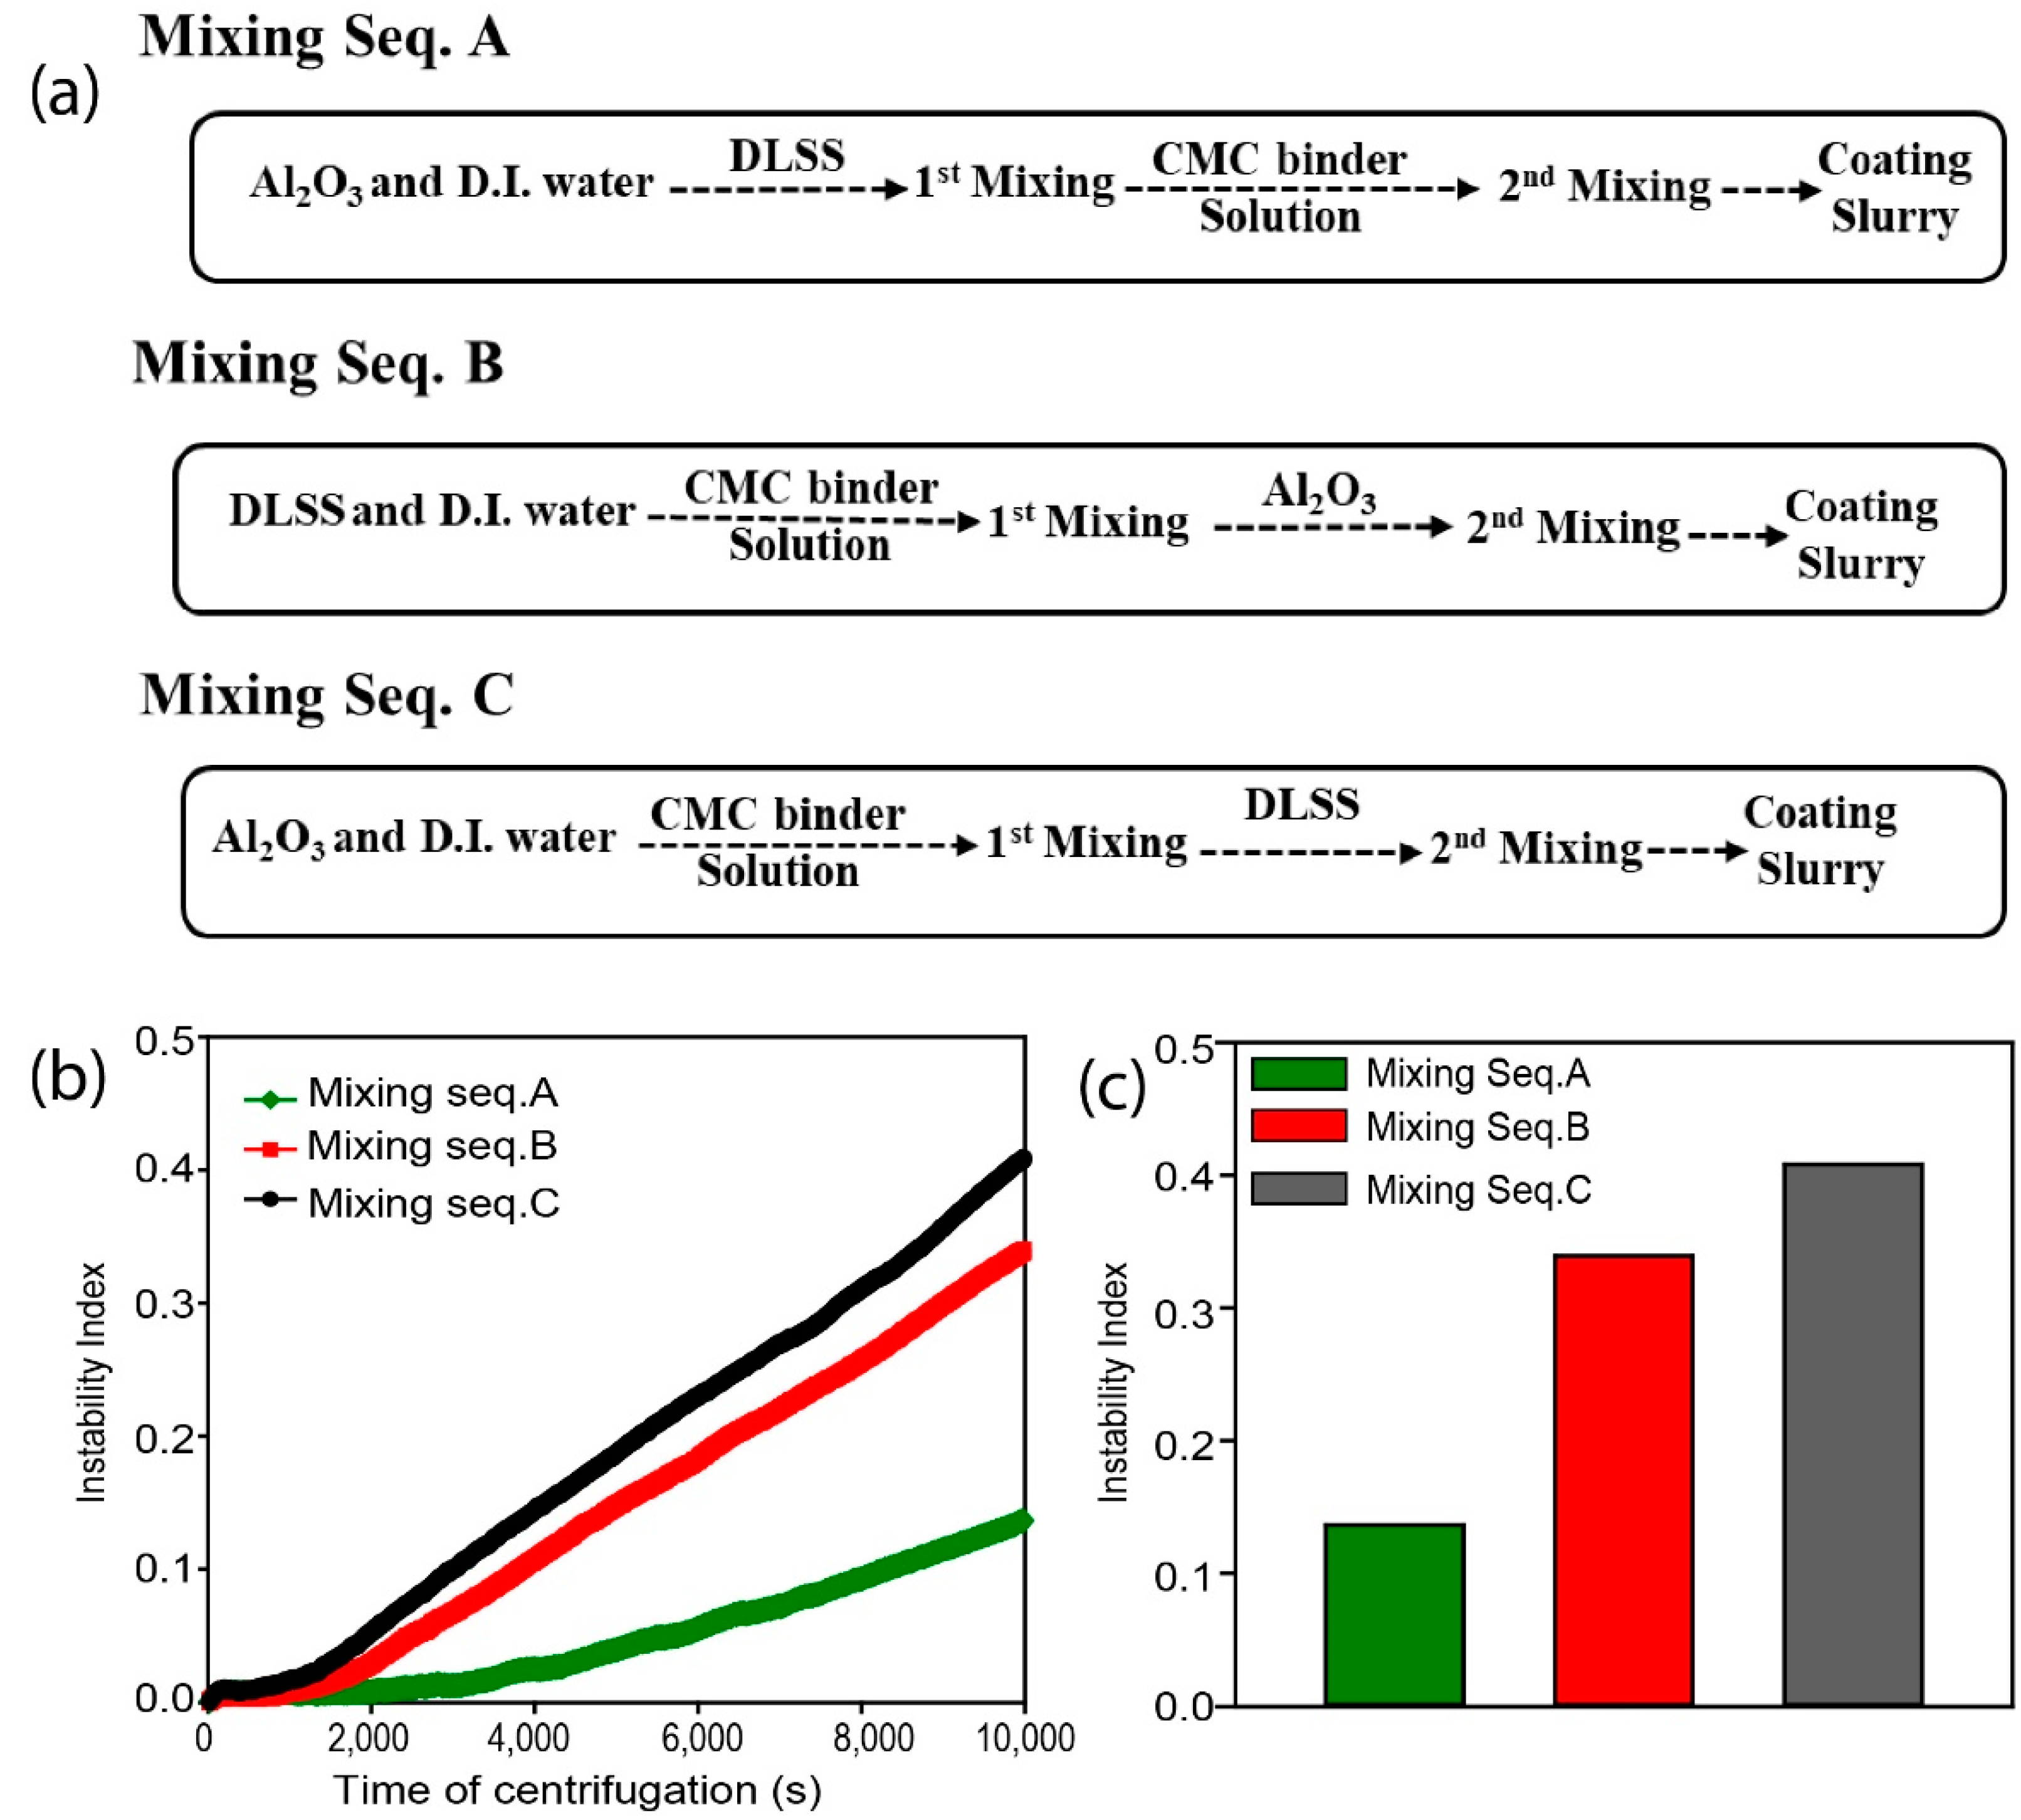
We investigated the effect of such interactions on Al
2O
3 ceramic slurry dispersion stability by altering the mixing order of the aqueous ceramic coating slurries, as shown in
Figure 2a. The dispersion stability of the slurries according to the mixing order was A > B > C. The aqueous ceramic coating slurry prepared by mixing order A exhibited the lowest instability index of 0.136 and the slowest particle sedimentation rate of 0.149 ± 0.003 µm s
−1 (
Figure 2b,c,
Table S2 in Supplementary Materials). This implies that when DLSS first met Al
2O
3 particles, Al
2O
3 particles became more stabilized than when CMC met Al
2O
3 particles first. To further visualize the effect of the mixing order in upscaling the ceramic dispersion stability and coating process, the phase separation of the slurries was investigated by allowing sedimentation of the slurries over time under gravity. The aqueous ceramic coating slurry prepared by mixing order A maintained a more uniform dispersion over 30 days than that prepared by mixing orders B and C (
Figure 3a).
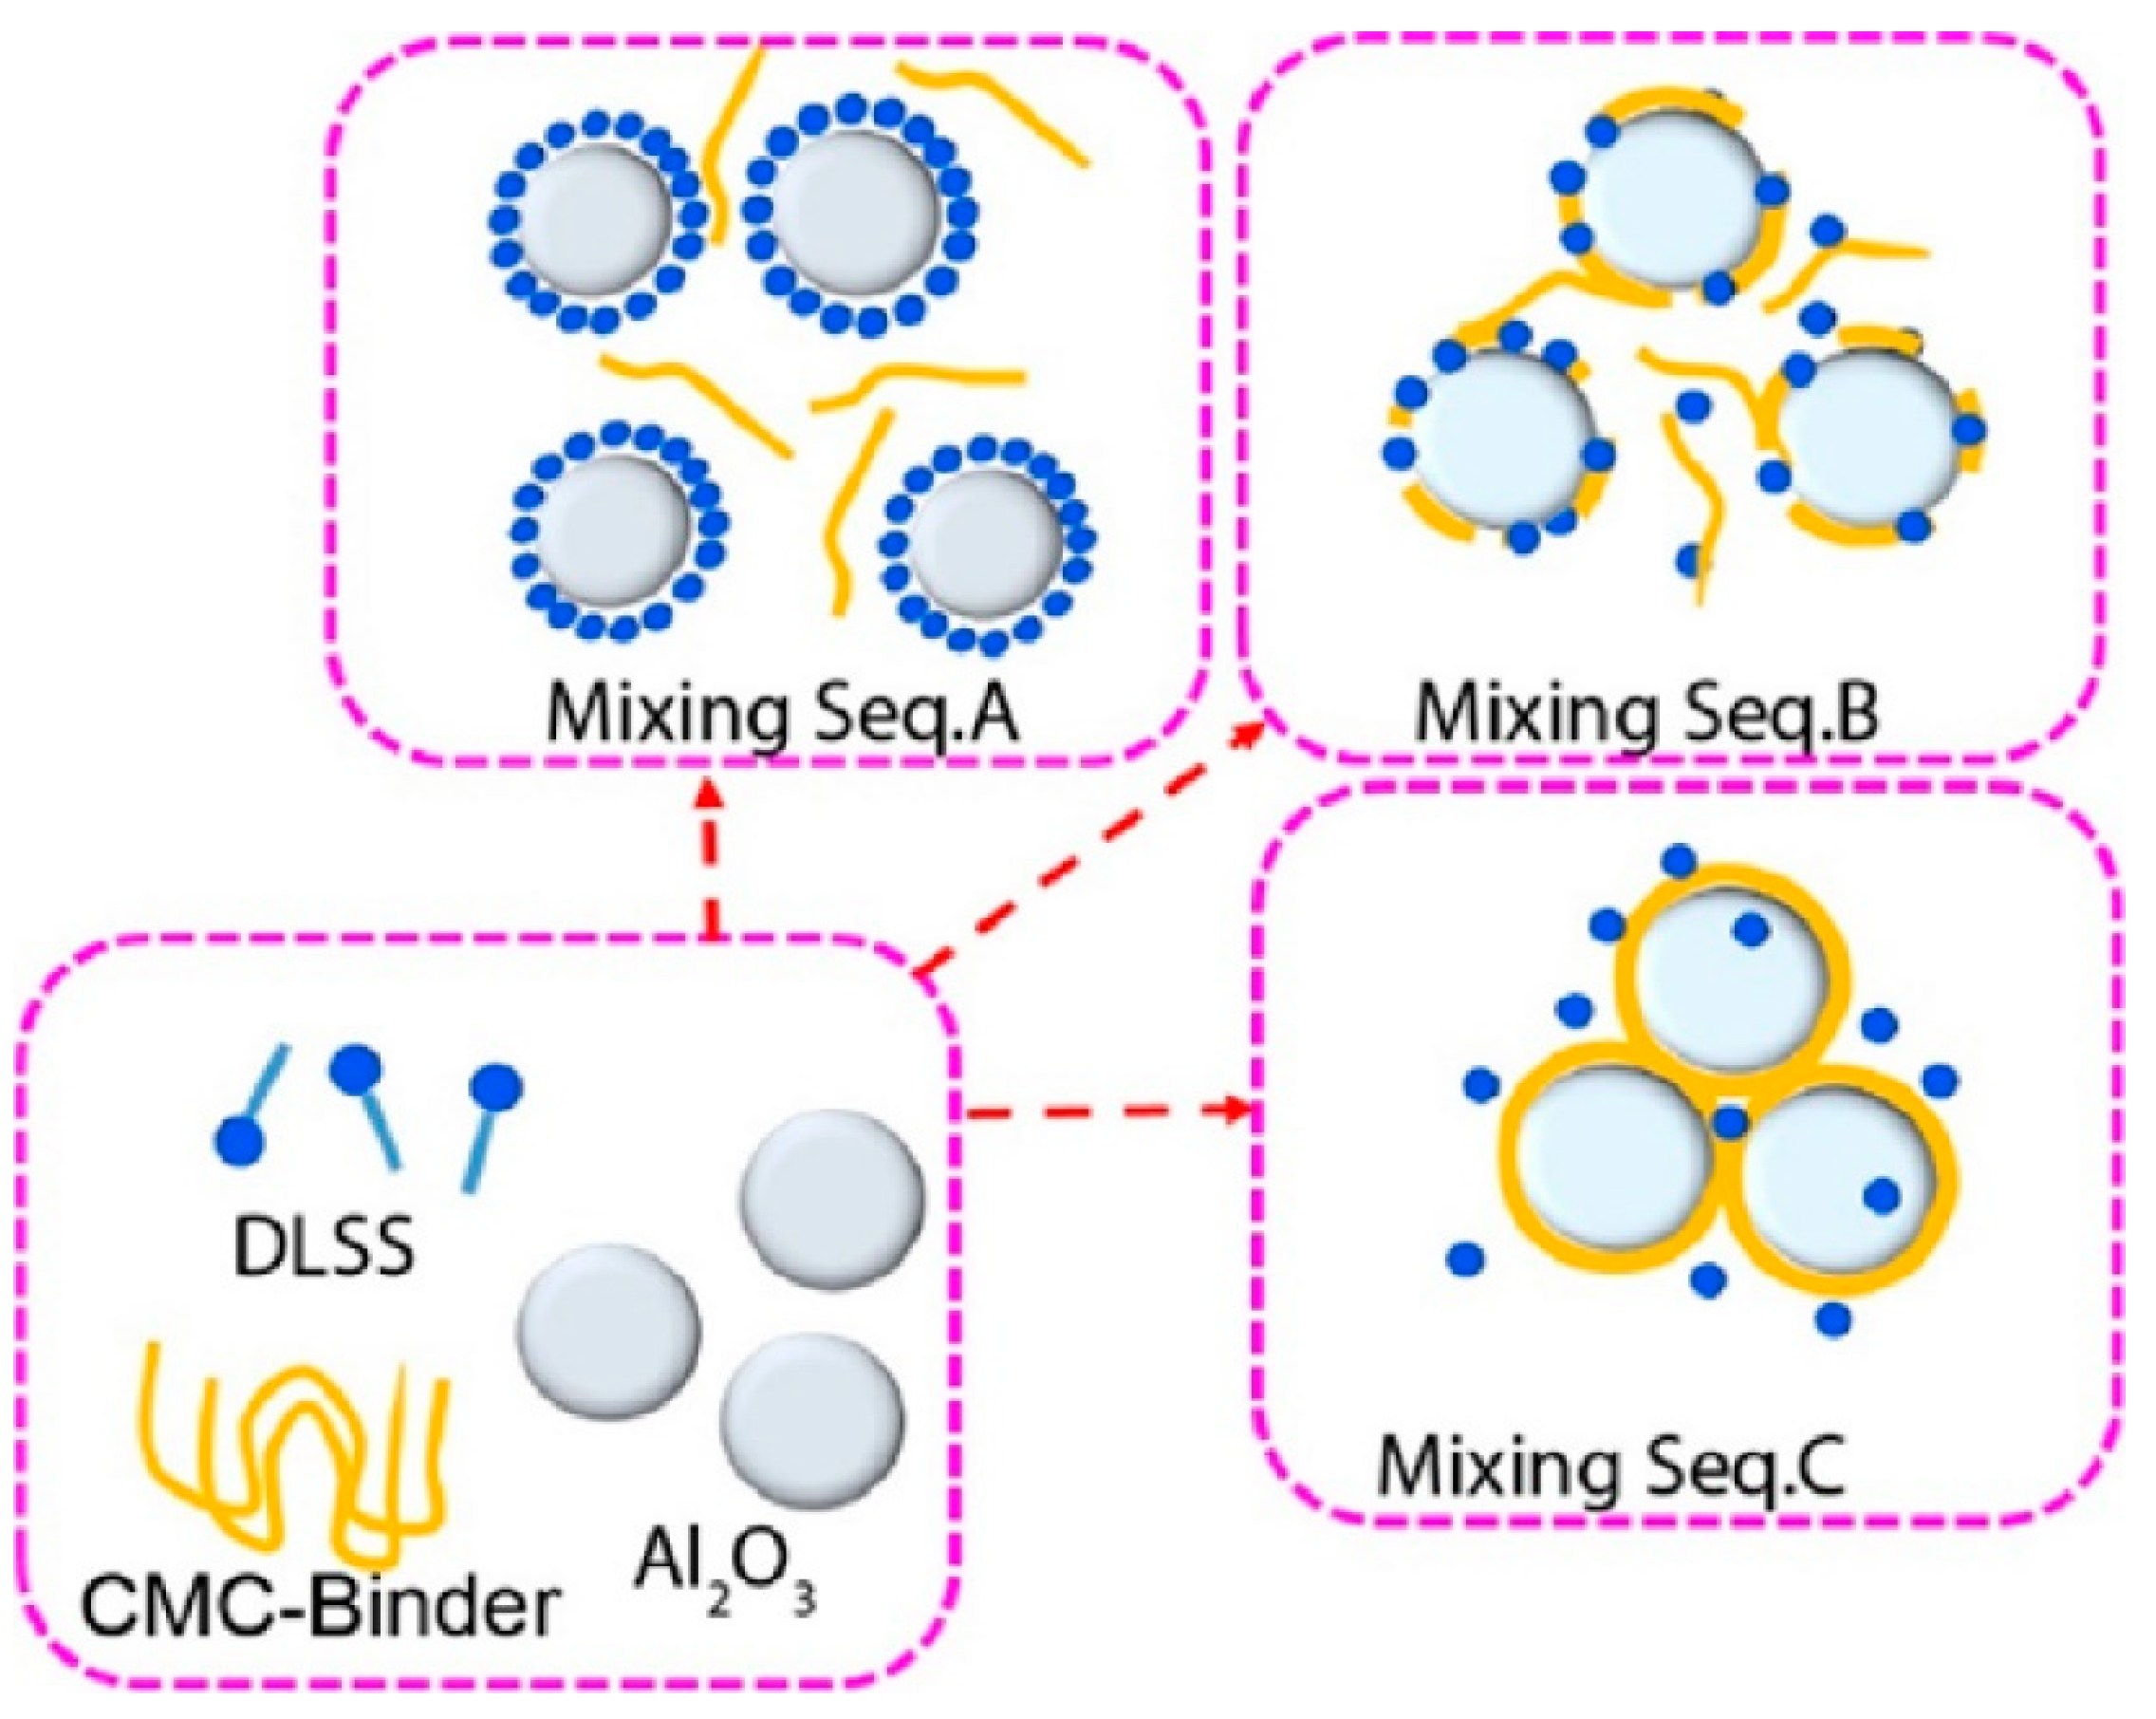
By comparing the dispersion stability of aqueous ceramic slurries made of mixing orders A and C, it can be deduced that the improvement in the dispersion stability effect of DLSS is significant even though both DLSS and CMC surround the surface of the Al
2O
3 particles. DLSS surrounds Al
2O
3 particles and forms a bilayer to create steric repulsion between adjacent DLSS-encapsulated Al
2O
3 micelles, resulting in a stable dispersion state [
3,
17,
18]. Unlike DLSS, which has both polar and non-polar groups in one molecule, CMC cannot form a bilayer around the Al
2O
3 surface because it has a linear chain structure.
When Al2O3 particles were mixed into a slurry containing both DLSS and CMC according to mixing order B, the dispersion stability of the aqueous ceramic slurry was intermediate between mixing orders A and C. The co-adsorption of DLSS and CMC on Al2O3 particles impairs the efficiency of electrostatic repulsion forces induced by a single DLSS bilayer, lowering the dispersion stability of mixing order A. Considering that both DLSS and Al2O3 favor adsorption on Al2O3, it can be seen that the mixing condition that can induce the initial contact of DLSS with Al2O3 is a key factor in improving the dispersion stability of aqueous ceramic slurries using the same slurry components.
The order of the number of bubbles produced in the aqueous ceramic coating slurries prepared by mixing orders A, B, and C was opposite to that of the dispersion stability. The number of bubbles was in the order A < B < C, and the dispersion stability of the slurries according to the mixing order was in the order A > B > C. For instance, the aqueous ceramic coating slurry prepared by mixing order A exhibited the highest dispersion stability and the lowest number of bubbles after slurry preparation (
Figure 3b). Considering that the determinant of the dispersion stability of the slurry was the amount of DLSS adsorbed on Al
2O
3, it can be inferred that the amount of free DLSS not adsorbed on Al
2O
3 is the key to the number of bubbles. This is because the dense DLSS bilayers of Al
2O
3 imply that there is less free DLSS in the bulk solution, resulting in minimal bubble coalescence in the slurry (
Figure 4) [
27,
28].
Given this background, we inferred that mixing sequence A is an optimized process for CCS preparation. Therefore, we fabricated CCSs using the mixing sequence A and investigated their physical and electrochemical properties.
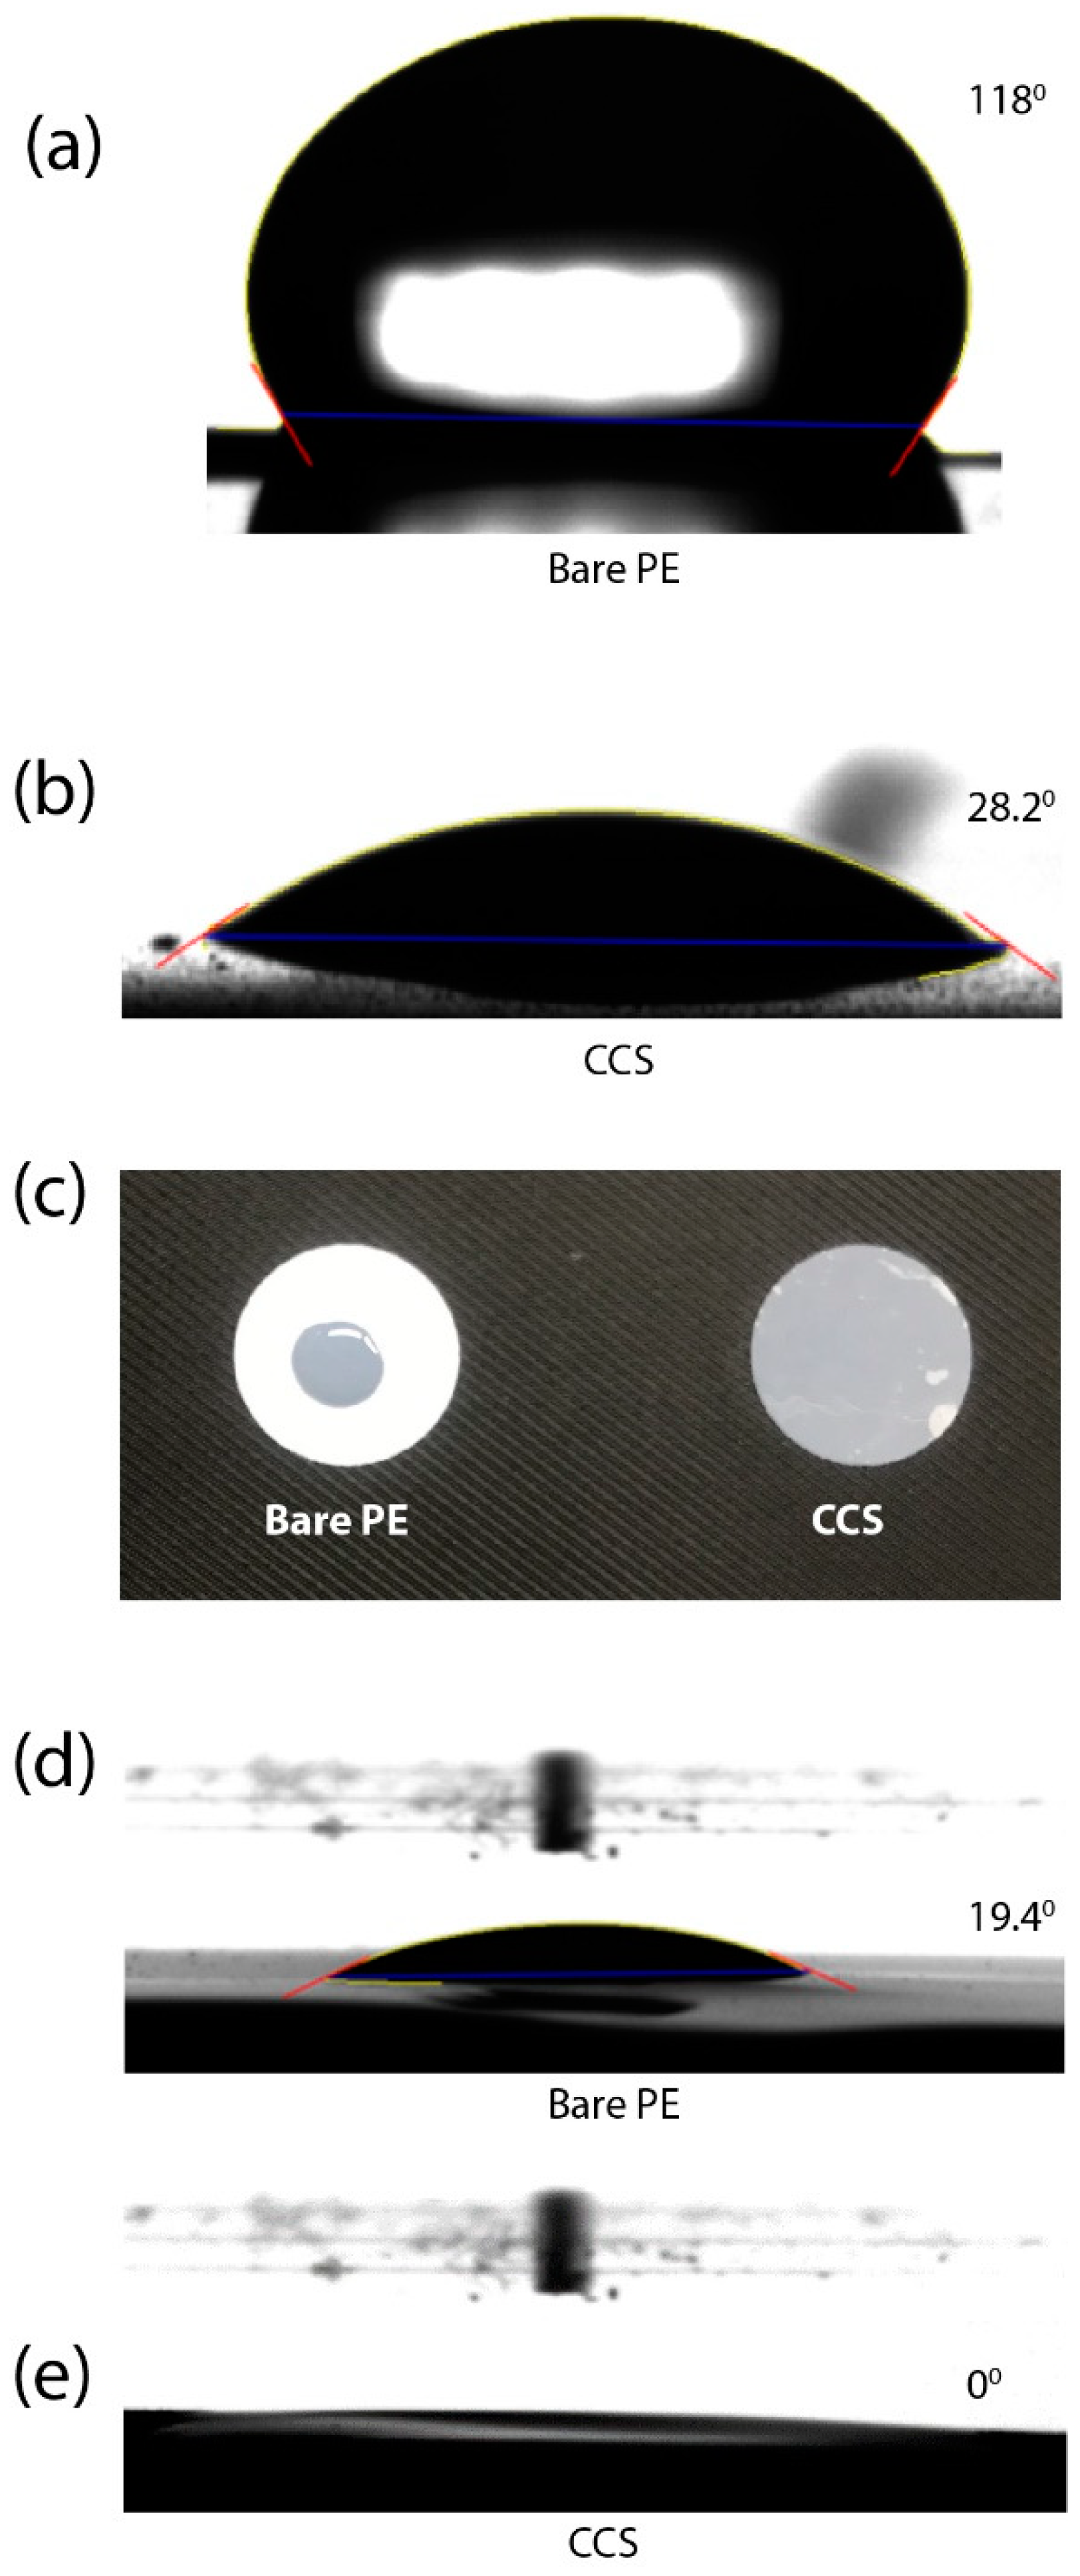
DLSS improved the dispersion stability of aqueous ceramic coating slurries and the wetting properties of CCSs. DLSS lowered the surface tension of the water droplets because the polar anionic head groups project towards the aqueous interface and remain in contact with water, whereas the non-polar hydrocarbon tail groups project towards the PE surface. To investigate the hydrophilicity of the bare PE separators and CCSs quantitatively, a droplet of D.I. water was dropped on both the bare PE separators and CCSs, and contact angle measurements were performed (
Figure 5a,b). The CCSs showed a much smaller contact angle (28.2°) than the bare PE separator (118.0°). Furthermore, to investigate the affinity of the bare PE separators and CCSs for the liquid electrolytes, the same amount of liquid electrolyte was dropped on the surfaces of both the bare PE separators and CCSs, and the surfaces were monitored using a digital camera (
Figure 5c–e). The CCSs quickly absorbed the liquid droplets, while the bare PE retained the shape of the liquid electrolyte droplet.
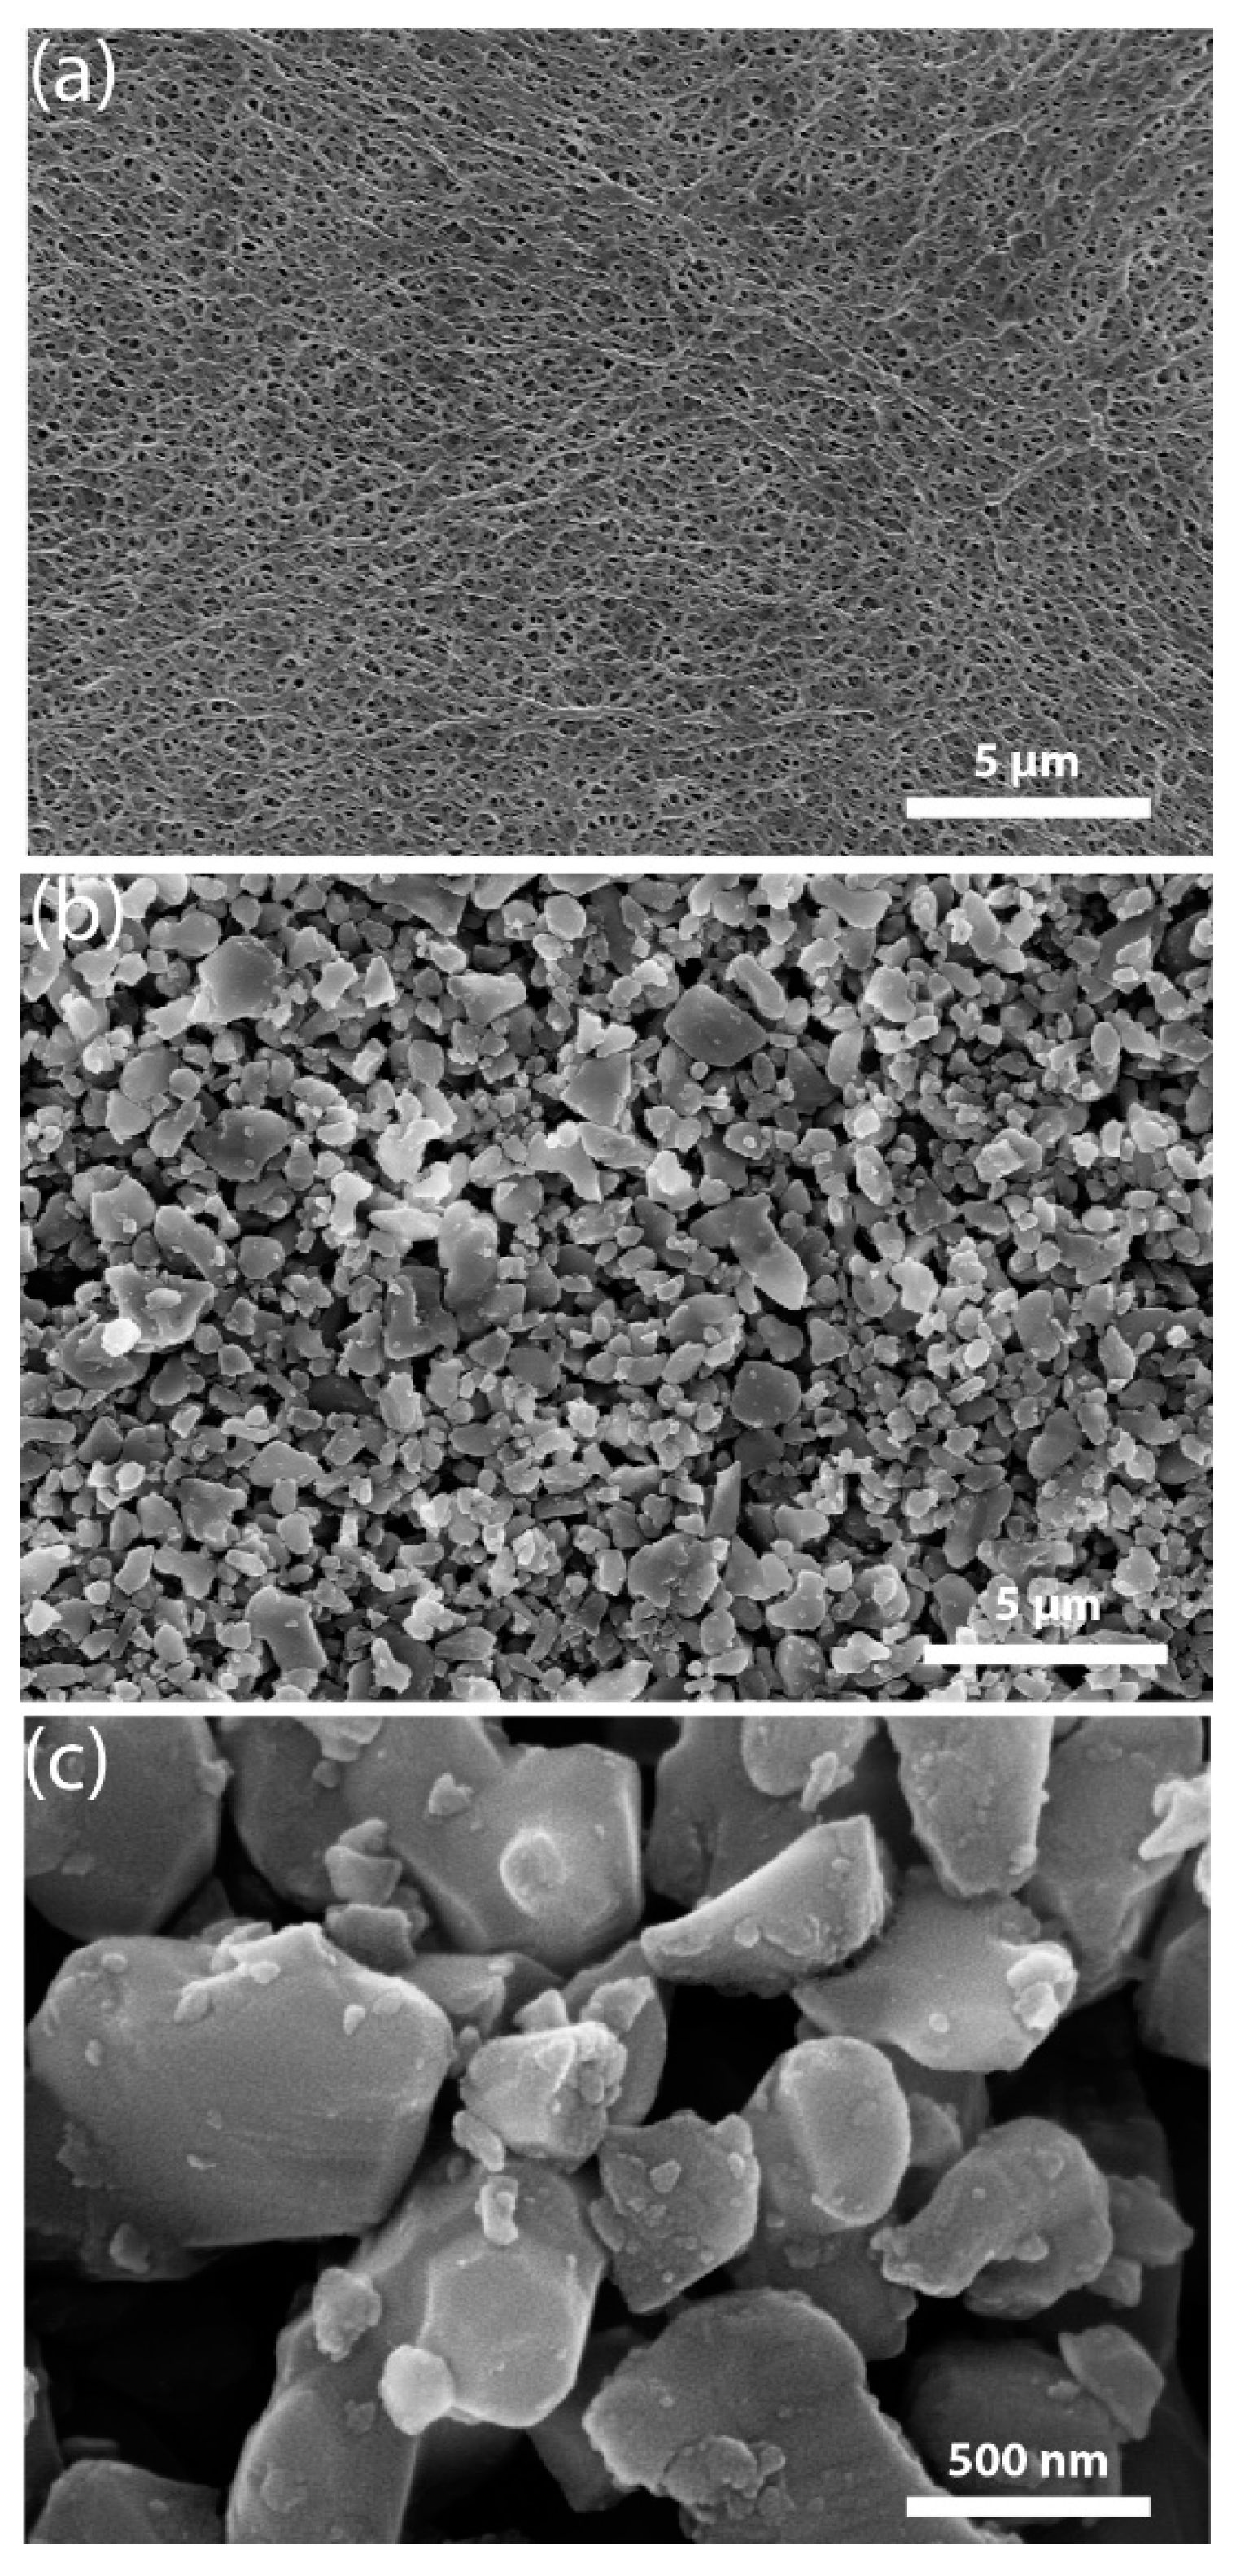
The physical characteristics of the bare PE separators and CCSs, such as the coating layer thickness, air permeability (Gurley number), liquid electrolyte uptake, bulk resistance, and ionic conductivity, were investigated (
Table 1). The thickness of the CCSs was controlled to be ~6 µm in all experiments. In general, separator permeability is quantified by air permeability measurements in terms of the Gurley number. The Gurley number is calculated by measuring the time taken for a specific volume of air to pass through a specific area of the separator at constant pressure [
19,
29]. Consequently, the Gurley number provides additional information regarding the internal structure of the separators, such as the pore structure and tortuosity. The Gurley number of the CCSs was higher than that of the bare PE separators because of the physical barrier (Al
2O
3 coating layer) on the CCSs. Nevertheless, CCSs showed a higher ionic conductivity (0.848 mS cm
–1) because of their highly improved wetting ability, resulting in a high amount of liquid electrolyte uptake (177%) [
30]. The surface morphologies of the bare PE separators and CCSs were investigated in detail using SEM. For the CCSs, Al
2O
3 ceramic particles uniformly covered the entire surface of the bare PE separators (
Figure 6).
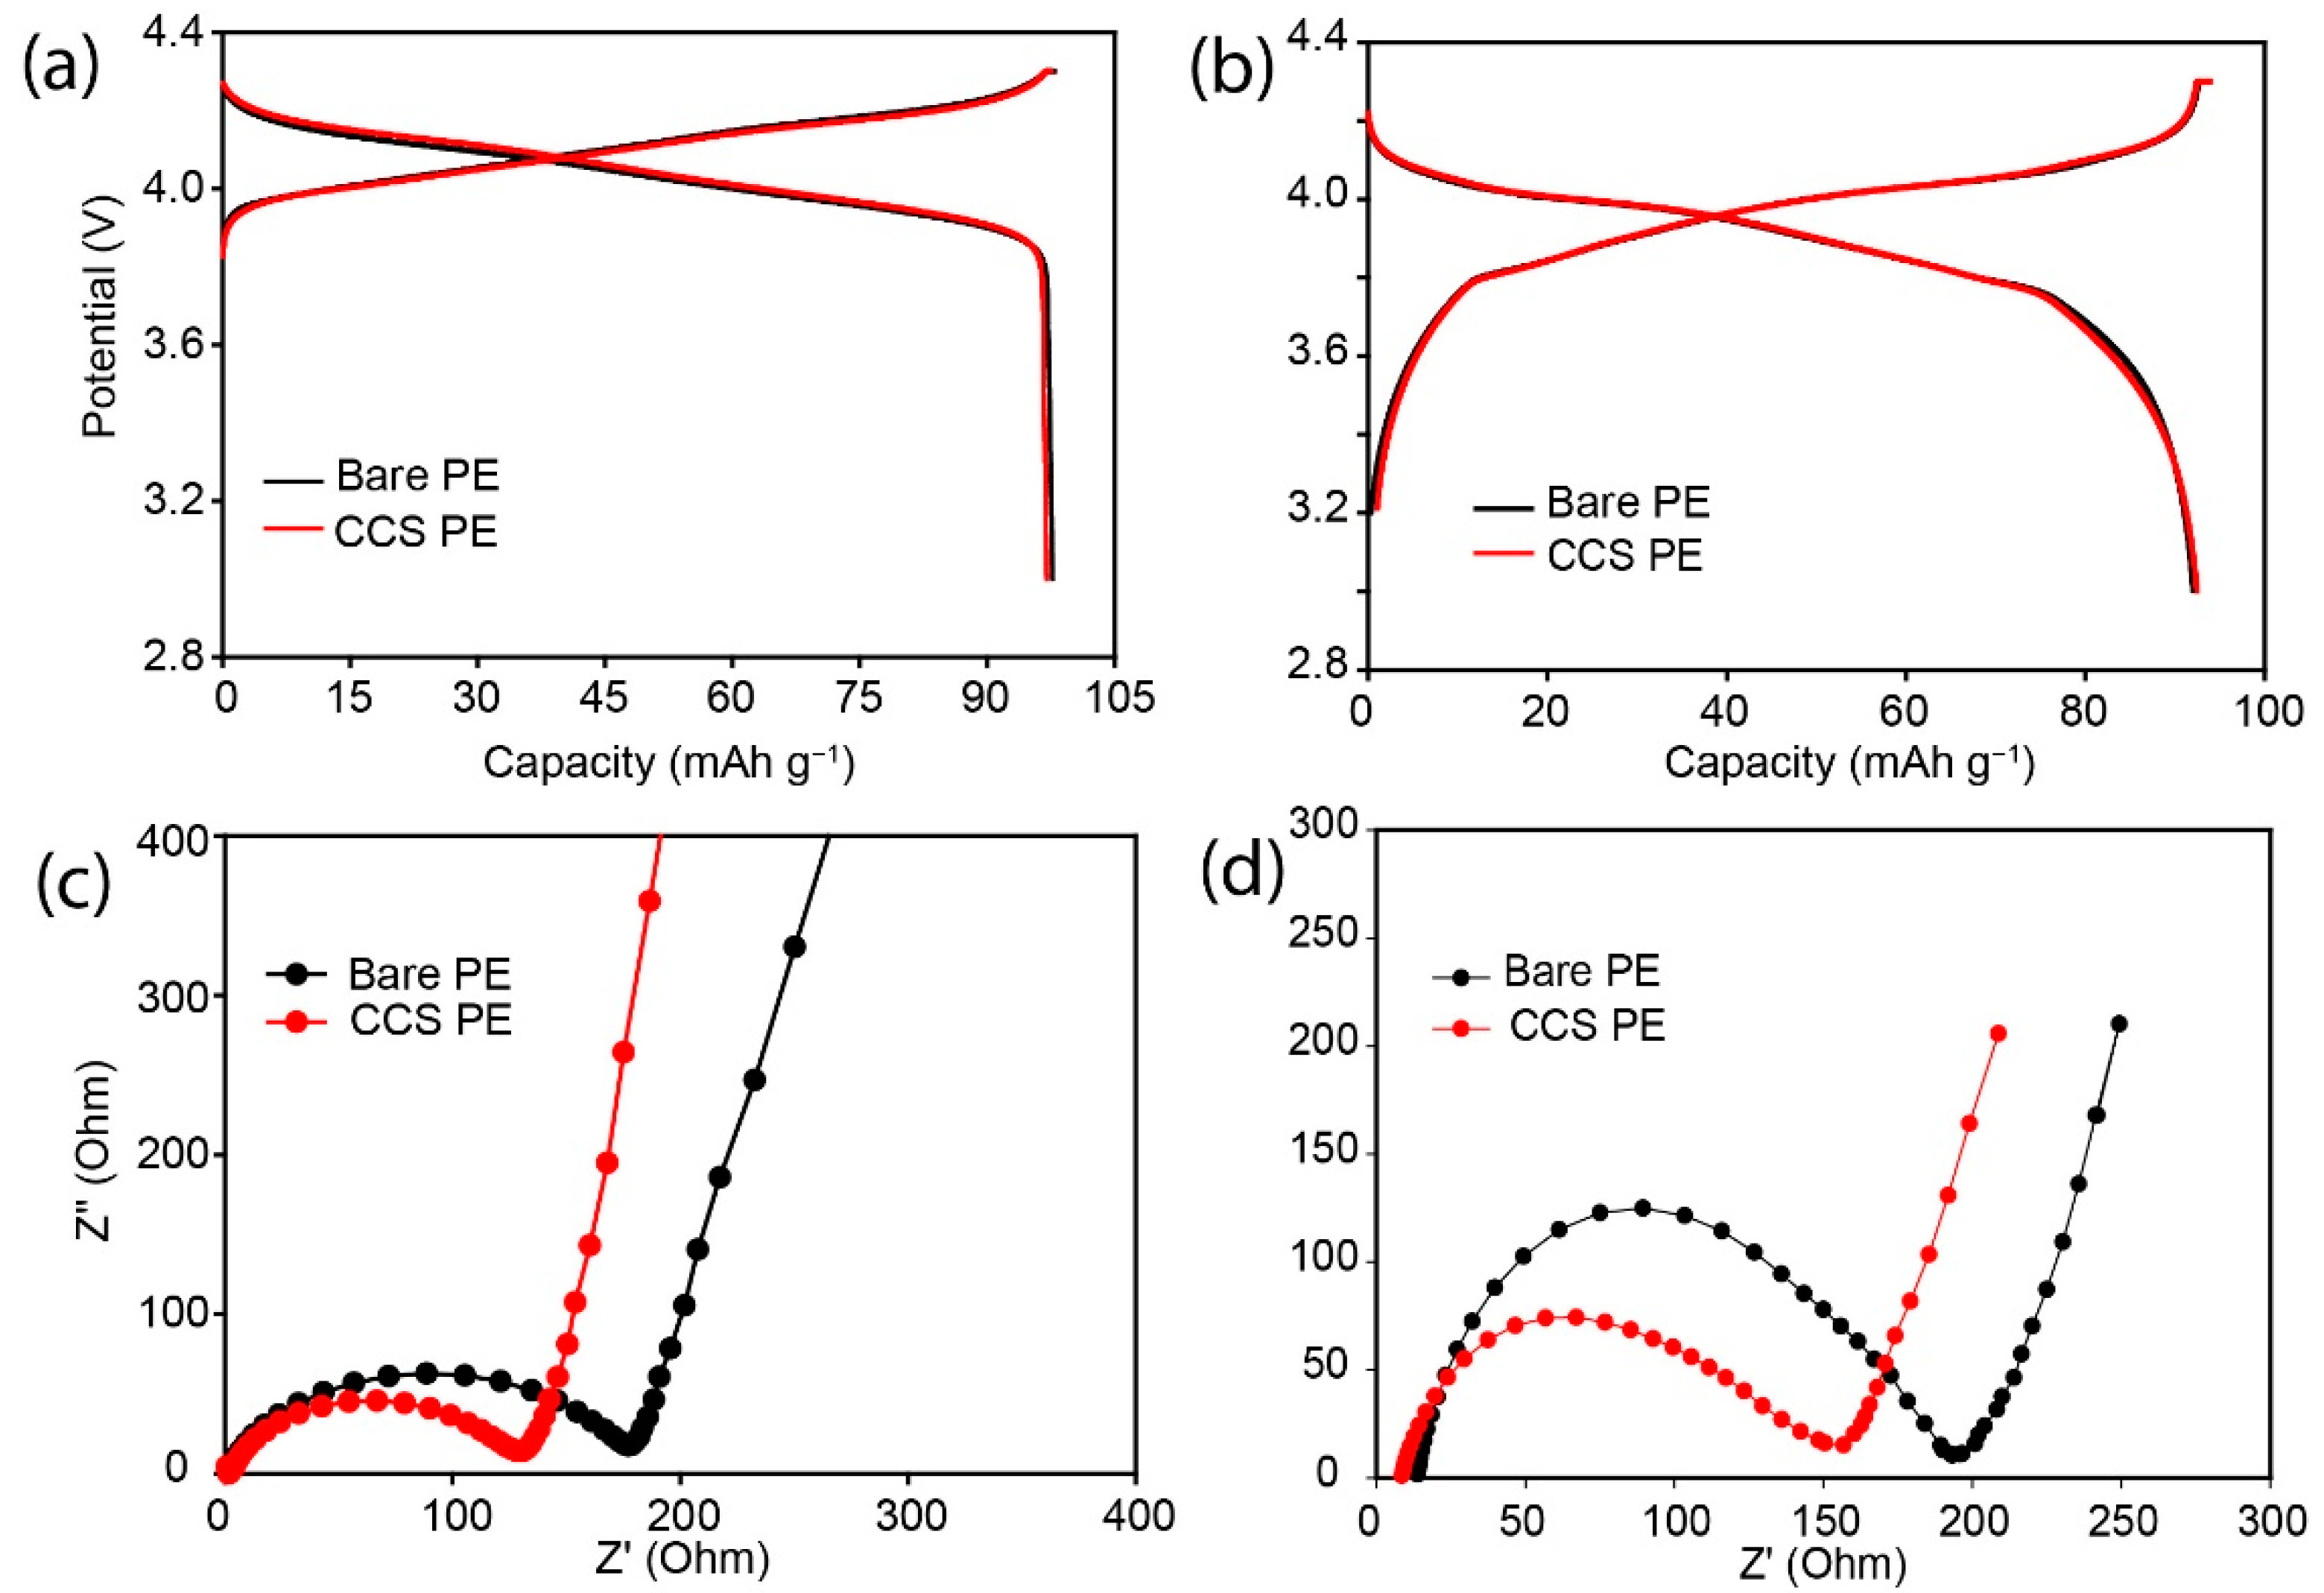
To investigate the electrochemical properties of bare PE separators and CCSs, full cells (LMO/separator/graphite) and half cells (LMO/separator/Li metal) were prepared, and their cycle performance and rate capability were measured.
The half and full cells containing bare PE separators and CCSs showed similar profiles (potential profile for half cells and voltage profile for full cells) during pre-cycling (
Figure 7a,b). After pre-cycling, the AC impedances of the half and full cells were measured. For both half cells and full cells, the cells containing CCSs showed a smaller total resistance (Rcell) compared to the bare PE separators (
Figure 7c).
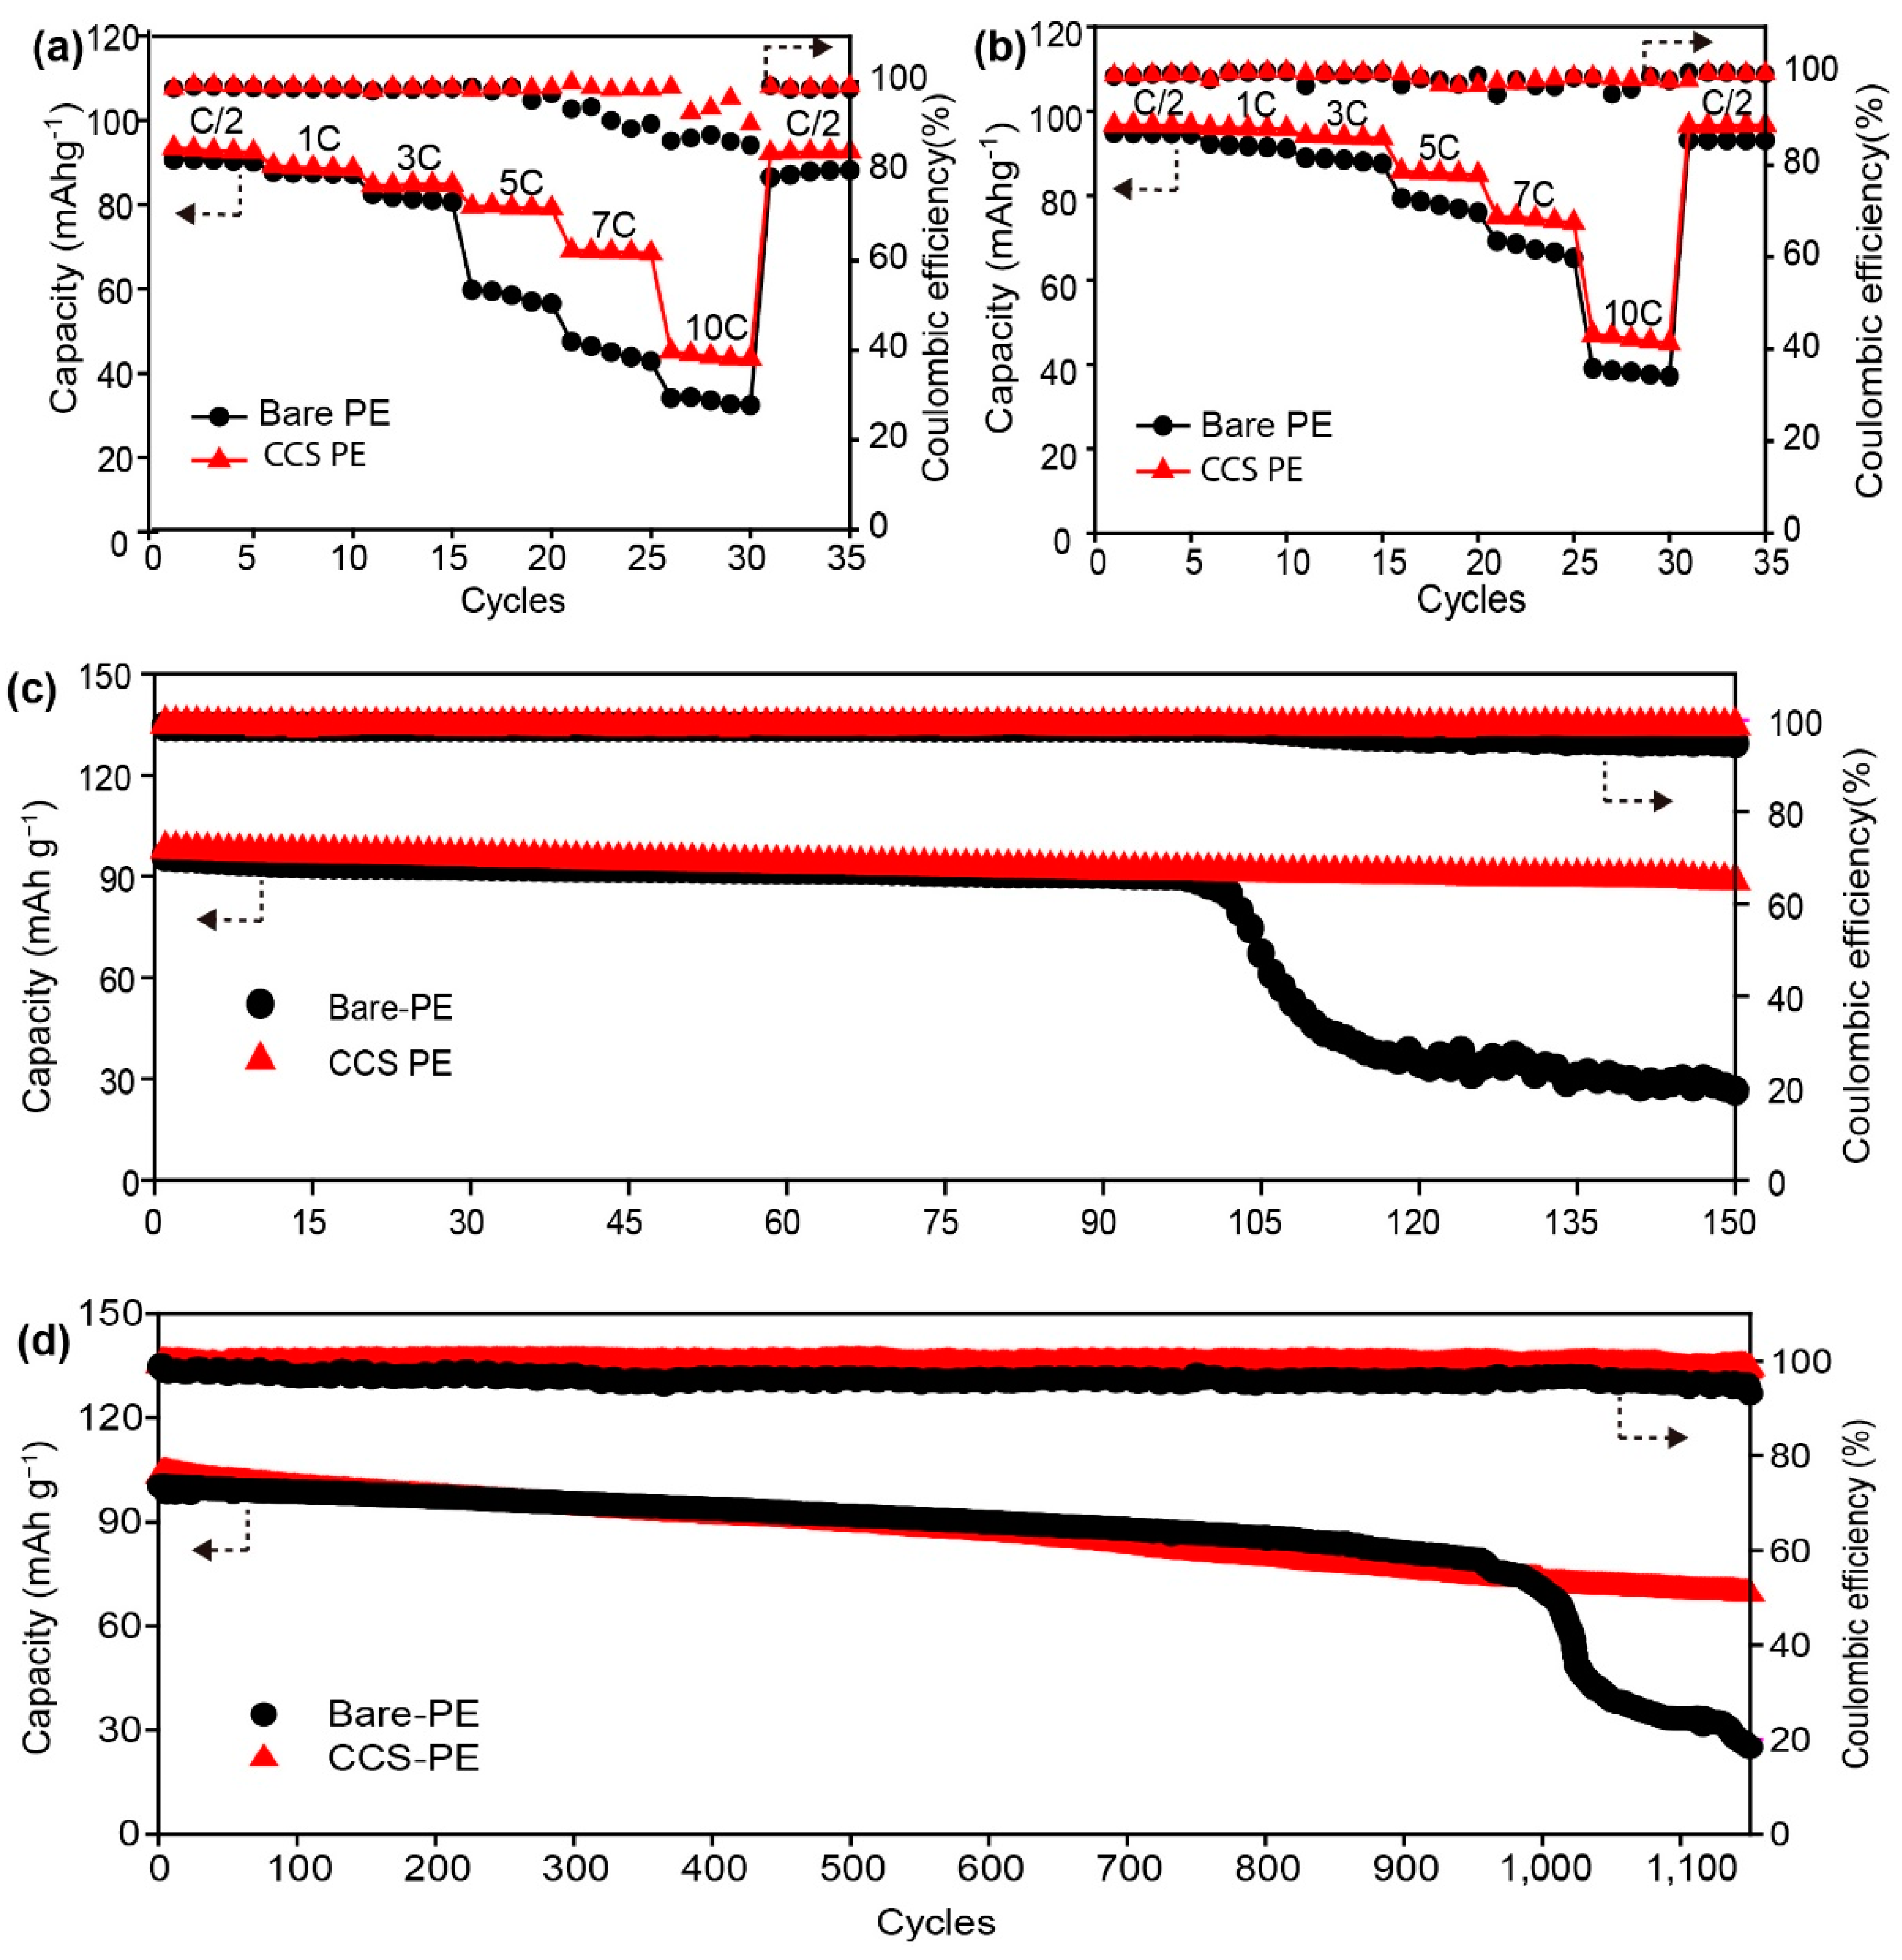
For the rate capability evaluation, the discharge current density varied from C/2 (0.640 mA cm
−2) to 10C (12.8 mA cm
−2), while maintaining the charging current at a C/2 rate (
Figure 8a,b). After the 30th cycle, the discharge current density was restored to C/2. For both types of cells (half cells and full cells), the cells containing CCSs showed superior rate capabilities compared to those containing bare PE separators. For both cell types, the discharge capacities at the 35th cycle were restored to the values of the first cycle. This implies that any reduction in the discharge capacities observed was dominated by kinetic factors instead of the electrochemical degradation of either active materials or electrolytes [
3,
9].
CCSs improved the rate capability of the half-cells (LMO/separator/Li metal) compared to bare PE separators. The half-cells with CCSs exhibited improved rate capability compared to the bare PE separators (
Figure 8a). CCSs maintained 72.2% (65 mAh g
−1) of the initial discharge capacity at the 25th cycle under the 7C discharge condition, whereas the bare PE separators maintained 27.7% (25 mAh g
−1) of the initial discharge capacity (
Figure 8a). Furthermore, the half-cells containing CCS showed improved cycle performance compared to the bare PE separators. The half cells with CCSs retained 90.4% (88.43 mAh g
−1) of their initial discharge capacity until the 150th cycle. In contrast, the cells with bare PE separators showed a sharp capacity decline after the 100th cycle and retained only 27.6% (26.39 mAh g
−1) at the 150th cycle (
Figure 8c).
The CCSs improved the electrochemical performance of full cells (LMO/separator/graphite) compared to that of bare PE separators. CCSs maintained 75.0% (75.0 mAh g
−1) of the initial discharge capacity at the 25th cycle under the 7C discharge condition, whereas the bare PE separators maintained 68.0% (68.0 mAh g
−1) of the initial discharge capacity (
Figure 8b). Furthermore, CCSs retained 69.8% (72.2 mAh g
−1) of their initial discharge capacity up to 1150 cycles (
Figure 8d), while bare PE separators showed only 24.9% (25.0 mAh g
−1). CCSs showed more stable coulombic efficiencies than bare PE separators for both half-cells and full cells, which were ~100% up to 150 cycles and 1150 cycles, respectively.
Considering that the origin of the considerable decrease in the discharge capacity in both half and full cells is the increase in the internal resistance of the cells, it can be inferred that CCSs improved the electrochemical performance (rate capacity and cycle performance) by reducing the internal resistance of the cell systems. Aside from the active material loss in both half cells and full cells, as listed in
Table 1, CCSs with increased ionic conductivity and high liquid electrolyte uptake are advantageous for resistance reduction compared to bare PE separators.


 ,
, 


