Article

Study of Quaternary Ammonium Additives towards High-Rate Zinc Deposition and Dissolution Cycling for Application in Zinc-Based Rechargeable Batteries

1
Renewable Energy Group, College of Engineering, Mathematics and Physical Sciences, University of Exeter, Penryn Campus, Exeter TR10 9FE, UK
2
Department of Earth Science and Engineering, Royal School of Mines, Imperial College London, London SW7 2AZ, UK
3
Key Laboratory of Low-grade Energy Utilization Technologies and Systems, MOE, Chongqing University, Chongqing 400030, China
*
Author to whom correspondence should be addressed.
Author’s Current Affiliation and Address: State Environmental Protection Key Laboratory of Environmental Risk Assessment and Control on Chemical Process, School of Resources and Environmental Engineering, East China University of Science and Technology, 130 Meilong Road, Shanghai 200237, China.
Batteries 2022, 8(9), 106; https://doi.org/10.3390/batteries8090106
Submission received: 14 July 2022 / Revised: 17 August 2022 / Accepted: 19 August 2022 / Published: 30 August 2022

Abstract

:
Aqueous zinc-based rechargeable batteries, such as Zn-Ni and Zn-Air, have been increasingly re-investigated over the last decade due to the abundant and inexpensive nature of zinc, the high solubility of zinc ions, and rapid kinetics and most negative standard potential of the Zn(II)/Zn redox couple in aqueous media. However, the overwhelming challenge that has prevented the implementation of next-generation Zn batteries lies in their poor rechargeability—flowing electrolytes have proven to be of benefit to zinc deposition and dissolution cycling, but the rapid zinc deposition–dissolution at practical current densities of 100 mA cm2 or over is still questionable. Herein, we demonstrated that applying an optimal concentration of quaternary ammonium electrolyte additives with carefully selected cations’ alkyl groups can effectively improve the high-rate zinc cycling performance at 100 mA cm2/20 mAh cm2. The resultant additives significantly reduced the initial coulombic efficiency loss to only 1.11% with coulombic efficiency decay rate of 0.79% per cycle, which is less than a quarter of the benchmark of 6.25% and 3.75% per cycle for no additives.

1. Introduction

The past several years have witnessed the resurgence of aqueous zinc-based rechargeable batteries as potentially safer and lower-cost alternatives to non-aqueous lithium-ion batteries without much compromise on energy and power density [1,2]. A wide variety of battery chemistries have been considered such as zinc–nickel [2,3], zinc–air [4,5], zinc–nickel/air hybrid [6,7], zinc–polyiodide [8,9], zinc–iron [10], zinc–cobalt oxide [11], zinc–polymer [12], and more recently even zinc–ion [13,14,15,16,17,18]. However, a long-standing challenge to be solved is the poor long-term cycling performance of zinc deposition and dissolution, particularly at a high charge and discharge rate of at least 100 mA cm2, considering that recent advances which have demonstrated durable cycling may be realized at current densities lower than 20 mA cm2 (with/without the assistance of flowing electrolytes) [19,20].
Fundamentally, the limited charge–discharge cycle life of zinc electrodes, or rapid decrease in their round-trip efficiency, is likely to be caused by one or more of the following reasons [21]: (1) zinc electrode shape change, (2) formation of dendritic and/or mossy structural zinc deposits, (3) hydrogen evolution side reactions, and (4) formation of zinc passivation layers and (5) self-discharge. Common solutions that have been proposed previously to improve zinc deposition and dissolution cycling [22] include: (1) modification of electrodes, (2) modification of electrolytes, and (3) other techniques such as pulse charging and flowing electrolytes.
Herein, the focus of this work was to identify suitable electrolyte additives for enhanced deposition–dissolution cycling at 100 mA cm2 through a systematic study of their influence on zinc deposition and dissolution. In fact, apart from the screening of a few modified zinc electrodes [23,24], little research has been conducted to standardize the assessment protocols for examining the influence of electrolyte additives on prolonged cycling. According to the previously reported results on electrolyte additives [25,26,27,28,29], most of the improvement strategies focused on the suppression of dendrite formation in order to achieve a smoother zinc deposit and thus more stable long-term cycling. Nevertheless, the effect of electrolyte additives on zinc deposition is a complicated issue and has never been fully understood at the atomic or molecular levels; this is related to the constantly changing interfaces between electrode substrates and electrolytes, which are heavily affected by operating conditions [30,31]. Hence, in this work, we focus on quaternary ammonium additives (QAAs), which have shown promise as potential leveling agents for zinc deposition [32,33].
Simultaneously, we replace the conventional zinc electrodes with carbon composite electrodes, which have been used previously in lead-acid single-flow batteries [34,35]. The new electrodes have three advantages: (1) the complete removal of zinc deposit becomes theoretically possible with no change of electrode structure after discharge, which is essential for durable long-term cycling; (2) medium-to-high overpotentials for hydrogen evolution side reactions are still required, compared with nickel or other metallic electrodes, ensuring high deposition coulombic efficiency (CE); and (3) the proposed planar carbon electrodes can also directly be used as bipolar plates in, e.g., zinc–nickel flow batteries. As a result, the operation of the resulting zinc-based batteries needs to start with a charging process (zinc deposition), suggesting it is imperative to design and form suitable zinc deposits for enhancing cycling performance.
A suitable blank electrolyte (stirred 0.5 M zinc oxide in 6 M potassium hydroxide solution) was first used for high-rate zinc deposition and dissolution cycling. A total of ten QAAs of three different concentrations were then examined to further enhance the zinc deposition and dissolution cycling performance. It was found in this work that the deposition overpotentials caused by QAAs were mainly determined by the types and concentrations of the alkyl groups of the cations. They had a critical impact on zinc deposit crystallinity/morphology and zinc deposition–dissolution cycling performance. More specifically, optimal cycling activities were achieved by those QAAs exhibiting deposition overpotentials of 20–60 mV. The most promising QAAs can reduce the cyclic voltammetry charge capacity losses, the first cycle coulombic efficiency losses, and the cycling coulombic efficiency decay rates down to only a quarter of the values for the no-additive benchmark.

2. Experimental Section

2.1. Chemicals

All of the following chemicals were used as received, without further treatment: zinc oxide (ZnO, ≥99.5%, Fisher Scientific, Loughborough, UK), potassium hydroxide (KOH, ca. 85%, pellets, ACROS Organics, Waltham, MA, USA), tetramethyl ammonium bromide (TMAB, 98%, Sigma-Aldrich, Burlington, MA, USA), tetraethyl-ammonium bromide (TEAB, 98%, Sigma-Aldrich, Burlington, MA, USA), tetrapropyl ammonium bromide (TPAB, 98%, Sigma-Aldrich, Burlington, MA, USA), benzyl trimethyl ammonium bromide (BTMAB, 97%, Sigma-Aldrich, Burlington, MA, USA), (1-hexadecyl) trimethyl ammonium bromide (HDTMAB, 98%, Alfa Aesar, Heysham, UK), tetramethyl ammonium hydroxide (TMAH, 25 wt.% in H2O, Alfa Aesar, Heysham, UK), tetraethyl ammonium hydroxide (TEAH, 20 wt.% in H2O, Sigma-Aldrich, Burlington, MA, USA), tetrapropyl ammonium hydroxide (TPAH, 1 M in H2O, Alfa Aesar, Heysham, UK), benzyltrimethyl ammonium hydroxide (BTMAH, 40 wt.% in H2O, Alfa Aesar, Heysham, UK), and hexadecyltrimethyl ammonium hydroxide (HDTMAH, 10 wt.% in H2O, Tokyo Chemical Industry, Tokyo, Japan).

2.2. Preparation of Baseline Electrolytes and Working Electrodes

The blank electrolyte was composed of a 16 mL 0.5 M ZnO in a 6 M KOH aqueous solution and was kept stirred at 1500 rpm during the electrochemical measurements using a magnetic stirrer (Camlab MS-H280-Pro, Cambridge, UK) with a PTFE coated stir bar. For comparison, 0.3 M ZnO in 6 M KOH was also prepared to demonstrate the effect of ZnO concentration, and static electrolytes were tested to elucidate the influence of a flowing electrolyte. For the working electrodes, carbon composite plates (6 cm × 1.5 cm, BMA 5, Eisenhuth GmbH & Co., Osterode am Harz, Germany) were covered by polyimide tapes (MJS Technologies, London, UK) with punched holes forming an effective electrode geometrical surface area of 0.159 cm2 (diameter = 0.45 cm).

2.3. Electrochemical Measurement

The performance of the baseline electrolyte with and without 5 mM electrolytic additives was first examined. Two further concentrations, either 1.5 or 15 mM, were evaluated for each additive, depending on the results of the original 5 mM experiment (more detailed explanations are given in Section 3.2). More specifically, cyclic voltammetry (CV) was conducted between −1 V and −1.5 V vs. Hg/HgO with a scan rate of 10 mV s−1 to investigate the influence of additives on deposition–dissolution overpotentials and the effect of hydrogen evolution side reactions on the deposition charge efficiency. Chronopotentiometry at 100 mA cm2 was used for zinc deposition–dissolution cycling with an areal capacity of 20 mAh cm2 (discharge cut-off potential at −0.8 V vs. Hg/HgO). Zinc deposits for further physical characterizations were also prepared by means of chronopotentiometry at 100 mA cm2/20 mAh cm2. Electrochemical impedance spectroscopy (EIS) was conducted before and after the CV and chronopotentiometry, and the uncompensated internal resistance (IR) loss was corrected to 3 Ω for most measurements, except for the fully IR-corrected Tafel plots.

2.4. Physical Characterizations

The crystallinity of zinc deposits was measured by X-ray diffraction (Bruker D8), with 2θ values ranging from 30 to 60°. The morphology of zinc deposits was imaged using a bench scanning electron microscope (Phenom-World ProX, Eindhoven, The Netherlands) with a back scattering detector.

3. Results and Discussion

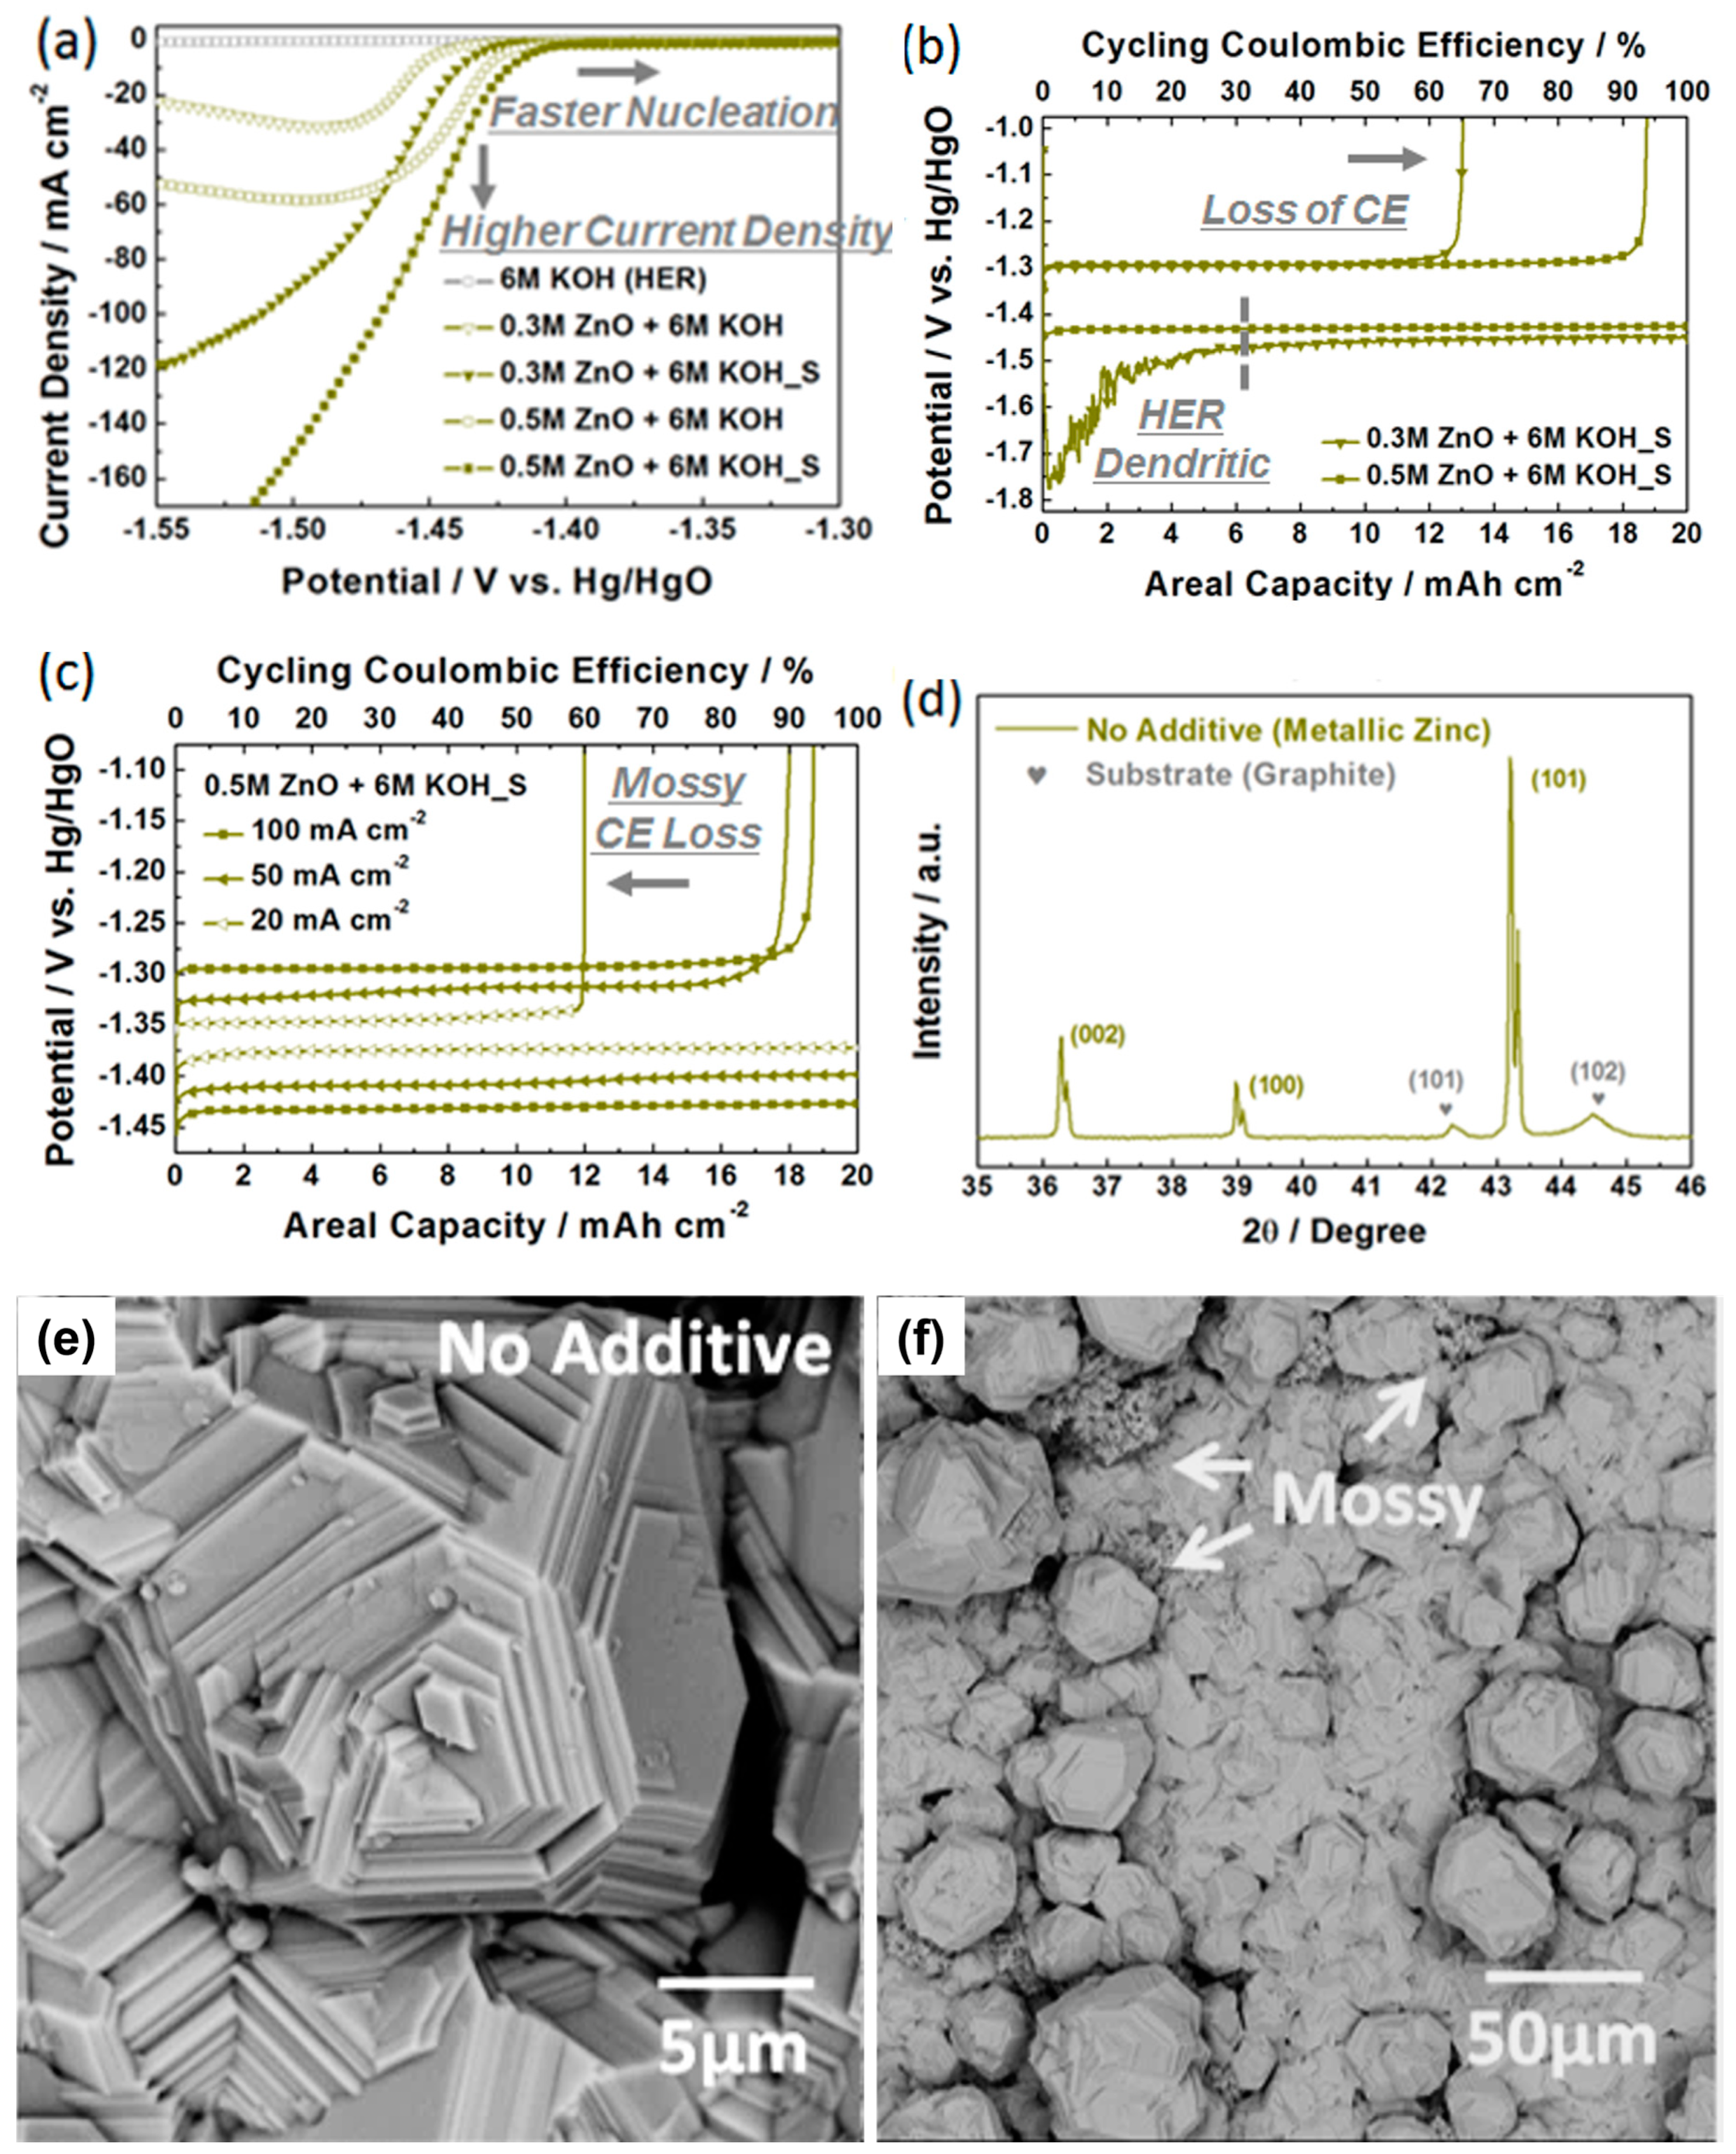
3.1. Determination of Blank Alkaline Electrolytes for Zinc Deposition and Dissolution

Four different blank aqueous alkaline solutions were first compared, including the static and stirred electrolytes of 0.3 or 0.5 M ZnO in 6 M KOH (the stirred electrolytes have a suffix of “_S” in the notation). It is shown in the deposition polarizations (Figure 1a) that zinc deposition overpotentials can be reduced as the concentrations of ZnO increase or as the electrolytes are stirred, suggesting faster zinc nucleation under those circumstances. Furthermore, for the same ZnO concentrations, stirred electrolytes can lead to higher current densities than the static ones under reasonably small overpotentials (ca. <200 mV) since the diffusion-limited current “plateaus” are shifted towards more negative potentials. Note that the targeted deposition current densities of 100 mA cm2 can only be reached by stirred electrolytes, which is indicative of the essential role of forced convection in achieving high charge rates. The deposition columbic efficiency loss due to hydrogen evolution reactions (HER) is significantly lower than 1% for both 0.3 M and 0.5 M ZnO + 6 M KOH_S when the respective deposition current densities reach 100 mA cm2. This supports the proposed advantage of inert carbon electrodes to suppress HER.
The chronopotentiograms of 0.3/0.5 M ZnO + 6 M KOH_S were further examined at a zinc deposition–dissolution rate of 100 mA cm2 and areal capacity of 20 mAh cm2 (Figure 1b). It is noticeable that in the initial deposition stage of 0.3 M ZnO + 6 M KOH_S (before 4 mAh cm2) a very large deposition overpotential is established (i.e., initial deposition potential <−1.75 V vs. Hg/HgO) accompanied by strong oscillations in the current densities until the deposition potential returns to >−1.5 V vs. Hg/HgO. This is likely to be a consequence of a diffusion-limited zinc deposition reaction in the initial stage at a high current density of 100 mA cm2 in the low-concentration of 0.3 M ZnO + 6 M KOH_S solution. A high number of zinc dendrites are formed during this initial deposition stage, alongside a rapid increase in the active electrochemical surface area (i.e., surface roughness) and enhanced HER rate, leading to a very low coulombic efficiency (CE) of only 65% for 0.3 M ZnO + 6 M KOH_S even in the first cycle. In contrast, the deposition chronopotentiogram of 0.5 M ZnO + 6 M KOH_S is relatively smooth, and the CE of the first cycle is 93.75%. Moreover, Figure 1c shows that the first cycle CE at 100 mA cm2/20 mAh cm2 is higher than those at 50 or 20 mA cm2 with the same areal capacity, demonstrating that for inert substrates (zinc nucleation is inhibited) such as carbon [34], a high cycling CE can be achieved when electrodeposition is conducted in combination with charge-transfer and diffusion-controlled potentials. On the other hand, a complete charge-transfer controlled deposition tends to form mossy structures (e.g., the sample deposited at 20 mA cm2 as shown in Figure 1c) [36,37,38], and diffusion-controlled deposition promotes the formation of dendritic structures [31], both of which lead to reduced CE. In this regard, 0.5 M ZnO + 6 M KOH_S has been chosen as the blank electrolyte for the screening of additives and is referred to as “no additive” in the following discussions.
The crystallinity and morphology of the zinc deposits can obviously affect the cycling performance. Hence, the zinc deposits obtained from no additive through chronopotentiometry of 100 mA cm2 and 20 mAh cm2 were further studied by X-ray Diffraction (XRD, Figure 1d) and Scanning Electron Microscopy (SEM, Figure 1e,f). Three doublet peaks at 2θ = 36.3, 39.0, and 43.3° are observed in the XRD pattern, Figure 1d, which correspond to the (002), (100), and (101) planes of hexagonal close-packed (hcp) metallic zinc, respectively [39,40]. The existence of Cu Kα1 and Kα2 doublets indicates that the crystallite size of the zinc deposit for no additive must be relatively large [41]. According to the Scherrer equation, it is ca. 170 nm. Two additional broad peaks centered at 2θ = 42.4 and 44.6° are also observed, which can be assigned to the (101) and (102) planes of graphite in the substrate. The high-magnification SEM image of no additive, Figure 1e, exhibits well-crystallized hexagonal structures, in good agreement with the XRD results; in the low-magnification image, Figure 1f, a few such crystallized boulders of various particle sizes (ca. 20–100 µm) are randomly distributed on “compact” base layers. We also observe mossy structures, particularly at the boundaries between the boulders and base layers, where the local current densities are much smaller due to the increased surface area resulting from charge-transfer controlled zinc deposition. Such mossy structures are expected to contribute to the reduction in CE observed in Figure 1b,c.

3.2. Screening of Quaternary Ammonium Additives towards High-Rate Cycling

To examine the influence of quaternary ammonium additives (QAAs) on high-rate zinc deposition and dissolution cycling, ten different QAAs at three concentrations (1.5, 5, and 15 mM) were added to the blank electrolyte. Five different cations (tetra-methyl-/tetra-ethyl-/tetra-propyl-/benzyl-tri-methyl-/hexa-decyl-tri-methyl-) and two anions (bromide/hydroxide) were assessed, as shown in Table 1. The effect of the QAAs on two main causes of cycling coulombic efficiency (CE) losses, namely incomplete zinc dissolution and the HER, was evaluated through both cyclic voltammetry and chronopotentiometry. Three key performance indicators were proposed to evaluate the cycling performance of zinc deposition–dissolution which are derived from cyclic voltammetry (CV) and galvanostatic during zinc deposition–dissolution, including (i) CV charge capacity loss, (ii) the first zinc deposition–dissolution cycling coulombic efficiency loss, and (iii) the cycling coulombic efficiency decay rate (as shown in Table 2 and Table S1 in the Supplementary Materials). CV charge capacity loss (in %) equals half of the relative residual capacity after CV and is calculated based on the second cycle of measurement. The first zinc deposition–dissolution cycling coulombic efficiency loss (in %) is measured through the first cycle of chronopotentiograms at 100 mA cm2 and 20 mAh cm2 and the zinc dissolution cut-off potential of −1 V vs. Hg/HgO. The cycling coulombic efficiency decay rate (in % per cycle) is estimated from the coulombic efficiency of the 1st–5th cycles of zinc deposition–dissolution.
It can be seen from Figure 2a and Figure S1a that the zinc deposition overpotentials in the 5 mM bromide QAAs are ordered in terms of the alkyl groups of the specific cations as follows: tetra-methyl- < tetra-ethyl- < benzyl-tri-methyl- < hexa-decyl-tri-methyl- < tetra-propyl-. The linear scanning voltammograms (LSVs) of hydroxide and bromide QAAs with different concentrations (Figure S1b–f) further demonstrate that the corresponding zinc deposition overpotentials increase with increasing concentration of the additive in the blank electrolyte and that the bromide and hydroxide anions of the QAAs have an almost identical influence on the zinc deposition overpotentials. Since the loops observed in the CVs (Figure 2a) are caused by the inhibited zinc nucleation on inert carbon substrates, the enlarged zinc deposition overpotentials suggest stronger inhibition of nucleation due to QAA adsorption on the electrode surfaces. It is noted that 5 mM TMAB/TMAH and TEAB/TEAH exhibit an almost negligible effect on the zinc deposition overpotentials; therefore, solutions with 1.5 mM of these four additives are not considered in further cycling tests. A total of 15 mM HDTMAB/HDTMAH is also not included due to the limited solubility of HDTMAB/HDTMAH in concentrated alkaline aqueous solutions.
It is also noted in Figure 2a that QAAs have a significantly weaker effect on the zinc dissolution overpotentials than that on the zinc deposition overpotentials. The peak dissolution current density of 5 mM TMAB is lower than those of no additive and 5 mM TEAB despite their similar deposition overpotentials, while the dissolution capacities (areas between the curves of zero and dissolution currents) of 5 mM BTMAB/HDTMAB/TPAB decrease as the respective deposition overpotentials increase. As a result, the relative residual charge capacities (100% × [deposition capacity − dissolution capacity]/deposition capacity) of most 5 mM bromide QAAs after one CV cycle are lower than that of no additive (ca. 20.08%) (Figure 2b), ranging from ca. 13.96, 7.92, 5.02 to 2.12% for 5 mM TEAB/BTMAB/HDTMAB/TPAB. The exception is for 5 mM TMAB, which yields ca. 32.40%.
As mentioned above, inert carbon substrates can largely inhibit the HER, and thus the CV capacity loss observed (ca. half the value of residual CV relative capacity in Figure 2b and Figure S2a–e, in %) should be mainly indicative of the mass of zinc deposit residuals after dissolution. It is seen in Figure S2f that there are sharp decreases in the CV capacity loss as the zinc deposition overpotentials increase up to 40 mV, beyond which there are only minor changes in the CV capacity loss. The lowest CV capacity loss achieved in this work is below 1% (Table 2), which is less than 10% of the value for no additive (ca. 10.0%).
The zinc corrosion inhibition effect of the QAAs was assessed through Tafel plots derived from the CVs. It is seen in Figure 2c that the corrosion potentials (Ucorrosion) when using 5 mM bromide QAAs are shifted slightly towards more negative values (<10 mV) in the order: (NA =) TM- = TE- < HDTM- < BTM- < TP-. The anodic (βa) and cathodic (βc) Tafel slopes both increased in the order: (NA<) TM- < TE- < BTM- < HDTM- < TP-, although changes in βc are more significant. It is further shown in Table S1 that the QAAs may not necessarily lead to a reduction in corrosion currents (Jcorrosion), but the corresponding polarization resistance (Rp) calculated via the Stern–Geary equation [42] can be enhanced by up to 40%, and surprisingly doubled/tripled in 15 mM TEAB/TEAH and 1.5/5 mM HDTMAB/HDTMAH. The enhanced resistance to corrosion with the 5 mM QAAs is further demonstrated by electric impedance spectroscopy (EIS) Nyquist plots (insert in Figure 2c), which are measured at open-circuit potentials after zinc deposition. The rise of impedance in 5 mM TEAB/BTMAB/HDTMAB and drop in 5 mM TPAB are consistent with the calculated Rp values.
A further selection of suitable QAAs for high-rate zinc deposition and dissolution cycling was based on chronopotentiomograms (CPs) at 100 mA cm2 and 20 mAh cm2. From Figure 3a, it is found that the 5 mM TEAB solution possesses similar initial zinc deposition overpotentials to the no additive and 5 mM TMAB cases, but under prolonged deposition, the former exhibits a better leveling effect (a smaller reduction in zinc deposition overpotential indicates a smaller increase in the electrochemical surface area). An even better leveling performance is achieved by 5 mM BTMAB and HDTMAD as the respective zinc deposition overpotentials further increase. Interestingly, although 5 mM TPAB (yielding the largest deposition overpotential) displays almost zero change in its initial deposition overpotential, it does not demonstrate a better leveling effect than 5 mM HDTMAD over the long run. This phenomenon may partially explain the losses of Coulombic Efficiency (CE) in the first cycle of deposition–dissolution (Figure 3a), which are affected by both the HER and zinc deposition residuals after dissolution. It is seen that a smaller first cycle CE loss compared to no additive (6.3%) can be accomplished by most 5 mM bromide QAAs, ranging from 1.1% for HDTMAB to 3.2–4.0% for BTMAB, TPAB, and TEAB; the exception is 10.8% for TMAB. Moreover, it is shown in Figure S4f that, in contrast to the trend of CV charge capacity losses against the respective deposition overpotentials caused by QAAs, the first cycle CE losses initially decrease as deposition overpotentials increase up to 20 mV, then are relatively constant for deposition overpotentials between 20–60 mV, and finally increase again as deposition overpotentials further go above 60 mV.
The cycling CE decay rates (in % per cycle) for QAAs are further calculated based on the CPs of the first five zinc deposition–dissolution cycles. It is seen in Figure 3b that the corresponding values for most 5 mM bromide QAAs can be smaller than that of no additive (3.8% per cycle), from 0.8 to 1.3–1.5 and to 2.8% per cycle for 5 mM HDTMAB, TEAB, BTMAB, and TPAB. The CE of 5 mM TMAB/TMAH drops below 80% after the second cycle and thus no further cycling is conducted (Figure S5a). Given that cycling CE decay rates are also determined by both the mass of zinc deposit residuals after dissolution and the rate of hydrogen evolution, their patterns against deposition overpotentials are very similar to those of the first cycle CE losses. As seen in Figure S5f, cycling CE decay rates first decrease as the respective deposition overpotentials increase up to 20 mV, are relatively unchanged for deposition overpotentials between 20–60 mV, and further increase when the deposition overpotentials exceed 60 mV. As summarized in Figure 3c, with the exception of TMAB, the 5 mM bromide QAAs enhance cycling performance, and the smallest CV charge capacity loss is achieved with 5 mM TPAB while the smallest first cycle CE loss and cycling CE decay rate is obtained with 5 mM HDTMAB.
Overlaying the patterns of CV charge capacity losses, the first cycle CE losses, and cycling CE decay rates against deposition overpotentials (Figure 4), it is seen that the deposition overpotentials caused by the QAAs (depending on the cations alkyl groups and the QAAs concentrations) are critical to enhanced zinc deposition and dissolution cycling activity. Three targeted values of 6%, 4%, and 2% per cycle, were set for the respective performance indicators of promising QAAs (highlighted as red, green, and blue dashed lines), which correspond to ca. 60% of the values for no additives. It was found that QAAs may only be able to meet all of the above three performance indicators simultaneously when deposition overpotentials are within 20–60 mV. On the other hand, when deposition overpotentials are lower than 20 mV, CV charge capacity losses and/or first cycle CE losses are generally too large, indicating that significant amounts of zinc deposits remain after the dissolution phase for the QAAs TMAB/TMAH. When deposition overpotentials are greater than 60 mV, the cycling CE decay rates are unacceptably high, despite the CV charge capacity losses reaching their minimum values, suggesting that even though QAAs such as TPAB/TPAH may lead to smooth initial deposits, their susceptibility to hydrogen evolution can lower the overall cycling performance.
As a result, five of the ten QAAs measured in this work (or in total eight of the twenty-four samples considering specific concentrations for different additives) can reach the cycling performance objectives: 1.5/5/15 mM BTMAH, 5 mM BTMAB, 1.5 mM HDTMAH, 1.5/5 mM HDTMAB, and 1.5 mM TPAH. It is also worth noting that the optimal cycling activity for bromide additives is achieved at 5 mM for all cation alkyl groups (e.g., 5 mM BTMAB/HDTMAB) while the optimal activity for hydroxides is achieved at 1.5 mM (e.g., 1.5 mM TPAH/BTMAH/HDTMAH). This suggests that different physicochemical properties of the bromide and hydroxide anions (e.g., the ionic radius) play a critical role in zinc deposition and dissolution, which will be investigated in future work.

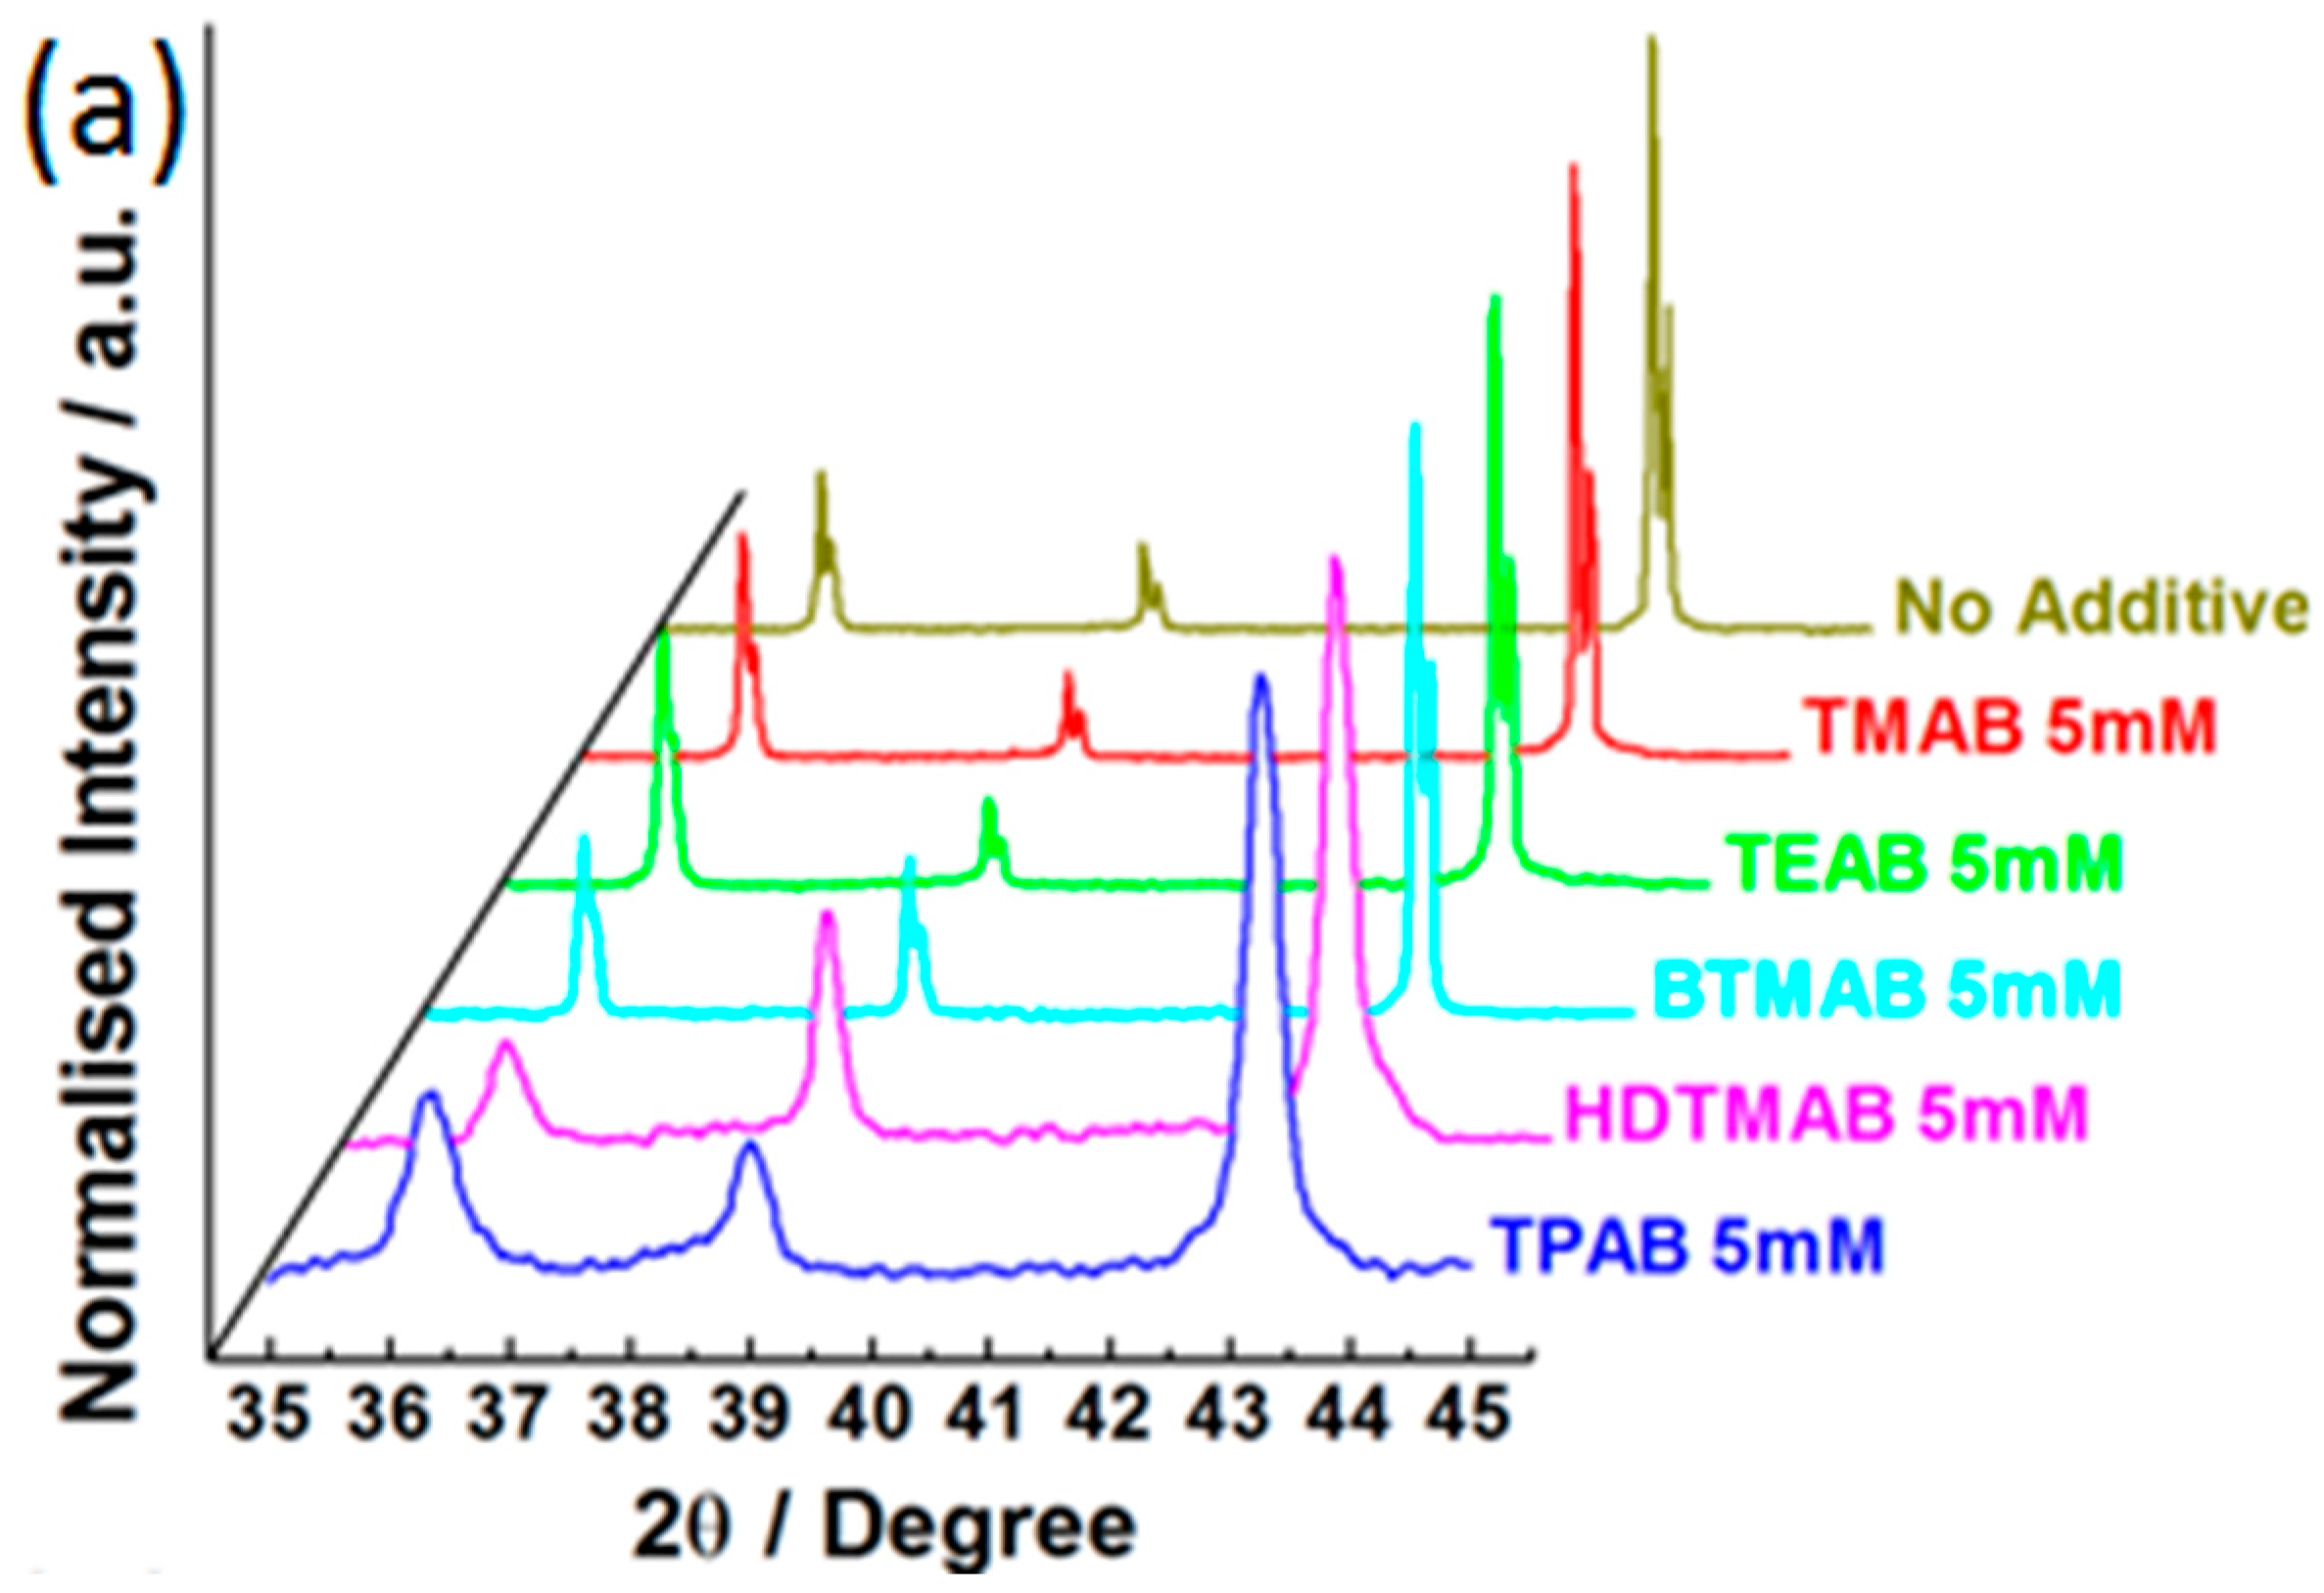
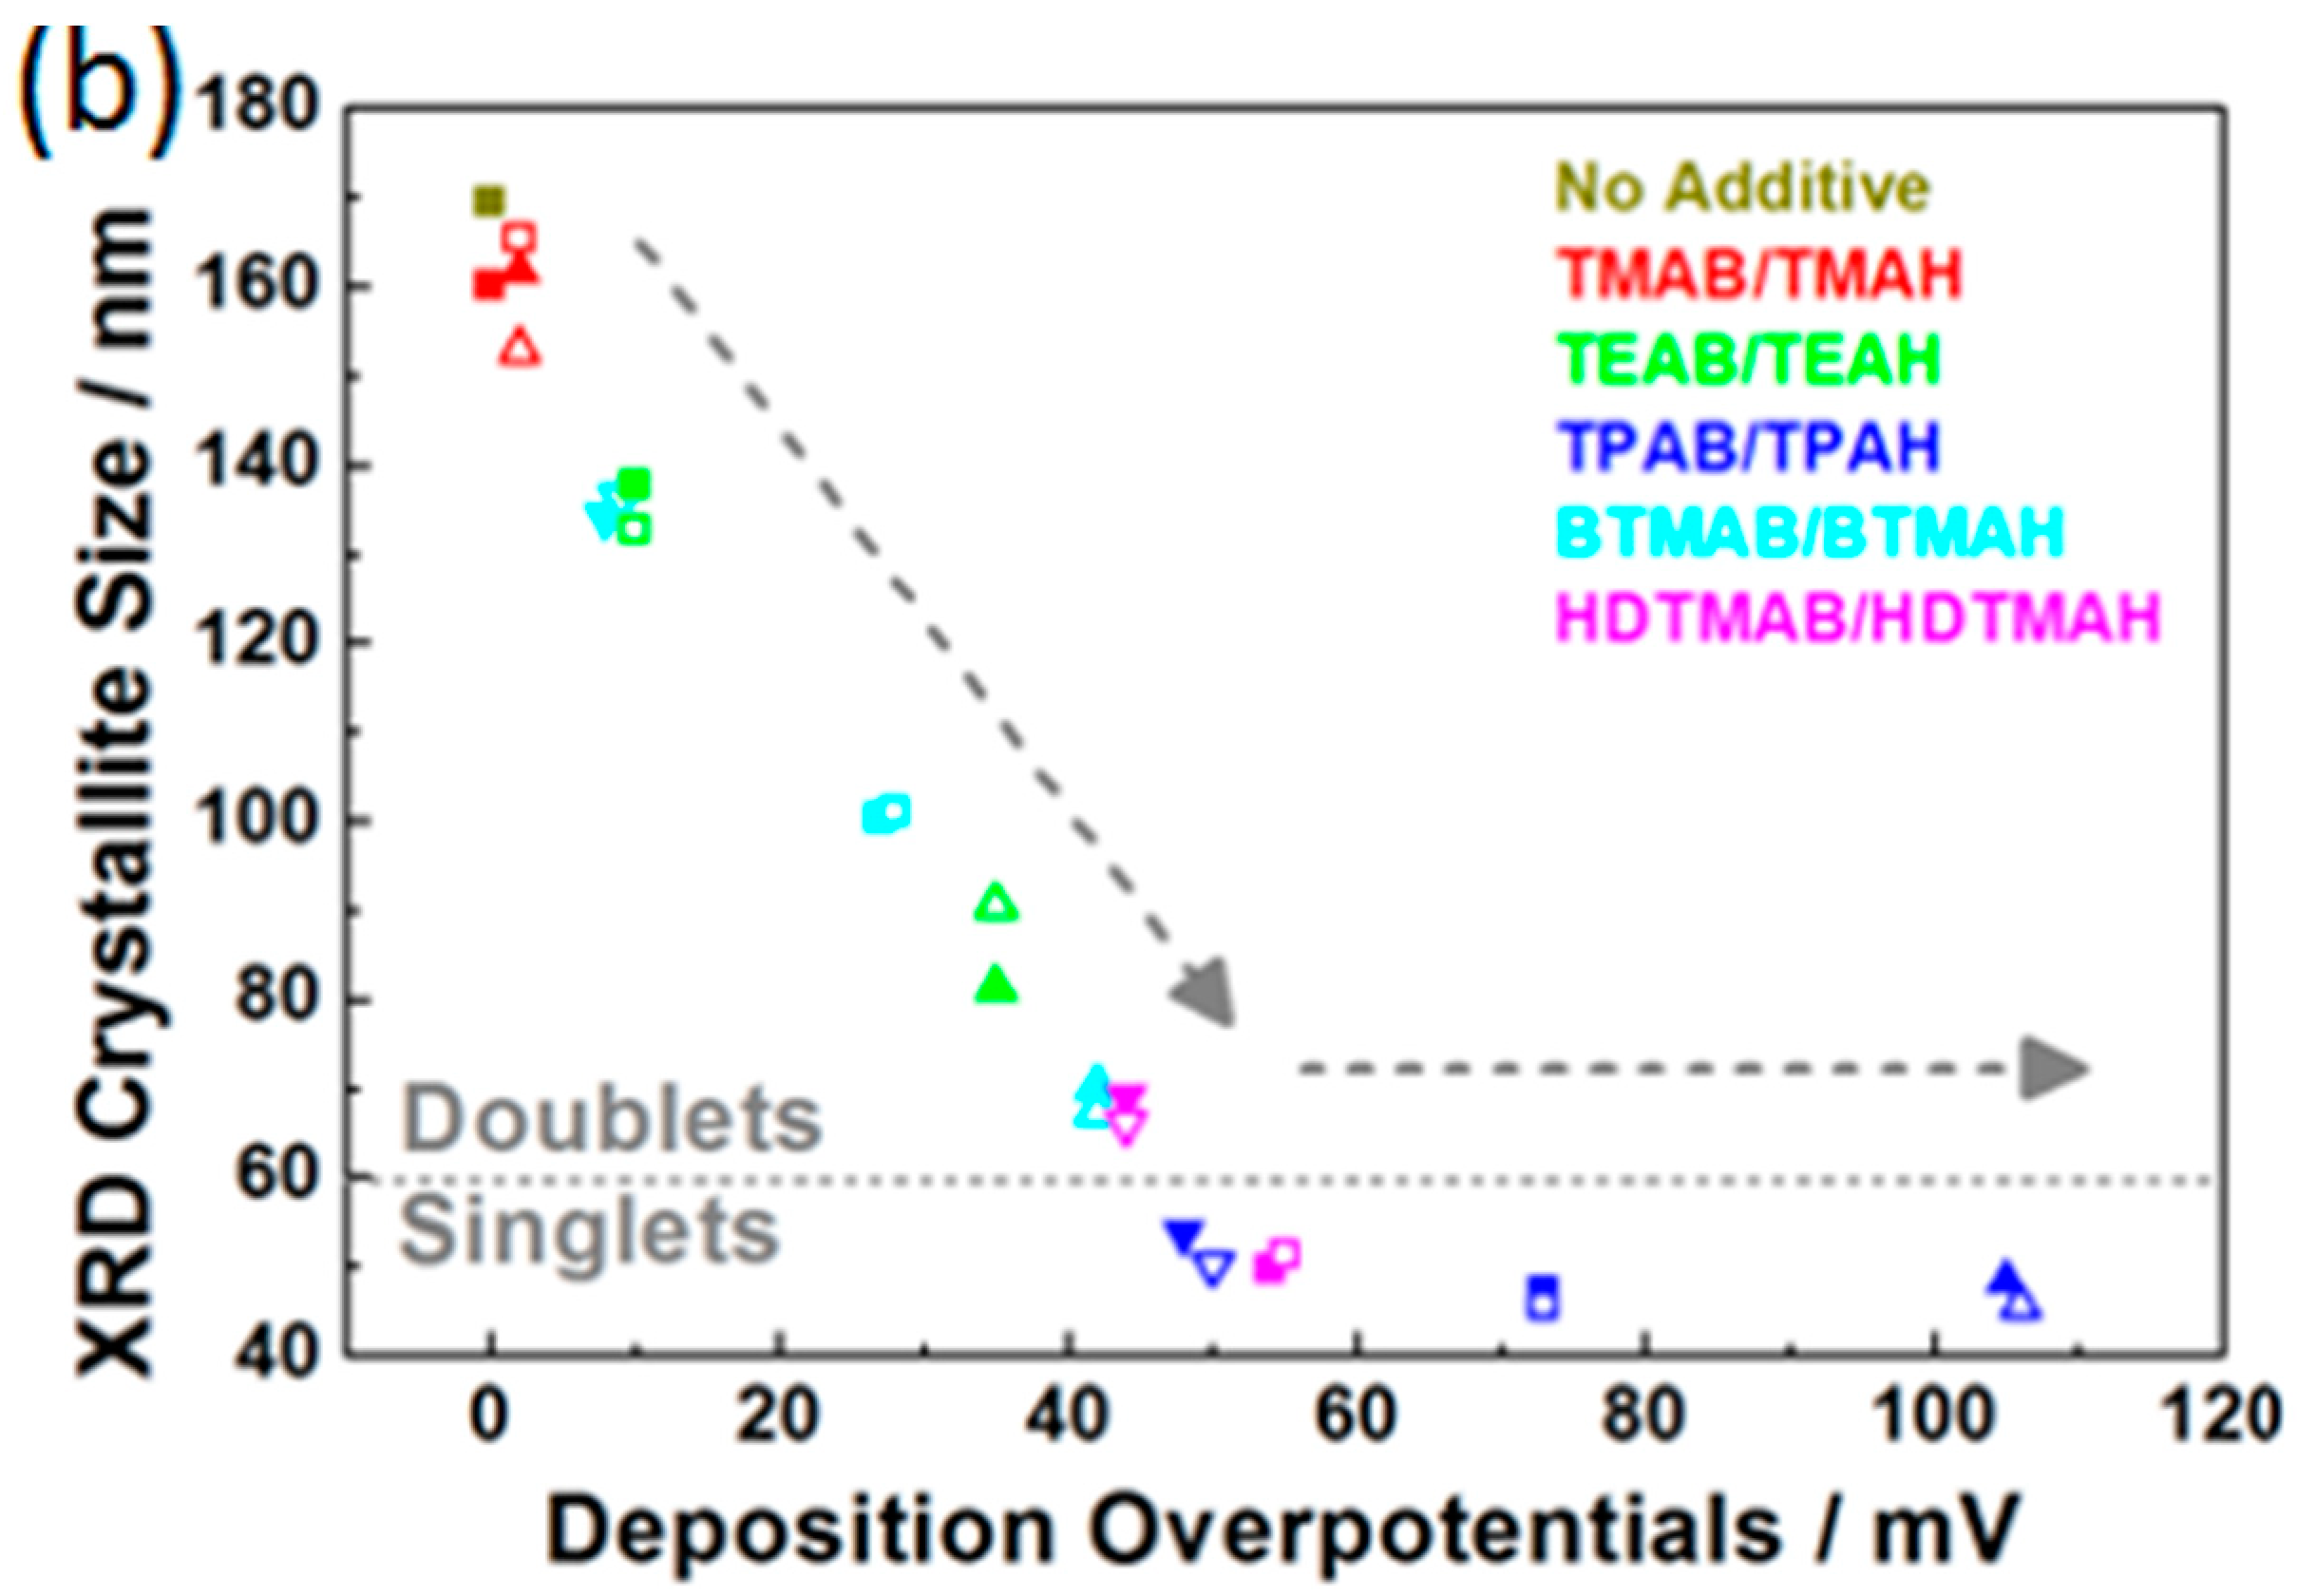
3.3. Influence of QAAs on Crystallinity and Morphology of Zinc Deposits

In order to understand the fundamental reasons behind the proposed correlations between the zinc deposition overpotentials and zinc deposition–dissolution cycling performance, the crystallinity and morphology of the zinc deposits obtained through CPs at 100 mA cm2 and 20 mAh cm2 with the addition of QAAs were examined by X-ray diffraction (XRD) and scanning electron microscopy (SEM). The background subtracted XRD patterns of zinc deposits for 5 mM bromide QAAs are compared with that of no additive so as to understand how the zinc deposition overpotentials affect deposit crystallinity. It is seen in Figure 5a that the (002), (100), and (101) doublet peaks in the respective zinc deposits become broader from 5 mM TMAB, 5 mM TEAB to 5 mM BTMAB, and finally turn into a singlet for 5 mM HDTMAB and 5 mM TPAB, which indicates that the crystallite sizes of the zinc deposits may reduce as the deposition overpotentials increase. In fact, as shown in Figure 5b, the crystallite sizes of the zinc deposits continue to decrease when the deposition overpotentials increase up to 40 mV and then remain in the range of 45–55 nm as the deposition overpotentials increase further. Note that the pattern of XRD crystallite sizes against deposition overpotentials follows the same trend as the CV charge capacity losses, suggesting that zinc deposits with smaller crystallite sizes can be more uniformly removed during dissolution. Moreover, the relative ratios of the (002) and (100) peaks to the (101) peaks are quite different for 1.5/5 mM HDTMAB/HDTMAH, and 15 mM TEAB/TEAH compared with other QAAs (Figure S6), which may explain the excellent anti-corrosion performance of these six additives. Table 3 reports crystallite sizes of the zinc deposits which are estimated by Scherrer equation according to the peaks of the (101) lattice plane at 2θ of 43.3° in the respective X-ray diffraction patterns.
SEM images of eight typical zinc deposits using 5 mM TMAB, 1.5 mM BTMAH, 5 mM BTMAB, 1.5 mM HDTMAH, 1.5 mM TPAB, 5 mM HDTMAB, 5 mM TPAB, and 15 mM TPAH are given in Figure 6 to reveal the trend of zinc deposit morphology with increasing deposition overpotentials. The following points are apparent from the high magnification images (top two rows).
(1)
When zinc deposition overpotentials increase up to 20 mV, e.g., 5 mM TMAB (Figure 6a) and 1.5 mM BTMAH (Figure 6b), the zinc deposits exhibit a crystallized hexagonal structure very similar to the case of no additive (Figure 1e), but of decreasing crystallite sizes.
(2)
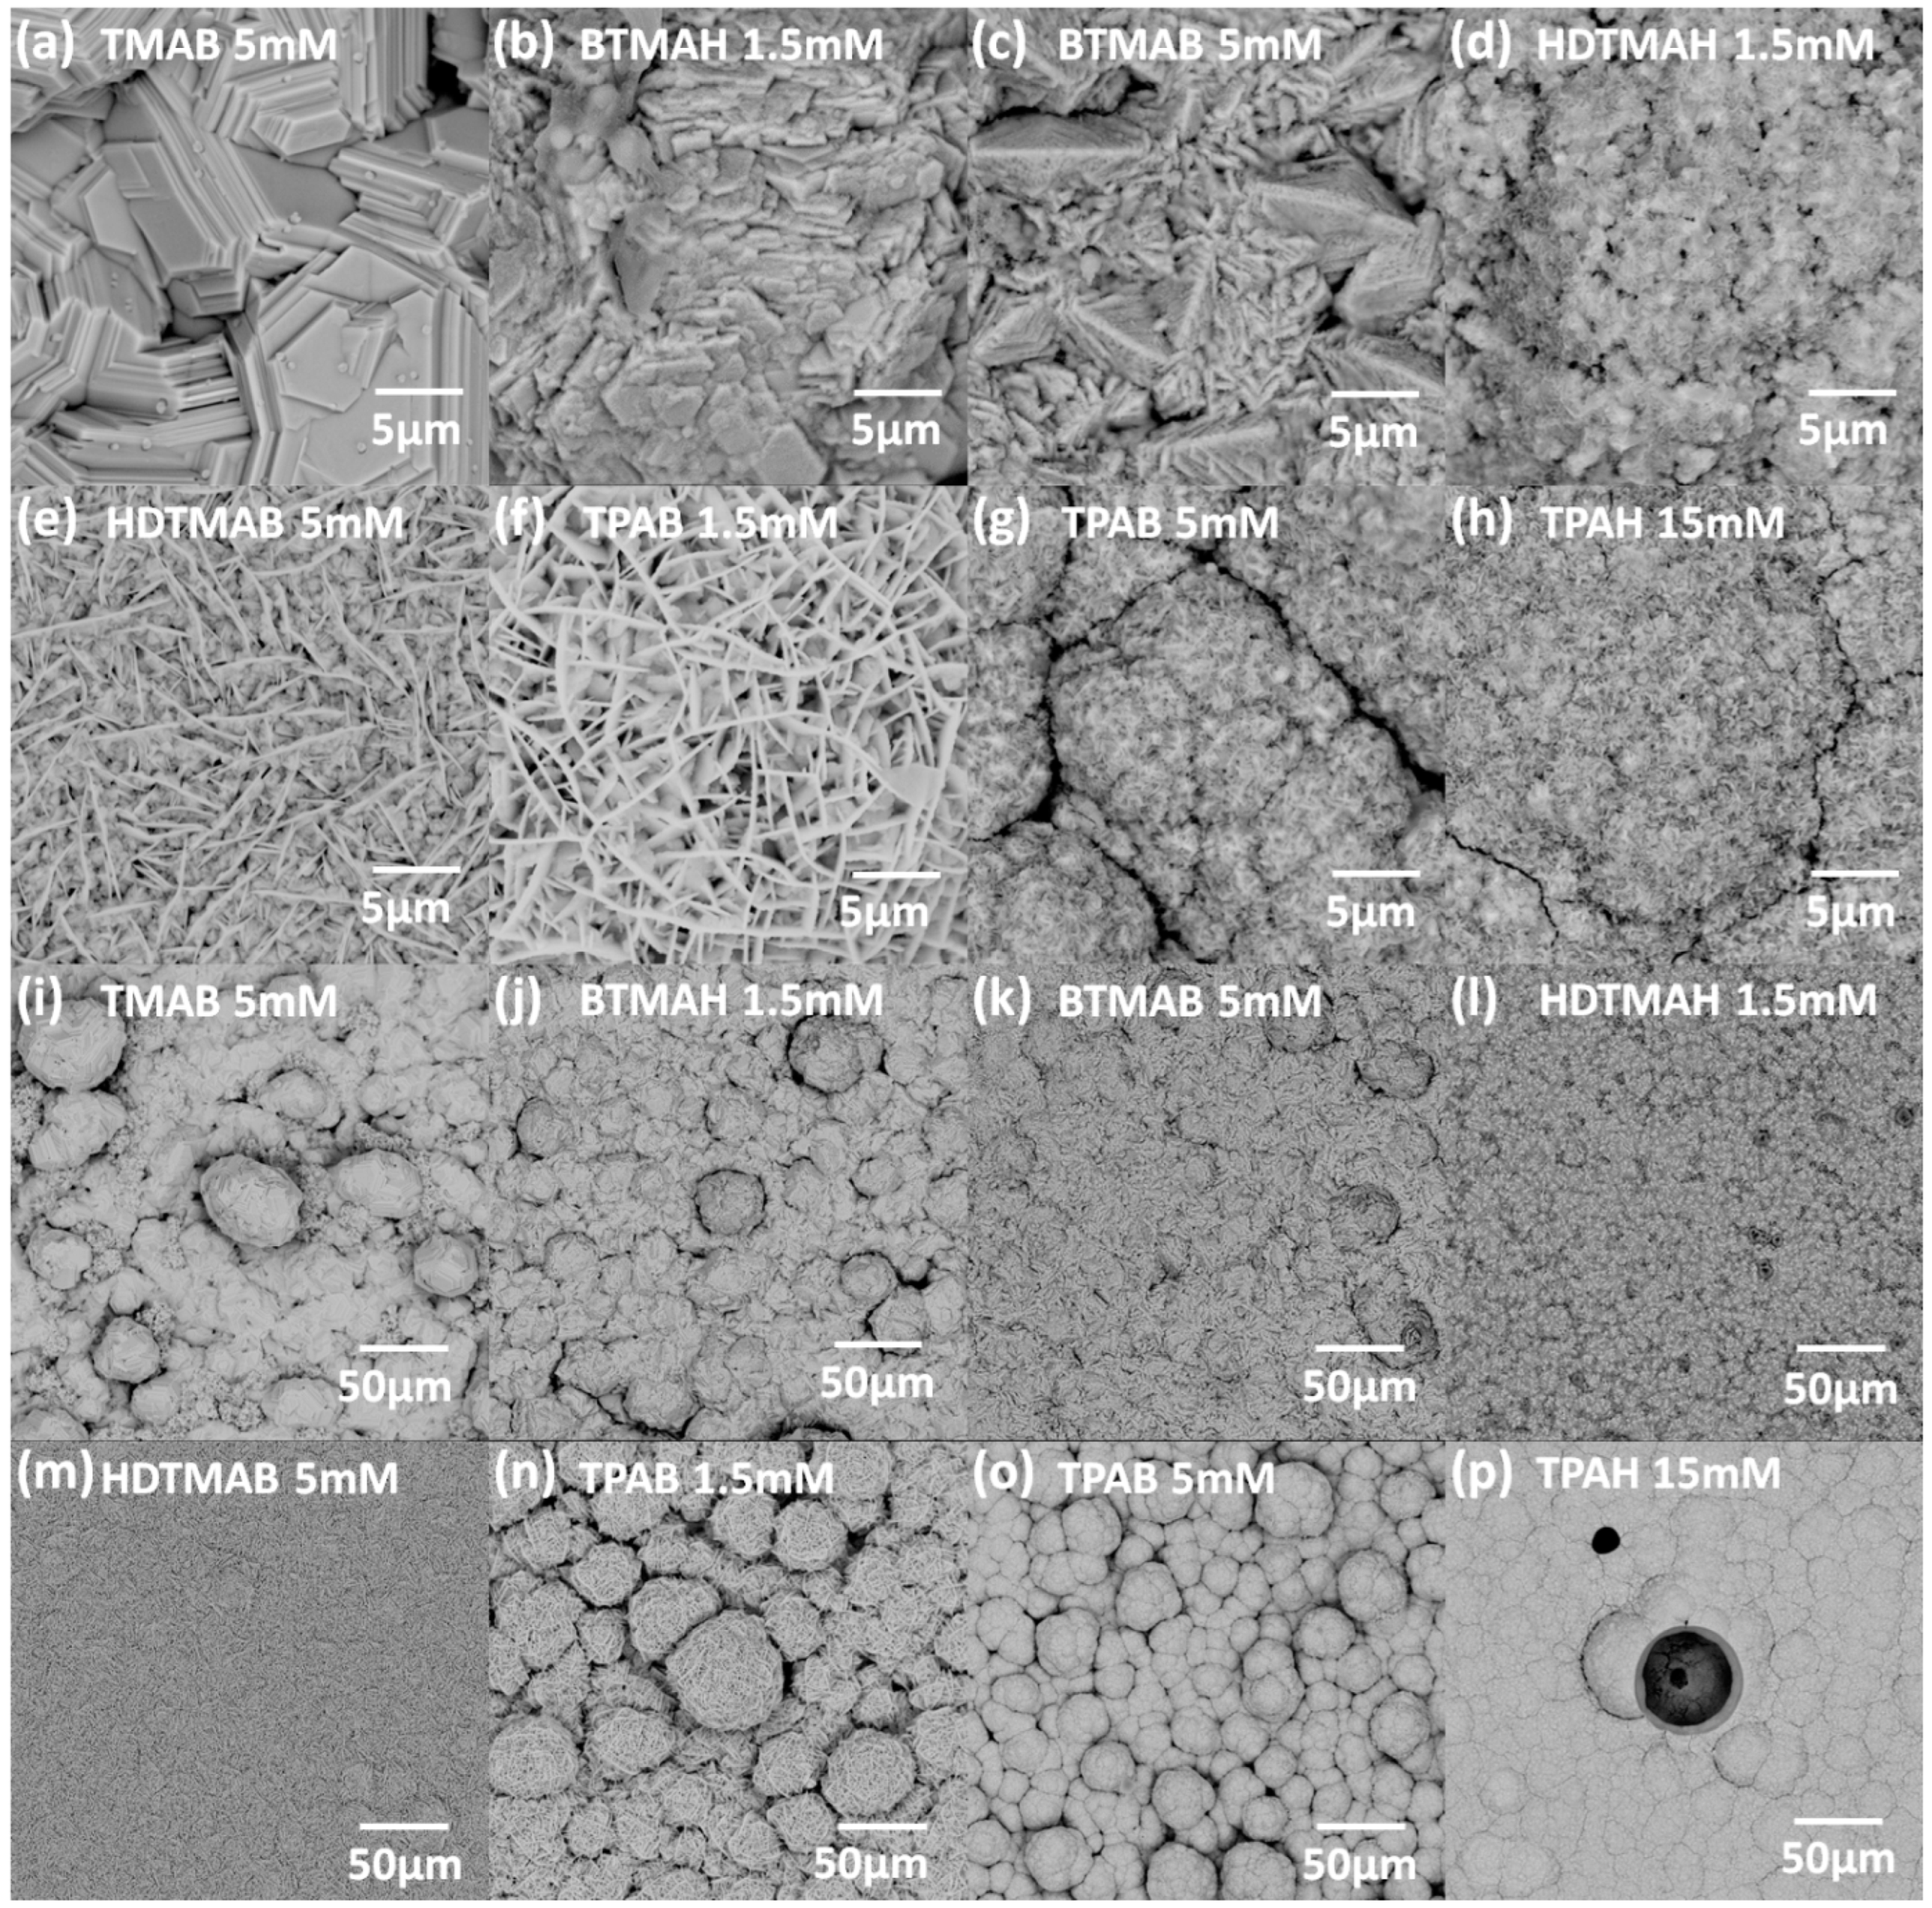
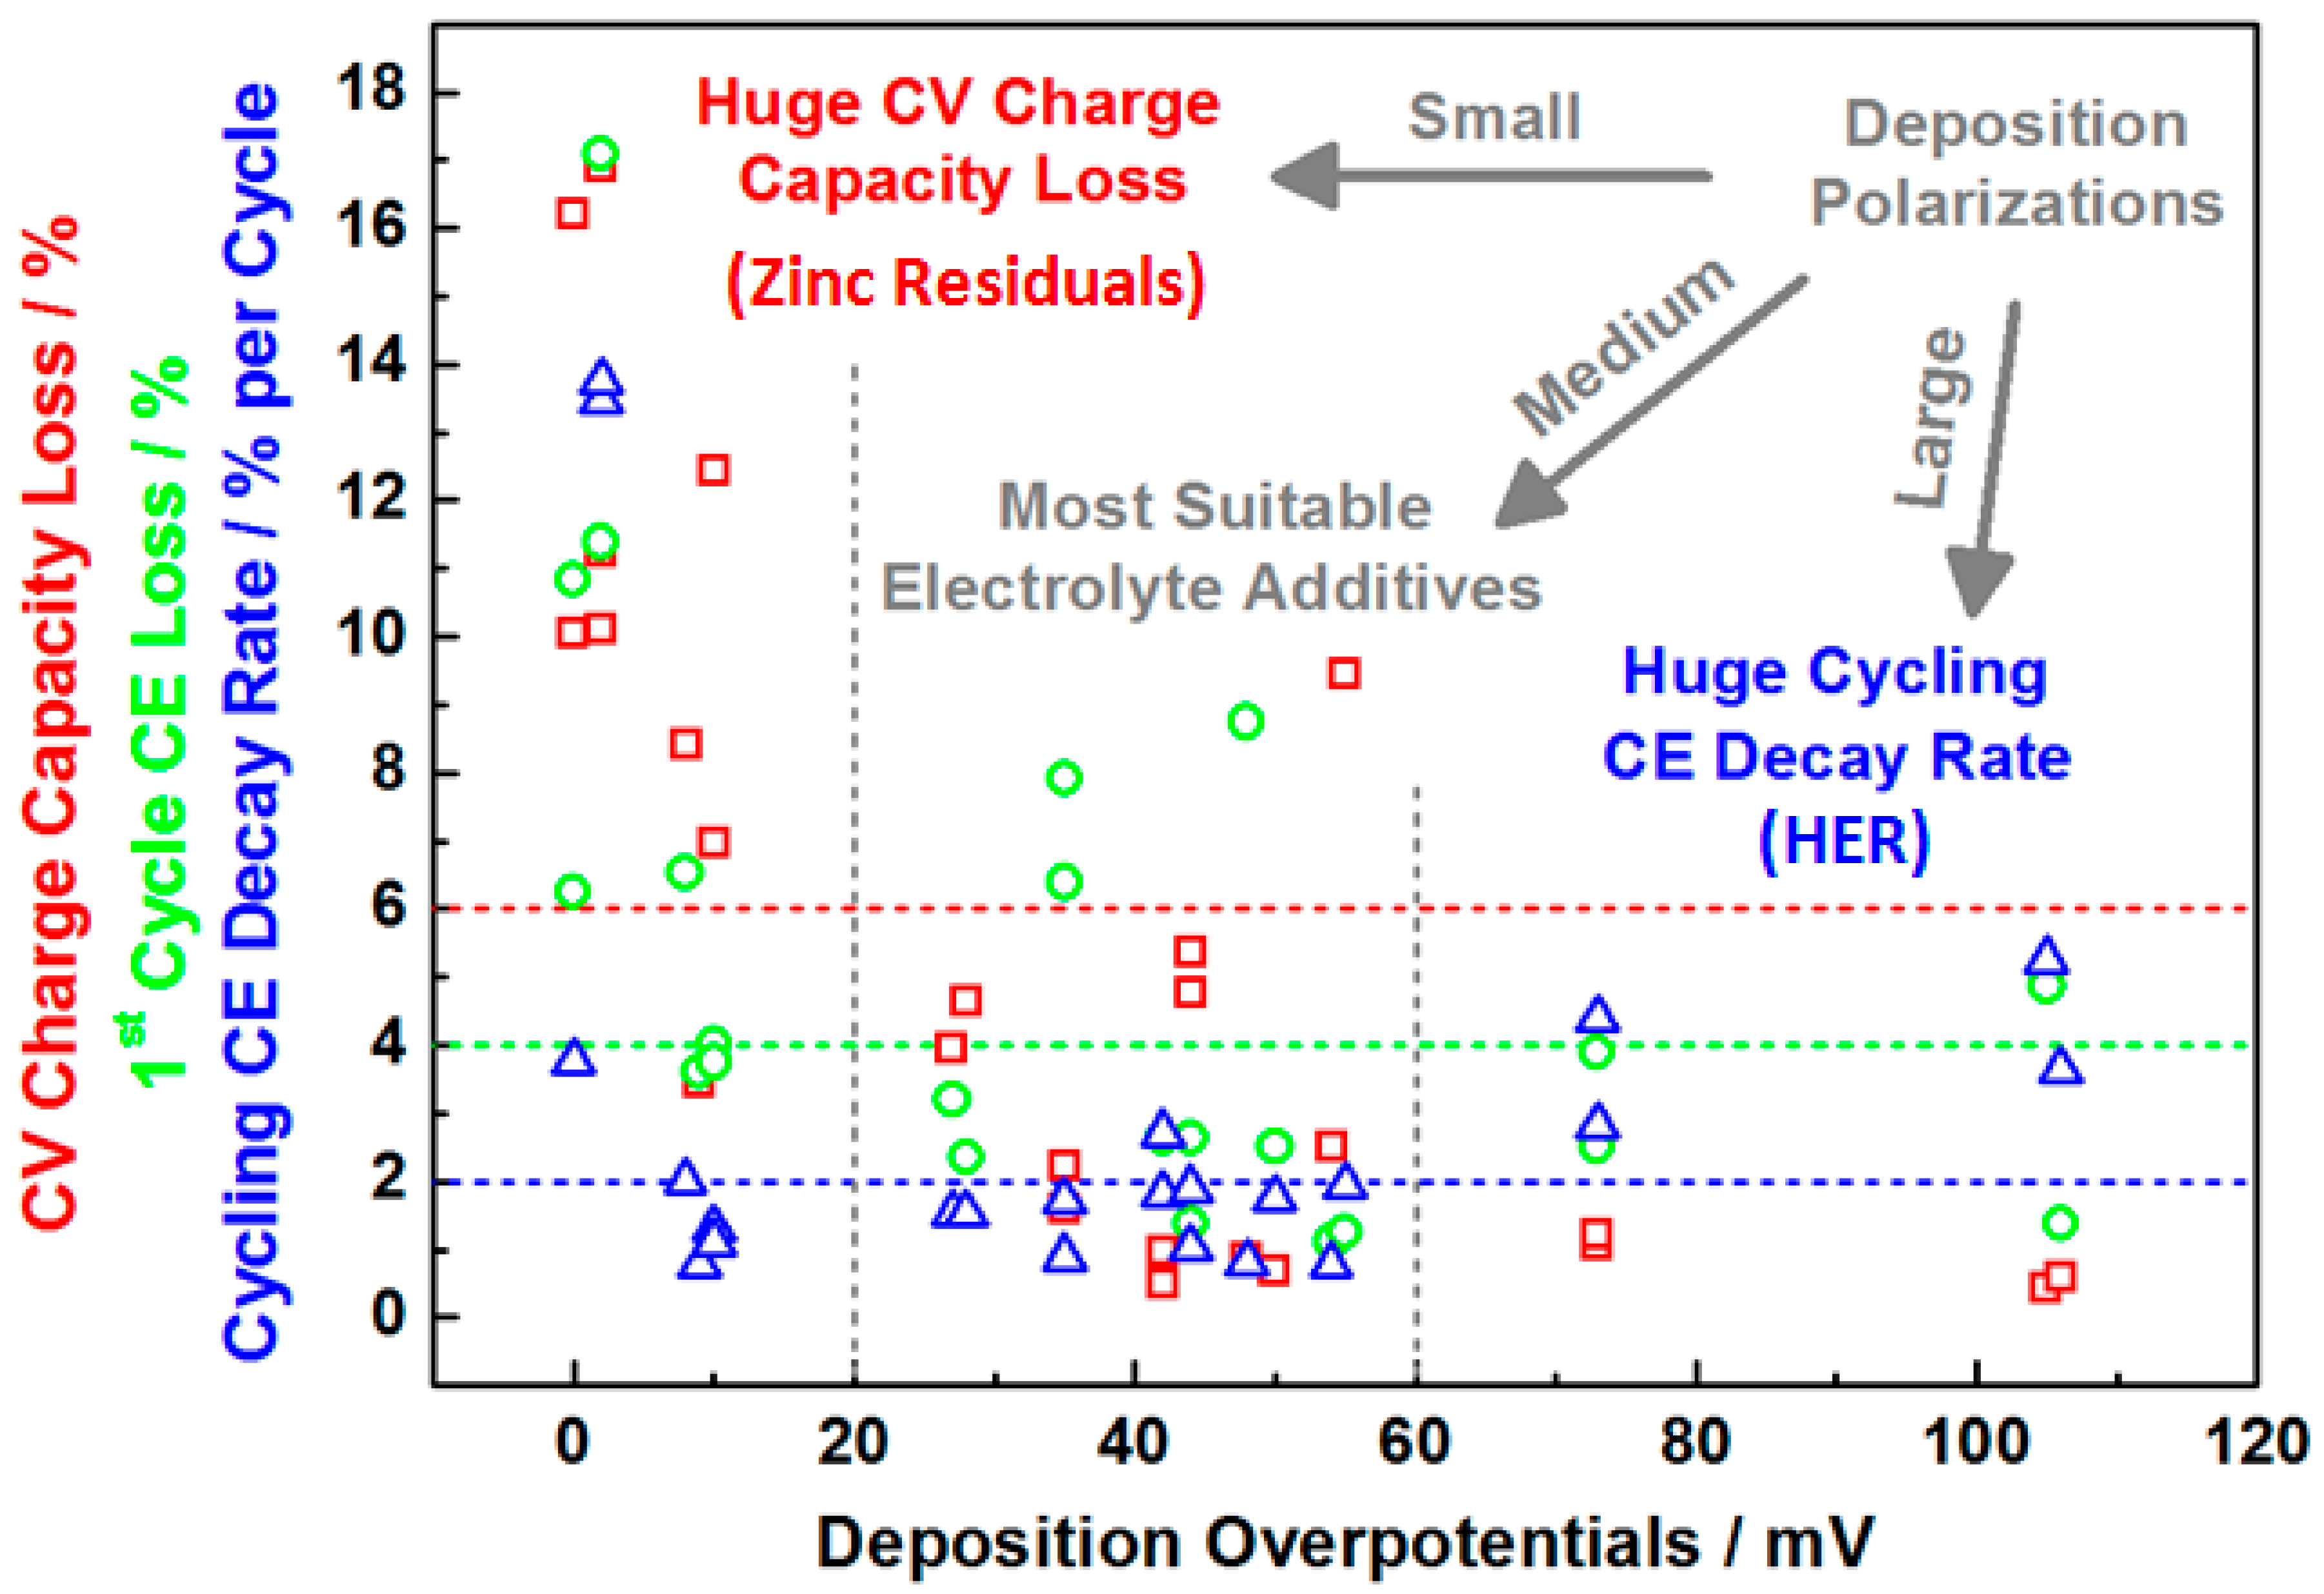
When zinc deposition overpotentials further increase within a range of 20–60 mV, the zinc deposits turn from small crystallized prismatic structures embedded in layered-like agglomerates for 5 mM BTMAB (Figure 6c) to well-distributed agglomerates only for 1.5 mM HDTMAH (Figure 6d), then to long conjunct flakes on top of uniformly distributed small agglomerates for 5 mM HDTMAB (Figure 6e), and eventually to long conjunct flakes only for 1.5 mM TPAB (Figure 6f).
(3)
When zinc deposition overpotentials increase above 60 mV, 5 mM TPAB (Figure 6g), and 15 mM TPAH (Figure 6h), the zinc deposits only consist of flake islands of increasing sizes.
It is noticeable from the low magnification images (bottom two rows) that the 5 mM TMAB case (Figure 6i) possesses an almost identical morphology to that of no additive (Figure 1f). Crystallized boulders are randomly embedded on base layers with mossy structures at the boundaries as the respective deposition overpotentials increase from 1.5 mM BTMAH, 5 mM BTMAB, 1.5 mM HDTMAB, to 5 mM HDTMAB (Figure 6j–m). Such boulder structures start to disappear, and the deposits become more uniform with no mossy structures observed. When the deposition overpotentials further increase to 1.5 mM TPAB and 5 mM TPAB (Figure 6n,o), the zinc deposits tend to consist of boulder-type structures of decreasing sizes from over 50 to less than 20 µm, and eventually form thick and uniform layers but with holes for 15 mM TPAH (Figure 6p). The morphology evolution characteristics of the zinc deposits against deposition overpotentials are consistent with the patterns of the first cycle CE losses and cycling CE decay rates. On one hand, the more uniform deposit morphology is clearly beneficial to enhanced cycling activity, which explains the superior activity of 1.5 mM HDTMAH and 5 mM HDTMAB to 5 mM TMAB as the deposition overpotentials increase up to 60 mV. On the other hand, as the deposition overpotentials further increase to 15 mM TPAH, despite its morphology appearing to be uniform, the giant holes caused by the escape of accumulated hydrogen bubbles [43] contribute to its large cycling CE decay rate.
The above observations demonstrate the dependence of the crystallinity and morphology of the zinc deposits on the deposition overpotentials, as well as the relationships between crystallinity/morphology and zinc deposition and dissolution cycling activities. The result suggests that the deposition overpotentials of suitable QAAs for enhanced cycling of zinc deposition and dissolution need to be within 20–60 mV.

4. Conclusions

To summarize, in total ten quaternary ammonium additives (QAAs) of three different concentrations were for the first time systematically examined in this work to improve the high-rate cycling performance of zinc deposition and dissolution and to elucidate the influence of cations alkyl groups/anions and additives concentrations of QAAs on zinc deposition polarization, deposit crystallinity and morphology, and zinc deposition–dissolution cycling as well. The proposed screening methods in search of suitable electrolyte additives, as detailed below, are critical for the development of high-rate zinc-based rechargeable batteries that enable rapid zinc deposition and dissolution at current densities of or above 100 mA cm2.
The blank electrolyte, a stirred 0.5 M zinc oxide in 6 M potassium hydroxide solution, was first determined for galvanostatic zinc deposition and dissolution cycling at 100 mA cm2 and 20 mAh cm2. The morphology of zinc deposits with no additive consisted of well-crystallized boulders of various particle sizes (ca. 20–100 µm) randomly distributed on “compact” base layers, as well as mossy structures at the boundaries between boulders and base layers. In addition, three performance indicators were defined in this work to evaluate high-rate zinc deposition and dissolution cycling activities, namely CV charge capacity loss, first cycle CE loss, and cycling CE decay rate, and the values for no additive were 10.04%, 6.25% and 3.75% per cycle, respectively.
As for the impact of QAAs on zinc deposition, it was first noted that polarization overpotentials were mostly affected by the alkyl functional groups on quaternary ammonium cations rather than the bromide/hydroxide anions. The influence of specific alkyl groups towards larger overpotentials (i.e., stronger suppression of zinc nucleation) was in the order of TM- < TE- < BTM- < HDTM- < TP-. It was also noticed that if a larger number of additives were used in the baseline electrolytes, the deposition overpotentials would increase as well, but not necessarily in proportion.
Most of the additives tested in this work showed improvement in either one or more of the cycling performance indicators, except TMAB/TMAH. It was found that it was possible for QAAs to realize significantly improved cycling activities compared with no additives only if the respective zinc deposition overpotentials were within 20–60 mV. For example, to achieve CV charge capacity loss of 6%, the first cycle CE loss of 4%, and cycling CE decay rate of 2% per cycle simultaneously. Five out of ten additives (or in total eight out of twenty-four samples) were able to reach the above cycling performance targets, including 1.5/5/15 mM BTMAH, 5 mM BTMAB, 1.5 mM HDTMAH, 1.5/5 mM HDTMAB, and 1.5 mM TPAH. Among them, the most promising one, 5 mM HDTMAB, can even reach as low as 2.51%, 1.11%, and 0.79% per cycle for those three key performance indicators, less than a quarter of the values for the no additive benchmark.
It was found that the XRD crystallite sizes of zinc deposits decreased as their deposition overpotentials increased up to 60 mV and were kept within 45–55 nm when deposition overpotentials further increased, in accordance with the pattern of CV charge capacity losses against deposition overpotentials. A clear trend of zinc deposit morphology evolution (i.e., from non-uniform, to uniform, and finally to holey, under low-magnification SEM images) with respect to increasing deposition overpotentials was observed and the most uniform zinc deposits were achieved by 5 mM HDTMAB, which was consistent with the patterns of first cycle CE losses and cycling CE decay rates. Last but not least, it was noted that the optimal performance for each bromide additive was achieved at the concentration of 5 mM while the optimal result for hydroxide additives was achieved at 1.5 mM. Such a phenomenon suggests that although bromide and hydroxide anions may exhibit non-distinguishable influence on deposition overpotentials, variations in other physicochemical properties (e.g., ionic radius) could still affect zinc deposition and dissolution cycling, which will be further studied in our next work.

Supplementary Materials

The following supporting information can be downloaded at: https://www.mdpi.com/article/10.3390/batteries8090106/s1, Figure S1: Linear sweep voltammograms of zinc deposition in (a) 5 mM QAAs, (b) TMAB/TMAH, (c) TEAB/TEAH, (d) TPAB/TPAH, (e) BTMAB/BTMAH and (f) HDTMAB/HDTMAH, compared with no additive; Figure S2: Plots of relative CV charge capacity against time for (a) TMAB/TMAH, (b) TEAB/TEAH, (c) TPAB/TPAH, (d) BTMAB/BTMAH, (e) HDTMAB/HDTMAH, compared with no additive, and (f) plot of CV charge capacity loss against zinc deposition overpotentials. The solid or hollow symbols in Figure S2f indicate bromides or hydroxides, and the inverted triangles, squares or triangles mean 1.5, 5 or 15 mM of QAAs, respectively; Figure S3: Tafel plots for (a) TMAB/TMAH, (b) TEAB/TEAH, (c) BTMAB/BTMAH, (d) HDTMAB/HDTMAH, (e) TPAB/TPAH, compared with no additive, and (f) plot of Polarization Resistance against deposition overpotentials. The solid or hollow symbols in Figure S3f indicate bromides or hydroxides, and the inverted triangles, squares or triangles mean 1.5, 5 or 15 mM of QAAs, respectively; Figure S4: Chronopotentiograms at 100 mA cm-2 and 20 mAh cm-2 of the first cycle for zinc deposition and dissolution in (a) TMAB/TMAH, (b) TEAB/TEAH, (c) TPAB/TPAH, (d) BTMAB/BTMAH, (e) HDTMAB/ HDTMAH, compared with no additive, and (f) plot of 1st Cycle CE Loss against deposition overpotentials. The solid or hollow symbols in Figure S4f indicate bromides or hydroxides, and the inverted triangles, squares or triangles mean 1.5, 5 or 15 mM of QAAs, respectively; Figure S5: Cycling coulombic efficiency in the first five cycles of zinc deposition and dissolution in (a) TMAB/TMAH, (b) TEAB/TEAH, (c) TPAB/TPAH, (d) BTMAB/BTMAH, (e) HDTMAB/HDTMAH, compared with no additive, and (f) plot of cycling CE decay rate against deposition overpotentials. The solid or hollow symbols in Figure S5f indicate bromides or hydroxides, and the inverted triangles, squares or triangles mean 1.5, 5 or 15 mM of QAAs, respectively; Figure S6: XRD patterns of zinc deposits in (a) TMAB/TMAH, (b) TEAB/TEAH, (c) BTMAB/BTMAH, (d) HDTMAB/HDTMAH, and (e) TPAB/TPAH, compared with no additive; Figure S7: SEM images of zinc deposits in various QAAs with zinc deposition overpotentials smaller than 20 mV; Figure S8: SEM images of zinc deposits in various QAAs with zinc deposition overpotentials between 20 and 60 mV; Figure S9: SEM images of zinc deposits in various QAAs with zinc deposition overpotentials greater than 60 mV; Table S1: Summary of open circuit potentials (Ucorrosion), corrosion current densities (Jcorrosion), cathodic (βc) and anodic (βa) Tafel slopes and polarization resistance (Rp) for zinc deposition and dissolution in various QAAs and no additive.

Author Contributions

Conceptualization, K.Q. and X.L.; methodology, K.Q., X.L., V.Y. and N.B.; formal analysis, K.Q.; data curation, K.Q. and D.T.; writing—original draft preparation, K.Q.; writing—review and editing, B.C., A.S., D.T. and X.L.; supervision, X.L. and N.B.; project administration, X.L. and N.B.; funding acquisition, X.L., N.B., V.Y. and A.S. All authors have read and agreed to the published version of the manuscript.

Funding

This work is financially supported by the Engineering and Physical Sciences Research Council (EPSRC) project ‘Zinc-Nickel Redox Flow Battery for Energy Storage’ (Ref: EP/P003494/1). The authors would also like to thank Science and Technology Facilities Council (STFC) Futures Early Career Awards for the travel bursaries; the Royal Academy of Engineering UK-Germany Energy Systems Symposium Award (UKDE100005); and Camborne School of Mines (CSM) and Environment and Sustainability Institute (ESI) at University of Exeter (Penryn campus) for the technical support on physical characterizations. For the purpose of open access, the author has applied a ‘Creative Commons Attribution (CC BY) licence to any Author Accepted Manuscript version arising’.

Institutional Review Board Statement

Not applicable.

Informed Consent Statement

Not applicable.

Data Availability Statement

Not applicable.

Conflicts of Interest

The authors declare no conflict of interest.

References

  1. Li, Y.; Dai, H. Recent advances in zinc–air batteries. Chem. Soc. Rev. 2014, 43, 5257–5275. [Google Scholar] [CrossRef] [PubMed]
  2. Parker, J.F.; Chervin, C.N.; Pala, I.R.; Machler, M.; Burz, M.F.; Long, J.W.; Rolison, D.R. Rechargeable nickel-3D zinc batteries: An energy-dense, safer alternative to lithium-ion. Science 2017, 356, 415. [Google Scholar] [CrossRef] [PubMed]
  3. Parker, J.F.; Chervin, C.N.; Nelson, E.S.; Rolison, D.R.; Long, J.W. Wiring zinc in three dimensions re-writes battery perfor-mance-dendrite-free cycling. Energy Environ. Sci. 2014, 7, 1117. [Google Scholar] [CrossRef]
  4. Zhang, J.; Zhao, Z.; Xia, Z.; Dai, L. A metal-free bifunctional electrocatalyst for oxygen reduction and oxygen evolution reactions. Nat. Nanotechnol. 2015, 10, 444–452. [Google Scholar] [CrossRef] [PubMed]
  5. Li, G.; Wang, X.; Fu, J.; Li, J.; Park, M.G.; Zhang, Y.; Lui, G.; Chen, Z. Pomegranate-Inspired Design of Highly Active and Durable Bifunctional Electrocatalysts for Rechargeable Metal-Air Batteries. Angew. Chem. Int. Ed. 2016, 55, 4977–4982. [Google Scholar] [CrossRef] [PubMed]
  6. Li, B.; Quan, J.; Loh, A.; Chai, J.; Chen, Y.; Tan, C.; Ge, X.; Hor, T.S.A.; Liu, Z.; Zhang, H.; et al. A Robust Hybrid Zn-Battery with Ultralong Cycle Life. Nano Lett. 2017, 17, 156–163. [Google Scholar] [CrossRef]
  7. Lee, D.U.; Fu, J.; Park, M.G.; Liu, H.; Kashkooli, A.G.; Chen, Z. Self-assembled NiO/Ni(OH)2 nanoflakes as active material for high-power and high-energy hybrid rechargeable battery. Nano Lett. 2016, 16, 1794. [Google Scholar] [CrossRef]
  8. Li, B.; Liu, J.; Nie, Z.; Wang, W.; Reed, D.; Liu, J.; McGrail, P.; Sprenkle, V. Metal–organic frameworks as highly active electrocat-alysts for high-energy density, aqueous zinc-polyiodide redox flow batteries. Nano Lett. 2016, 16, 4335. [Google Scholar] [CrossRef]
  9. Li, B.; Nie, Z.; Vijayakumar, M.; Li, G.; Liu, J.; Sprenkle, V.; Wang, W. Ambipolar zinc-polyiodide electrolyte for a high-energy density aqueous redox flow battery. Nat. Commun. 2015, 6, 6303. [Google Scholar] [CrossRef] [PubMed]
  10. Gong, K.; Ma, X.; Conforti, K.M.; Kuttler, K.J.; Grunewald, J.B.; Yeager, K.L.; Bazant, M.Z.; Gu, S.; Yan, Y. A zinc–iron redox-flow battery under $100 per kW h of system capital cost. Energy Environ. Sci. 2015, 8, 2941–2945. [Google Scholar] [CrossRef] [Green Version]
  11. Wang, X.; Wang, F.; Wang, L.; Li, M.; Wang, Y.; Chen, B.; Zhu, Y.; Fu, L.; Zha, L.; Zhang, L.; et al. An aqueous re-chargeable Zn//Co3O4 battery with high energy density and good cycling behavior. Adv. Mater. 2016, 28, 4904. [Google Scholar] [CrossRef] [PubMed]
  12. Winsberg, J.; Janoschka, T.; Morgenstern, S.; Hagemann, T.; Muench, S.; Hauffman, G.; Gohy, J.-F.; Hager, M.D.; Schubert, U.S. Poly(TEMPO)/zinc hybrid-flow battery: A novel, “green,” high voltage, and safe energy storage system. Adv. Mater. 2016, 28, 2238. [Google Scholar] [CrossRef] [PubMed]
  13. Zhang, N.; Cheng, F.; Liu, Y.; Zhao, Q.; Lei, K.; Chen, C.; Liu, X.; Chen, J. Cation-deficient spinel ZnMn2O4 cathode in Zn(CF3SO3)2 electrolyte for rechargeable aqueous Zn-ion battery. J. Am. Chem. Soc. 2016, 138, 12894. [Google Scholar] [CrossRef] [PubMed]
  14. Kundu, D.; Adams, B.D.; Duffort, V.; Vajargah, S.H.; Nazar, L.F. A high-capacity and long-life aqueous rechargeable zinc battery using a metal oxide intercalation cathode. Nat. Energy 2016, 1, 16119. [Google Scholar] [CrossRef]
  15. Pan, H.; Shao, Y.; Yan, P.; Cheng, Y.; Han, K.S.; Nie, Z.; Wang, C.; Yang, J.; Li, X.; Bhattacharya, P.; et al. Reversible aqueous zinc/manganese oxide energy storage from conversion reactions. Nat. Energy 2016, 1, 16039. [Google Scholar] [CrossRef]
  16. He, W.; Zuo, S.; Xu, X.; Zeng, L.; Liu, L.; Zhao, W.; Liu, J. Challenges and strategies of zinc anode for aqueous zinc-ion batteries. Mater. Chem. Front. 2021, 5, 2201–2217. [Google Scholar] [CrossRef]
  17. Zuo, S.; Liu, J.; He, W.; Osman, S.; Liu, Z.; Xu, X.; Shen, J.; Jiang, W.; Liu, J.; Zeng, Z.; et al. Direct Detection and Visualization of the H+ Reaction Process in a VO2 Cathode for Aqueous Zinc-Ion Batteries. J. Phys. Chem. Lett. 2021, 12, 7076–7084. [Google Scholar] [CrossRef]
  18. Zuo, S.; Xu, X.; Ji, S.; Wang, Z.; Liu, Z.; Liu, J. Cathodes for aqueous Zn-ion batteries: Materials, mechanisms, and kinetics. Chem. Eur. J. 2021, 27, 830. [Google Scholar] [CrossRef]
  19. Higashi, S.; Lee, S.W.; Lee, J.; Takechi, K.; Cui, Y. Avoiding short circuits from zinc metal dendrites in anode by backside-plating configuration. Nat. Commun. 2016, 7, 11801. [Google Scholar] [CrossRef]
  20. Cheng, J.; Zhang, L.; Yang, Y.-S.; Wen, Y.-H.; Cao, G.-P.; Wang, X.-D. Preliminary study of single flow zinc–nickel battery. Electrochem. Commun. 2007, 9, 2639–2642. [Google Scholar] [CrossRef]
  21. Mainar, A.R.; Leonet, O.; Bengoechea, M.; Boyano, I.; de Meatza, I.; Kvasha, A.; Guerfi, A.; Blázquez, J.A. Alkaline aqueous electrolytes for secondary zinc-air batteries: An overview. Int. J. Energy Res. 2016, 40, 1032–1049. [Google Scholar] [CrossRef]
  22. Bass, K.; Mitchell, P.; Wilcox, G.; Smith, J. Methods for the reduction of shape change and dendritic growth in zinc-based secondary cells. J. Power Sources 1991, 35, 333–351. [Google Scholar] [CrossRef]
  23. Turney, D.E.; Gallaway, J.W.; Yadav, G.G.; Ramirez, R.; Nyce, M.; Banerjee, S.; Chen-Wiegart, Y.-C.K.; Wang, J.; D’Ambrose, M.J.; Kolhekar, S.; et al. Rechargeable Zinc Alkaline Anodes for Long-Cycle Energy Storage. Chem. Mater. 2017, 29, 4819–4832. [Google Scholar] [CrossRef]
  24. Sun, K.E.K.; Hoang, T.K.A.; Doan, T.N.L.; Yu, Y.; Zhu, X.; Tian, Y.; Chen, P. Suppression of Dendrite Formation and Corrosion on Zinc Anode of Secondary Aqueous Batteries. ACS Appl. Mater. Interfaces 2017, 9, 9681–9687. [Google Scholar] [CrossRef] [PubMed]
  25. Yang, C.; Zhang, Z.; Tian, Z.; Zhang, K.; Li, J.; Lai, Y. Effects of Carboxymethyl Cellulose on the Electrochemical Characteristics and Dendrite Growth of Zinc in Alkaline Solution. J. Electrochem. Soc. 2016, 163, A1836–A1840. [Google Scholar] [CrossRef]
  26. Song, Y.; Hu, J.; Tang, J.; Gu, W.; He, L.; Ji, X. Real-Time X-ray Imaging Reveals Interfacial Growth, Suppression, and Dissolution of Zinc Dendrites Dependent on Anions of Ionic Liquid Additives for Rechargeable Battery Applications. ACS Appl. Mater. Interfaces 2016, 8, 32031–32040. [Google Scholar] [CrossRef]
  27. Trudgeon, D.P.; Qiu, K.; Li, X.; Mallick, T.; Taiwo, O.O.; Chakrabarti, B.; Yufit, V.; Brandon, N.P.; Crevillen-Garcia, D.; Shah, A. Screening of effective electrolyte additives for zinc-based redox flow battery systems. J. Power Sources 2019, 412, 44–54. [Google Scholar] [CrossRef]
  28. Trudgeon, D.P.; Li, X. The effect of electrolyte and additive concentration on zinc–nickel flow cell performance. Electrochim. Acta 2021, 367, 137479. [Google Scholar] [CrossRef]
  29. Trudgeon, D.P.; Loh, A.; Ullah, H.; Li, X.; Yufit, V.; Brandon, N.; Liu, M.; Kong, L. The influence of zinc electrode substrate, electrolyte flow rate and current density on zinc-nickel flow cell performance. Electrochim. Acta 2021, 373, 137890. [Google Scholar] [CrossRef]
  30. Oniciu, L.; Mureşan, L. Some fundamental aspects of levelling and brightening in metal electrodeposition. J. Appl. Electrochem. 1991, 21, 565. [Google Scholar] [CrossRef]
  31. Wang, R.Y.; Kirk, D.W.; Zhang, G.X. Effects of Deposition Conditions on the Morphology of Zinc Deposits from Alkaline Zincate Solutions. J. Electrochem. Soc. 2006, 153, C357–C364. [Google Scholar] [CrossRef]
  32. Wilcox, G.; Mitchell, P. Electrolyte additives for zinc-anoded secondary cells II. Quaternary ammonium compounds. J. Power Sources 1990, 32, 31–41. [Google Scholar] [CrossRef]
  33. Lan, C.J.; Lee, C.Y.; Chin, T.S. Tetra-alkyl ammonium hydroxides as inhibitors of Zn dendrite in Zn-based secondary batteries. Electrochim. Acta 2007, 52, 5407. [Google Scholar]
  34. Pletcher, D.; Zhou, H.; Kear, G.; Low, C.T.J.; Walsh, F.C.; Wills, R.G.A. A novel flow battery—A lead-acid battery based on an electrolyte with soluble lead(II): V. studies of the lead negative electrode. J. Power Sources 2008, 180, 621. [Google Scholar] [CrossRef]
  35. Hazza, A.; Pletcher, D.; Wills, R. A novel flow battery—A lead acid battery based on an electrolyte with soluble lead(II): IV. the influence of additives. J. Power Sources 2005, 149, 103. [Google Scholar] [CrossRef]
  36. Sonneveld, P.; Visscher, W.; Barendrecht, E. Nucleation and growth of zinc on a glassy carbon electrode from a zincate solution. Electrochim. Acta 1992, 37, 1199–1205. [Google Scholar] [CrossRef]
  37. Ito, Y.; Wei, X.; Desai, D.; Steingart, D.; Banerjee, S. An indicator of zinc morphology transition in flowing alkaline electrolyte. J. Power Sources 2012, 211, 119–128. [Google Scholar] [CrossRef]
  38. Desai, D.; Wei, X.; Steingart, D.A.; Banerjee, S. Electrodeposition of preferentially oriented zinc for flow-assisted alkaline batteries. J. Power Sources 2014, 256, 145–152. [Google Scholar] [CrossRef]
  39. Mai, N.T.; Thuy, T.T.; Mott, D.M.; Maenosono, S. Chemical synthesis of blue-emitting metallic zinc nano-hexagons. CrystEngComm 2013, 15, 6606–6610. [Google Scholar] [CrossRef]
  40. Otani, T.; Fukunaka, Y.; Homma, T. Effect of lead and tin additives on surface morphology evolution of electrodeposited zinc. Electrochim. Acta 2017, 242, 364–372. [Google Scholar] [CrossRef]
  41. Iwashita, N.; Park, C.R.; Fujimoto, H.; Shiraishi, M.; Inagaki, M. Specification for a standard procedure of X-ray diffraction measurements on carbon materials. Carbon 2004, 42, 701. [Google Scholar] [CrossRef]
  42. Leung, P.; Ponce-De-León, C.; Recio, F.; Herrasti, P.; Walsh, F.C. Corrosion of the zinc negative electrode of zinc–cerium hybrid redox flow batteries in methanesulfonic acid. J. Appl. Electrochem. 2014, 44, 1025–1035. [Google Scholar] [CrossRef]
  43. Ito, Y.; Nyce, M.; Plivelich, R.; Klein, M.; Banerjee, S. Gas evolution in a flow-assisted zinc–nickel oxide battery. J. Power Sources 2011, 196, 6583–6587. [Google Scholar] [CrossRef]
Figure 1. Zinc deposition and dissolution performance of the blank electrolytes without QAAs and the crystallinity/morphology of the zinc deposits derived from no additive. (a) Deposition polarizations for both static and stirred 0.3/0.5 M ZnO + 6 M KOH electrolytes and 6 M KOH only; (b) the 1st zinc deposition–dissolution cycle chronopotentiograms of stirred 0.3/0.5 M ZnO + 6 M KOH at 100 mA cm−2 and 20 mAh cm−2; (c) the 1st zinc deposition–dissolution cycle chronopotentiograms of stirred 0.5 M ZnO + 6 M KOH at 20/50/100 mA cm−2 and 20 mAh cm−2; (d) XRD pattern between 2θ of 35 to 45° for zinc deposit obtained from no additive, compared with the reference pattern of hexagonal close-packed metallic zinc (JCPDS 03-65-5973); SEM images of zinc deposits obtained from no additive at (e) high (10,000×) and (f) low magnification (1000×). Arrows in (f) point to the mossy structures at boundaries between boulders and base layers.
Batteries 08 00106 g001
Figure 2. (a) Cyclic voltammograms (CVs), (b) plots of relative CV charge capacity against time and (c) Tafel plots for 5 mM TMAB/TEAB/TPAB/BTMAB/HDTMAB and no additive. The latter two plots are both derived from the CVs in (a). Insert in (c) is the corresponding electrical impedance spectroscopy (EIS) Nyquist plots.
Batteries 08 00106 g002
Figure 3. (a) The 1st zinc deposition–dissolution cycle at 100 mA cm−2/20 mAh cm−2, (b) changes of cycling CEs in the 1st–5th cycles, and (c) summary of CV charge capacity losses, the 1st cycle CE losses and cycling CE decay rates for 5 mM TMAB/TEAB/TPAB/BTMAB/HDTMAB and no additive. The values of areal capacity and coulombic efficiency in (a) are directly calculated based on charge/discharge time.
Batteries 08 00106 g003
Figure 4. Correlations of three key performance indicators against deposition overpotentials including CV charge capacity loss (in red), the 1st cycle coulombic efficiency loss (in green), and cycling coulombic efficiency decay rate (in blue). The colored dash lines highlight the target values for the respective performance indicators.
Batteries 08 00106 g004
Figure 5. (a) XRD patterns of 5 mM TMAB/TEAB/TPAB/BTMAB/HDTMAB and no additive, and (b) plot of XRD crystallite size against deposition overpotentials. The solid or hollow symbols in (b) indicate bromides or hydroxides, and the inverted triangles, squares, or triangles mean 1.5, 5, or 15 mM of QAAs, respectively.
Batteries 08 00106 g005aBatteries 08 00106 g005b
Figure 6. SEM images under high ((ah), 10,000×) and low ((ip), 1000×) magnification for (a,i) 5 mM TMAB, (b,j) 1.5 mM BTMAH, (c,k) 5 mM BTMAB, (d,l) 1.5 mM HDTMAH, (e,m) 5 mM HDTMAB, (f,n) 1.5 mM TPAB, (g,o) 5 mM TPAB, and (h,p) 15 mM TPAH.
Batteries 08 00106 g006
Table 1. Summary of the names, cations molecular formula, and structures for the ten QAAs examined in this work. Blue balls in the molecular structures are nitrogen atoms and the grey ones are carbon. Hydrogen atoms and anions are not shown.
Additive NameShort NameCation Molecular FormulaCation Structure
Tetramethylammonium bromideTMAB[CH3]N+[CH3]3Batteries 08 00106 i001
Tetramethylammonium hydroxideTMAH
Tetraethylammonium bromideTEAB[CH3CH2]N+[CH2CH3]3Batteries 08 00106 i002
Tetraethylammonium hydroxideTEAH
Tetrapropylammonium bromideTPAB[CH3(CH2)2]N+[(CH2)2CH3]3Batteries 08 00106 i003
Tetrapropylammonium hydroxideTPAH
Benzyltrimethylammonium bromideBTMAB[C6H5CH2]N+[CH3]3Batteries 08 00106 i004
Benzyltrimethylammonium hydroxideBTMAH
Hexadecyltrimethylammonium bromideHDTMAB[CH3(CH2)15]N+[CH3]3Batteries 08 00106 i005
Hexadecyltrimethylammonium hydroxideHDTMAH
Table 2. Summary of zinc deposition–dissolution cycling performance indicators derived from cyclic voltammetry and galvanostatic deposition–dissolution of zinc. The cycling performance indicators of QAAs better than that of no additive are highlighted by underlining.
CV Capacity Loss (%)/1st Cycle CE Loss (%)/Cycling CE Decay Rate (% per Cycle)
No Additive10.0/6.3/3.8
Additives1.5 mM5 mM15 mM
TMABNA16.2/10.8/22.810.1/11.4/13.5
TMAHNA11.3/11.4/21.316.9/17.1/13.8
TEABNA7.0/4.0/1.31.6/7.9/0.9
TEAHNA12.5/3.8/1.12.2/6.4/1.7
TPAB0.9/8.8/0.81.1/3.9/2.80.4/4.9/5.3
TPAH0.7/2.5/1.71.2/2.5/4.40.6/1.4/3.6
BTMAB8.4/6.5/2.04.0/3.2/1.50.7/2.6/2.7
BTMAH3.5/3.6/0.84.6/2.4/1.51.0/2.6/1.8
HDTMAB4.8/2.6/1.92.5/1.1/0.8NA
HDTMAH5.4/1.4/1.09.44/1.3/1.9NA
Table 3. Summary of XRD crystallite sizes (in nm) estimated by Scherrer equation according to the peaks of (101) lattice plane at 2θ of 43.3° in the respective X-ray diffraction patterns.
XRD Crystallite Size/nm
No Additive169
Additives1.5 mM5 mM15 mM
TMABNA160162
TMAHNA165153
TEABNA13881
TEAHNA13391
TPAB544748
TPAH504646
BTMAB13810070
BTMAH13610167
HDTMAB6950NA
HDTMAH6651NA
Publisher’s Note: MDPI stays neutral with regard to jurisdictional claims in published maps and institutional affiliations.

