Abstract
Batteries are used in various combinations in various fields. Research on single-cell batteries is well underway and is approaching a stabilization phase. However, problems caused by battery combinations are still insufficiently studied. The purpose of this study was to investigate the cause of fires due to gradual damage in a large-capacity energy storage system (ESS). In the paper Energy Storage System Safety Operation Plan by Preventing Overcharge During Relaxation Time, which was based on the fact that most fires in large-capacity energy storage devices occurred during the diastolic period, it was proven that the inflow of compensation current due to a voltage imbalance in the cell was the cause. The total amount of compensation current is determined by the voltage deviation of the battery. Batteries connected in series have different rates of aging due to differences in their capacities. Thus, with use, the total amount of compensating current continues to increase until a fire occurs. In this study, by analyzing the effect of battery-capacity deviation on the aging of individual cells, it was confirmed that the capacity deviation increased as the battery was used, resulting in an increase in the total amount of compensation current. In addition, if a solution to the problem is presented and the proposed solution is applied, the allowable range of battery-capacity deviation will be widened. We used Matlab 2009a, assuming a real environment. Using Simulink, problems were identified through simulation, improvement measures were suggested, and the proposed method was verified via simulation.
1. Introduction
The UK’s Office of Science and Technology (POST) coined the term ‘carbon footprint’ in 2006 to calculate carbon emissions and regulate them to combat climate change [1]. In the US, ‘off-cycle credits’ are given and cannot be applied to the existing fuel efficiency certification, but credits are given for technologies that are effective at improving fuel efficiency and preventing global warming [2].
Currently, in many fields, energy is efficiently managed by adding batteries to various products in series or in parallel. The capacities of batteries cannot be 100% the same. Therefore, cell balance is absolutely necessary in a battery system. This cell balance is mainly performed in two ways. One is based on the voltage of the battery, and the other is based on the capacity of the battery. Cell balancing based on capacity is a burden because the capacity of each cell connected in series in the BMS must always be calculated [3,4]. Therefore, in the field, balancing based on voltage is applied. When explaining cell balance, conventionally, the function is described only on the basis of the voltage of the battery [5,6,7,8,9]. However, the non-capacity approach hampers our understanding of battery systems.
The capacity of series-connected batteries is increasing, but the cell-balance current is still maintained at about 100 mA. Due to the low cell-balance current, cell balancing is performed for batteries with small cell capacities that have SOCs of 50% or more, while cell balancing is performed with large cell capacities when the SOC is less than 50%, and the cell balancing is not operating normally.
Batteries account for about 40% of the price of electric vehicles and for 60% of the price of large-capacity energy storage devices. In a situation where the cell balance does not operate normally, the company selling the battery will increase the deviation of its allowable capacity in order to lower the unit price. In this paper, the effect of the allowable capacity deviation of series-connected batteries on their aging is analyzed, and a new cell-balancing method using voltage deviation but based on capacity is proposed as a solution.
In this section, the necessity and problems of batteries were mentioned. In Section 2, we discuss the effect of capacity variation on aging when batteries are connected in series, and, in Section 3, we propose a solution to the different aging progress rates. In Section 4, the verification of the solution is provided by our simulations, and Section 5 presents our conclusions.
2. Characteristics of Battery Connection Structure
When batteries are connected in series and charged to the maximum voltage with a single-power charger, the same voltage distribution as that of a capacitor occurs due to the difference in capacity [10,11,12]. Passive balancing is performed to eliminate this voltage difference and produce a uniform voltage [6,13,14].
Over time, battery capacity increases, and charging time is shortened. However, a constant passive-balancing resistor value increases the time required for passive balancing and creates a situation in which cell balancing must be performed even after charging is complete. In addition, automakers do not perform cell balancing after the charging of electric vehicles is finished to prevent electric bus fires. As a result, the cell voltage remains unstable for a long time, which is somewhat dangerous [15,16]. When charging and discharging batteries connected in series, the aging of small-capacity cells is accelerated because the charging and discharging conditions are different for each cell due to the voltage distribution caused by the battery capacity deviation [17]. In terms of cell balancing, it is necessary to prevent the small-capacity cells from rising above the charging voltage, but a low cell-balance current cannot allow this and cannot prevent the cell’s charging voltage from rising. Batteries have a lifespan. We refer to it by the term state of health (SOH), and battery manufacturers guarantee the cycle life of cells until the SOH reaches 80% due to repeated charging and discharging under constant charging and discharging conditions. Guaranteed cycle life is implemented under the assumption that it is always consistent, but conditions such as different charging voltages and C-rates caused by temperature and humidity and capacity variations in actual sites are not constant.
2.1. Characteristics of Series-Connected Batteries
Figure 1 shows a case where a series connection is used to increase the voltage of the battery. Figure 2 is a diagram showing the capacity deviation of each battery when the selected batteries are connected in series. Although they look like the same battery with the same voltage and state of charge, they actually have different capacities.
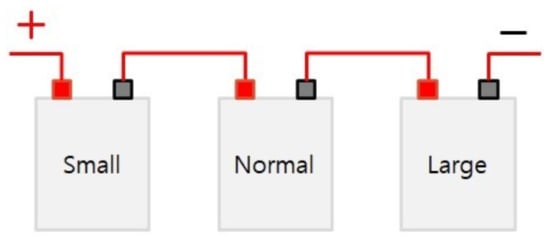
Figure 1.
Series connection of batteries.
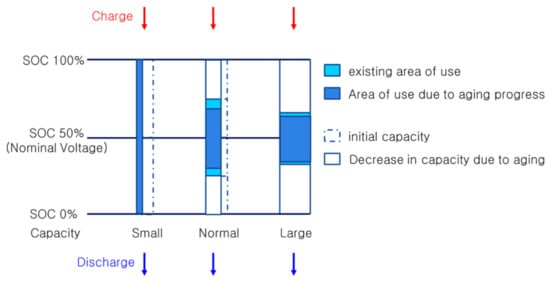
Figure 2.
The difference in aging progress rate according to the area of use of series-connected batteries.
When batteries of different capacities are connected in series to charge and discharge, a single current loop is formed for all cells, and the same current flows. Additionally, the state of charge is different for each battery [3,4].
When charging a series-connected battery with a single power source as shown in Figure 2, the SOC of battery cells with relatively small capacities generated during the production process has a relatively high charging voltage [17,18,19]. In Figure 2, a cell with a small capacity has a low voltage, as the SOC decreases relatively quickly during discharge. Due to the voltage deviation occurring at this time, the cutoff condition during discharge is based on the cell voltage of the cell with the smallest capacity. Therefore, determining the usage capacity of series-connected batteries is determined by the cell with the smallest battery capacity. In addition, it can be seen that each battery has a different charging current C-rate for each cell due to a difference in capacity, which affects the aging rate of the battery.
The effect of cell balance current stagnation can be seen in Figure 2. Since the cell balance current is low, the energy of a battery with a relatively small battery capacity decreases at SOC 50% or more. Below SOC 50%, the capacity is relatively low, the energy of a large battery decreases, and the cell balance does not operate normally.
Thus, batteries with relatively small capacities charge quickly, and batteries with relatively large capacities charge slowly. Near the charging end point, a voltage redistribution phenomenon occurs due to a sharp DCIR deviation. This increases the charging voltage of a battery with a relatively small capacity, causing overcharging and rapid aging.
A battery with a relatively small capacity forms charging conditions with a relatively high voltage and accelerated C-rate aging, and a large-capacity battery forms charging conditions with a relatively low voltage and slow current aging. As the battery is repeatedly charged and discharged, the difference in battery capacity increases [17]. As is shown in Figure 2, when batteries of different capacities are connected in series and charged with one power source, a battery with a small capacity uses the full SOC, whereas a battery with a large capacity uses a small portion of the SOC [19]. A battery with a relatively large capacity has a narrow SOC range; thus, the aging process is slower than that of a battery with a relatively small capacity.
In addition, as the depth of discharge (DOD) and depth of charge (DOC) approach 100% and 0%, respectively, the performance of the battery deteriorates rapidly [20,21].
As is shown in Figure 2, when charging at a voltage higher than the nominal voltage, the voltage to a battery with a relatively small capacity is high, and, at a voltage lower than the nominal voltage, the voltage to a relatively large battery will be high. If the periods of time with SOC below 50% and above 50% during discharging or charging are the same, it will result in the same situation. This is because cell balancing operates based on the SOC at 50%, as is shown in Figure 2 and Figure 3.
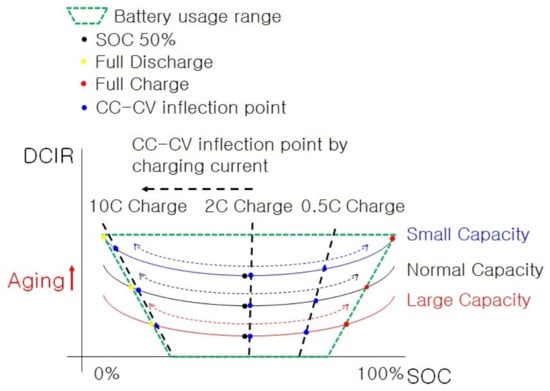
Figure 3.
Range of use for series-connected batteries with different capacities.
Figure 4 shows the DCIR temperature characteristics of a pouch-type lithium polymer battery. Lithium polymer batteries have relatively high DCIR values at close to 100% SOC and low temperatures [22]. Therefore, a large stray voltage is generated by the current during charging; thus, less than the actual capacity is charged. Conversely, at high temperatures, the DCIR value is relatively low, resulting in charging beyond the actual capacity.
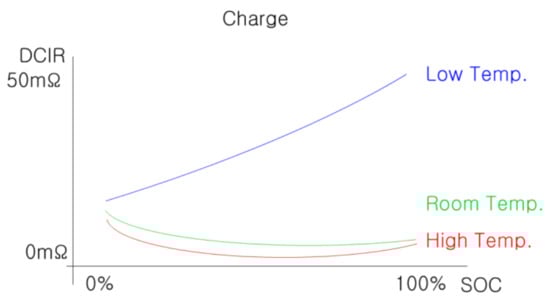
Figure 4.
DCIR temperature characteristics during charging of pouch-type Li-polymer batteries.
In Figure 3, it can be seen that, when charging and discharging assembled series-connected batteries at a nominal voltage from an SOC of 50%, looking at the area of the green dotted line in Figure 3, the usage range of the battery SOC with a relatively small capacity is relatively large. Smaller-capacity batteries inherently have higher internal resistance [7,19]. Conversely, a relatively large-capacity battery has a small usable area and low internal resistance. In Figure 3, predicting the internal resistance when the CC-CV inflection point is reached during charging can be expressed as points on the 10 C charge, 2 C charge, and 0.5 C charge lines. In the case of 2 C charging, since only the DCIR deviation of the Y-axis is obtained, the deviation of the internal resistance is the shortest. However, in the case of 10 C and 0.5 C charging, the deviation of the internal resistance becomes larger because it has both the X-axis and the Y-axis DCIR deviation values.
A greater capacity deviation results in greater deviation in the internal resistance of the single-supply charge to the SOC. As shown in Figure 3, a small-capacity battery using a large SOC area has a relatively high depth of discharge (DOD) and depth of charge (DOC).
Therefore, aging proceeds rapidly. The result is a higher DCIR over the entire SOC area and slower aging of large-capacity batteries due to the narrow SOC area. Accordingly, the DCIR gap of small-capacity batteries is widening.
Figure 5a shows the reduction in battery life when each charger is connected in a series-connected battery and charged at the same C-rate proportional to the battery capacity. In general, the battery life guaranteed by the battery cell manufacturer is guaranteed through the cell lifespan (EOL—end of life) evaluation due to the capacity reduction in a single cell. However, when these single cells are connected in series, the battery life is changed by the interaction shown in Figure 5b. As the capacity deviation among batteries connected in series increases, the lifespan of a battery with a relatively small capacity is decreased, and the lifespan of a battery with a relatively large capacity is increased. A battery with a small capacity has a relatively large usable area, discharges until SOC 0%, and has a relatively high DCIR [8,23,24,25,26,27]. Cells with relatively large capacities cannot lower their SOC until 0%; thus, they have a relatively high voltage, and, due to the low DCIR, the voltage rise during stabilization is relatively small. Therefore, it can be seen that there is no significant difference when only simple voltage is compared during rest time. Conversely, when the SOC is charged to 100%, the SOC cannot reach 100% because there is not enough current to fully charge a cell with a large battery capacity [10,11,12,18,23,24]. Therefore, a cell with a small capacity is charged with a voltage higher than the set voltage due to the voltage distribution, and a cell with a relatively large capacity is charged with a lower voltage [7,19].
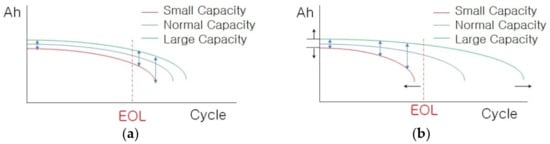
Figure 5.
Aging of series-connected batteries. (a) Individual charge. (b) Effect of capacity variation on single-supply charging.
2.2. Charging/Discharging Characteristics of Series-Connected Batteries and Ideal Aging
In response to consumers’ demands for short charging times and long usage times, the chargeable current and capacity have increased. Charging times are shortened, but the cell-balancing current is still around 100 mA [28]. This section discusses the effect of low cell-balancing current during charging. A situation occurs where the cell balance does not operate normally due to low cell-balance current. When discharging, if the time spent in an SOC of 100–50% and the time spent in an SOC of 50–0% are the same, cell balancing, due to the voltage deviation, is the same as if the battery were not working. When discharging in a state where the SOC is 50% or more, cells with small battery capacities have relatively high SOCs and, thus, have relatively high voltages. When discharging in a state where the SOC is 50% or less, a cell with a large battery capacity will see a relatively small voltage drop for the same discharging current as the others; hence, the voltage will be relatively high. A similar phenomenon occurs in the constant-current (CC) section because the DCIR is different due to the difference in SOC [23,24]. While charging, the cell balancing works, but the balancing current is too low for the charging current to function.
An example is provided to improve understanding. Assume that cells with a capacity of 40 Ah are connected in series and that the cell capacity deviation is ±5% (±2 Ah). Assuming that the quick charge completion time is 30 min and the cell balancing for the maximum capacity deviation of 4 Ah is 100 mA, the time required for cell balancing is 40 h [29].
Simulations were performed with Simulink in Matlab 2009a for illustrative purposes. For the charger and battery, the CCCV battery charger provided by Simulink and the lithium-ion type library of battery were used (see Figure 6). In Figure 6a, battery 1, battery 2, battery 3, and battery 4 are 40, 38, 42, and 40 Ah, respectively, and the initial SOC was set to 50%. The 38 Ah cell was discharged at 1.5C (60 A) until it reached 3.0 V. Then, it was charged at 16.4 V/60 A (1.5 C), which is rapid charging, and terminated at ½ C (20 A) [7]. Batteries are delivered with nominal voltage and with capacity deviations from the production process. Figure 6b is the simulation result assuming serial connection assembly with batteries delivered. When the SOC is below 50%, it can be seen that the voltage of cells with relatively small battery capacities is lower than that of others [7,8,10,18,25,26,27]. In this case, when passive cell balancing was performed, the voltage of the large-capacity cell was lowered. Conversely, when the SOC is 50% or higher, the voltage increase rate of the small-capacity cell is high and the voltage of the relatively large-capacity cell is low [7,10,11,12,18]. Therefore, at an SOC of 50% or higher, cells with relatively small capacities are passively balanced. From the simulation results in Figure 6b, it was confirmed that balancing the cell with only the potential difference is meaningless.
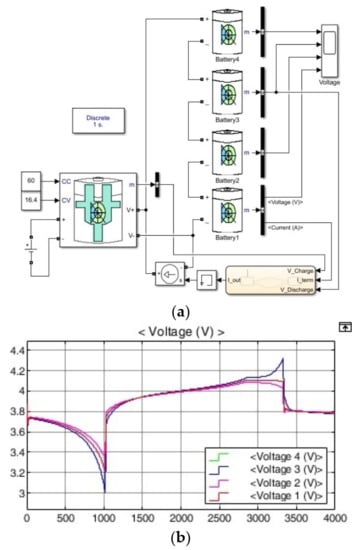
Figure 6.
Charging/discharging simulations of series-connected batteries. (a) Schematic. (b) Voltage results.
It took about 38.3 min for fast charging to complete, but the time required for the cell balancing was over 40 h. The cell balance current stays around 100 mA, but the battery capacity continues to increase. Therefore, due to the short charge time and long cell balance time, most of the cell balance energy is consumed after charging is complete [29]. In large-capacity energy storage devices, cell-balancing progress after the end of charging is a fundamental cause of fires [30,31,32,33]. Table 1 summarizes the simulation results in Figure 6. At the end of discharge, Cell #3, which has a relatively small battery capacity, has the lowest voltage, and Cells #1, #2, and #4, which have relatively high voltage, are balanced. At the maximum voltage, Cell #3, which had a relatively small capacity, had a high voltage; therefore, cell balancing was achieved by lowering the voltage of Cell #3. In Figure 6, it is confirmed that the charging conditions of each cell are different due to the voltage distribution that occurs when charging batteries connected in series [7,10,11,12,18].

Table 1.
Simulation results of charging and discharging of series-connected batteries.
Simulations were performed to test the effects of different charging conditions on battery aging. To form a control group, the aging progression simulation for each cell connected in series and the aging progression simulation for each cell connected in series when charging with a single power source were performed and compared.
In the simulation in Figure 7a, a lithium-ion battery from Matlab's Simulink library was used. The charger used the CCCV battery changer library provided by Simulink. The maximum capacity deviation of each battery is ±5%. In the case of the charger, each battery was charged and discharged with a current of 1 C in proportion to its capacity. As is shown in Figure 7b, the life cycles of all batteries were set to be the same. The simulation results in Figure 7c show that each cell was stably charged up to a charging voltage of 4 V and was uniformly discharged to 3 V for 1 × 10⁷ seconds.
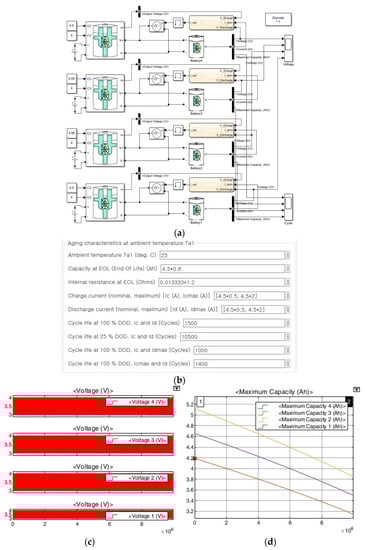
Figure 7.
Aging simulation for single-cell charging with capacity differences. (a) Schematic. (b) Battery settings. (c) Voltage results. (d) SOH results.
In Figure 7c, it is confirmed that each battery cell was normally charged to 4 V and discharged to 3 V by applying independent power to each battery cell. To measure the lifespan, all cells were charged and discharged under the same C-rate condition. Similarly, in Figure 7d, it can be seen that the battery capacity decreased through charging and discharging.
In Table 2, it can be seen that each battery, each with a different capacity, was charged and discharged at a rate corresponding to its capacity with a separate power source so that the aging of each cell similarly progressed to 24.91%. In addition, it was confirmed that the highest and lowest voltages were equally applied at 4.007 V and 2.994 V.
Table 2.
Simulation results for single-cell charging and discharging.
2.3. Aging of Series-Connected Batteries during Charging and Discharging
To check the effect of the changes in capacity of batteries connected in series on aging, a simulation was performed (see Figure 8) where the capacity deviation of the battery was ±5%. The effect of the capacity deviation was confirmed by simulating a case where the capacity deviation of the battery was ±10% (see Figure 9).
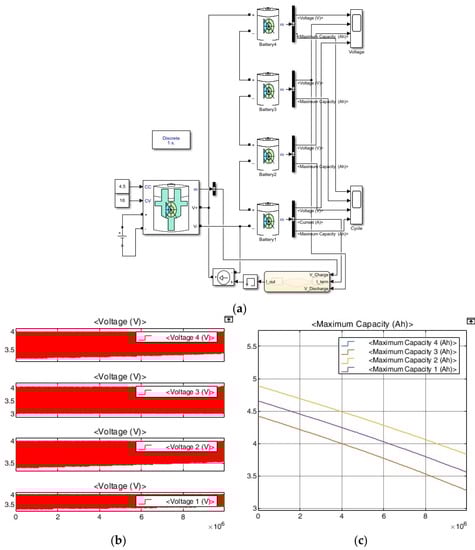
Figure 8.
Series connection aging simulation with ±5% capacity deviation. (a) Schematic. (b) Voltage results. (c) SOH results.
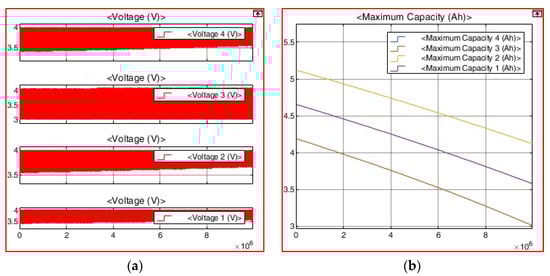
Figure 9.
Series connection aging simulation with ±10% capacity deviation. (a) Voltage results. (b) SOH results.
Charging was simulated from a single power source to simulate a charger at an electric vehicle charging station. Figure 8 and Figure 9 are the same cycle simulation diagrams of a charger at a general charging station when charging and discharging the battery repeatedly. Figure 8b and Figure 9a show that the charging voltages of battery cells with different capacities change because the aging progress of the battery cells differs as charging and discharging are repeated. The DCIR during charging is L-type, as is shown in Figure 4, and has a fairly consistent resistance value.
Figure 8c shows how the total capacity of each battery changes as the battery charge/discharge cycle progresses. In addition, Table 3 summarizes the capacity values for each cell. Unlike Figure 7d, it can be seen that the capacity deviation ratio is different in the simulation in Figure 8c. In Table 3, it can be seen how the rate of charge changed for each cell compared to Table 2. In Figure 8, voltage distribution occurs when batteries of different capacities are connected in series. This is because the charging voltage conditions of the batteries are not the same, and the charging C-rate also varies because the capacity does. That is, as can be seen in Table 3, since charging conditions are different for each battery, a cell with a relatively small battery capacity ages relatively quickly. In addition, the increase in the allowable capacity deviation of series-connected batteries accelerates the aging of batteries with relatively small capacities. This vicious cycle repeats itself [34,35,36].
Table 3.
Aging progress results of series connection with ±5% capacity deviation.
At the point in the cycle when the capacity differences among series-connected batteries begin to increase, the state of charge deteriorates and the voltages of cells with relatively low capacities reach over voltage protection (OVP) due to rapid aging, creating a dangerous situation [17].
In Table 3, for charging with a single power source, it can be seen that the aging of the battery will not proceed in the same way. Additionally, it can be confirmed that the charging voltage of the remaining battery is different from the intended voltage due to the influence of the smallest battery cell. Figure 9 shows a simulation performed under the same conditions as in Figure 8a, except that we changed the capacity deviation of the batteries connected in series from ±5% to ±10%. The voltage result is inserted in Figure 9a, and the change in capacity is shown in Figure 9b.
Table 4 summarizes the simulation results. Table 4 shows that the rates of aging were different from those of Table 3. The average-capacity cell showed relatively less aging at 23.17%, and the large-capacity cell aged 19.56%. The small-capacity cell showed relatively more aging: 28.20%. The reason can be found in the maximum and minimum voltages during charging and discharging and the charging C-rate. A cell with a relatively small capacity was charged with a voltage higher than 4.0 V—a maximum voltage of 4.085 V—and a cell with a larger capacity was charged with a relatively lower voltage: 3.990 V. Additionally, in the case of discharge, the small-capacity cell was discharged to 2.994 V, but the large-capacity cell was discharged only to 3.542 V. This is because the use area of the large-capacity cell is relatively narrow, causing a difference in the aging rate. Additionally, since the charging current was fixed to 4.5 A and applied at once, the charging C-rate of each battery was also different.
Table 4.
Aging progress results of series-connected batteries with ±10% capacity deviation.
The initial charging C-rates of Cells #1, 2, 3, and 4 were 0.967, 0.879, 1.093, and 0.967 C, respectively; however, at 1 × 10⁷ s, their capacities were 1.272, 1.100, 1.523, and 1.272 C, respectively. The relatively high charging C-rate of small batteries shows that it is accelerated by aging.
Table 5 shows data comparing Table 2, Table 3 and Table 4. When individual charging is performed, there is no voltage distribution phenomenon; hence, the lifespan with charging and discharging is the same regardless of the capacity deviation. However, it can be seen that charging by a single power source results in different lifespans in series-connected batteries with variations. In addition, the deviation of the battery doubled from ±5% to ±10%, but it can be seen that the aging rate of Cell #3, which had the smallest battery capacity, increased more than threefold, from −1.05% to −3.30%. Conversely, it can be seen that aging progressed slowly in the remaining cells.
Table 5.
Progression of aging in series-connected cells with different capacities. The simulation time for each condition was the same.
3. Proposed Cell-Balancing Method
3.1. Causes of Voltage Distribution
The simulation was performed by applying MCC-CV to a multicell battery. In the MCC, the current is 10 C–5 C–2 C, which is charged with the charging current changing [28,32]. The charging current conversion condition was such that, when 10 C reached the CV voltage, it was changed to 5 C, and, when 5 C reached the CV voltage, it was converted to 2 C.
The method proposed in this paper does not aim to complete the balancing in a short time with a low balance current but to reverse the progressive damage caused by repeated charging and discharging cycles. In Figure 3, the reference point of cell balancing is an SOC of 50%. However, for the method proposed in this paper (shown in Figure 10), the cell balancing reference point was set to 100% SOC, and the balancing was carried out.
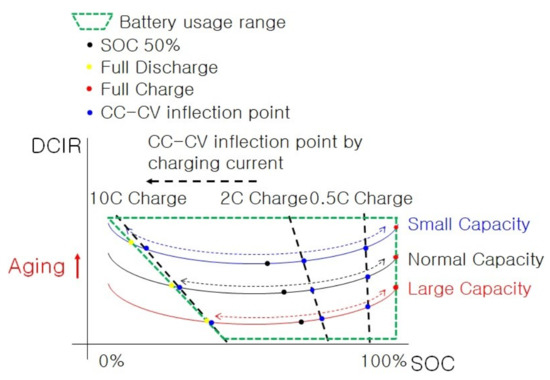
Figure 10.
Battery usage area using the proposed cell balancing method.
In order to move the reference point of cell balancing in the direction shown in Figure 10, additional conditions are required apart from performing cell balancing with a simple voltage. A cell with the largest battery capacity must be found, and the balancing operation of the other cells must be performed only when the voltage of the cell with the largest capacity is higher than that of the cell.
As shown in Figure 10, all cells reached SOC 100% at the time of completion of charging so that the DCIR deviation had only Y-axis values. At the beginning of shipment, the capacity deviation of the battery was checked and managed so that the aging process at the initial stage of shipment did not proceed quickly, and the capacity deviation was reduced at full charge by repeating charging and discharging. At a relatively low voltage, the DCIR value increases due to the capacity deviation, and the potential difference at the CC–CV inflection point increases during ultrafast charging, but the problem can be solved with the MLMCC–CV charging method proposed in a previous paper [33]. Figure 11 shows the flowchart of the proposed cell balancing method. In a battery connected in series, the cell with the largest capacity is selected. If cell balancing is performed only when the voltage of this cell is relatively high, repeated charging and discharging moves the cell balance reference point; compare Figure 3 and Figure 10.
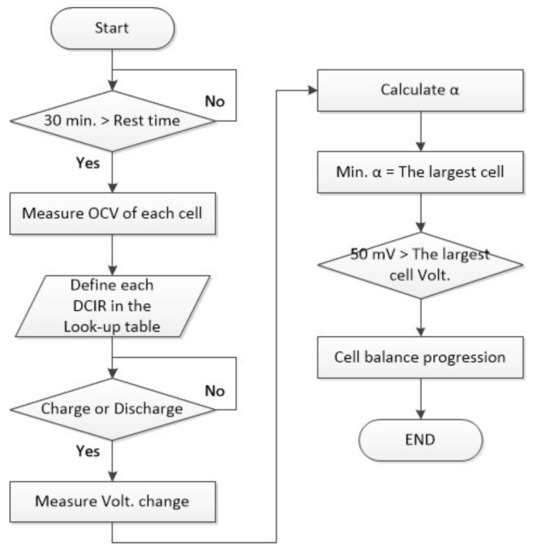
Figure 11.
Proposed cell-balancing flow chart.
ΔV is the actual measurement of the voltage variation in each cell, and ΔI is the same constant for all cells in the series. RDCIR is a constant determined by the temperature and the measured OCV from the lookup
This current change can be used to select the cell with the largest battery capacity.
V = I × R
V − V′ = (I − I′) × R DCIR
V − V′ = (I − I′) × (α × R DCIR)
α = ∆V/(∆I × R DCIR), ∆V = V − V′, ∆I = I − I′
α: Standard Capacity Error Rate
3.2. Review of the Proposed Cell-Balancing Plan
The balancing process was repeated only for cells with a higher voltage than during charging based on the cells with the largest capacity (see Figure 11). The operating voltage ranges shown in Figure 10 can be created. A cell-balancing method was proposed so that the SOCs of all cells reach 100% at the time of completion of charging in order to minimize the differences in the internal resistance.
The simulation was verified using Simulink in Matlab R2019a; the cell-balancing method proposed in Figure 12 was applied.
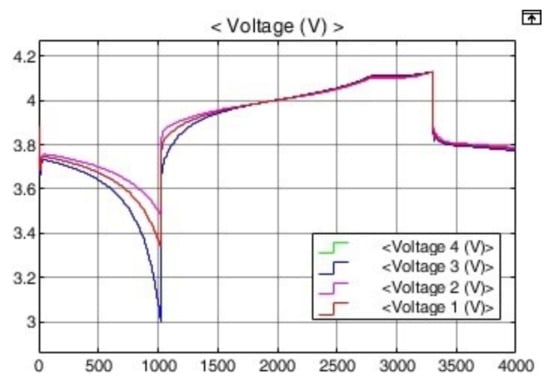
Figure 12.
Simulation applying the proposed cell-balancing method.
As a result of the simulation, as shown in Table 6, the potential difference increased to 665 mV in the low-voltage section; however, since the SOC was equal to 100% in the highest-voltage section, the potential difference between cells was 2 mV, confirming that it was safe from dangerous voltage differences.
Table 6.
Comparison of batteries with the proposed cell-balancing method applied.
4. Simulation Results
By applying the proposed cell-balancing method, all batteries reach SOC 100% at the end of charging, and the DCIR deviation is minimal. In addition, this simulation was conducted with the expectation that the battery aging could be slowed down by lowering the charging voltage of a battery with a relatively small capacity. Previously (see Figure 8 and Figure 10), the proposed cell-balancing method was applied in aging simulations with capacity deviations among the series-connected cells, and the simulation was performed assuming that the cell balancing was completed based on the target SOC of 100%.
4.1. Simulation Result of the Proposed Cell-Balancing Method
We set the capacities of batteries 1, 2, 3, and 4 to 4.5, 4.05, 4.95, and 4.5 Ah, respectively, which are ±10% deviations from the central capacity, but the cell balancing target was shifted from 50% SOC in Figure 3 to 100% SOC, as shown in Figure 10. The initial states of charge of batteries 1, 2, 3, and 4 were set to 55% (2.475 Ah), 50% (2.025 Ah), 59.09% (2.905 Ah), and 55% (2.475 Ah), respectively, and, when charging was complete, all SOCs were 100%. All cells were set to arrive at the same time. Battery aging and voltage changes were confirmed by repeating charging and discharging under the same conditions as for the simulation in Figure 9. In Figure 13a, the voltage result of each cell is shown. The results of battery capacity changes are in Figure 13b. For Figure 8, Figure 9 and Figure 10 and Figure 14, the simulation time was the same, and Table 7 summarizes the simulation results of Figure 13.
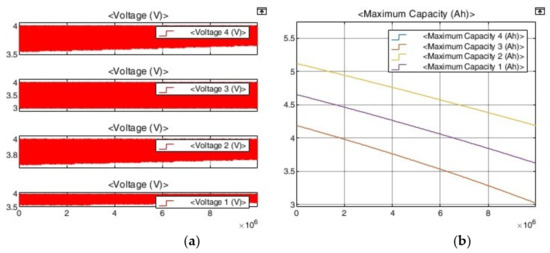
Figure 13.
Aging simulation applying the proposed cell-balancing method. (a) Voltage result. (b) SOH result.
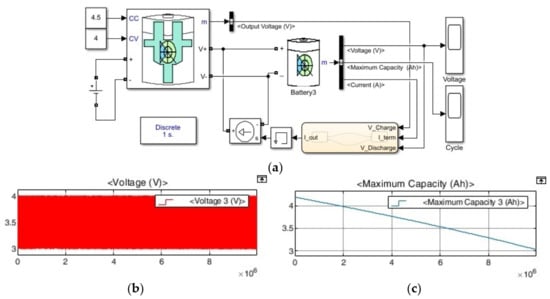
Figure 14.
Comparative standard aging simulation. (a) Schematic. (b) Voltage result. (c) SOH result.
Table 7.
Aging progress when applying the proposed cell-balancing method.
The biggest difference between Table 6 and Table 7 is the maximum and minimum voltages that appeared while charging and discharging the battery repeatedly. First, the highest maximum voltage in Table 6 was 4.085 V for Cell 3. The maximum voltage continued to rise as the charge/discharge cycles were repeated. However, in Table 7, the maximum voltage was 4.010 V, and this value was maintained from the beginning of the charge/discharge cycle. The minimum voltages were 3.549, 3.676, 2.944, and 3.549 V, from the 3.396, 3.542, 2.944, and 3.396 V reference voltages for Cells #1–4, respectively. Cell #3 was the standard for charging and discharging, resulting in the lack of difference. Second, the aging rate was slowed not only in Cell #3, which had the smallest battery capacity, but also in Cell #1, Cell #2, and Cell #4. Cell #1 and Cell #4 slowed senescence by 0.97% from 23.17% to 22.20%, Cell #2 decreased by 1.39% from 19.56% to 18.17%, and Cell #3 decreased by 0.31% from 28.20% to 27.89%.
4.2. Comparison of Standard Simulation Result
When the capacities of the battery’s cells were different, it was confirmed that the aging of the battery with a relatively small capacity would be accelerated by connecting it in series and charging and discharging the unit at the same current. Therefore, to confirm the effectiveness of the proposed method, a life test was performed under the same charge/discharge conditions as when a single cell was connected in series. Figure 14 shows a case in which cells with small battery capacities were charged with a lump current in series; this gave us comparative data.
The experimental results are shown in Table 8. The battery capacity was set to 4.05 Ah by reflecting a -10% capacity deviation from 4.5 Ah. The same charge/discharge current condition of 1 C (4.5 A) was applied to series-connected batteries. That is, the 1.11C (4.5A) charging and discharging conditions in the 4.05 Ah battery were compared.
Table 8.
Comparison of proposed cell balance with aging.
In the case of a single cell, the aging rate was 27.77%; however, when the proposed method was applied, it was 27.89%, resulting in an error of 0.12%. In addition, in the case of the proposed method, the maximum voltage was fixed at 4.010 V; however, in the case of conventional series-connected cell balancing, the charging voltage continued to rise and rose to 4.085 V. In the conventional cell balancing method, the maximum voltage continues to increase until a cell with a relatively small battery capacity causes a fire while repeating charging and discharging.
5. Conclusions
As a result of examining the aging progress of a battery by applying the proposed cell-balancing method, only the battery with the smallest capacity was expected to slow down the aging process, but it was confirmed that the aging process slowed down in all cells of the battery. Rather, aging showed the greatest effect in the cells with the largest capacity. Further studies on these results will be conducted. Research was conducted with the goal of identifying the cause of battery fires and solving the problem. As a result of simulating the aging of a battery by applying the proposed cell balance method, it was possible to observe a clear difference from the maximum voltage of the battery cell when the battery was charged in the conventional manner as the aging progressed. In the existing cell-balancing method, as the aging of a relatively small-capacity battery proceeds rapidly, the DCIR deviation due to the SOC deviation also increases at the charging completion stage such that the voltage distribution phenomenon does not occur, and the charging voltage of the battery with a relatively small capacity increases. An increase was observed; however, when the proposed cell balance method was applied, the aging of the battery with a relatively small capacity proceeded more slowly than before. It was confirmed that the DCIR deviation was minimized, and the resulting voltage distribution was minimized as the SOC was unified to 100% in the charging completion stage. The authors realize that the understanding of batteries is insufficient, and they will continue research to understand battery characteristics and find solutions for ESS and electric vehicle fires.
Author Contributions
Conceptualization, S.-S.Y.; methodology, S.-S.Y.; software, S.-S.Y.; validation, S.-S.Y. and S.-C.K.; formal analysis, S.-S.Y.; investigation, S.-S.Y.; resources, S.-S.Y. and S.-C.K.; data curation, S.-S.Y.; writing—original draft preparation, S.-S.Y. and S.-C.K.; writing—review and editing, S.-S.Y. and S.-C.K.; visualization, S.-S.Y.; supervision, S.-C.K.; project administration, S.-S.Y. and S.-C.K.; funding acquisition S.-C.K. All authors have read and agreed to the published version of the manuscript.
Funding
This research was supported by the MSIT (Ministry of Science and ICT), Korea, under the Grand Information Technology Research Center support program (IITP-2022-2020-0-01462) supervised by the IITP (Institute for Information & communications Technology Planning & Evaluation).
Institutional Review Board Statement
Not applicable.
Informed Consent Statement
Not applicable.
Data Availability Statement
Not applicable.
Conflicts of Interest
The authors declare no conflict of interest.
References
- Carbon Footprint. Available online: https://www.carbonfootprint.com/ (accessed on 16 June 2022).
- Hur, J.; Jeon, S.; Kim, J.Y. A trend of US Air-Conditioning and Off-cycle credit system to reduce Mobile Greenhouse Gas. In Proceedings of the KSAE 2013 Annual Autumn Conference & Exhibition, Seoul, Republic of Korea, 15 November 2013; pp. 399–403. [Google Scholar]
- Ananda, S.; Lakshminarasamma, N.; Radhakrishna, V.; Srinivasan, M.S.; Satyanarayana, P.; Sankaran, M. Generic Lithium ion battery model for energy balance estimation in spacecraft. In Proceedings of the 2018 IEEE International Conference on Power Electronics, Drives and Energy Systems (PEDES), Chennai, India, 18–21 December 2018; pp. 1–5. [Google Scholar] [CrossRef]
- Zheng, L.; Zhu, J.; Wang, G. A comparative study of battery balancing strategies for different battery operation processes. In Proceedings of the 2016 IEEE Transportation Electrification Conference and Expo (ITEC), Dearborn, MI, USA, 27–29 June 2016; pp. 1–5. [Google Scholar] [CrossRef][Green Version]
- Pinto, C.; Barreras, J.V.; Schaltz, E.; Araujo, R.E. Evaluation of Advanced Control for Li-ion Battery Balancing Systems Using Convex Optimization. IEEE Trans. Sustain. Energy 2016, 7, 1703–1717. [Google Scholar] [CrossRef]
- Omariba, Z.B.; Zhang, L.; Sun, D. Review of Battery Cell Balancing Methodologies for Optimizing Battery Pack Performance in Electric Vehicles. IEEE Access 2019, 7, 129335–129352. [Google Scholar] [CrossRef]
- Feng, F.; Hu, X.; Liu, K.; Che, Y.; Linc, X.; Jin, G.; Liu, B. A Practical and Comprehensive Evaluation Method for Series-Connected Battery Pack Models. IEEE Trans. Transp. Electrif. 2020, 6, 391–416. [Google Scholar] [CrossRef]
- Iraola, U.; Aizpuru, I.; Gorrotxategi, L.; Segade, J.M.C.; Larrazabal, A.E.; Gil, I. Influence of Voltage Balancing on the Temperature Distribution of a Li-Ion Battery Module. IEEE Trans. Energy Convers. 2014, 30, 507–514. [Google Scholar] [CrossRef]
- Sertkaya, M.G.; Yilmaz, E.; Sanli, A.E.; Gunli, G. Comparison of power and energy density after full shunting-balancing in serial connected lithium-ion batteries and serial-connected supercapacitors. In Proceedings of the 2015 3rd International Renewable and Sustainable Energy Conference (IRSEC), Marrakech, Morocco, 10–13 December 2015; pp. 1–5. [Google Scholar] [CrossRef]
- Song, Y.; Liu, D.; Peng, Y. Series-connected lithium-ion battery pack health modeling with cell inconsistency evaluation. In Proceedings of the 2019 IEEE International Instrumentation and Measurement Technology Conference (I2MTC), Auckland, New Zealand, 20–23 May 2019; pp. 1–6. [Google Scholar] [CrossRef]
- Feng, W.; Jiuchun, J.; Weige, Z.; Huiping, G. Research on the charge mode of series-connected batteries. In Proceedings of the 2008 IEEE Vehicle Power and Propulsion Conference, Harbin, China, 3–5 September 2008; pp. 1–5. [Google Scholar] [CrossRef]
- Chuang, C.-C.; Yao, C.-J.; Wu, S.-T. Study on Fast Charging Method of Series Connected Lithium-Ion Battery Strings with Intelligent Control. In Proceedings of the 2020 International Conference on Fuzzy Theory and Its Applications (iFUZZY), Hsinchu, Taiwan, 4–7 November 2020; pp. 1–6. [Google Scholar] [CrossRef]
- Yang, X.; Ma, E.W.M.; Pecht, M. Cell balancing technology in battery packs. In Proceedings of the 2012 13th International Conference on Electronic Packaging Technology & High Density Packaging, Guilin, China, 13–16 August 2012; pp. 1038–1041. [Google Scholar] [CrossRef]
- Pham, V.-L.; Nguyen, T.-T.; Tran, D.-H.; Vu, V.-B.; Choi, W. A new cell-to-cell fast balancing circuit for Lithium-Ion batteries in Electric Vehicles and Energy Storage System. In Proceedings of the 2016 IEEE 8th International Power Electronics and Motion Control Conference (IPEMC-ECCE Asia), Hefei, China, 22–26 May 2016; pp. 2461–2465. [Google Scholar] [CrossRef]
- Kim, J.; Lee, S.J.; Lee, J.M.; Cho, B.H. The Characteristics Analysis of Li-Ion Fresh Battery for Temperature. In Proceedings of the Power Electronics Conference, Seoul, Republic of Korea, 30 November 2007; pp. 66–68. [Google Scholar]
- Yun, S.S.; Kee, S.-C. Relaxation Time for Temperature Change of Lithium Ion Battery. In Proceedings of the Korean Society of Automotive Engineers Spring Conference, Chungcheongnam-do, Republic of Korea, 2–4 July 2019; pp. 1148–1154. [Google Scholar]
- Chowdhury, S.; Bin Shaheed, M.N.; Sozer, Y. An Integrated State of Health (SOH) Balancing Method for Lithium-Ion Battery Cells. In Proceedings of the 2019 IEEE Energy Conversion Congress and Exposition (ECCE), Baltimore, MD, USA, 29 September–3 October 2019; pp. 5759–5763. [Google Scholar] [CrossRef]
- Zhang, Y.; Lu, S. Research on Series-Parallel Connection Switching Charging Method for Lithium Battery of Autonomous Underwater Vehicles. In Proceedings of the 2018 IEEE 8th International Conference on Underwater System Technology: Theory and Applications (USYS), Wuhan, China, 1–3 December 2018; pp. 1–5. [Google Scholar] [CrossRef]
- Zhang, Z.; Cheng, X.; Lu, Z.-Y.; Gu, D.-J. SOC Estimation of Lithium-Ion Battery Pack Considering Balancing Current. IEEE Trans. Power Electron. 2017, 33, 2216–2226. [Google Scholar] [CrossRef]
- Stroe, D.-I.; Swierczynski, M.; Stan, A.-I.; Teodorescu, R.; Andreasen, S.J. Accelerated Lifetime Testing Methodology for Lifetime Estimation of Lithium-Ion Batteries Used in Augmented Wind Power Plants. IEEE Trans. Ind. Appl. 2014, 50, 4006–4017. [Google Scholar] [CrossRef]
- Kwang-seok, S.; Park, S.-J. Battery Charging System with Built-in ACIR Measurement Algorithm using Peak Detection Circuit and DFT. Ph.D. Thesis, Chonnam National University, Gwangju, Republic of Korea, 2021. [Google Scholar]
- Wu, C.-Y.; Ke, C.-H.; Chang, C.-L.; Chiou, Z.-Y. Useful life characteristics of a LiFePO4 battery for estimating state of battery health. In Proceedings of the 2018 IEEE International Conference on Applied System Invention (ICASI), Chiba, Japan, 13–17 April 2018; pp. 1338–1341. [Google Scholar] [CrossRef]
- Celen, B.; Aras, A.C.; Dohr, M.; Sivaraman, T. Equivalent Circuit Modeling of All-Solid-State Battery by using DC-IR Data. In Proceedings of the 2021 IEEE International Systems Conference (SysCon), Vancouver, BC, Canada, 15 April–15 May 2021; pp. 1–6. [Google Scholar] [CrossRef]
- Rizzello, A.; Scavuzzo, S.; Ferraris, A.; Airale, A.G.; Carello, M. Temperature-Dependent Thévenin Model of a Li-Ion Battery for Automotive Management and Control. In Proceedings of the 2020 IEEE International Conference on Environment and Electrical Engineering and 2020 IEEE Industrial and Commercial Power Systems Europe (EEEIC/I&CPS Europe), Madrid, Spain, 9–12 June 2020; pp. 1–6. [Google Scholar] [CrossRef]
- Yu, L.-R.; Hsieh, Y.-C.; Liu, W.-C.; Moo, C.-S. Balanced discharging for serial battery power modules with boost converters. In Proceedings of the 2013 International Conference on System Science and Engineering (ICSSE), Budapest, Hungary, 4–6 July 2013; pp. 449–453. [Google Scholar] [CrossRef]
- Wang, Y.; Tan, J. A Hybrid Clustering Model for Lithium-ion Batteries Screening. In Proceedings of the 2019 IEEE 5th International Conference on Computer and Communications (ICCC), Chengdu, China, 6–9 December 2019; pp. 120–124. [Google Scholar] [CrossRef]
- Yang, R.; Xiong, R.; Shen, W. On-board soft short circuit fault diagnosis of lithium-ion battery packs for electric vehicles using extended Kalman filter. CSEE J. Power Energy Syst. 2020, 8, 258–270. [Google Scholar] [CrossRef]
- ISL78610 Multi-Cell Li-Ion Battery Manager Datasheet. Available online: https://www.renesas.com/us/en/document/dst/isl78610-datasheet?r=496881 (accessed on 10 June 2022).
- Hsieh, Y.-C.; Lo, C.-Y.; Chen, P.-C.; Chiu, H.-J. Charge Equalization on Series-Connected Battery Modules by Digital Controller. In Proceedings of the 2019 IEEE 4th International Future Energy Electronics Conference (IFEEC), Singapore, 25–28 November 2019. [Google Scholar] [CrossRef]
- Yun, S.S.; Kee, S.C. Analysis of the Cell Balancing Effect on the ESS Fire by Simulating the Euljiro 3-Ga Subway ESS. Trans. Korean Inst. Power Electron. 2020, 25, 219–226. [Google Scholar] [CrossRef]
- Hosseinzadeh, E.; Odio, M.X.; Marco, J.; Jennings, P. Unballanced Performance of Parallel Connected Large Format Lithium Ion Batteries for Electric Vehicle Application. In Proceedings of the 2019 International Conference on Smart Energy Systems and Technologies (SEST), Porto, Portugal, 9–11 September 2019; pp. 1–6. [Google Scholar] [CrossRef]
- Lee, S.; Kim, J.; Ha, M.; Song, H. Inrush Current Estimation for Hot Swap of the Parallel Connected Large Capacity Battery Pack. In Proceedings of the 2018 IEEE Energy Conversion Congress and Exposition (ECCE), Portland, OR, USA, 23–27 September 2018; pp. 2489–2492. [Google Scholar] [CrossRef]
- Kee, S.-C.; Yun, S.S. Energy Storage System Safety Operation Plan by Preventing Overcharge During Relaxation Time. J. Electr. Eng. Technol. 2021, 16, 1941–1953. [Google Scholar] [CrossRef]
- Kwon, S.; Han, D.; Lee, S.; Song, H.-C.; Kim, J. Voltage deviation analysis for battery pack Aging. In Proceedings of the Power Electronics Conference, Chungcheongnam-do, Republic of Korea, 2–4 July 2019; pp. 451–452. [Google Scholar]
- Lu, R.; Zhu, C.; Tian, L.; Wang, Q. Super-Capacitor Stacks Management System with Dynamic Equalization Techniques. IEEE Trans. Magn. 2006, 43, 254–258. [Google Scholar] [CrossRef]
- Yun, S.-S.; Kee, S.-C. Improved Multilevel Multistage Constant-Current Constant-Voltage Superfast Charging of Multiple Cells. J. Electr. Eng. Technol. 2021, 17, 209–219. [Google Scholar] [CrossRef]


Disclaimer/Publisher’s Note: The statements, opinions and data contained in all publications are solely those of the individual author(s) and contributor(s) and not of MDPI and/or the editor(s). MDPI and/or the editor(s) disclaim responsibility for any injury to people or property resulting from any ideas, methods, instructions or products referred to in the content. |
© 2022 by the authors. Licensee MDPI, Basel, Switzerland. This article is an open access article distributed under the terms and conditions of the Creative Commons Attribution (CC BY) license (https://creativecommons.org/licenses/by/4.0/).