Article

NASICON-Type Li1+xAlxZryTi2−x−y(PO4)3 Solid Electrolytes: Effect of Al, Zr Co-Doping and Synthesis Method

Kurnakov Institute of General and Inorganic Chemistry, Russian Academy of Sciences, Leninsky prospekt 31, Moscow 119991, Russia
*
Author to whom correspondence should be addressed.
Batteries 2023, 9(1), 59; https://doi.org/10.3390/batteries9010059
Submission received: 11 December 2022 / Revised: 12 January 2023 / Accepted: 13 January 2023 / Published: 15 January 2023
(This article belongs to the Special Issue Solid-State Electrolytes for Safe Batteries)

Abstract

:
Replacing liquid electrolytes with solid-state conductors is one of the key challenges to increasing the safety and energy density of next-generation Li secondary batteries. In this work, the NASICON-type Li1+xAlxZryTi2−x−y(PO4)3 with 0 ≤ x, y ≤ 0.2 solid electrolytes were synthesized using solid-state and sol-gel techniques at various sintering temperatures (800, 900, and 1000 °C). Their morphology and conducting properties were studied to determine the optimal dopant content and synthesis method. Li1.2Al0.2Zr0.1Ti1.7(PO4)3 and Li1.1Al0.1Zr0.2Ti1.7(PO4)3 prepared at 900 °C using a solid-state reaction exhibit the highest total conductivity at 25 °C (7.9 × 10⁻⁴ and 5.4 × 10⁻⁴ S cm−1, respectively), which is due to the optimal size of lithium transport channels, as well as the high density of these samples. The potential profile of Li|Li1.2Al0.2Zr0.1Ti1.7(PO4)3|Li cells was retained during cycling at a current density of 0.05 mA cm−2 for 100 h, indicating a high interfacial Li metal/electrolyte stability.

1. Introduction

The modern energy industry focuses on energy efficiency and renewable power sources [1,2,3]. At the same time, the dependence of renewable sources on the weather and their disability to generate power when it is needed requires the simultaneous use of energy storage technologies, among which lithium-ion battery (LIB) storage is the most popular [4,5]. Currently, most commercial LIBs contain liquid electrolytes comprising lithium salts with large anions dissolved in aprotic solvents [6]. However, such systems suffer from safety issues. To overcome these problems, increased attention is given to polymer and solid electrolytes [7,8,9]. All-solid-state batteries (ASSBs) can provide fast charging, higher energy densities, a wide range of operating temperatures, a long cycling life, and operational safety [10].
Sulfides are considered as perspective solid electrolytes, which, due to the higher polarizability of sulfur ions, show an outstanding conductivity at room temperature (up to 10−2 S cm−1) [11,12]. However, they are very hygroscopic and easily hydrolyze to release hydrogen sulfide. The Li7La3Zr2O12-based garnets are promising materials [13,14], but they contain a large proportion of expensive rare elements, have serious problems with air/moisture stability, and are very hard to process.
In this regard, a relatively low-cost NASICON-type (Na Super Ionic CONductor) AxMy(PO4)3 (A represents the mobile Li+, Na+ or K+ ions, M typically represents tetravalent (Zr4+, Ti4+, Ge4+) or trivalent (Fe3+, Cr3+, In3+) cations) that are stable to the moisture and air received particular attention [15,16,17,18,19,20,21]. At room temperature, LiZr2(PO4)3 NASICON-type materials have low-temperature triclinic modifications and show low ionic conductivity. However, their doping by trivalent cations allows for the stabilization of a highly conductive rhombohedral phase already at room temperature [22].
Lithium titanium phosphate also attracted much attention. At room temperature, the ionic conductivity of LiTi2(PO4)3 is relatively low (about 10−7 S cm−1). However, it can be increased by partial substitution of titanium for three- and pentavalent cations [23,24,25], e.g., the conductivity of Li1+xCrxTi2−x(PO4)3 solid solutions approached 10−3 S cm−1 [26]. Since chromium-containing materials can be easily reduced, aluminum doping is even more promising. Li1+xAlxTi2−x(PO4)3 materials are considered promising solid electrolytes for ASSBs [27,28,29,30,31].
In the NASICON-type phosphates LixMy(PO4)3, ionic conductivity is mostly determined by the concentration of mobile carriers–lithium defects. In addition, the mobility of lithium ions is determined by the size of channels for their transport, which in turn is determined by lattice parameters and the radius of the structure-forming tetra- and trivalent elements M. It is, therefore, to be expected that isovalent substitution can also lead to an increase in conductivity by optimizing the size of conducting channels. For example, the isovalent substitution of titanium by zirconium results in an increase in the LiZrxTi2−x(PO4)3 conductivity [32,33].
Co-doping is very promising in some cases, for example, co-doped zirconia materials show the highest conductivity among zirconia-based electrolytes [34] and in garnet-structured electrolytes [35]. From this point of view, the co-doping of NASICON-type electrolytes with iso- and heterovalent cations can be beneficial. However, there are relatively little data on such doping of lithium-conducting NASICONs. Most studies are focused on lithium titanium phosphate co-doped with Ge4+ and Al3+ [36,37,38,39,40]. Zhang et al. synthesized Li1.4Al0.4Ti1.6−xGex(PO4)3 (x = 0–1.0) materials by a sol-gel method at 900 °C. In this system, Li1.4Al0.4Ti1.4Ge0.2(PO4)3 had the highest conductivity of 1.3 × 10⁻³ S cm−1 at 25 °C [39]. The bulk conductivity of Li1+xTi2−x−yAlxGey(PO4)3 (0.2 ≤ x ≤ 0.8, y = 0.8, 1.0) fabricated by solid-state reaction at 950 °C was in the range 2–7 × 10⁻⁴ S cm−1 at 25 °C [40]. Kothari et al. reported the synthesis of Li1.3Al0.3−xGaxTi1.7(PO4)3 system with x = 0.01, 0.03, 0.05, and 0.07, in which the highest conductivity of 3.1 × 10⁻⁶ S cm−1 was observed at 25 °C for the sample with 3 at.% gallium [41]. In the system Li1+x−yAlxNbyTi2−x−y(PO4)3, the highest lithium-ion conductivity of 7.5×10⁻⁴ S cm−1 at 25 °C was found for Li1.3Al0.5Nb0.2Ti1.3(PO4)3 [42]. Wang et al. reported transport and interface properties of Te-doped Li1.3Al0.3Ti1.7(PO4)3 with the highest total ionic conductivity of 7.0 × 10⁻⁴ S cm−1 for Li1.3Al0.3Te0.03Ti1.67(PO4)3 electrolyte [43]. LiTi2(PO4)3 co-doped with zirconium and aluminum is much less investigated. There is only one study of such electrolytes, to the best of our knowledge. Rai et al. prepared Li1.3Al0.3Ti1.7−xZrx(PO4)3 (0 ≤ x ≤ 0.2) via a solid-state reaction at 950 °C, which at 25 °C shows the highest conductivity of 2.3 × 10⁻⁵ S cm−1 when x = 0.1 [44]. Since for Li1+xAlxTi2−x(PO4)3 (LATP), the highest conductivity is achieved for 0.3 ≤ x ≤ 0.4 [45,46], in the case of co-doping of LiTi2(PO4)3 with Zr4+ and Al3+, the greatest effect is expected to be for materials with a small degree of titanium substitution, as at a higher dopant content, defect association plays an important role, resulting in conductivity decrease [47,48]. Thus, the ionic conductivity of NASICON-type solid electrolytes can obviously be improved by changing co-doped elements and their ratio. Moreover, the data reported indicate that more investigations are needed to identify new composition ranges with higher ionic conductivity.
In this work, new Li1+xAlxZryTi2−x−y(PO4)3 electrolytes with an unexplored composition range (0 ≤ x, y ≤ 0.2) were synthesized to determine if the LiTi2(PO4)3 conductivity could be further increased by co-doping and, if so, to identify the composition with the highest conductivity. Since a sol-gel route in some cases allows for the fabricating of solid electrolytes at a reduced temperature and due to this achieving an improvement of morphology and conductivity, to optimize synthesis processes, the samples were synthesized via a solid-state reaction and a sol-gel technique at various sintering temperatures and periods. These synthesis methods were used as the most simple and accessible synthesis methods without scale-up limits. The interfacial stability of the material with the highest conductivity was tested too. The optimization of the composition and synthesis method allows for the production of novel high-conductive Li1+xAlxZryTi2−x−y(PO4)3 (0 ≤ x, y ≤ 0.2) with conductivity up to 7.9 × 10⁻⁴ S cm−1. Moreover, a co-doping strategy with the optimization of the combination and ratio of co-dopants was shown to be useful to further improve the conductivity of solid electrolytes.

2. Materials and Methods

2.1. Material Preparation

Citrate (citric acid-assisted) sol-gel and solid-state reaction techniques were used to prepare Li1+xAlxZryTi2−x−y(PO4)3 (0 ≤ x, y ≤ 0.2) using Li2CO3 (Merck, Rahway, NJ, USA, ACS reagent ≥99.0%); (BuO)4Ti (Alfa Aesar, Haverhill, MA, USA, 98+%) or TiO2 (Chimmed, Moscow, Russia, 98%); (PrO)4Zr (Sigma-Aldrich, St. Louis, MO, USA, 70 wt. %) or zirconium hydrogen phosphate Zr(HPO4)2 (Sigma-Aldrich, St. Louis, MO, USA); Al(NO3)3.9H2O (Sigma-Aldrich, St. Louis, MO, USA, 99.997%) as starting materials. To prevent possible lithium losses during high temperature sintering [49], 5% excess of Li2CO3 was taken in all cases.

2.1.1. Solid-State Synthesis

Stoichiometric amounts of Li2CO3, TiO2, NH4H2PO4, Zr(HPO4)2, and Al(NO3)3.9H2O were ground in an agate mortar, calcined at 500 °C to remove water and ammonia, and subjected to ball-milling in a Fritsch Pulverisette 7 classic line ball mill (agate grinding bowls and balls, ethanol medium) at 400 rpm for 16 h. After drying, prepared precursors were pressed into pellets (mold diameters were 6 and 14 mm for conductivity and electrochemical stability tests, respectively) at 800 MPa and sintered under a layer of the same material in platinum crucibles at 800, 900, and 1000 °C for 5 h. In addition, the precursors of Li1.2Al0.2Zr0.1Ti1.7(PO4)3 and Li1.2Al0.2Zr0.1Ti1.7(PO4)3 samples were sintered at 900 °C for 10 h.

2.1.2. Sol-Gel Method

Stoichiometric amounts of (BuO)4Ti and (PrO)4Zr were dissolved in a mixture of HNO3 and C2H5OH (1:5 v/v ratio) to prevent hydrolysis. Li2CO3, aqueous solutions of Al(NO3)3.9H2O, NH4H2PO4, and citric acid (Chimmed, Moscow, Russia, 99.99%) were added to the prepared solution. Citric acid was used as a chelating agent (the molar ratio of citric acid to all metal ions was 2:1). The obtained solutions were kept at 90 °C for 10 h until a gel formation, then heated at 250 and 500 °C for 5 h. The prepared mixtures were ground in an agate mortar, pressed into pellets, and sintered under a layer of the same material in platinum crucibles at 800 and 900 °C for 5 h. In addition, the Li1.2Al0.2Zr0.1Ti1.7(PO4)3 sample was ball-milled at 400 rpm for 8 h, pressed into pellets, and re-sintered at 900 °C for 10 h.
Further in the text, the sample labels contain the synthesis method “sg” and “ss” represent sol-gel and solid-state methods, respectively), sintering temperature and period, for example, Li1.2Al0.2Zr0.1Ti1.7(PO4)3_ss_900-5h.

2.2. Characterization Techniques

To analyze phase composition, X-ray diffraction (XRD) patterns were recorded at 25 °C using a Rigaku D/MAX 2200 (Cu Kα radiation, the 2 Θ range of 10–65°, a step size of 0.02°). The unit cell parameters were determined using Jana 2006 software [50]. NMR spectra were recorded on a Bruker AV400 on 31P nuclei at 162 MHz with magic angle spinning (MAS, rotation speed 8 kHz) at 25 °C. The chemical shift (δ) was referenced to 85% H3PO4 aqueous solution. To analyze the morphology and element distribution scanning electron microscopy (SEM, Tescan Amber) with EDS was used. The temperature dependence of ionic conductivity of the samples was measured using an Elins Z1500 PRO impedance meter in a frequency range from 10 Hz to 2 × 10⁶ Hz, an AC amplitude of 80 mV. Ag paste was applied to both sides of cylindrical pellets to form an electrical contact (symmetrical Ag|sample|Ag cells). Activation energies of Li+ transfer were calculated from the slopes of Arrhenius conductivity plots in the temperature range of 25–200 °C by linear least square method using Origin8.0 software (OriginLab Corp., Northampton, MA, USA). To describe electronic conductivities of the samples and evaluate the ionic conductivity contribution to the total conductivity of the samples, DC-polarization tests with an applied voltage of 10 mV were performed using an Elins P-40X potentiostat. Since the instability of titanium-containing phosphates with the NASICON structure in contact with Li metal is known, symmetrical Li|sample|Li coin cells (CR2032) were assembled in the purified Ar-filled glovebox to study the interface stabilities of prepared materials against Li. The cells were cycled using an Elins P-20X8 potentiostat at 0.05 mA cm−2.

3. Results and Discussion

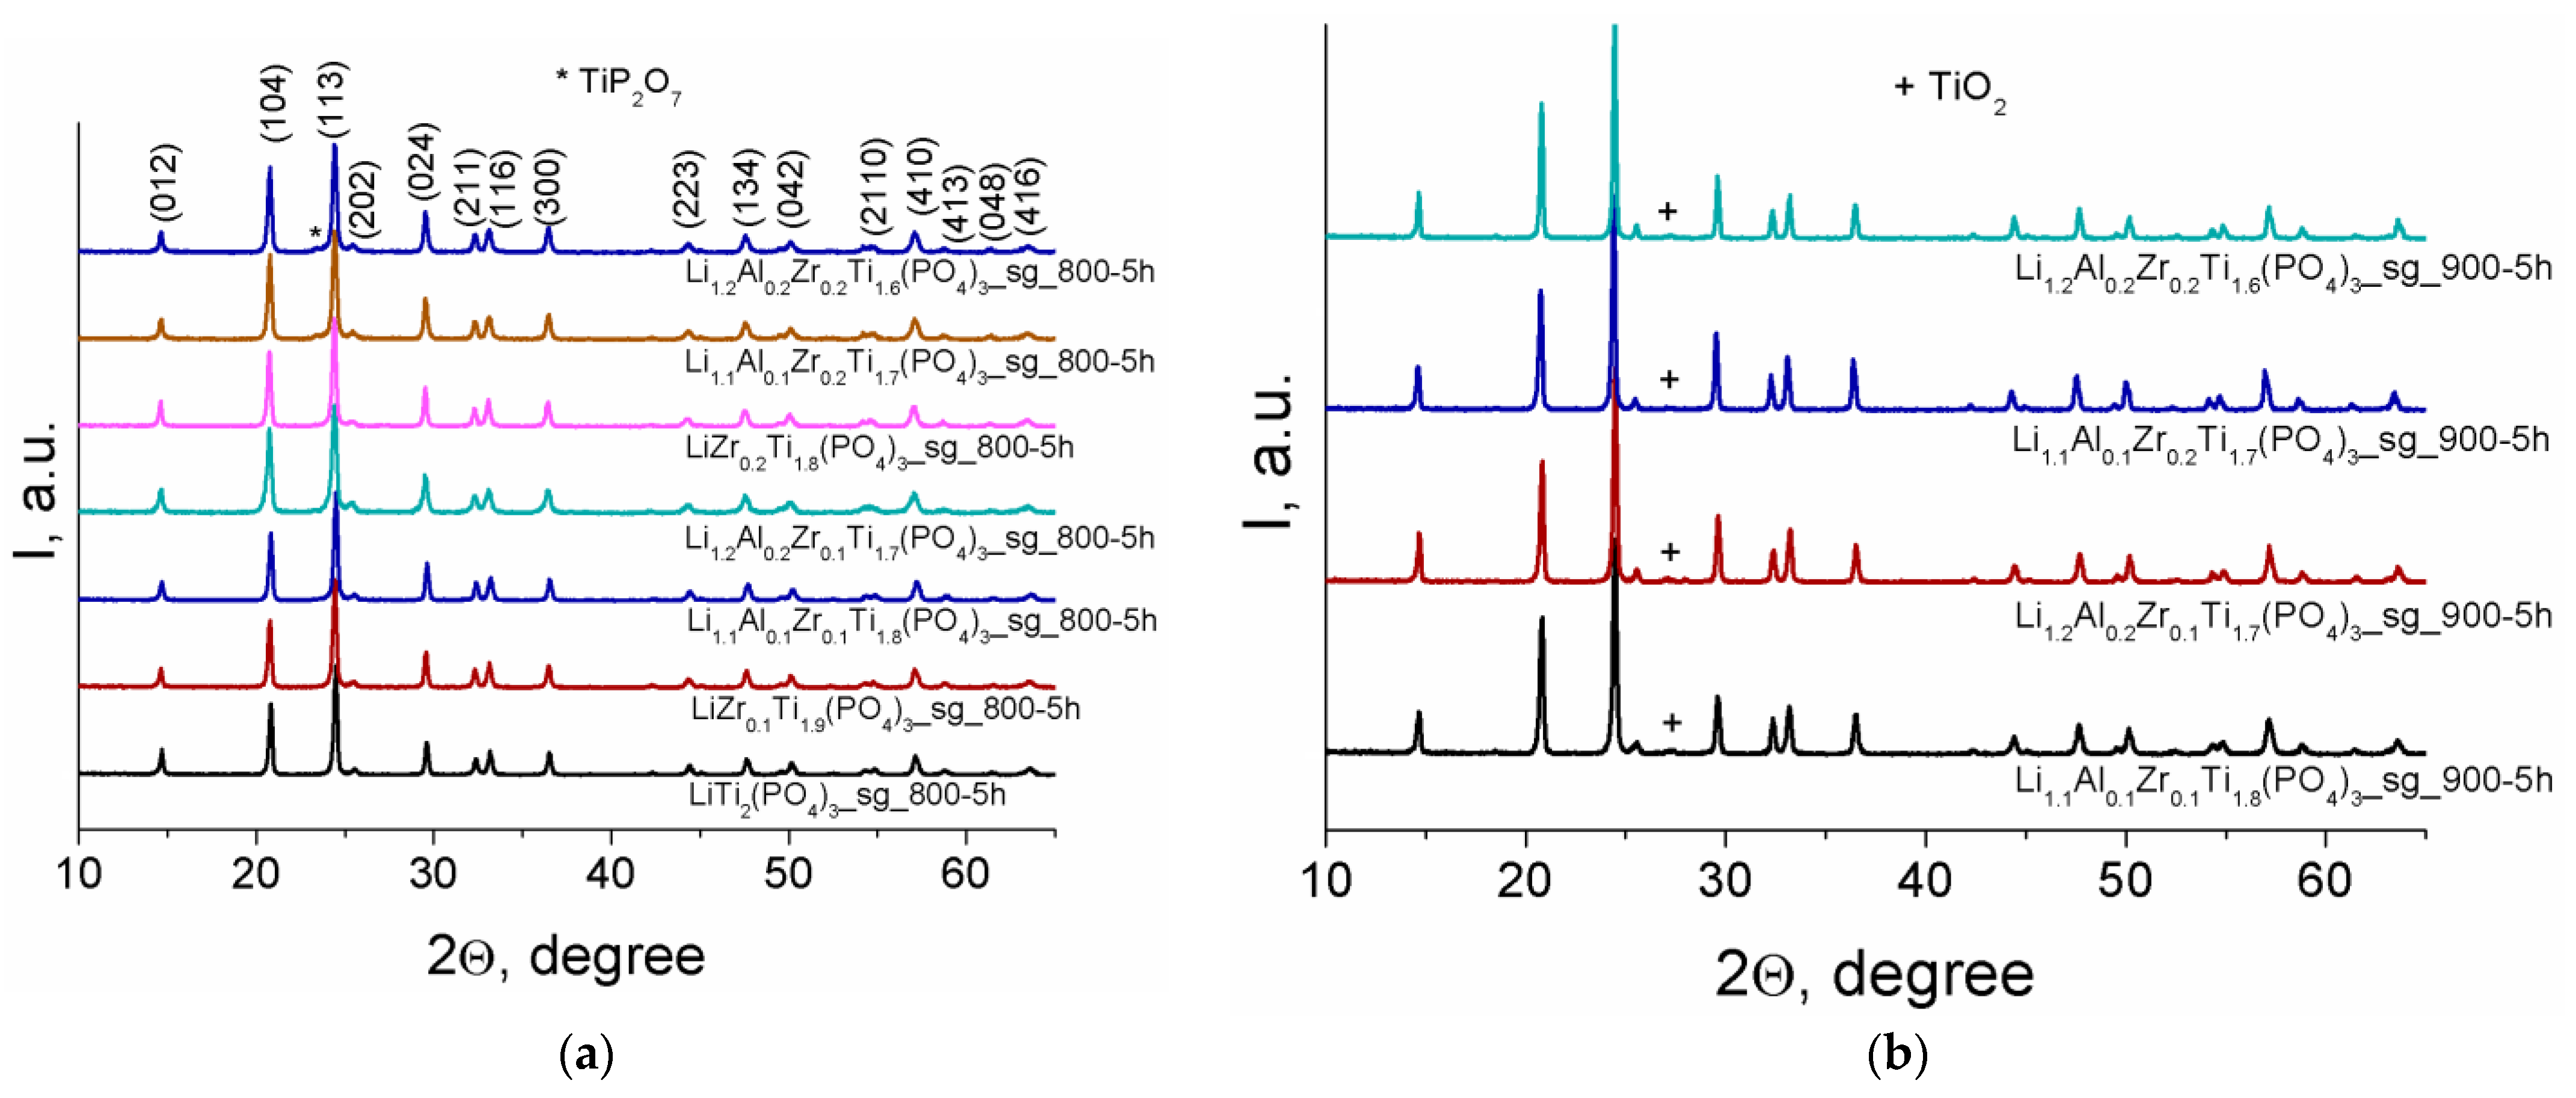
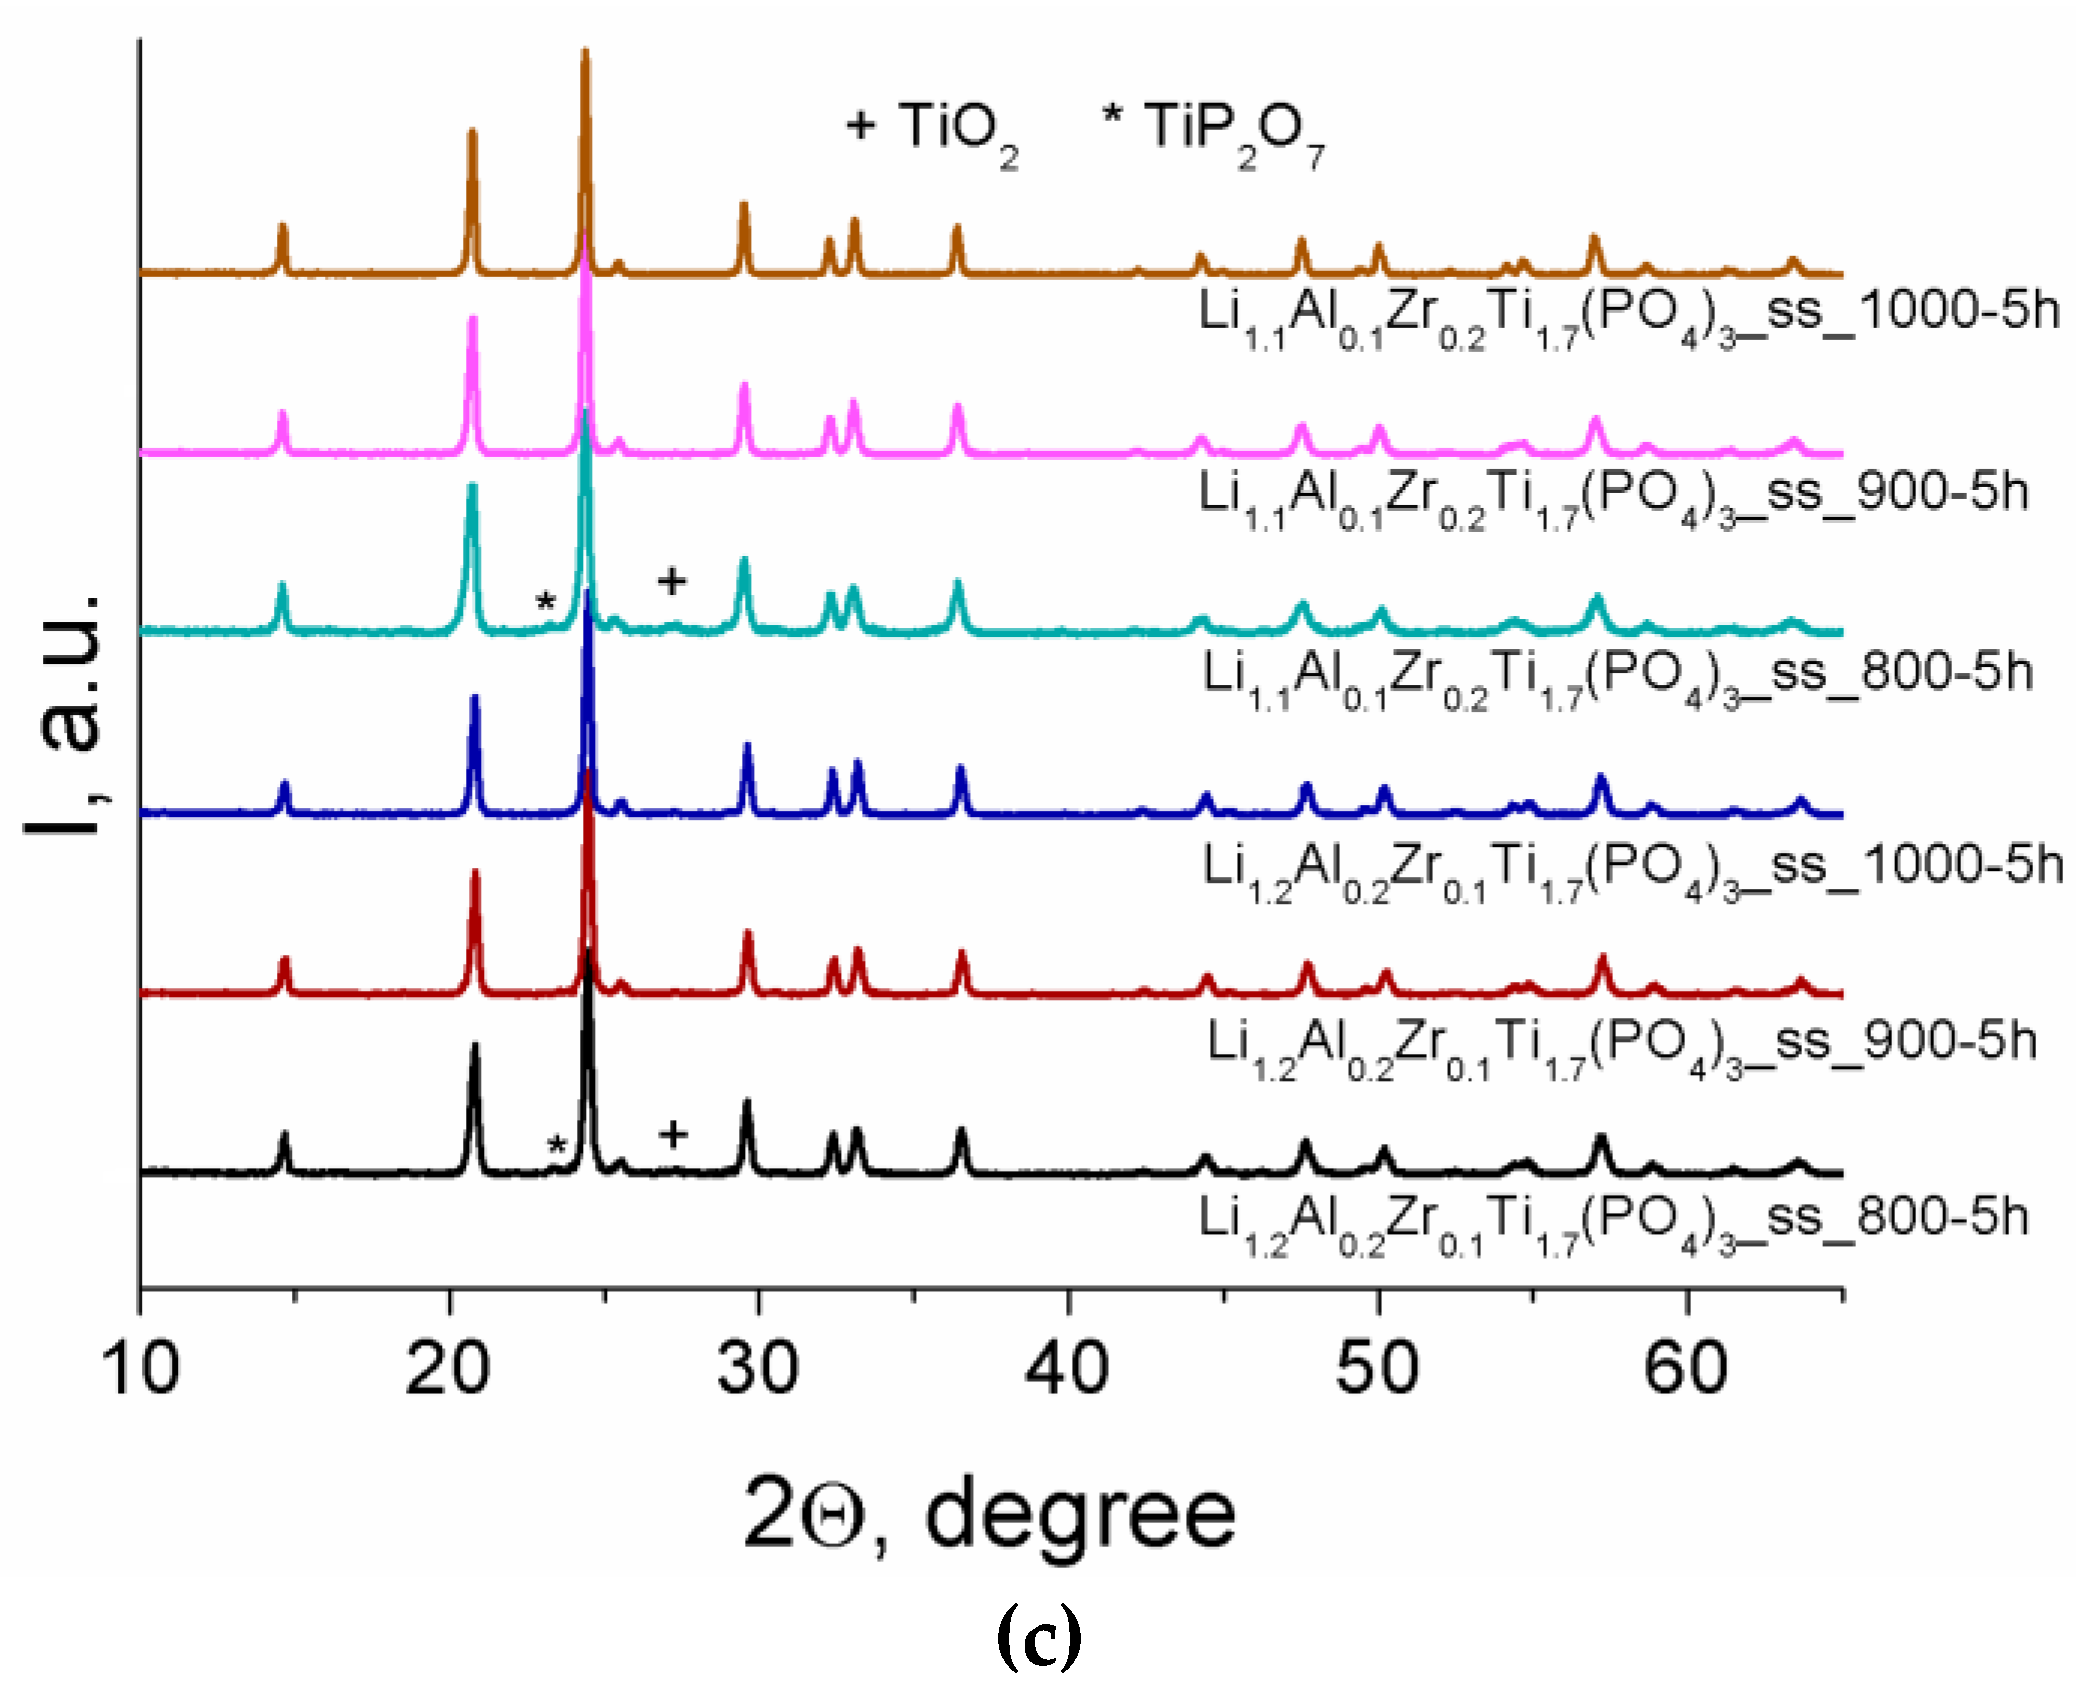
3.1. X-ray Diffraction Analysis
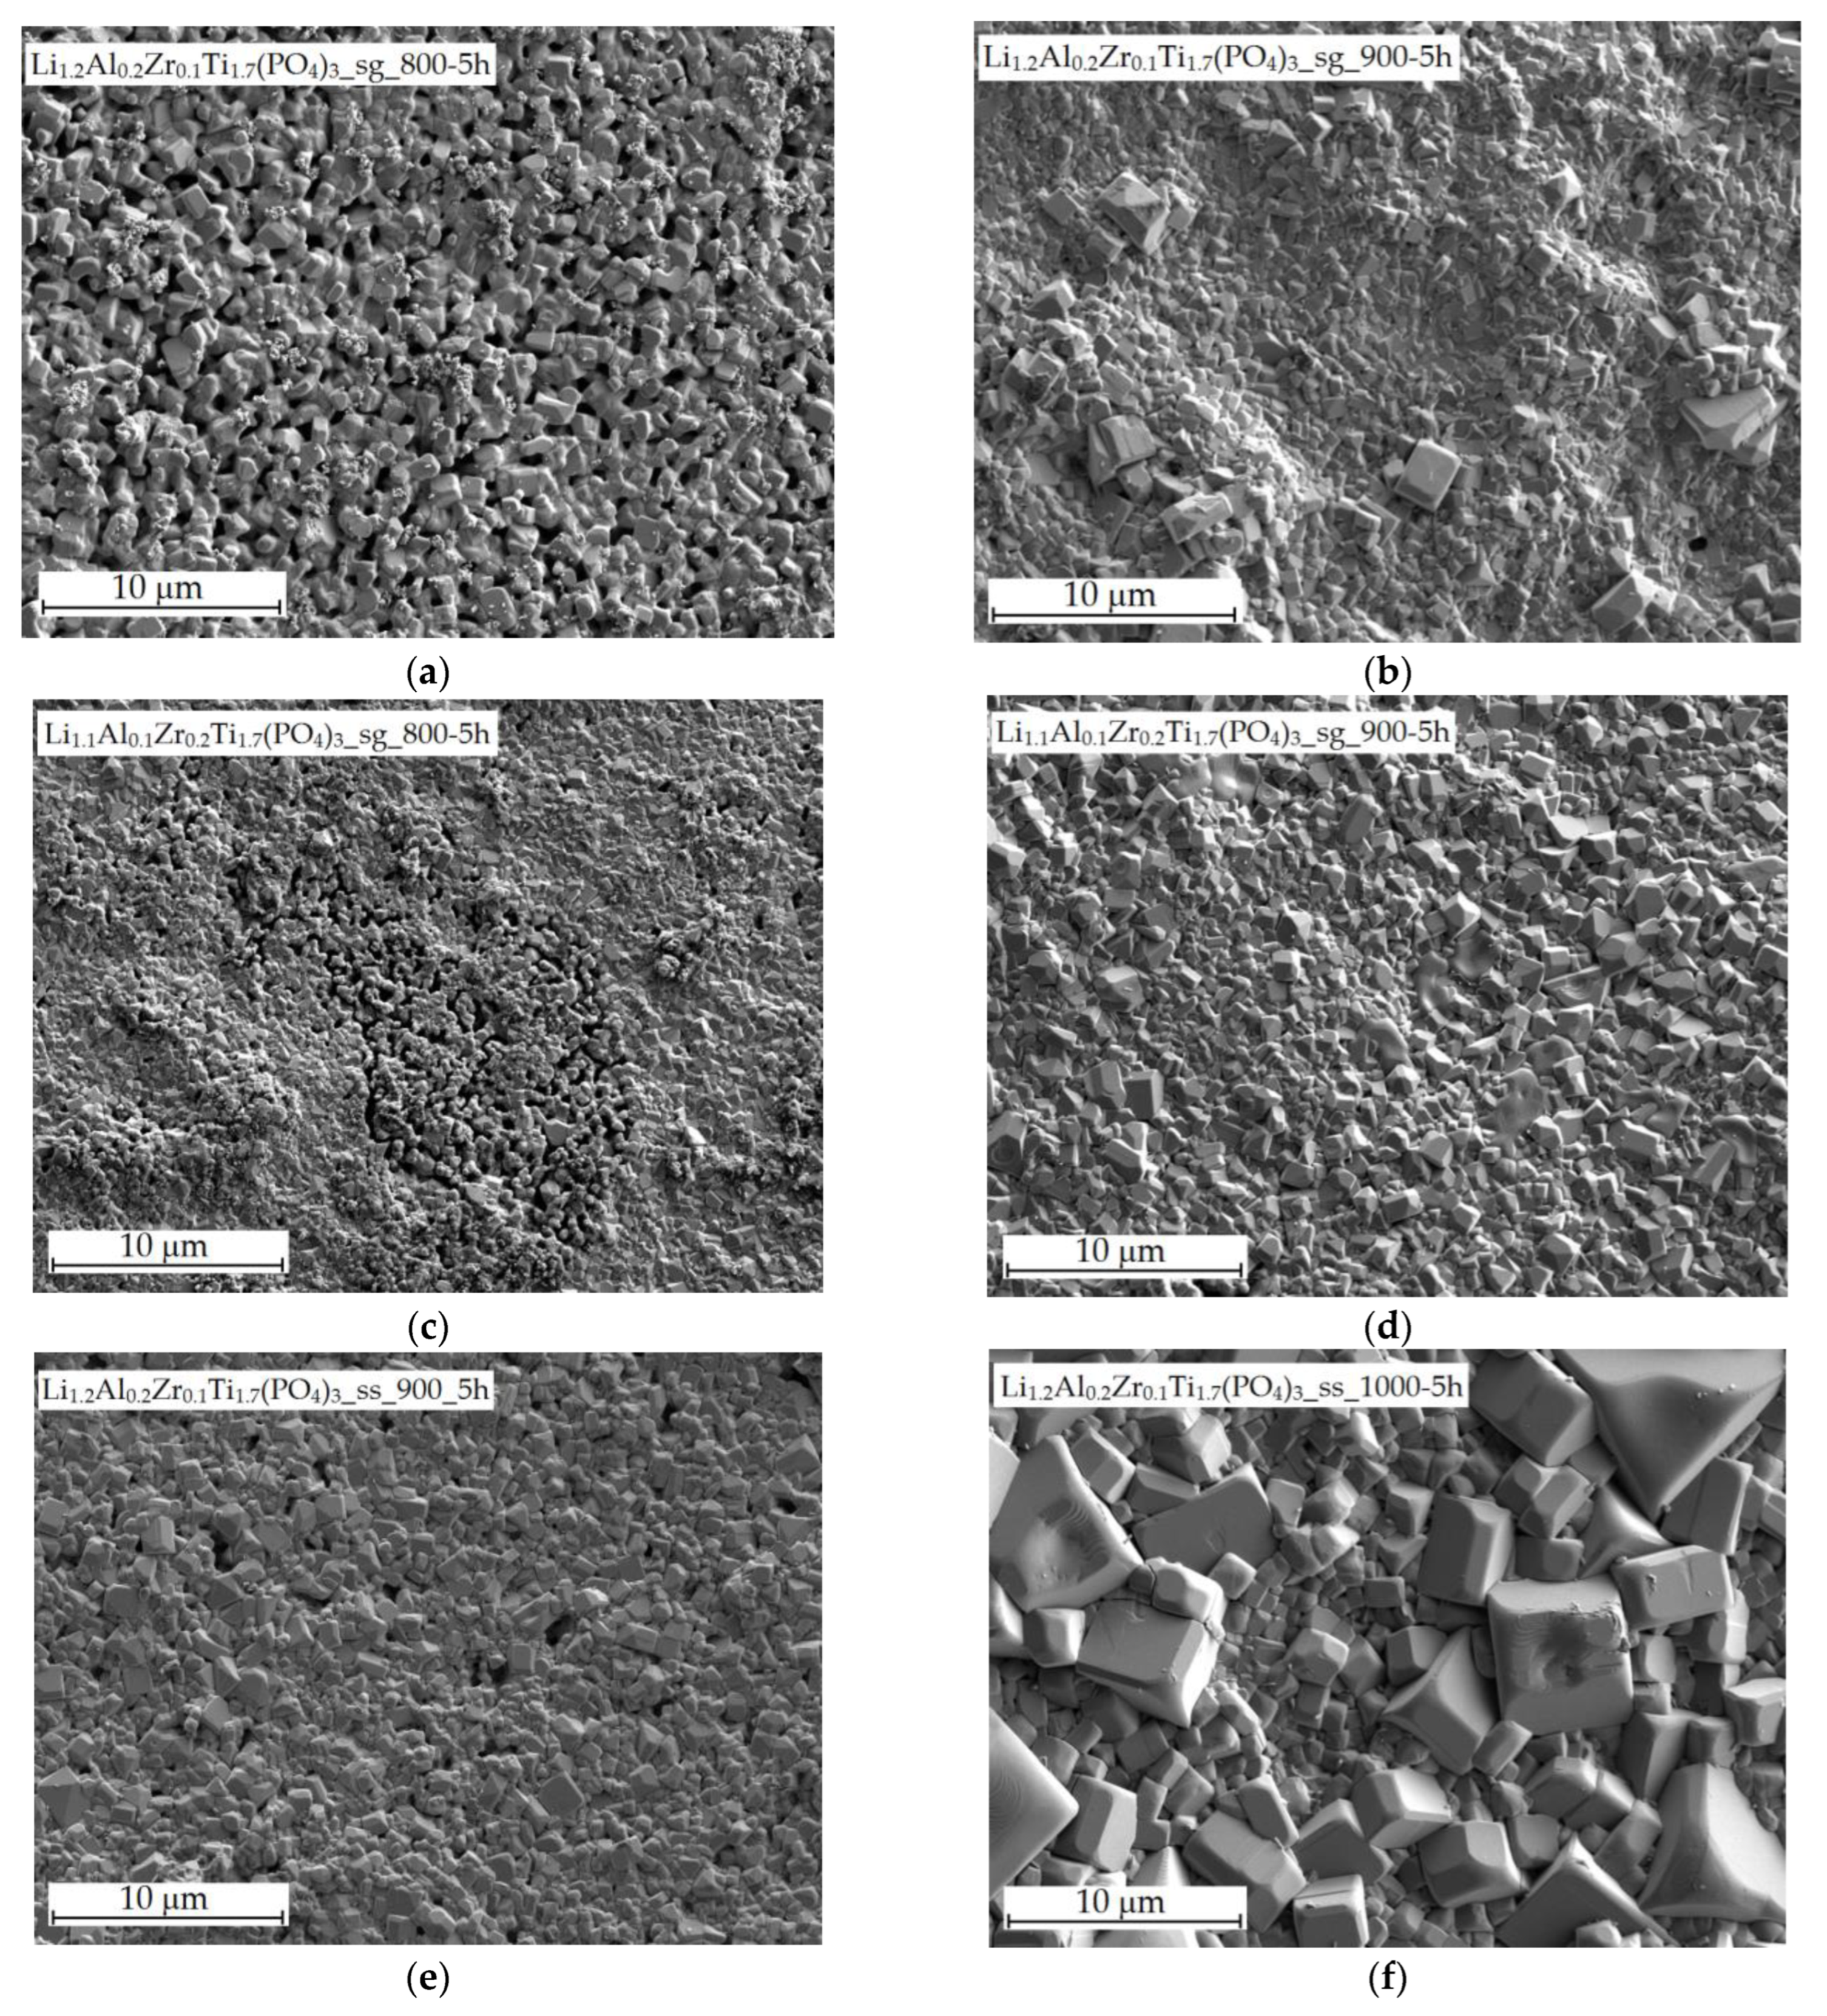
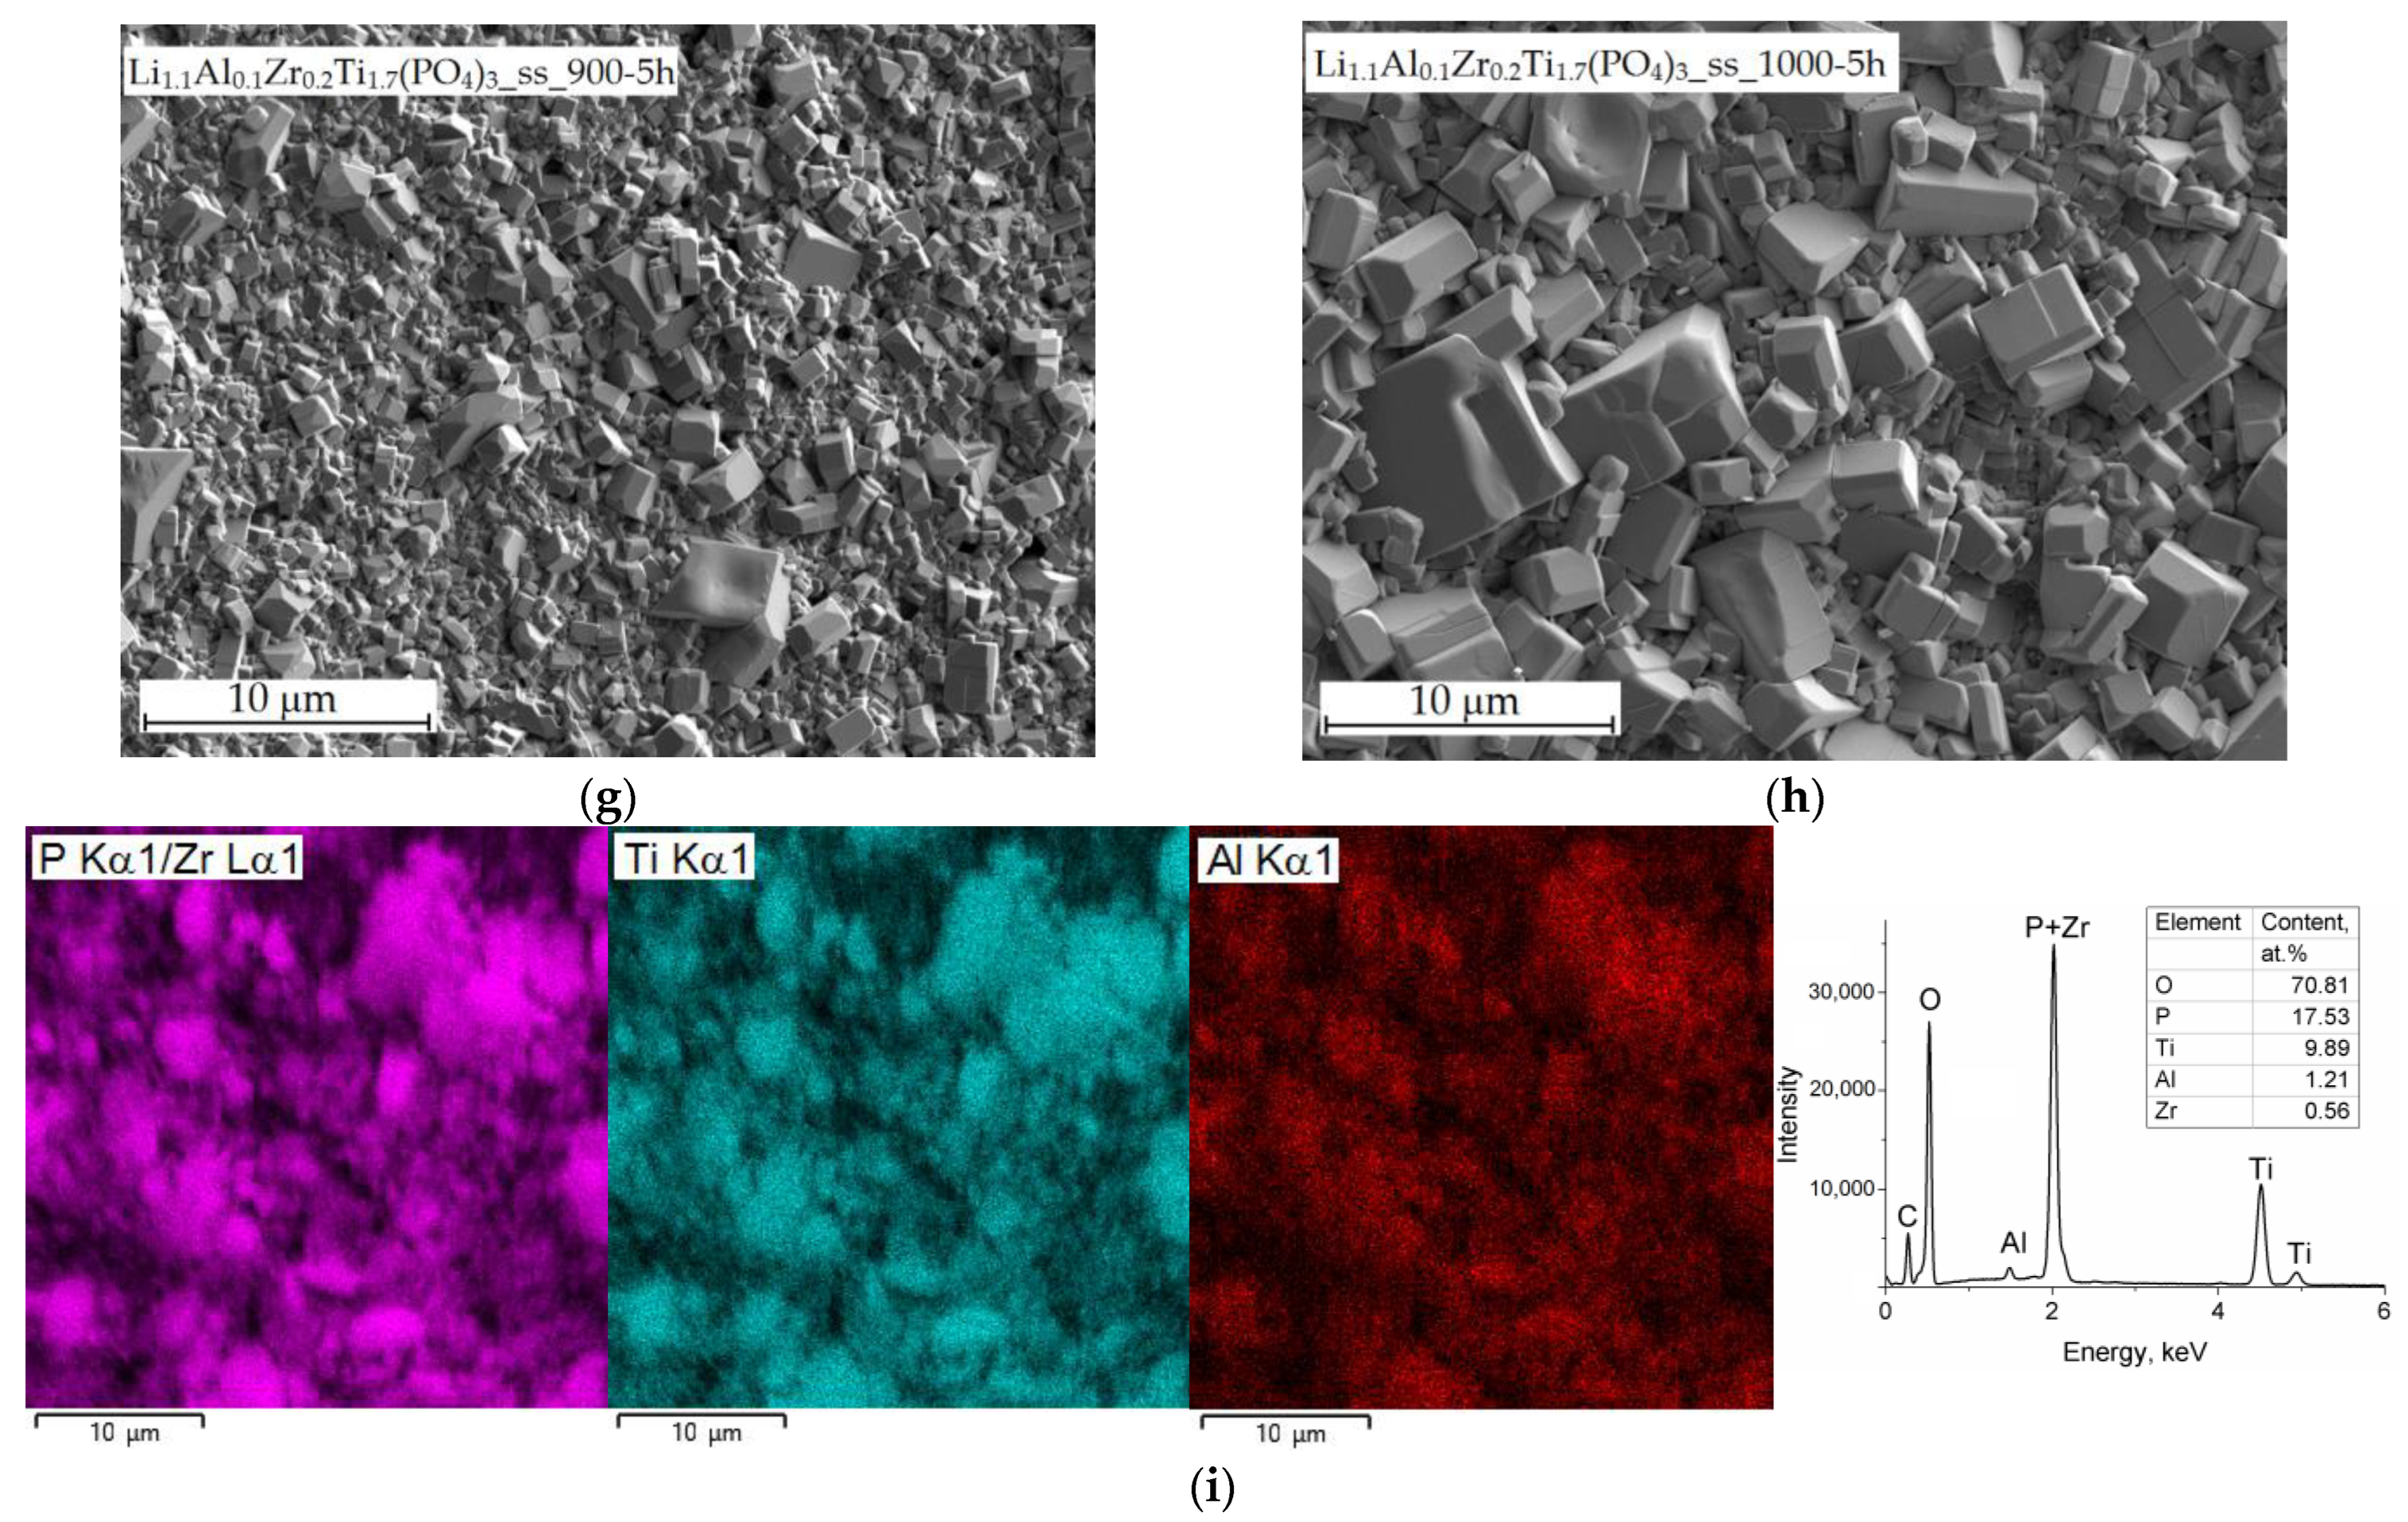
The XRD patterns of Li1+xAlxZryTi2−x−y(PO4)3 (0 ≤ x, y ≤ 0.2) samples prepared by a sol-gel route at a final sintering temperature of 800 °C are shown in Figure 1a. They exhibit reflections of the NASICON structure (LiTi2(PO4)3, card #35-0754 (PDF-2)), space group R-3c. The presence of AlPO4 as an impurity, as reported in refs. [27,51] was not detected in the prepared samples. Only in the case of the Li1.2Al0.2Zr0.2Ti1.6(PO4)3 X-ray diffraction pattern, there were some very weak reflections of titanium pyrophosphate (Figure 1a). With an increase in the sintering temperature to 900 °C, a weak impurity peak appeared at ~27.4°, which was attributed to (110) TiO2 (rutile, card #21-1276 (PDF-2)). Other intense rutile lines at ~36° (101) and 54.3° (211) overlapped with reflections of Li1+xAlxZryTi2−x−y(PO4)3 (Figure 1b).
The samples were prepared via a solid-state reaction at 800 °C and contained a small amount of TiP2O7 and unreacted TiO2 (rutile) (Figure 1c). Single-phase materials were prepared by increasing the sintering temperature up to 900–1000 °C.
The unit cell parameters of LiZryTi2−y(PO4)3 increase with an increasing degree of titanium substitution (Table 1) since the radius of titanium ions (r = 0.61 nm) is noticeably smaller than that of zirconium (r = 0.72 nm). At the same time, the introduction of aluminum ions (r = 0.53 nm) leads to a decrease in the unit cell parameters of Li1+xZryAlxTi2−x−y(PO4)3, despite the introduction of additional lithium ions into interstitials.

3.2. SEM

SEM images of surfaces of the Li1.2Al0.2Zr0.1Ti1.7(PO4)3 and Li1.1Al0.1Zr0.2Ti1.7(PO4)3 samples prepared by a sol-gel route are shown in Figure 2a–d. For Li1.2Al0.2Zr0.1Ti1.7(PO4)3 and Li1.1Al0.1Zr0.2Ti1.7(PO4)3 sintered at 800 °C, most of the grains are about 1 μm in size, although there are smaller grains of ~100 nm, and the samples are rather porous (Figure 2a,c). When the sintering temperature is increased to 900 °C, the formation of more cohesive and larger (up to 3–4 µm) grains can be seen (Figure 2b,d). A similar trend was observed for the samples prepared by solid-state reaction at 900 °C (Figure 2e,f). At the same time, increasing the sintering time from 5 to 10 h does not lead to visible changes in the microstructure of materials (Figure S1a,b). However, further grain growth (up to 2–6 µm) occurs with increasing sintering temperature to 1000 °C (Figure 2f,h). It should be noted that the density of materials increases with the sintering temperature increase. Since there are no phase changes, an increase in density can only be caused by an increase in the sample sintering. For example, the relative density of materials prepared by a sol-gel route at 800 °C is in the range of 77–80% and increases to 86–88% when the sintering temperature is increased to 900 °C. The density of materials prepared by a solid-state reaction is noticeably higher. It is 87–88% for the samples sintered at 800 °C and rises to 89–92% and 93–94% for materials sintered at 900 and 1000 °C, respectively.
According to the data of energy dispersive microanalysis, the distribution of Ti, Al, P(Zr), and O atoms in the prepared samples is uniform and corresponds to the initial stoichiometric compositions (Figure 2i).

3.3. NMR Spectroscopy

NMR spectroscopy provides information on the local environment of atoms in the structure and could confirm the incorporation of zirconium and aluminum ions into the lithium-titanium phosphate structure. In the 31P MAS NMR spectrum of LiTi2(PO4)3, only one resonance line at −27.5 ppm is detected [52,53,54], which can be assigned to the P(OTi)4 phosphorus environment. The 31P MAS NMR spectra of the Li1+xAlxZryTi2−x−y(PO4)3 samples show only one asymmetrically broadened peak with a maximum at δ ≈ −27.7 ppm and a shoulder at more positive values of δ indicating the presence of additional lines (see spectra deconvolution in Figure 3). The intensity of the shoulder increases with the increasing degree of titanium substitution for aluminum and zirconium. The presence of additional lines can be attributed to different local P(O4Ti4−n−mAlnZrm) environments of phosphorus atoms. In accordance with a lower polarizing ability of aluminum and zirconium than that of titanium, the lines corresponding to local P(O4Ti4−n−mAlnZrm) environments are shifted to more positive values compared to δ of a P(OTi)4 phosphorus environment (−27.7 ppm). Since the titanium substitution for Zr and Al has the same effect on chemical shifts, the lines corresponding to the same degree of titanium substitution (n + m) in the P(O4Ti4−(n+m)AlnZrm) phosphorus environment with different n and m values overlap and form weakly resolved shoulders. Their correct decomposition and assignment in the presence of two dopants (Zr and Al), as in the case of 31P MAS NMR spectra of Li1+xAlxZryTi2−x−y(PO4)3, is impossible. Individual components in the 31P MAS NMR spectra of Li1.1Al0.1Zr0.1Ti1.8(PO4)3 and Li1.2Al0.2Zr0.1Ti1.7(PO4)3 can only be determined for P(O4Ti4−(m+n)(Al/Zr)m+n) environments (Table 2).

3.4. Ionic Conductivity

Figure 4 shows the Nyquist plots (−Z″ vs. Z′) of the Li1.2Al0.2Zr0.1Ti1.7(PO4)3 sample at various temperatures. The selected impedance spectra are typical for the materials prepared. A characteristic impedance spectrum consists of a depressed semicircle and a straight line in the high- and low-frequency spectrum regions, respectively. It is worth noting that the semicircle does not come out of the origin. The impedance spectra can be interpreted by the equivalent circuit approach using an equivalent circuit as shown in Figure 4. The straight line is well described by a constant phase element CPE3, corresponding to the accumulation of charge on blocking electrodes. CPE is often used instead of a capacitor due to various reasons (the electrode porosity, rough interfaces between electrodes and ceramic electrolyte, etc.) [45]. Semicircle is related to the grain boundary resistance. It can be described by the parallel connection of a resistor R2 and a constant phase element CPE2. The resistance R1 is determined by the distance between the origin of the axes and the intercept of the semicircle with the Z′ axis at high frequencies and corresponds to the bulk resistance. The low-frequency intercept of the semicircle with the Z′ axis represents the total resistance (Rt). The Rt values were recalculated into the conductivity values using the following equation:
σt = h/(RtS),
where σt represents the total conductivity, and h and S represent the pellet thickness and area, respectively.
Figure 5 shows the temperature dependences of the total conductivity of Li1+xAlxZryTi2−x−y(PO4)3 prepared by a sol-gel route at 800 °C. According to the data obtained, the titanium substitution for Zr leads to a significant increase in the conductivity of LiZryTi2−y(PO4)3 when y = 0.1 (Figure 5a). However, as the zirconium content increases to y = 0.2, the opposite effect is observed, and the conductivity of LiZr0.2Ti1.8(PO4)3 is comparable to that of lithium titanium phosphate (Figure 5b). Similar results were reported by Venkateswara Rao et al. [33]. The co-doping of LiTi2(PO4)3 by zirconium and aluminum results in a significant conductivity increase (Figure 5). The reasons for this may be an increase in the concentration of charge carriers (lithium ions in interstitials) or optimization of the size of lithium transfer channels. A further increase in the aluminum content to x = 0.2 leads to an increase in the Li1+xAlxZr0.1Ti1.9−x(PO4)3 conductivity, while the conductivity of Li1+xAlxZr0.2Ti1.8−x(PO4)3 changes much less. This may be due to low-conductive impurities at interfaces of Li1.2Al0.2Zr0.2Ti1.6(PO4)3 (see XRD data, Figure 1a) or the defect association. The conductivity of LATP (Li1.3Al0.3Ti1.7(PO4)3) prepared by the same procedure is comparable with that for LiZr0.1Ti1.9(PO4)3 and somewhat lower than LiTi2(PO4)3 co-doped with aluminum and zirconium, with the same total degree of substitution (Figure 5a). Based on the data obtained, the compositions Li1.2Al0.2Zr0.1Ti1.7(PO4)3 and Li1.1Al0.1Zr0.2Ti1.7(PO4)3 seem to be the most promising.
An increase in the final sintering temperature to 900 °C leads to a further increase in conductivity of Li1.2Al0.2Zr0.1Ti1.7(PO4)3 up to 1.5 × 10⁻⁴ S cm−1 at 25 °C (Figure 5a). The reason for this is an increase in the sample density (Figure S2) and a decrease in the contribution of the grain boundary resistance due to an increase in the particle size. The activation energies of conductivity are listed in Table 3. The activation energies of the Li1+xAlxZryTi2−x−y(PO4)3 samples vary between 26 and 42 kJ mol−1 without any clear trend.
The samples prepared by the solid-state reaction method exhibit significantly higher conductivities than the samples of the same composition prepared by a sol-gel route (Figure 5 and Figure 6a). The conductivities of materials prepared by a solid-state reaction increase when the sintering temperature is increased from 800 to 900 °C (Figure 6a). At the same time, it was unexpected that materials sintered at 1000 °C exhibited lower conductivities than the samples sintered at 900 °C, despite an increase in their density and grain size. A possible reason for this is the different microstructures of these samples. In the samples sintered at 1000 °C, the number of grains with a size of 5–10 μm significantly exceeded that in the samples sintered at 900 °C (Figure 2e–h). Grain boundaries through which lithium ions should migrate are therefore more disordered in the samples sintered at 1000 °C and, as a result, there may be a poorer interfacial contact between grains. Moreover, the deposition of low-conductive impurities at interfaces can be enhanced due to the acceleration of diffusion processes with increasing temperature. Since, according to XRD data, these impurities do not form a separate phase, their total amount should be small. It can be noted that the formation of X-ray amorphous phases is quite typical for conducting composites. Amorphous materials, firstly oxides, are often introduced to enhance sorption processes at interfaces and, as a result, increase the conductivity [55]. However, in NASICON-type materials, the formation of additional interfaces leads to the opposite effect [56,57,58]. The reason for this is that when a cation moves through the interface between grains with an increased concentration of cations in interstitials, the transfer can be slowed down due to the creation of an electrostatic barrier for moving cations [57]. It should also be noted that an increase in the non-conductive additive concentration, as in this case, leads to a maximum on the dependence of conductivity on concentration [57,58].
For use in ASSBs, solid electrolytes are required to have an ionic conductivity of about 10−3–10−4 S cm−1 and form dense structures with good mechanical strength. According to the results obtained, the synthesis of electrolytes by a solid-state reaction with sintering at 900 °C can be considered the most suitable. To further improve contacts between grains and optimize the conductivity of samples, the sintering time was increased from 5 to 10 h. However, this led to a slight increase in the conductivities of the Li1.2Al0.2Zr0.1Ti1.7(PO4)3_ss_900 and Li1.1Al0.1Zr0.2Ti1.7(PO4)3_ss900 samples from 6.5 × 10⁻⁴ to 7.9 × 10⁻⁴ S cm−1 and from 4.5 × 10⁻⁴ to 5.4 × 10⁻⁴ S cm−1, respectively (Figure 6b). At room temperature, the total ionic conductivity of Li1.2Al0.2Zr0.1Ti1.7(PO4)3_ss_900-10h was found to be higher than that reported for Li1.3Al0.3Zr0.1Ti1.6(PO4)3 (2.3 × 10⁻⁵ S cm−1) [44].
Since the grain sizes of materials prepared by a sol-gel route and a solid-state reaction method are close, it can be assumed that a lower conductivity of the samples prepared by a sol-gel route is determined by their lower density. To increase the density of pellets, the samples prepared by a sol-gel route at 800 °C were ball-milled, again pressed into pellets, and sintered at 900 °C for 10 h. Despite the fact that the surface microstructure of Li1.2Al0.2Zr0.1Ti1.7(PO4)3_sg_900-10h remained practically unchanged if compared to Li1.2Al0.2Zr0.1Ti1.7(PO4)3_sg_900-5h (Figure 2b and Figure S1c), its conductivity approaches the conductivity of materials prepared by a solid-state reaction.

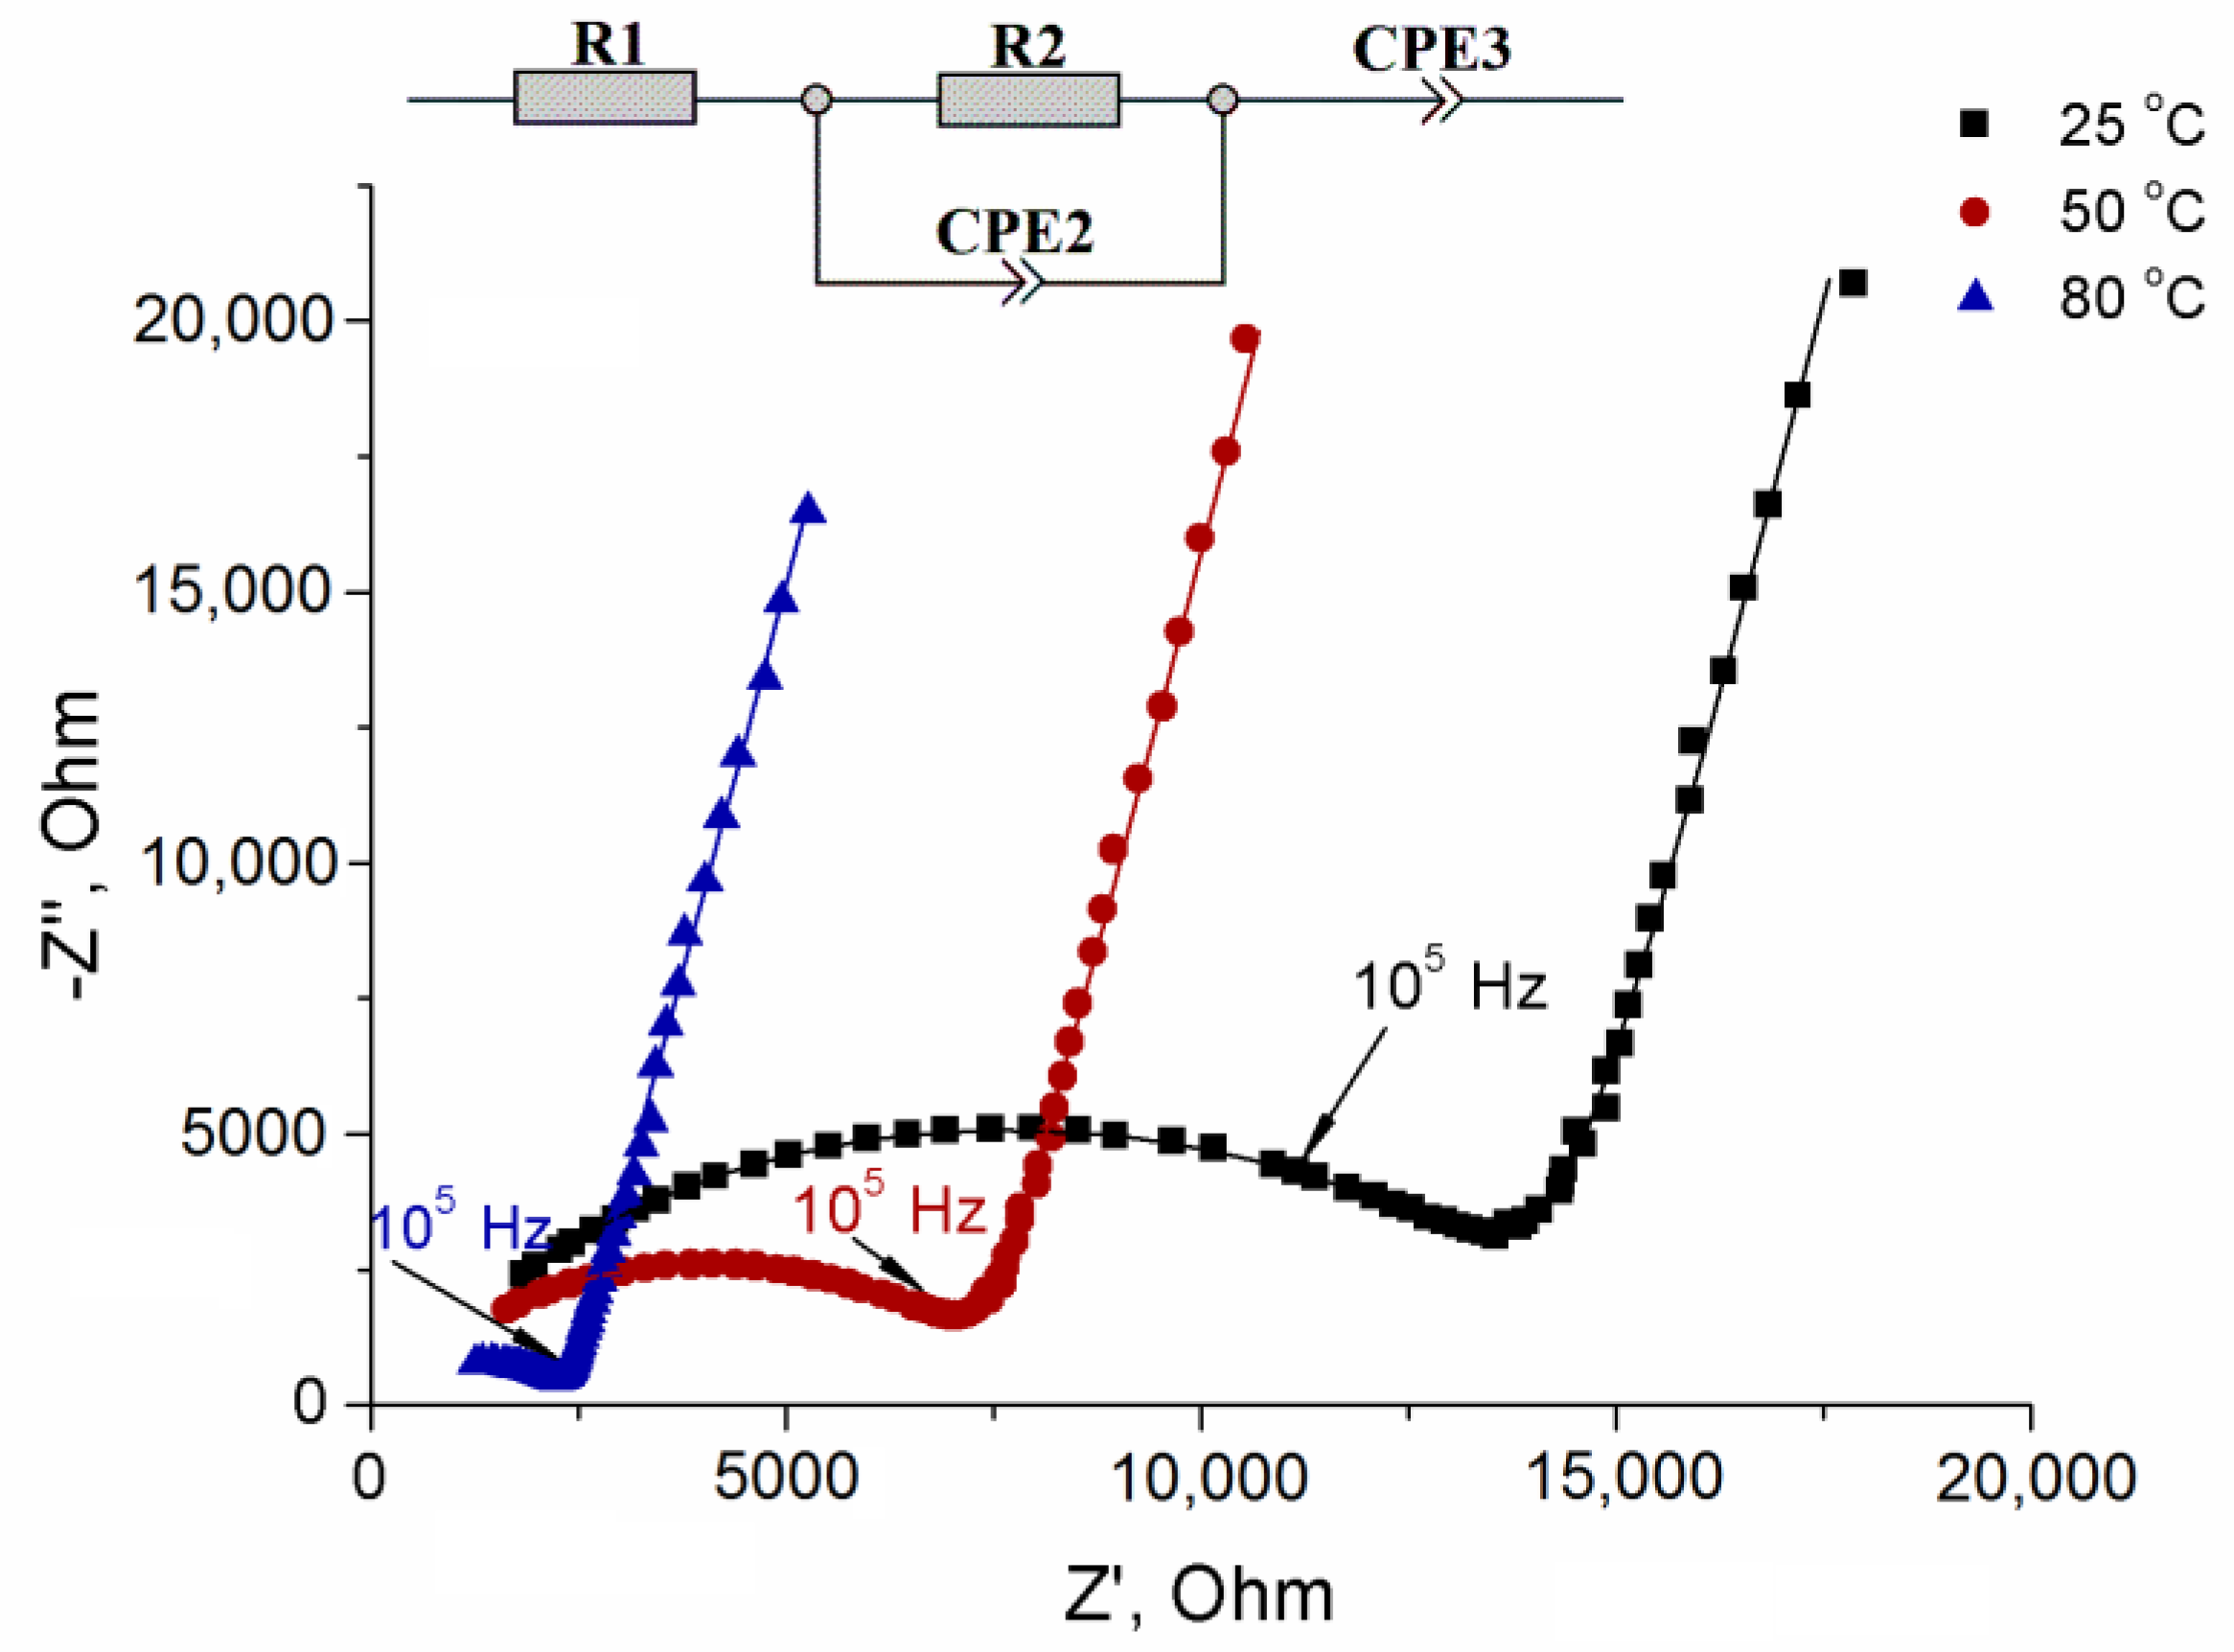
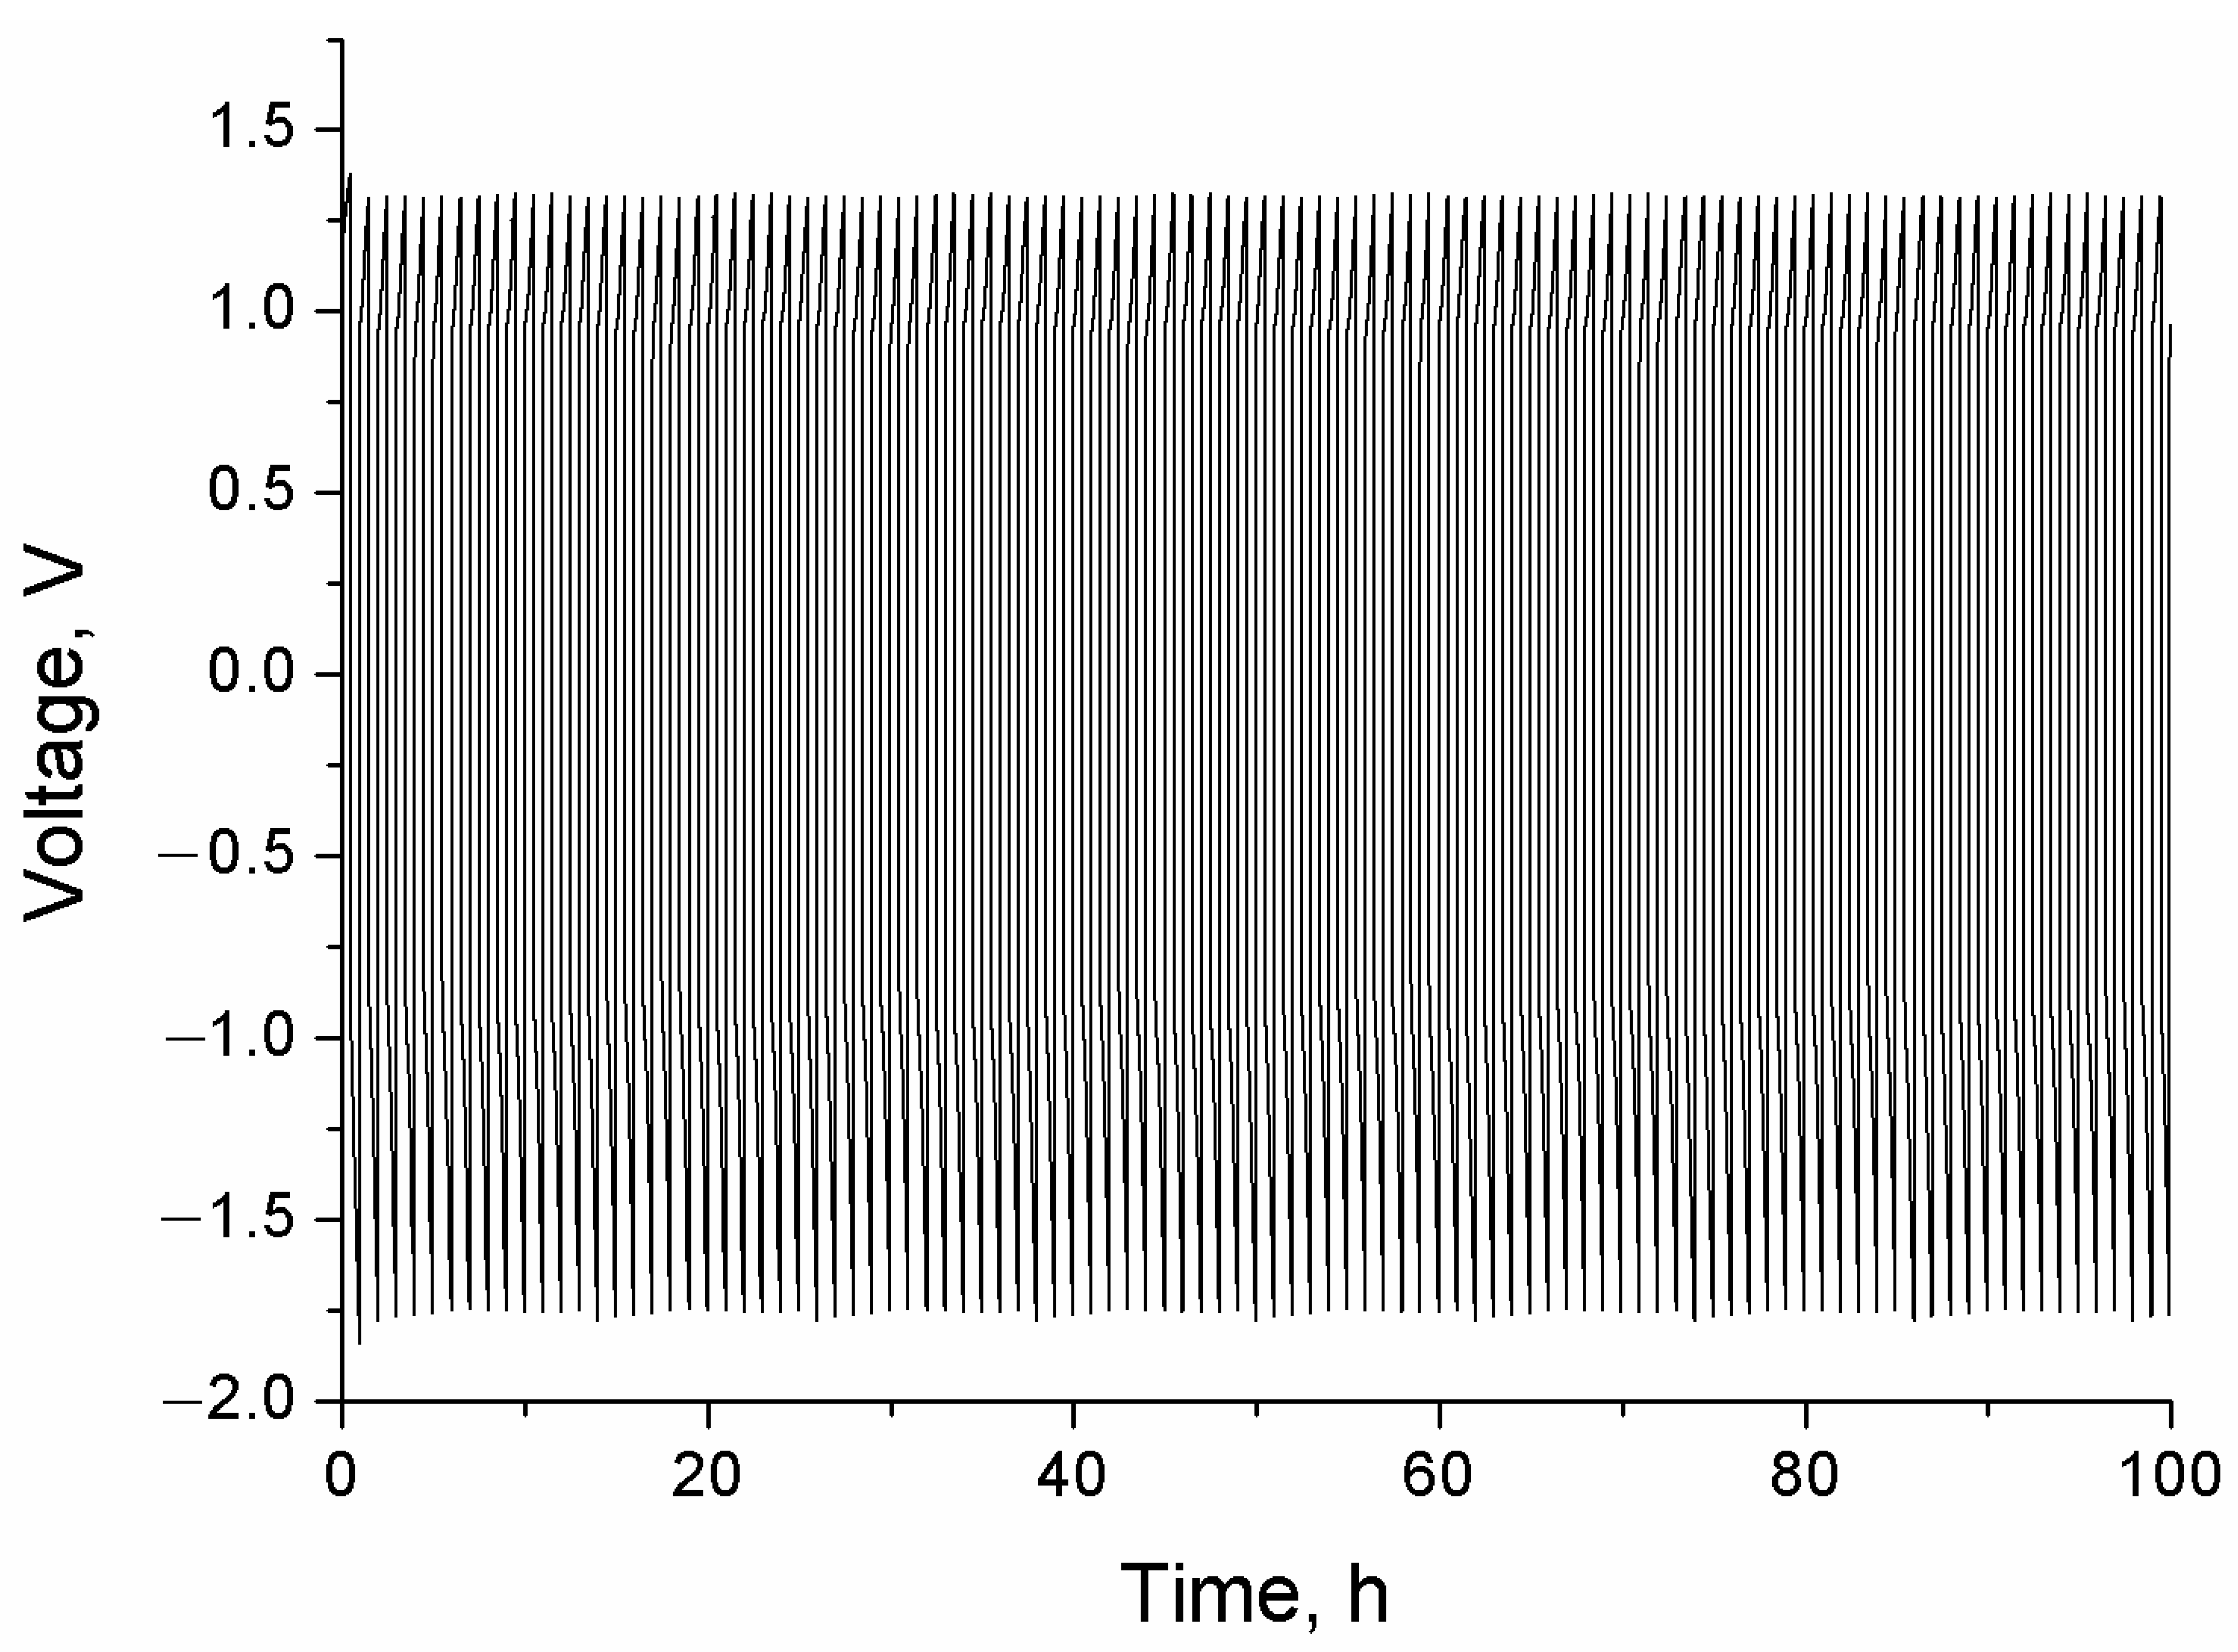
3.5. Transfer Number and Electrolyte Stability

The contribution of the electronic component to the total Li1.2Al0.2Zr0.1Ti1.7(PO4)3 conductivity was determined using a potentostatic polarization method. Figure S3 shows the current curve at a polarizing voltage of 10 mV. The initial current (I0) sharply decreases with time, reaching a stationary value of 9 × 10⁻¹¹ A. The final (steady-state) current (Iss) is due to moving electron holes since Li+ ions are blocked by the silver (blocking) electrodes. corresponding to the electronic conductivity of 3.98 × 10⁻⁹ S cm−1. The transfer number for lithium ions (nLi+) in Li1.2Al0.2Zr0.1Ti1.7(PO4)3, calculated by Equation (2), is 0.999.
nLi+ = 1 − Iss/I0,
To study the electrochemical stability of Li1.2Al0.2Zr0.1Ti1.7(PO4)3_ss_900 against Li, galvanostatic cycling of a symmetrical Li|Li1.2Al0.2Zr0.1Ti1.7(PO4)3_ss_900-10h|Li cell was performed at a current density of 0.05 mA cm−2. The cell potential profile practically does not change during 100 h of cycling (Figure 7), which indicates the stability of the electrolyte against lithium and the absence of pronounced growth of dendrites. This stability is determined by kinetic factors [59]; however, this shows the possibility of using these electrolytes in lithium metal batteries.

4. Conclusions

In this work, novel Li1+xAlxZryTi2−x−y(PO4)3 (0 ≤ x, y ≤ 0.2) electrolytes with a high lithium conductivity were prepared by a sol-gel and solid-state synthesis. The co-doping of LiTi2(PO4)3 with zirconium and aluminum at low degrees of titanium substitution leads to an enhancement of ionic conductivity. The optimal conditions for the synthesis of Li1+xAlxZryTi2−x−y(PO4)3 electrolytes with high conductivity were determined. At room temperature, Li1.2Al0.2Zr0.1Ti1.7(PO4)3 prepared by a solid-state reaction with sintering at 900 °C for 10 h exhibits the highest ionic conductivity of 7.9 × 10⁻⁴ S cm−1. The potential profile of the Li|Li1.2Al0.2Zr0.1Ti1.7(PO4)3|Li cell practically does not change during 100 h of galvanostatic cycling indicating its high stability against lithium. These results suggest that Li1.2Al0.2Zr0.1Ti1.7(PO4)3 material is a promising solid electrolyte for lithium metal batteries. This research proves that the co-doping strategy is beneficial to design solid electrolytes with high conductivity for their use in ASSBs.

Supplementary Materials

The following supporting information can be downloaded at: https://www.mdpi.com/article/10.3390/batteries9010059/s1, Figure S1: SEM images of surfaces of Li1.2Al0.2Zr0.1Ti1.7(PO4)3_ss_900-10h (a), Li1.1Al0.1Zr0.2Ti1.7(PO4)3_ss_900-10h (b), Li1.2Al0.2Zr0.1Ti1.7(PO4)3_sg_900-10h (c).; Figure S2. The dependence of the total conductivity at 25 °C on relative density for the Li1+xAlxZryTi2−x−y(PO4)3 (0 ≤ x, y ≤ 0.2) samples.; Figure S3: The dependence of polarization current on time for the Li1.2Al0.2Zr0.1Ti1.7(PO4)3_ss_900-10h sample.

Author Contributions

Conceptualization, I.S. and A.Y.; methodology, I.S.; validation, I.S., A.P. and A.Y.; formal analysis, A.P.; investigation, A.P. and I.S.; data curation, I.S. and A.Y.; writing—original draft preparation, A.P. and I.S.; writing—review and editing, I.S. and A.Y.; supervision, A.Y.; project administration, A.Y.; funding acquisition, A.Y. All authors have read and agreed to the published version of the manuscript.

Funding

This work was supported by the Ministry of Science and Higher Education of the Russian Federation as part of the State Assignment of the Kurnakov Institute of General and Inorganic Chemistry of the Russian Academy of Sciences.

Institutional Review Board Statement

Not applicable.

Informed Consent Statement

Not applicable.

Data Availability Statement

The data presented in this study are available upon request from the corresponding author.

Acknowledgments

This research was performed using the equipment of the JRC PMR IGIC RAS.

Conflicts of Interest

The authors declare no conflict of interest.

References

  1. Jurasz, J.; Canales, F.A.; Kies, A.; Guezgouz, M.; Beluco, A. A review on the complementarity of renewable energy sources: Concept, metrics, application and future research directions. Solar Energy 2020, 195, 703–724. [Google Scholar] [CrossRef]
  2. Gareiou, Z.; Drimili, E.; Zervas, E. Public acceptance of renewable energy sources. In Low Carbon Energy Technologies in Sustainable Energy Systems; Kyriakopoulos, G.L., Ed.; Academic Press: London, UK, 2021; pp. 309–327. [Google Scholar]
  3. Stenina, I.A.; Yaroslavtsev, A.B. Current progress in membranes for fuel cells and reverse electrodialysis. Mendeleev Commun. 2021, 31, 423–432. [Google Scholar] [CrossRef]
  4. Yaroslavtsev, A.B.; Stenina, I.A.; Golubenko, D.V. Membrane materials for energy production and storage. Pure Appl. Chem. 2020, 92, 1147–1157. [Google Scholar] [CrossRef]
  5. Chen, Y.; Kang, Y.; Zhao, Y.; Wang, L.; Liu, J.; Li, Y.; Liang, Z.; He, X.; Li, X.; Tavajohi, N.; et al. A review of lithium-ion battery safety concerns: The issues, strategies, and testing standards. J. Energy Chem. 2021, 59, 83–99. [Google Scholar] [CrossRef]
  6. Bushkova, O.V.; Yaroslavtseva, T.V.; Dobrovolsky, Y.A. New lithium salts in electrolytes for lithium-ion batteries (Review). Russ. J. Electrochem. 2017, 53, 677–699. [Google Scholar] [CrossRef]
  7. Hou, W.; Guo, X.; Shen, X.; Amine, K.; Lu, J. Solid electrolytes and interfaces in all-solid-state sodium batteries: Progress and perspective. Nano Energy 2018, 52, 279–291. [Google Scholar] [CrossRef]
  8. Fan, L.; Wei, S.; Li, S.; Li, Q.; Lu, Y. Recent progress of the solid-state electrolytes for high-energy metal-based batteries. Adv. Energy Mater 2018, 8, 1702657. [Google Scholar] [CrossRef]
  9. Wang, L.; Li, J.; Lu, G.; Li, W.; Tao, Q.; Shi, C.; Jin, H.; Chen, G.; Wang, S. Fundamentals of Electrolytes for Solid-State Batteries: Challenges and Perspectives. Front. Mater. 2020, 7, A111–A1115. [Google Scholar] [CrossRef]
  10. Braga, M.H.; Subramaniyam, C.; Murchison, A.J.; Goodenough, J.B. Extraordinary Dielectric Properties at Heterojunctions of Amorphous Ferroelectrics. J. Am. Chem. Soc. 2018, 140, 6343–6352. [Google Scholar] [CrossRef]
  11. Seino, Y.; Ota, T.; Takada, K.; Hayashic, A.; Tatsumisago, M. A sulphide lithium super ion conductor is superior to liquid ion conductors for use in rechargeable batteries. Energy Environ. Sci. 2014, 7, 627–631. [Google Scholar] [CrossRef]
  12. Wang, C.; Liang, J.; Zhao, Y.; Zheng, M.; Li, X.; Sun, X. All-solid-state lithium batteries enabled by sulfide electrolytes: From fundamental research to practical engineering design. Energy Environ. Sci. 2021, 14, 2577–2619. [Google Scholar] [CrossRef]
  13. Sastre, J.; Priebe, A.; Döbeli, M.; Michler, J.; Tiwari, A.N.; Romanyuk, Y.E. Lithium Garnet Li7La3Zr2O12 Electrolyte for All-Solid-State Batteries: Closing the Gap between Bulk and Thin Film Li-Ion Conductivities. Adv. Mater. Interfaces 2020, 7, 2000425. [Google Scholar] [CrossRef]
  14. Huang, J.; Liang, F.; Hou, M.; Zhang, Y.; Chen, K.; Xue, D. Garnet-type solid-state electrolytes and interfaces in all-solid-state lithium batteries: Progress and perspective. Appl. Mater. Today 2020, 20, 100750. [Google Scholar] [CrossRef]
  15. Zheng, F.; Kotobuki, M.; Song, S.; Lai, M.O.; Lu, L. Review on solid electrolytes for all-solid-state lithium-ion batteries. J. Power Sources 2018, 389, 198–213. [Google Scholar] [CrossRef]
  16. Lu, Y.; Li, L.; Zhang, Q.; Niu, Z.; Chen, J. Electrolyte and Interface Engineering for Solid-State Sodium Batteries. Joule 2018, 2, 1747–1770. [Google Scholar] [CrossRef] [Green Version]
  17. Vizgalov, V.A.; Yashina, L.V.; Itkis, D.M.; Nestler, T.; Vyalikh, A.; Bobrikov, I.A.; Ivankov, O.I.; Petrenko, V.; Avdeev, M.V. The role of glass crystallization processes in preparation of high Li-conductive NASICON-type ceramics. CrystEngComm 2019, 21, 3106–3115. [Google Scholar] [CrossRef]
  18. Rossbach, A.; Tietz, F.; Grieshammer, S. Structural and transport properties of lithium-conducting NASICON materials. J. Power Sources 2018, 391, 1–9. [Google Scholar] [CrossRef]
  19. Dias, J.A.; Santagneli, S.H.; Messaddeq, Y. Methods for Lithium Ion NASICON Preparation: From Solid-State Synthesis to Highly Conductive Glass-Ceramics. J. Phys. Chem. C 2020, 124, 26518. [Google Scholar] [CrossRef]
  20. Lu, Y.; Hu, E.; Yousaf, M.; Ma, L.; Wang, J.; Wang, F.; Lund, P. NASICON-Type Lithium-Ion Conductor Materials with High Proton Conductivity Enabled by Lithium Vacancies. Energy Fuels 2022, 36, 15154–15164. [Google Scholar] [CrossRef]
  21. Tolganbek, N.; Serikkazyyeva, A.; Kalybekkyzy, S.; Sarsembina, M.; Kanamura, K.; Bakenov, Z.; Mentbayeva, A. Interface modification of NASICON-type Li-ion conducting ceramic electrolytes: A critical evaluation. Mater. Adv. 2022, 3, 3055–3069. [Google Scholar] [CrossRef]
  22. Xu, H.; Wang, S.; Wilson, H.; Zhao, F.; Manthiram, A. Y-Doped NASICON-Type LiZr2(PO4)3 Solid Electrolytes for Lithium-Metal Batteries. Chem. Mater. 2017, 29, 7206–7212. [Google Scholar] [CrossRef]
  23. Kahlaoui, R.; Arbi, K.; Jimenez, R.; Sobrados, I.; Sanz, J.; Ternane, R. Distribution and mobility of lithium in NASICON-type Li1-xTi2-xNbx(PO4)3 (0 ≤ x ≤ 0.5) compounds. Mater. Res. Bull. 2018, 101, 146–154. [Google Scholar] [CrossRef]
  24. Kothari, D.H.; Kanchan, D.K. Inter-grain Li+ conduction in Sc and Y doped LATP compounds. Phys. B: Condens. Matter. 2022, 627, 413599. [Google Scholar] [CrossRef]
  25. Marcinek, M.; Syzdek, J.; Marczewski, M.; Piszcz, M.; Niedzicki, L.; Kalita, M.; Plewa-Marczewska, A.; Bitner, A.; Wieczorek, P.; Trzeciak, T.; et al. Electrolytes for Li-ion transport—Review. Solid State Ionics 2015, 276, 107–126. [Google Scholar] [CrossRef]
  26. Zhang, P.; Wang, H.; Si, Q.; Matsui, M.; Takeda, Y.; Yamamoto, O.; Imanishi, N. High lithium ion conductivity solid electrolyte of chromium and aluminum co-doped NASICON-type LiTi2(PO4)3. Solid State Ionics 2015, 272, 101–106. [Google Scholar] [CrossRef] [Green Version]
  27. Yi, E.-J.; Yoon, K.-Y.; Jung, H.-A.; Nakayama, T.; Ji, M.-J.; Hwang, H. Fabrication and electrochemical properties of Li1.3Al0.3Ti1.7(PO4)3 solid electrolytes by sol-gel method. Appl. Surf. Sci. 2019, 473, 622–626. [Google Scholar] [CrossRef]
  28. Wang, J.; Fan, L.; Zhang, J.; Li, X. Recent advances in Li1+xAlxTi2−x(PO4)3 solid-state electrolyte for safe lithium batteries. Energy Stor. Mater. 2019, 19, 379–400. [Google Scholar] [CrossRef]
  29. Meesala, Y.; Jena, A.; Chang, H.; Liu, R.-S. Recent Advancements in Li-Ion Conductors for All-Solid-State Li-Ion Batteries. ACS Energy Lett. 2017, 2, 2734–2751. [Google Scholar] [CrossRef]
  30. Arbi, K.; Bucheli, W.; Jiménez, R.; Sanz, J. High lithium ion conducting solid electrolytes based on NASICON Li1+xAlxM2−x(PO4)3 materials (M = Ti, Ge and 0 ≤ x ≤ 0.5). J. Eur. Ceram. Soc. 2015, 35, 1477–1484. [Google Scholar] [CrossRef]
  31. Das, A.; Sahu, S.; Mohapatra, M.; Verma, S.; Bhattacharyya, A.J.; Basu, S. Lithium-ion conductive glass-ceramic electrolytes enable safe and practical Li batteries. Mater. Today Energy 2022, 29, 101118. [Google Scholar] [CrossRef]
  32. Arbi, K.; Paris, M.A.; Sanz, J. Lithium exchange processes in the conduction network of the Nasicon LiTi2−xZrx(PO4)3 series (0 ≤ x ≤ 2). J. Phys. Chem. B 2006, 110, 6454–6457. [Google Scholar] [CrossRef]
  33. Venkateswara Rao, A.; Veeraiah, V.; Prasada Rao, A.V.; Kishore Babu, B.; Vijaya Kumar, K. Influence of Zr4+ doping on structural, spectroscopic and conductivity studies of lithium titanium phosphate. Ceram. Int. 2014, 40, 13911–13916. [Google Scholar] [CrossRef]
  34. Borik, M.A.; Bredikhin, S.I.; Bublik, V.T.; Kulebyakin, A.V.; Kuritsyna, I.E.; Lomonova, E.E.; Milovich, P.O.; Myzina, V.A.; Osiko, V.V.; Ryabochkina, P.A.; et al. Structure and conductivity of yttria and scandia-doped zirconia crystals grown by skull melting. J. Am. Ceram. Soc. 2017, 100, 5536–5547. [Google Scholar] [CrossRef]
  35. Xing, G.; Zhu, H.; Zhuang, A.; Meng, F.; Jiang, R.; Chen, S.; Chen, G.; Tang, Y. Doped superior garnet electrolyte toward all-solid-state Li metal batteries. Physics Open 2022, 13, 100119. [Google Scholar] [CrossRef]
  36. Kyono, N.; Bai, F.; Nemori, H.; Minami, H.; Mori, D.; Takeda, Y.; Yamamoto, O.; Imanishi, N. Lithium-ion conducting solid electrolytes of Li1.4Al0.4Ge0.2Ti1.4(PO4)3 and MOx (M = Al, Ti, and Zr) composites. Solid State Ionics 2018, 324, 114–127. [Google Scholar] [CrossRef]
  37. Saffirio, S.; Falco, M.; Appetecchi, G.B.; Smeacetto, F.; Gerbaldi, C. Li1.4Al0.4Ge0.4Ti1.4(PO4)3 promising NASICON-structured glass-ceramic electrolyte for all-solid-state Li-based batteries: Unravelling the effect of diboron trioxide. J. Eur. Ceram. Soc. 2022, 42, 1023–1032. [Google Scholar] [CrossRef]
  38. Šalkus, T.; Dindune, A.; Kanepe, Z.; Ronis, J.; Určinskas, A.; Kežionis, A.; Orliukas, A.F. Lithium ion conductors in the system Li1+yGe2−x−yTixAly(PO4)3 (x = 0.1÷0.3, y = 0.07÷0.21). Solid State Ionics 2007, 178, 1282–1287. [Google Scholar] [CrossRef]
  39. Zhang, P.; Matsui, M.; Hirano, A.; Takeda, Y.; Yamamoto, O.; Imanishi, N. Water-stable lithium ion conducting solid electrolyte of the Li1.4Al0.4Ti1.6−xGex(PO4)3 system (x = 0–1.0) with NASICON-type structure. Solid State Ionics 2013, 253, 175–180. [Google Scholar] [CrossRef]
  40. Maldonado-Manso, P.; Losilla, E.R.; Martinez-Lara, M.; Aranda, M.A.G.; Bruque, S.; Mouahid, F.E.; Zahir, M. High Lithium ionic conductivity in the Li1+xAlxGeyTi2-x-y(PO4)3 NASICON series. Chem. Mater. 2003, 15, 1879–1885. [Google Scholar] [CrossRef]
  41. Kothari, D.H.; Kanchan, D.K. Study of Study of electrical properties of gallium-doped lithium titanium aluminum phosphate compounds. Ionics 2015, 21, 1253–1259. [Google Scholar] [CrossRef]
  42. Shang, X.; Nemori, H.; Mitsuoka, S.; Mastuda, Y.; Takeda, Y.; Yamamoto, O.; Imanishi, N. High lithium-ion conducting NASICON-type Li1+x−yAlxNbyTi2–x−y(PO4)3 solid electrolytes. Solid State Ionics 2016, 297, 43–48. [Google Scholar] [CrossRef]
  43. Wang, Q.; Liu, L.; Zhao, B.; Zhang, L.; Xiao, X.; Yan, H.; Xu, G.; Ma, L.; Liu, Y. Transport and interface characteristics of Te-doped NASICON solid electrolyte Li1.3Al0.3Ti1.7(PO4)3. Electrochim. Acta 2021, 399, 139367. [Google Scholar] [CrossRef]
  44. Rai, K.; Kundu, S. Fabrication and performances of high lithium-ion conducting solid electrolytes based on NASICON Li1.3Al0.3Ti1.7-xZrx(PO4)3 (0 ≤ x ≤ 0.2). Ceram. Int. 2020, 46, 23695–23705. [Google Scholar] [CrossRef]
  45. Rettenwander, D.; Welzl, A.; Pristat, S.; Tietz, F.; Taibl, S.; Redhammer, G.J.; Fleig, J. A microcontact impedance study on NASICON-type Li1+xAlxTi2-x(PO4)3, 0 ≤ x≤ 0.5 single crystals. J. Mater. Chem. 2016, 4, 1506–1513. [Google Scholar] [CrossRef]
  46. Yan, G.; Yu, S.; Nonemacher, J.F.; Tempel, H.; Kungl, H.; Malzbender, J.; Eichel, R.-A.; Krüger, M. Influence of sintering temperature on conductivity and mechanical behavior of the solid electrolyte LATP. Ceram. Int. 2019, 45, 14697–14703. [Google Scholar] [CrossRef]
  47. West, A.R. Basic Solid State Chemistry, Rev. ed.; John Wiley & Sons Ltd.: Chichester, UK, 1988; pp. 216–221. [Google Scholar]
  48. Stenina, I.A.; Pinus, I.Y.; Rebrov, A.I.; Yaroslavtsev, A.B. Lithium and hydrogen ions transport in materials with NASICON structure. Solid State Ionics 2004, 175, 445–449. [Google Scholar] [CrossRef]
  49. Stenina, I.A.; Velikodnyi, Y.A.; Ketsko, V.A.; Yaroslavtsev, A.B. Synthesis of NASICON-Type Lithium Zirconium Phosphate. Inorg. Mater. 2004, 40, 967–970. [Google Scholar] [CrossRef]
  50. Petricek, V.; Dusek, M.; Palatinus, L. Crystallographic Computing System JANA2006: General features. Z. Kristallogr. 2014, 229, 345–352. [Google Scholar] [CrossRef]
  51. Kwatek, K.; Ślubowska, W.; Trébosc, J.; Lafon, O.; Nowiński, J.L. Structural and electrical properties of ceramic Li-ion conductors based on Li1.3Al0.3Ti1.7(PO4)3-LiF. J. Eur. Ceram. Soc. 2020, 40, 85–93. [Google Scholar] [CrossRef]
  52. Arbi, K.; Hoelzel, M.; Kuhn, A.; García-Alvaradoc, F.; Sanza, J. Local structure and lithium mobility in intercalated Li3AlxTi2−x(PO4)3 NASICON type materials: A combined neutron diffraction and NMR study. Phys. Chem. Chem. Phys. 2014, 16, 18397–18405. [Google Scholar] [CrossRef]
  53. Diez-Gómez, V.; Arbi, K.; Sanz, J. Modeling Ti/Ge Distribution in LiTi2-xGex(PO4)3 NASICON Series by 31P MAS NMR and First-Principles DFT Calculations. J. Am. Chem. Soc. 2016, 138, 9479–9486. [Google Scholar] [CrossRef]
  54. Vinod Chandran, C.; Pristat, S.; Witt, E.; Tietz, F.; Heitjans, P. Solid-State NMR Investigations on the Structure and Dynamics of the Ionic Conductor Li1+xAlxTi2-x(PO4)3 (0 ≤ x ≤ 1.0). J. Phys. Chem. C. 2016, 120, 8436–8442. [Google Scholar] [CrossRef]
  55. Lavrova, G.V.; Shutova, E.S.; Ponomareva, V.G.; Dunyushkina, L.A. Proton conductivity and interphase interaction in CsH2PO4 –SrZrO3 composites. Russ. J. Electrochem. 2013, 49, 718–724. [Google Scholar] [CrossRef]
  56. Uvarov, N.F. Ionics of nanoheterogeneous materials. Russ. Chem. Rev. 2007, 76, 415–433. [Google Scholar] [CrossRef]
  57. Yaroslavtsev, A.B. Ion transport in heterogeneous solid systems. Russ. J. Inorg. Chem. 2000, 45, 249–267. [Google Scholar]
  58. Maier, J. Pushing Nanoionics to the Limits: Charge Carrier Chemistry in Extremely Small Systems. Chem. Mater. 2014, 26, 348–360. [Google Scholar] [CrossRef]
  59. Han, F.; Zhu, Y.; He, X.; Mo, Y.; Wang, C. Electrochemical Stability of Li10GeP2S12 and Li7La3Zr2O12 Solid Electrolytes. Adv. Energy Mater. 2016, 6, 1501590. [Google Scholar] [CrossRef]
Figure 1. XRD patterns of Li1+xAlxZryTi2−x−y(PO4)3 (0 ≤ x, y ≤ 0.2) prepared by a sol-gel method at 800 (a), 900 °C (b) and by a solid-state reaction at 800–1000 °C (c). The Miller indices (hkl) are indicated above the diffraction peaks in (a).
Batteries 09 00059 g001aBatteries 09 00059 g001b
Figure 2. SEM images of surfaces of Li1.2Al0.2Zr0.1Ti1.7(PO4)3 (a,b,e,f) and Li1.1Al0.1Zr0.2Ti1.7(PO4)3 (c,d,g,h) prepared by a sol-gel route and sintered at 800 (a,c) and 900 °C (b,d) and by a solid-state reaction at 900 (e,g) and 1000 °C (f,h); element (Ti, P/Zr, Al) mapping and EDX data for Li1.2Al0.2Zr0.1Ti1.7(PO4)3_sg_800 (i). All the materials were sintered for 5 h.
Batteries 09 00059 g002aBatteries 09 00059 g002b
Figure 3. 31P MAS NMR spectra (black lines) and their deconvolution (peaks (blue) and sum spectra (magenta)) for the Li1+xAlxZryTi2−x−y(PO4)3 (x = 0, 0.1, 0.2; y = 0, 0.1) samples prepared via a sol-gel route at 800 °C.
Batteries 09 00059 g003
Figure 4. The Nyquist plots of the Li1.2Al0.2Zr0.1Ti1.7(PO4)3_sg_800-5h sample at various temperatures. Lines represent the fits of complex impedance spectra.
Batteries 09 00059 g004
Figure 5. Arrhenius plots of total conductivity for Li1+xAlxZryTi2−x−y(PO4)3 prepared by a sol-gel route: (a) y = 0.1, x = 0–0.2 and (b) y = 0.2, x = 0–0.2.
Batteries 09 00059 g005
Figure 6. Temperature dependences of total conductivity for (a) Li1.2Al0.2Zr0.1Ti1.7(PO4)3 and Li1.1Al0.1Zr0.2Ti1.7(PO4)3 prepared by solid-state reaction and sintered at different temperatures for 5 h and (b) Li1.2Al0.2Zr0.1Ti1.7(PO4)3_ss_900, Li1.1Al0.1Zr0.2Ti1.7(PO4)3_ss_900, and Li1.2Al0.2Zr0.1Ti1.7(PO4)3_sg_900 sintered for 5 and 10 h.
Batteries 09 00059 g006
Figure 7. The voltage profile for symmetrical Li|Li1.2Al0.2Zr0.1Ti1.7(PO4)3_ss_900-10h|Li cell at a current density of 0.05 mA/cm2.
Batteries 09 00059 g007
Table 1. Unit cell parameters of Li1+xAlxZryTi2−x−y(PO4)3 (0 ≤ x, y ≤ 0.2) prepared by a sol-gel route at 800 °C.
Compositiona 1, Åc, Å
LiTi2(PO4)38.5129 ± 0.000820.878± 0.004
LiZr0.1Ti1.9(PO4)38.5238 ± 0.000320.982 ± 0.002
Li1.1Zr0.1Al0.1Ti1.8(PO4)38.5109 ± 0.000620.956 ± 0.003
Li1.2Zr0.1Al0.2Ti1.7(PO4)38.5158 ± 0.000520.942 ± 0.002
LiZr0.2Ti1.8(PO4)38.5727 ± 0.000621.036 ± 0.002
Li1.1Zr0.2Al0.1Ti1.7(PO4)38.5355 ± 0.000521.000 ± 0.003
Li1.2Zr0.2Al0.2Ti1.6(PO4)38.5203 ± 0.000620.917 ± 0.002
1 Unit cell parameters are given in hexagonal setting, a = b.
Table 2. Chemical shifts δ(31P) of components in 31P MAS NMR spectra of the Li1+xAlxZryTi2−x−y(PO4)3 samples.
Sampleδ(31P), ppmAssignment
LiZr0.1Ti1.9(PO4)3_sg_800−27.58P(O4Ti4)
−27.36P(O4Ti3Zr)
Li1.2Al0.2Ti1.8(PO4)3_sg_800−27.56P(O4Ti4)
−27.24P(O4Ti3Al)
−26.65P(O4Ti2Al2)
Li1.1Al0.1Zr0.1Ti1.7(PO4)3_sg_800−27.59P(O4Ti4)
−27.28P(O4Ti3Zr) + P(O4Ti3Al)
−26.52P(O4Ti2Al2) + P(O4Ti2ZrAl)
Li1.2Al0.2Zr0.1Ti1.7(PO4)3_sg_800−27.57P(O4Ti4)
−27.11P(O4Ti3Zr) + P(O4Ti3Al)
−26.17P(O4Ti2Al2) + P(O4Ti2ZrAl)
Table 3. The total conductivity at 25 °C and activation energies (Ea, calculated in the temperature range of 25–200 °C) for the Li1+xAlxZryTi2−x−y(PO4)3 samples.
Sol-Gel RouteSolid-State Reaction
Sampleσ25 °C, S cm−1Ea ± 1, kJ mol−1Sampleσ25 °C, S cm−1Ea ± 1, kJ mol−1
LiTi2(PO4)3_800-5h4.1 × 10−737Li1.2Al0.2Zr0.1Ti1.7(PO4)3_800-5h2.5 × 10−541
LiZr0.1Ti1.9(PO4)3_800-5h4.9 × 10−628Li1.2Al0.2Zr0.1Ti1.7(PO4)3_900-5h6.2 × 10−430
Li1.1Al0.1Zr0.1Ti1.8(PO4)3_800-5h3.7 × 10−532Li1.2Al0.2Zr0.1Ti1.7(PO4)3_900-10h7.9 × 10−430
Li1.2Al0.2Zr0.1Ti1.7(PO4)3_800-5h7.2 × 10−530Li1.2Al0.2Zr0.1Ti1.7(PO4)3_1000-5h7.8 × 10−533
Li1.2Al0.2Zr0.1Ti1.7(PO4)3_900-5h1.5 × 10−431Li1.1Al0.1Zr0.2Ti1.7(PO4)3_800-5h5.1 × 10−532
Li1.2Al0.2Zr0.1Ti1.7(PO4)3_900-10h 16.8 × 10−425Li1.1Al0.1Zr0.2Ti1.7(PO4)3_900-5h4.5 × 10−426
LiZr0.2Ti1.8(PO4)3_800-5h3.2 × 10−742Li1.1Al0.1Zr0.2Ti1.7(PO4)3_900-10h5.4 × 10−428
Li1.1Al0.1Zr0.2Ti1.7(PO4)3_800-5h6.7 × 10−526Li1.1Al0.1Zr0.2Ti1.7(PO4)3_1000-5h2.8 × 10−428
Li1.1Al0.1Zr0.2Ti1.7(PO4)3_900-5h5.5 × 10−526
Li1.2Al0.2Zr0.2Ti1.6(PO4)3_800-5h3.5 × 10−533
Li1.3Al0.3Ti1.7(PO4)3_800-5h8.0 × 10−636
1 The sample was prepared by a sol-gel route at 800 °C, then ball-milled, pressed into pellets, and sintered again at 900 °C for 10 h.
Disclaimer/Publisher’s Note: The statements, opinions and data contained in all publications are solely those of the individual author(s) and contributor(s) and not of MDPI and/or the editor(s). MDPI and/or the editor(s) disclaim responsibility for any injury to people or property resulting from any ideas, methods, instructions or products referred to in the content.

