
Impact of Multiple Module Collectors on the Cell Current Distribution within the Battery Pack
 , , ,
, , ,
Abstract
:
1. Introduction
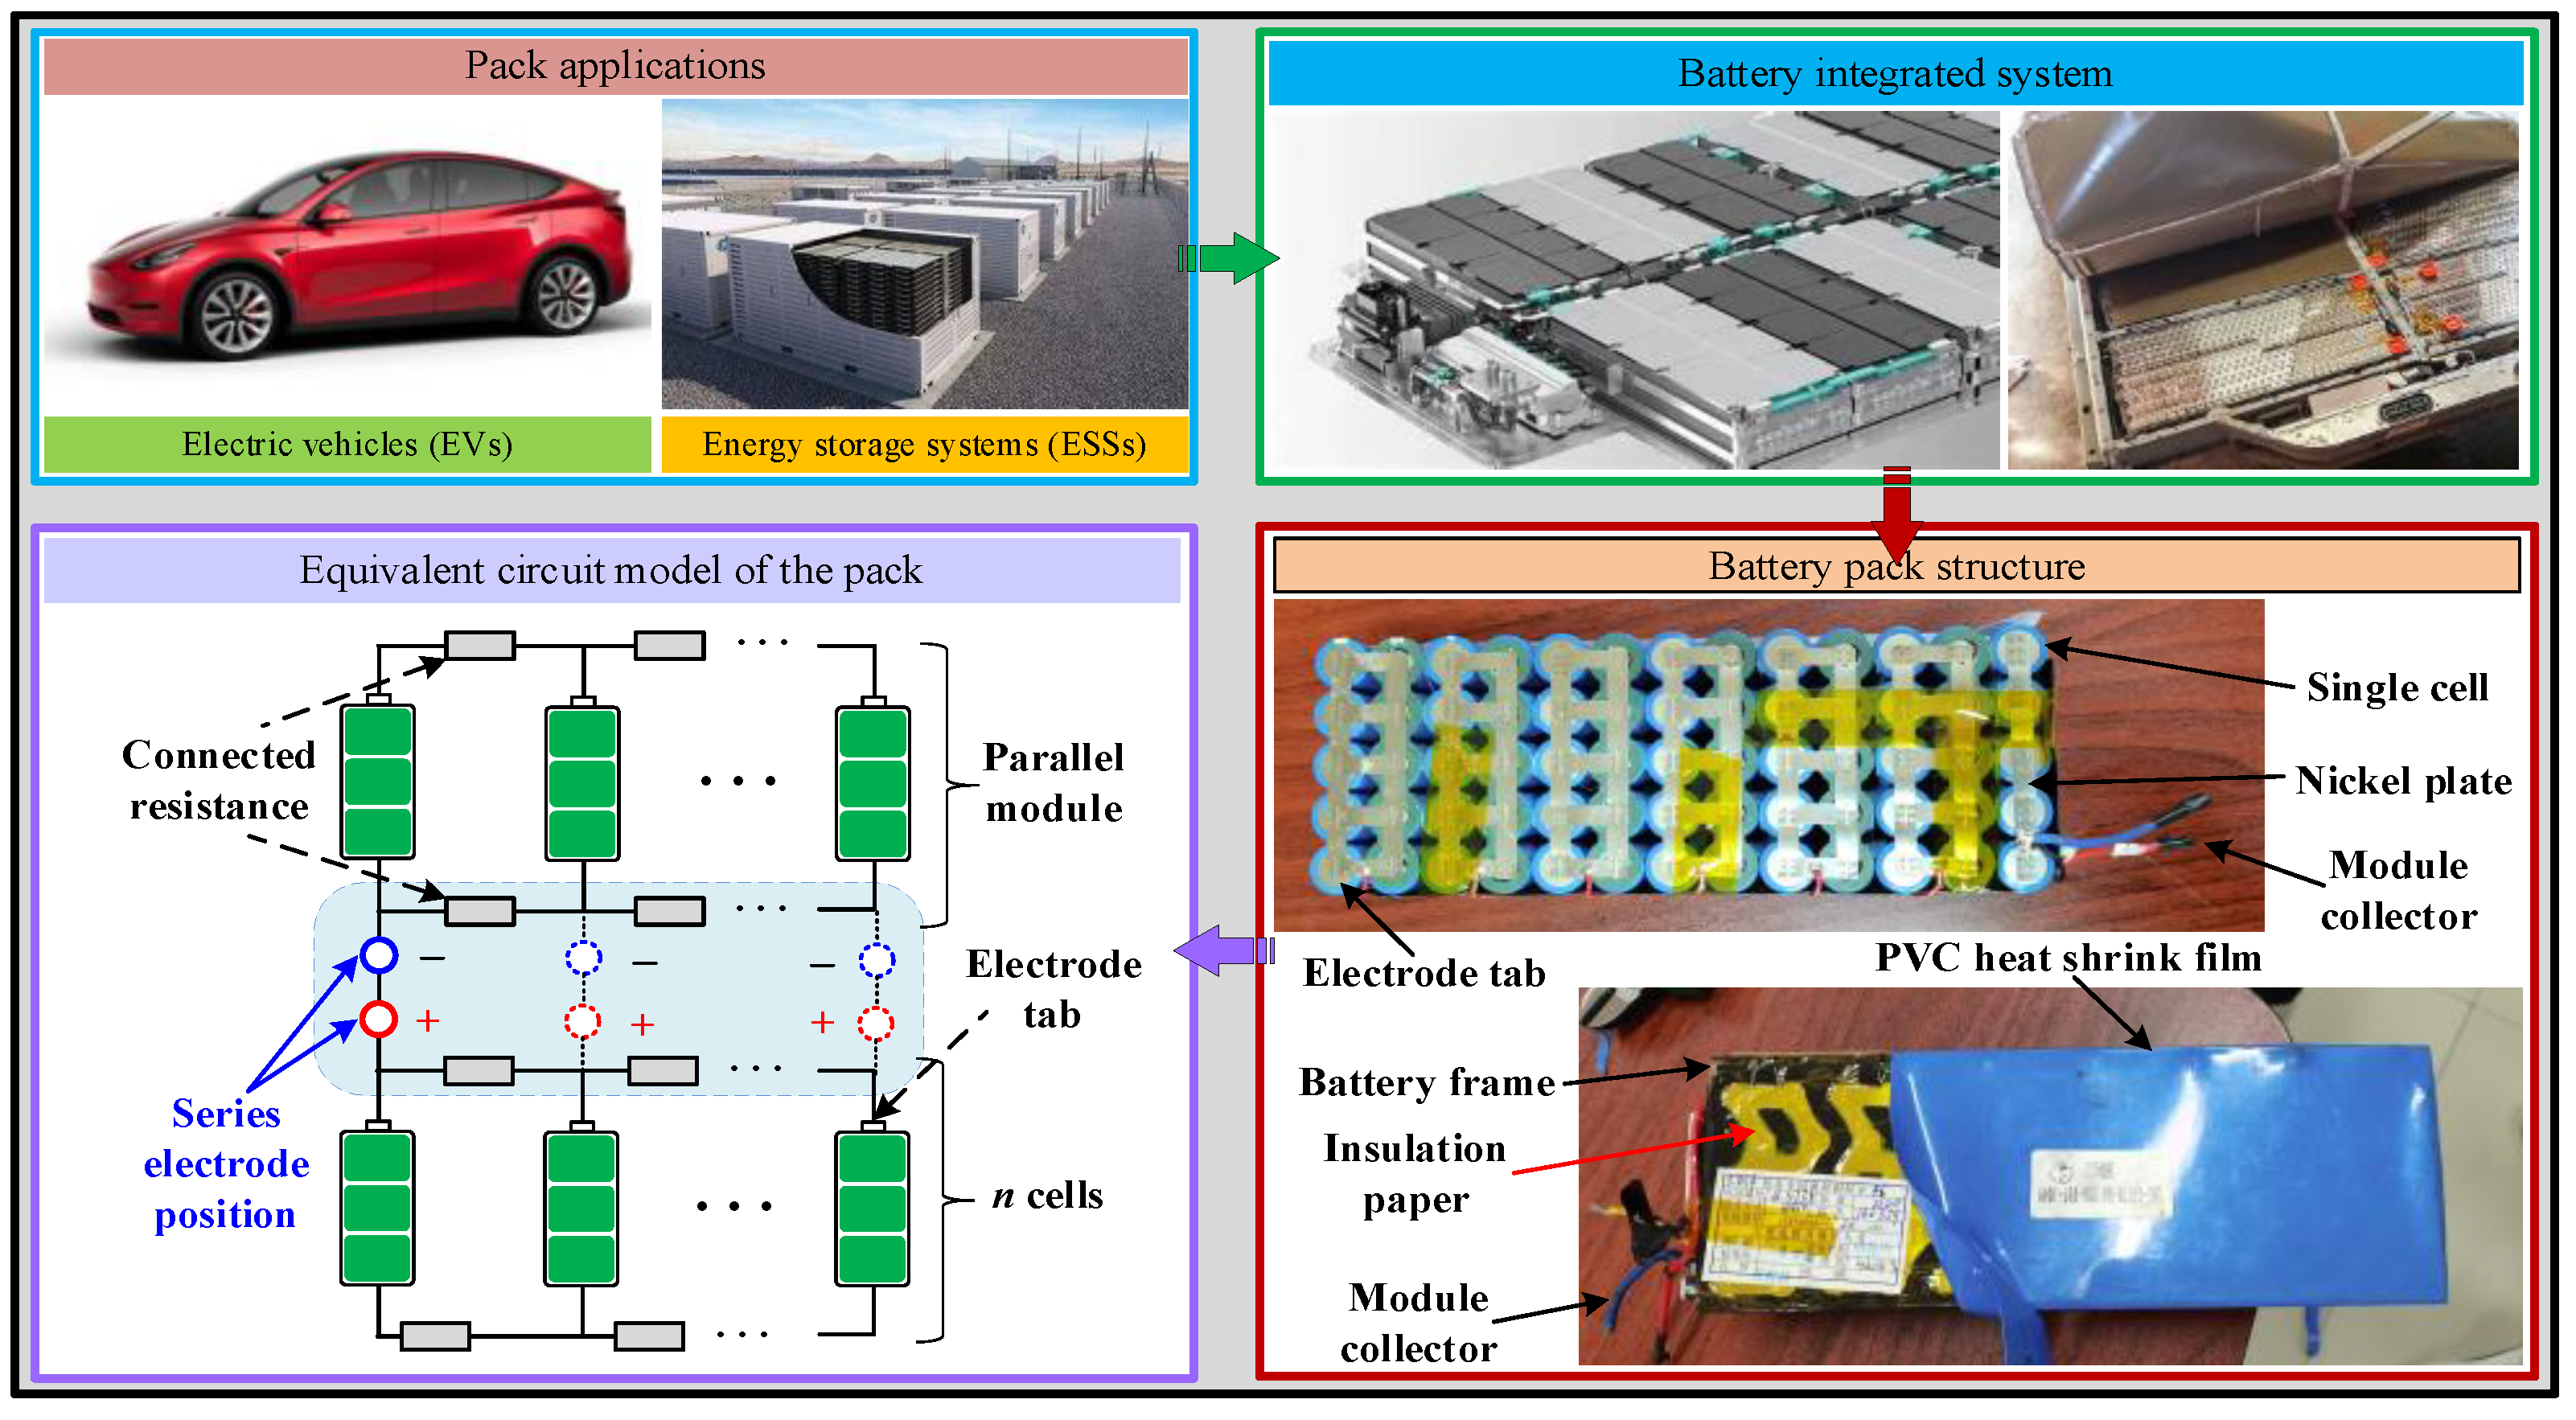
2. Pack Configuration and Analytical Model
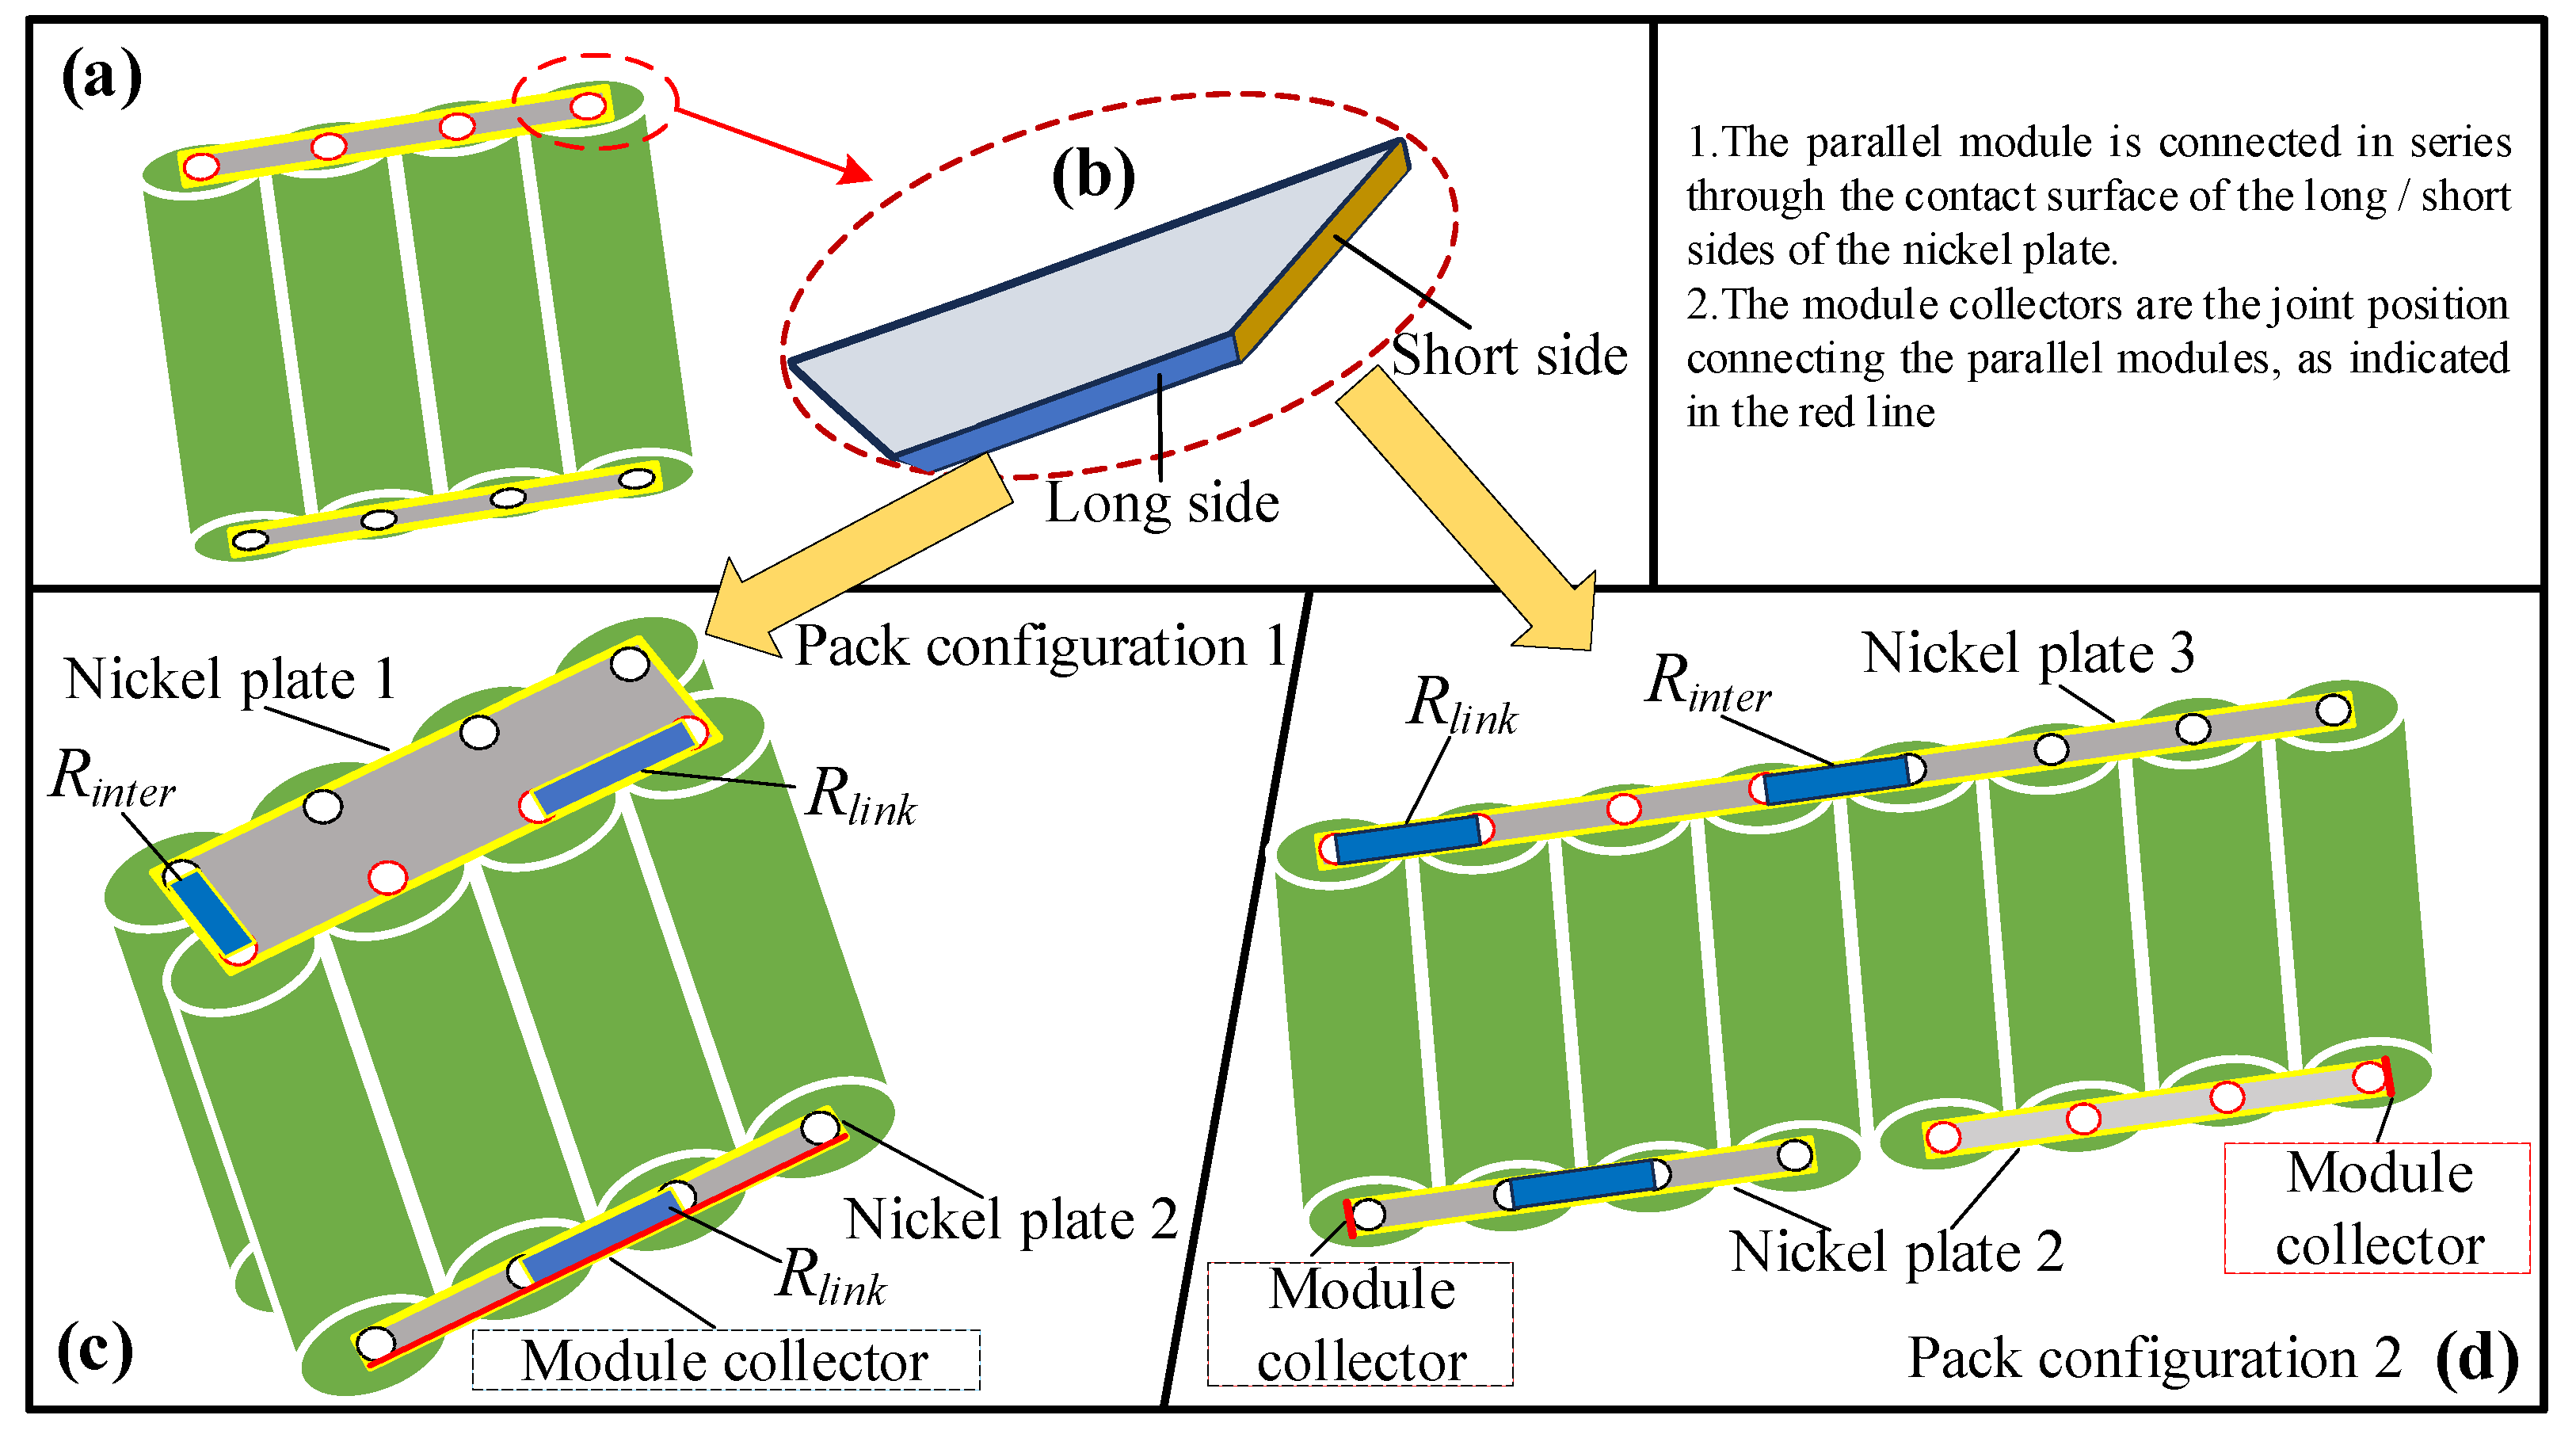
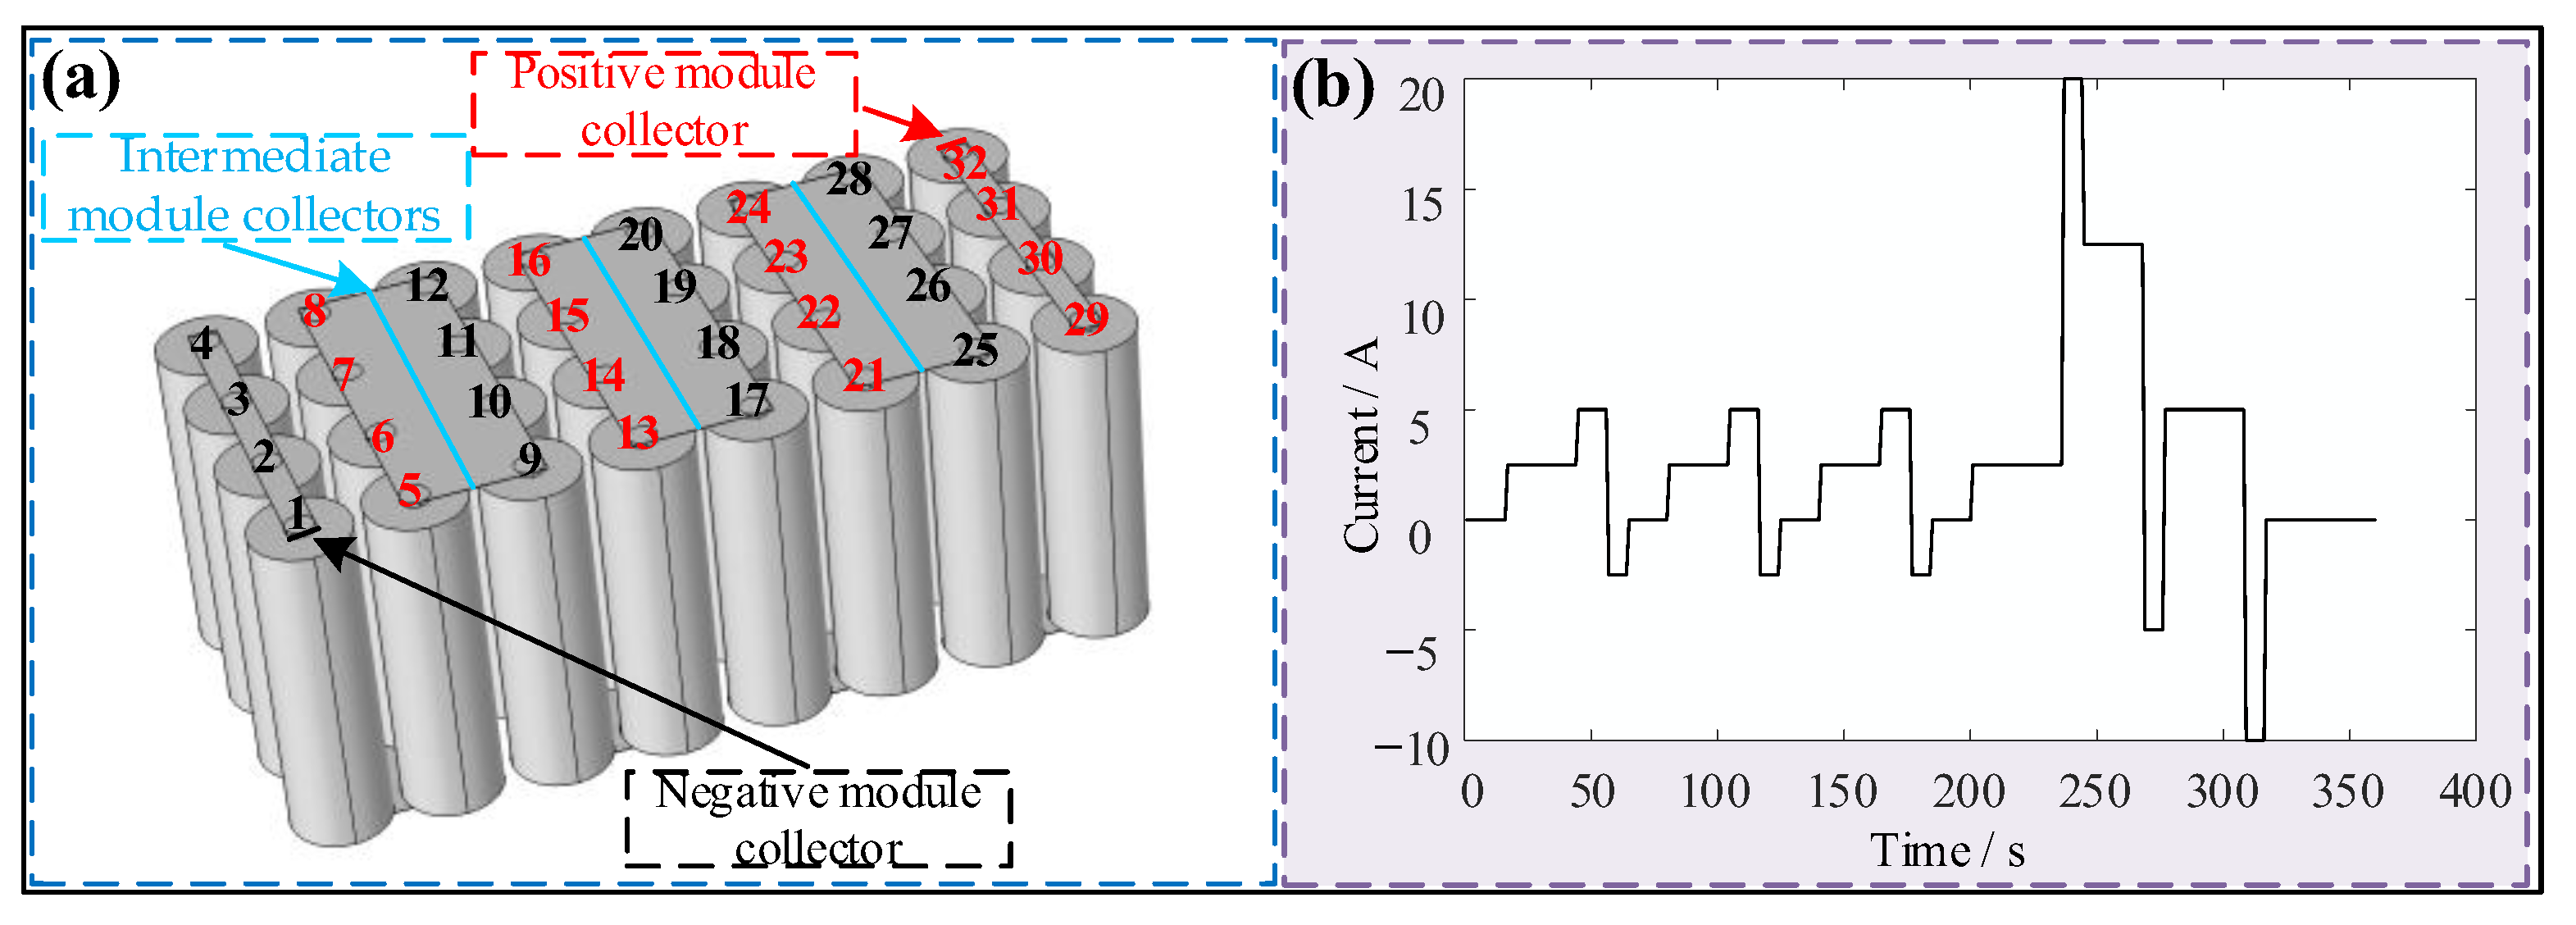
2.1. 3D Geometric Model
2.2. Mathematical Analytical Model
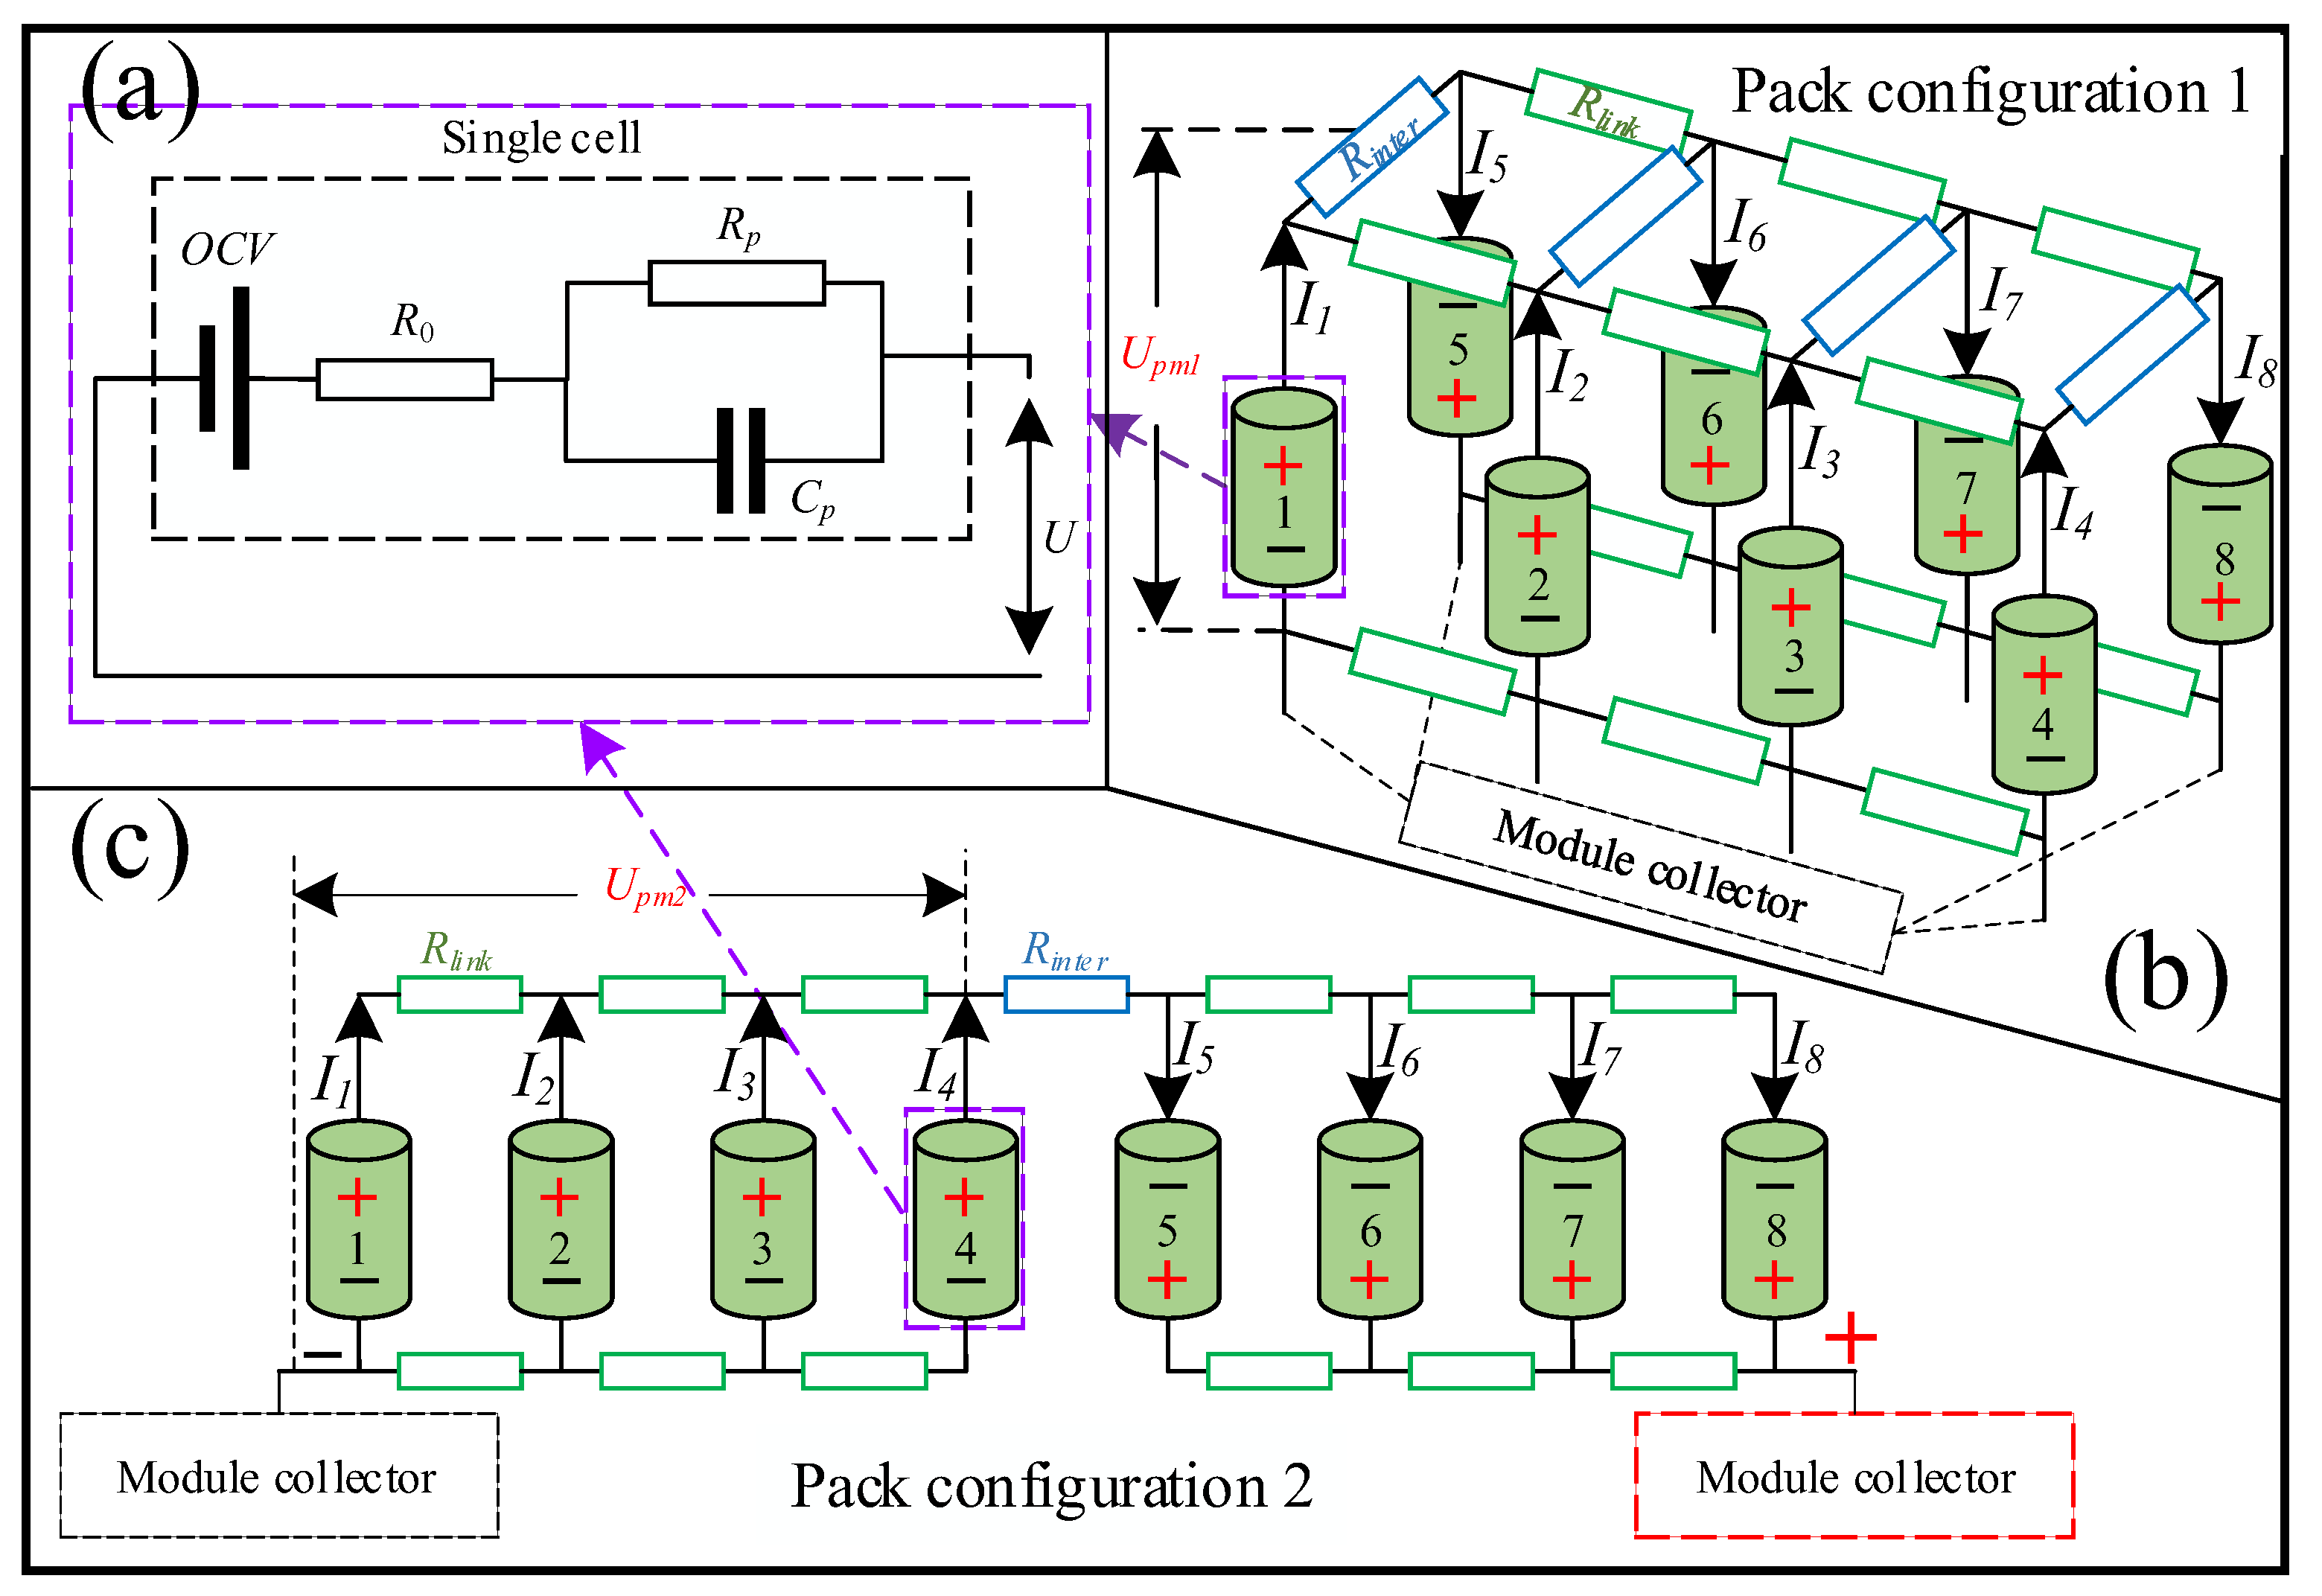
2.2.1. Equivalent Circuit Model
2.2.2. ECM of Series-Parallel Pack
3. Model and Verification
3.1. Construction of 3D Geometric Model
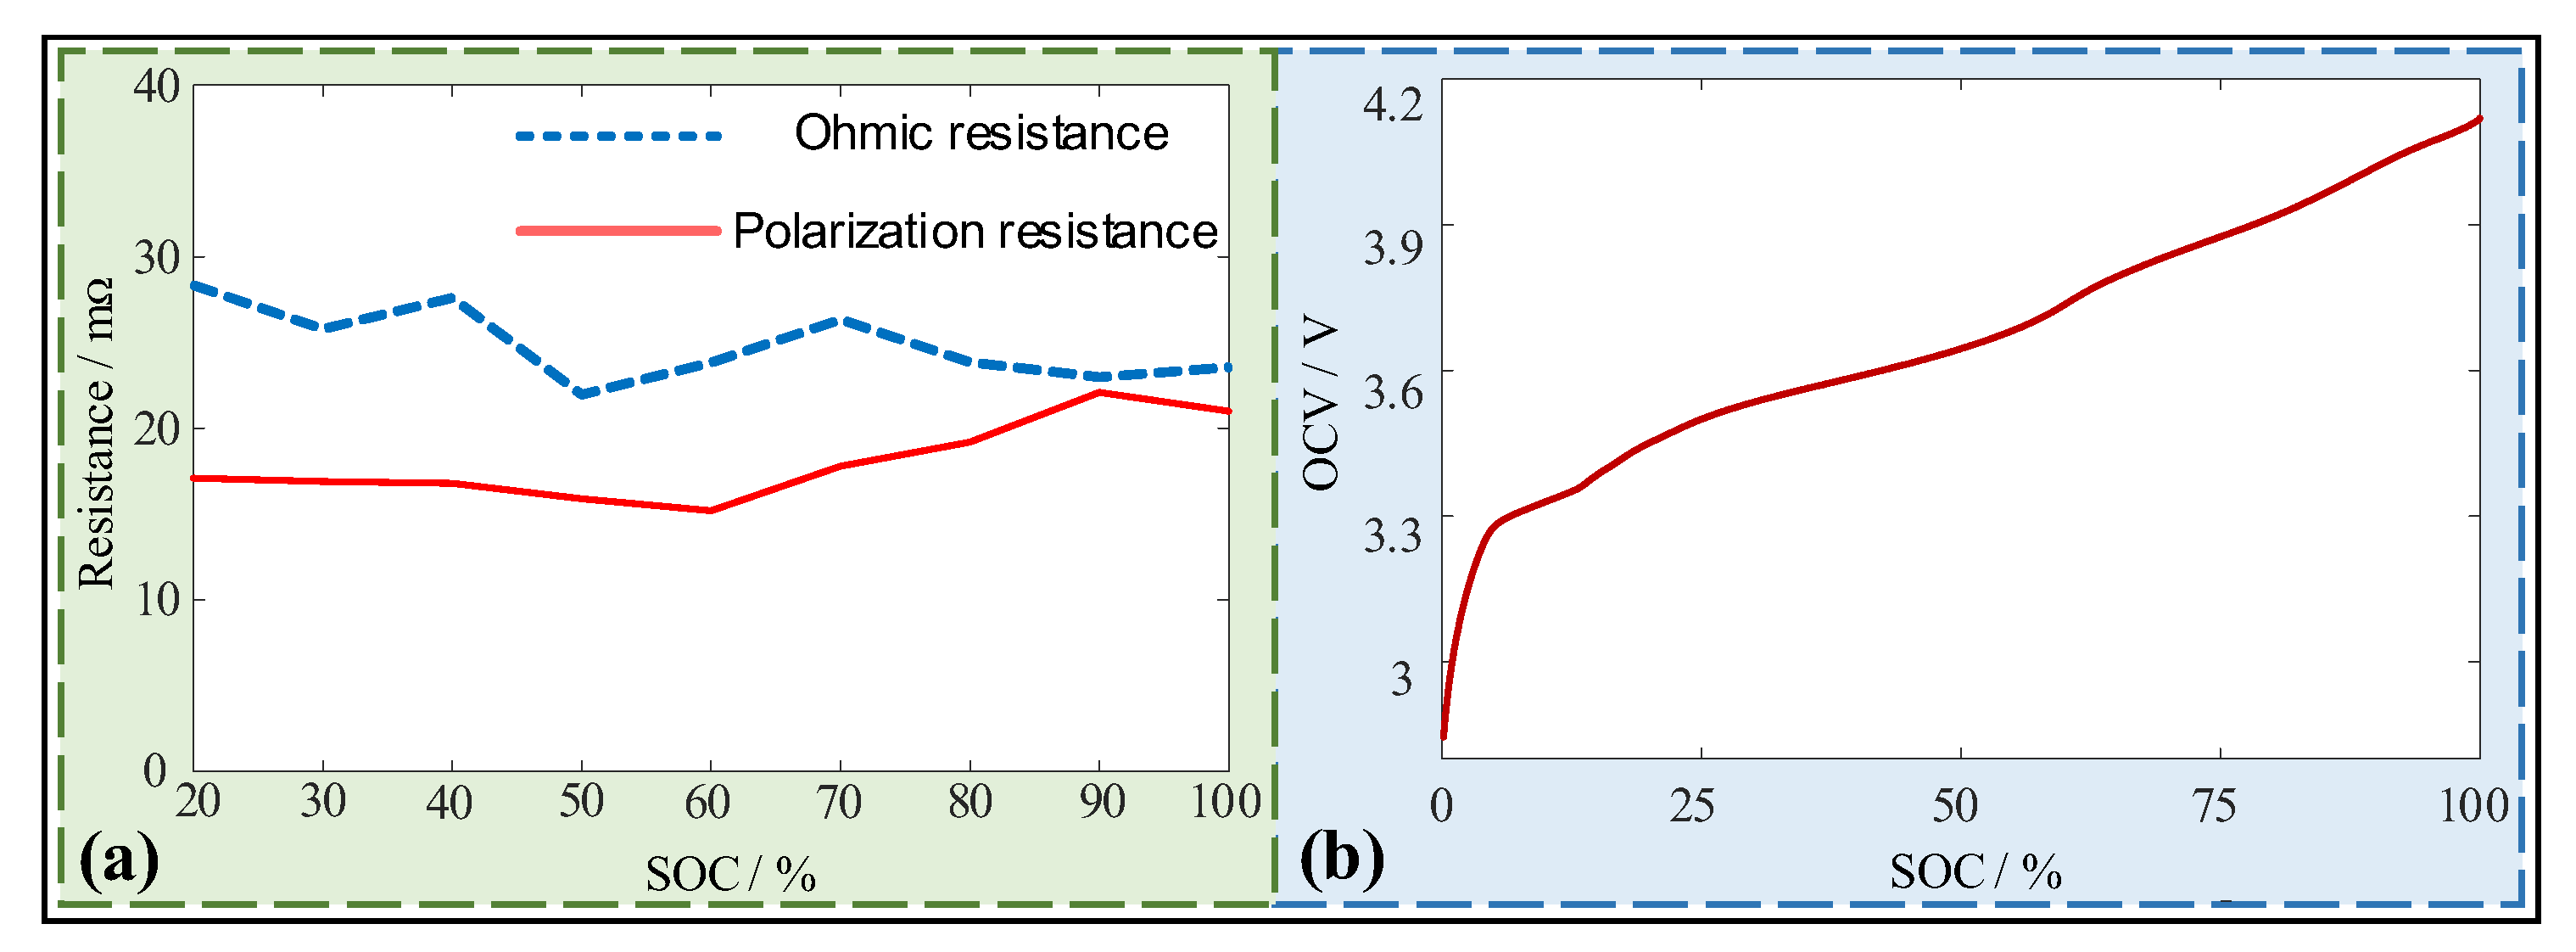
3.2. Construction of ECM
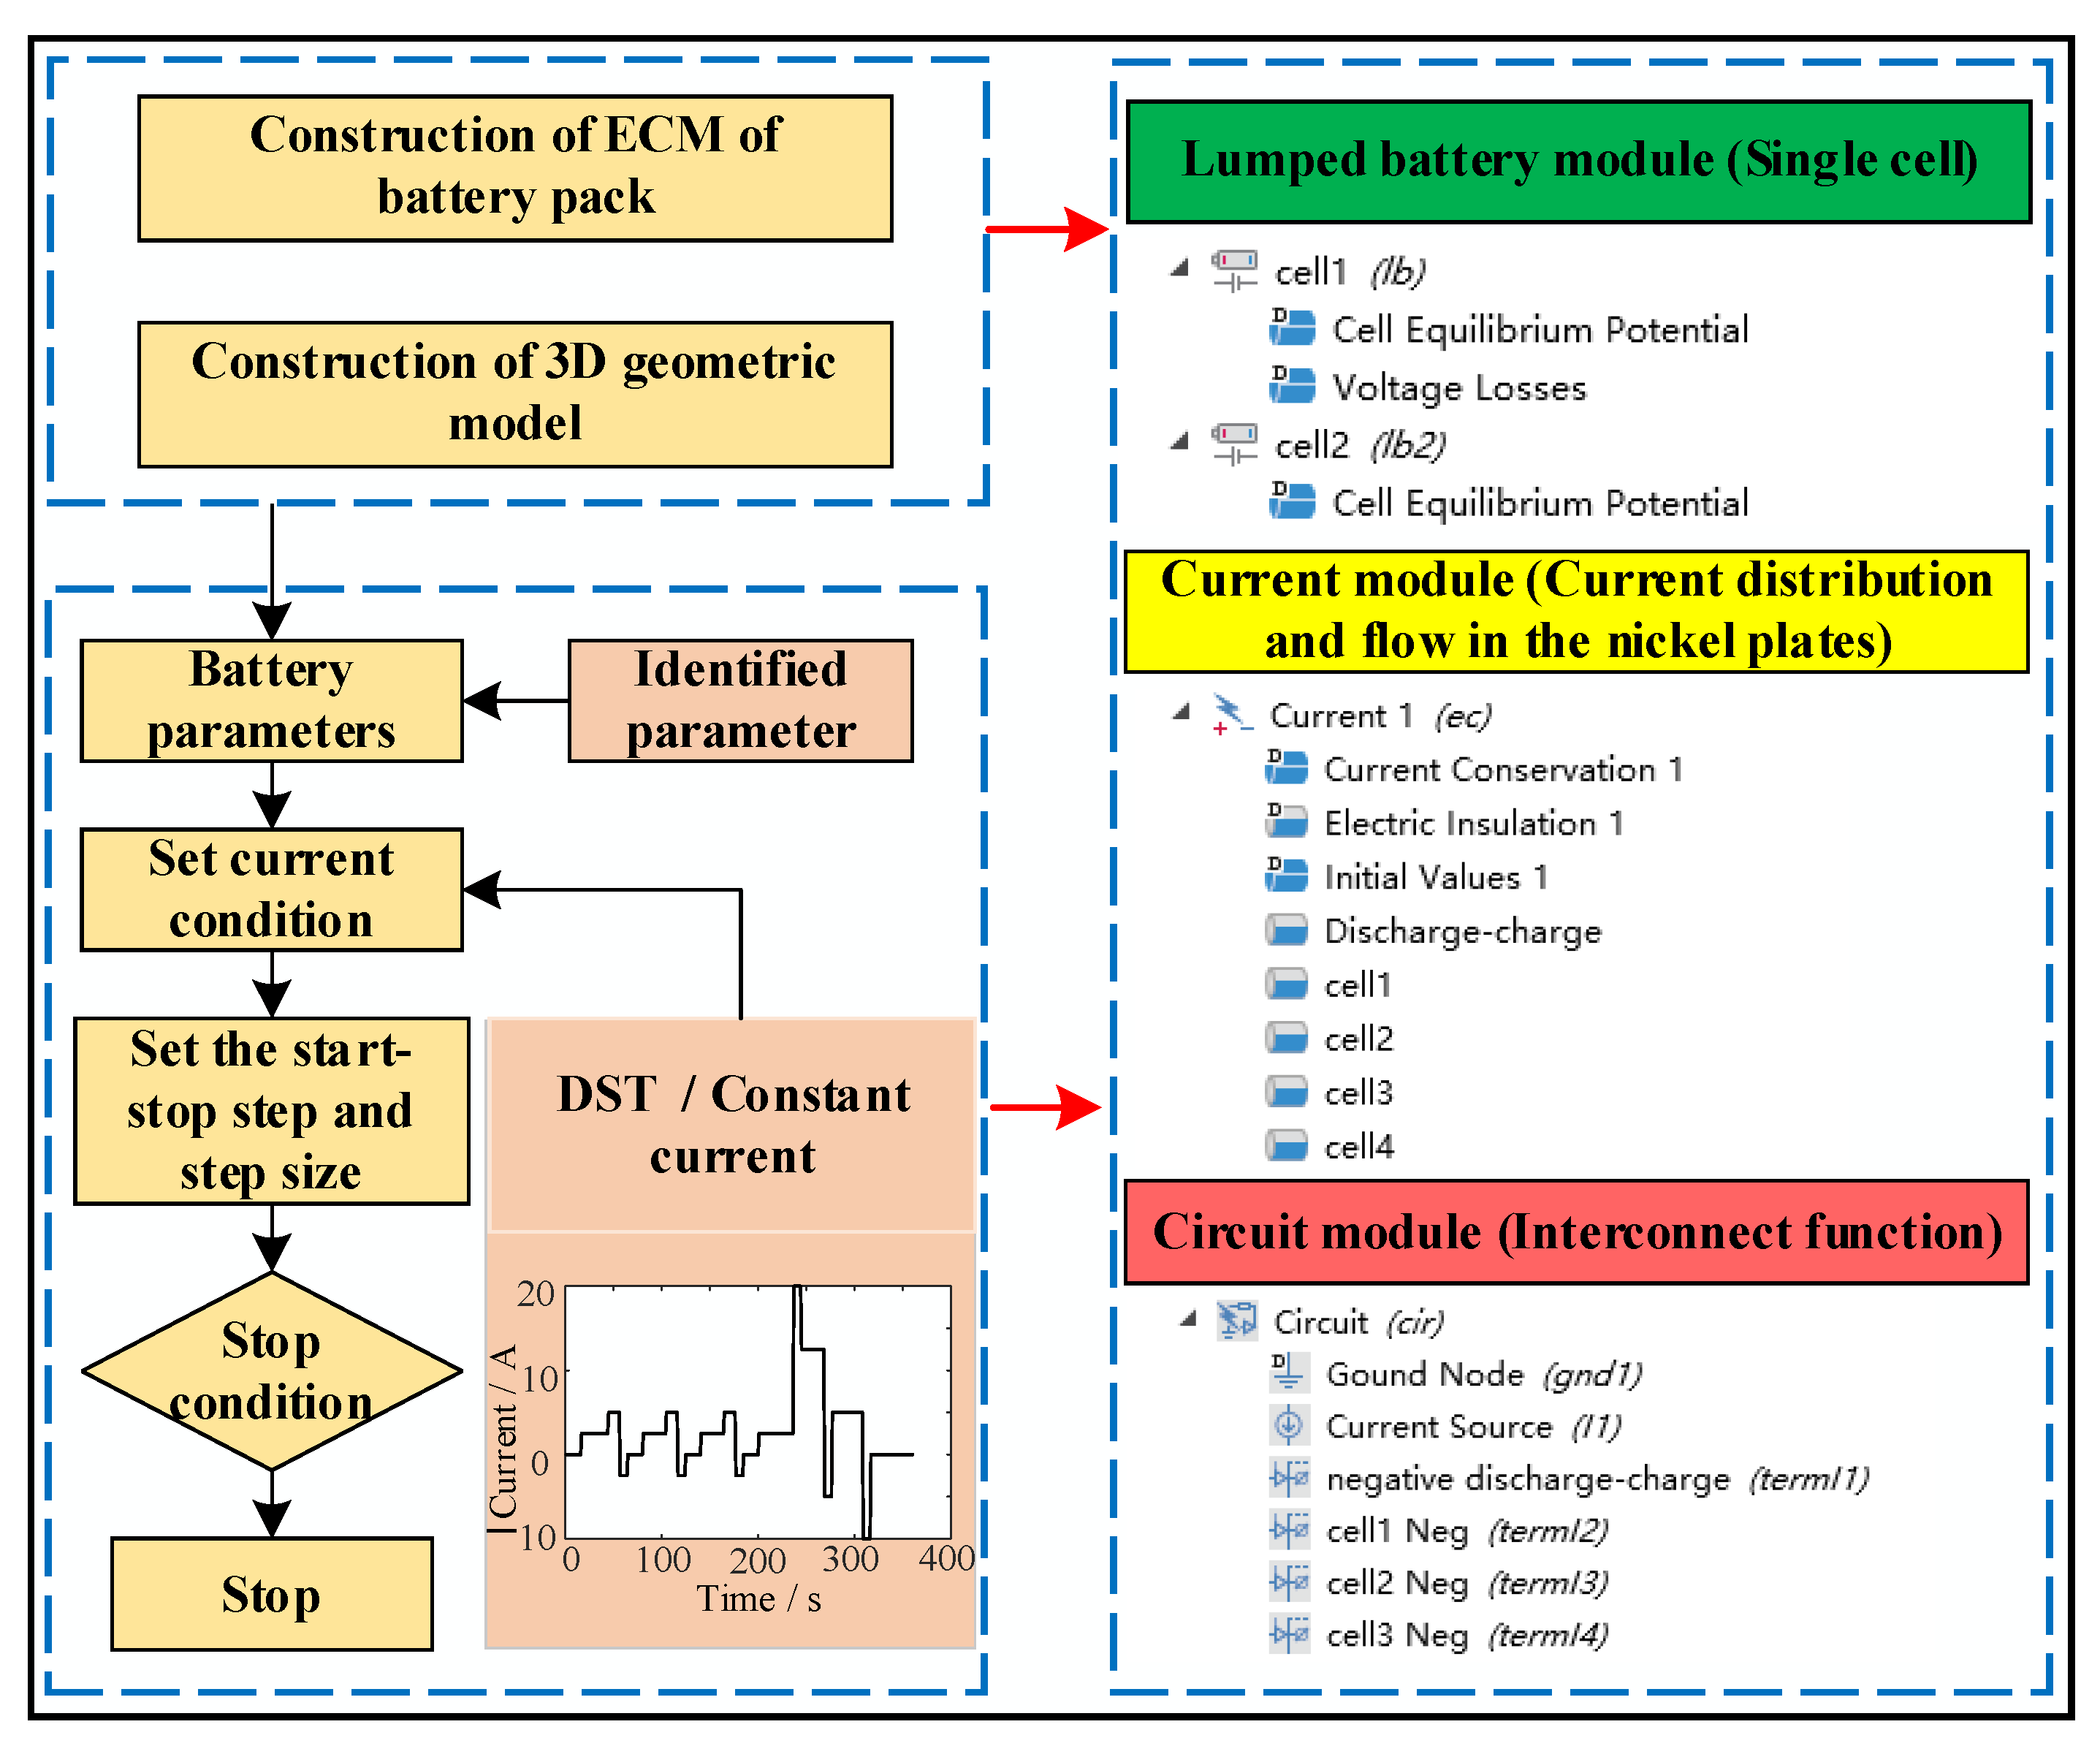
3.3. Construction of COMSOL Model
3.4. Constant Current Discharge (CCD) Simulation and Analysis of Series-Parallel Pack
4. Result and Discussion
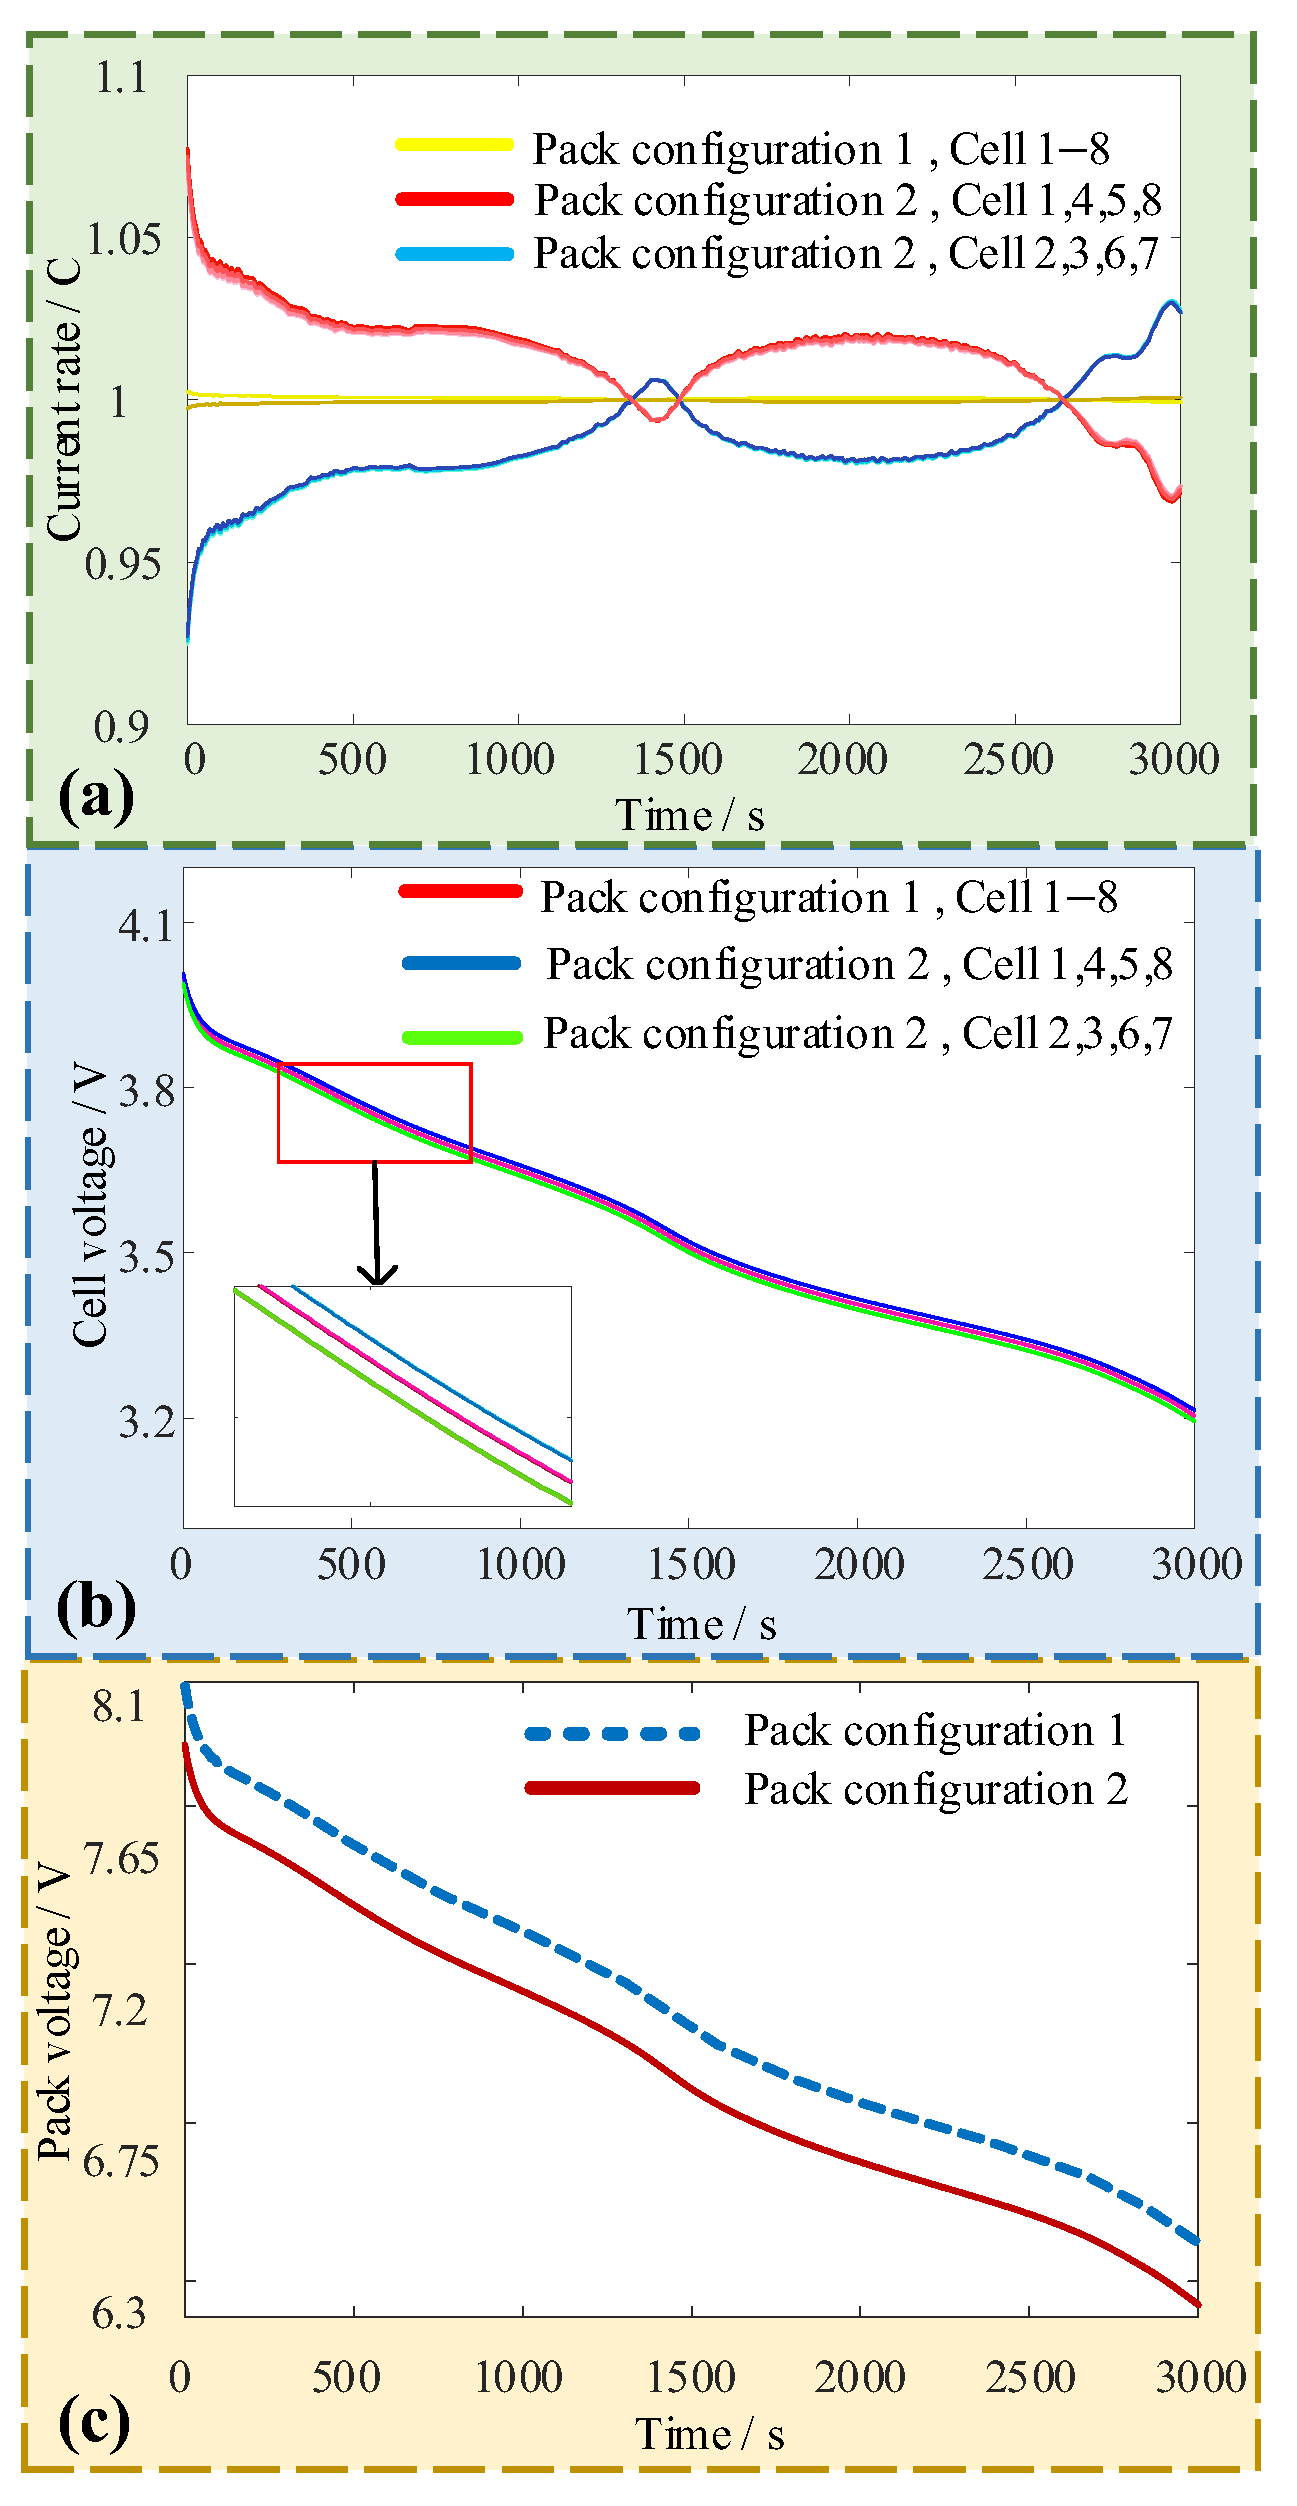
4.1. Analysis of Series-Parallel Pack
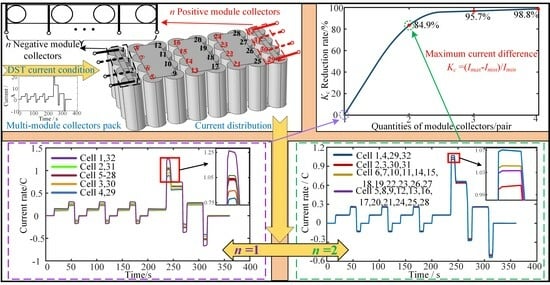
4.2. Pack of Multiple Module Collectors
4.3. Limitations and Future Work
5. Conclusions
Author Contributions
Funding
Data Availability Statement
Conflicts of Interest
References
- Hannan, M.A.; Hoque, M.M.; Hussain, A.; Yusof, Y.; Ker, P.J. State-of-the-Art and Energy Management System of Lithium-Ion Batteries in Electric Vehicle Applications:Issues and Recommendations. IEEE Access 2018, 6, 19362–19378. [Google Scholar] [CrossRef]
- Li, J.; Li, L.; Li, Z.; Jiang, Z.; Gu, J. Co-estimation of parameters and state of charge for lithium-ion battery. J. Electroanal. Chem. 2022, 907, 116011. [Google Scholar] [CrossRef]
- Rogers, D.J.; Aslett, L.J.M.; Troffaes, M.C.M. Modelling of modular battery systems under cell capacity variation and degradation. Appl. Energy 2021, 283, 116360. [Google Scholar] [CrossRef]
- Wang, J.; Zhang, S.; Hu, X. A Fault Diagnosis Method for Lithium-Ion Battery Packs Using Improved RBF Neural Network. Front. Energy Res. 2021, 9, 702139. [Google Scholar] [CrossRef]
- Madani, S.S.; Soghrati, R.; Ziebert, C. A Regression-Based Technique for Capacity Estimation of Lithium-Ion Batteries. Batteries 2022, 8, 31. [Google Scholar] [CrossRef]
- Venet, P. Battery Performance, Ageing, Reliability and Safety. Batteries 2023, 9, 277. [Google Scholar] [CrossRef]
- Duffner, F.; Kronemeyer, N.; Tübke, J.; Leker, J.; Winter, M.; Schmuch, R. Post-lithium-ion battery cell production and its compatibility with lithium-ion cell production infrastructure. Nat. Energy 2021, 6, 123–134. [Google Scholar] [CrossRef]
- Ebner, M.; Marone, F.; Stampanoni, M.; Wood, V. Visualization and Quantification of Electrochemical and Mechanical Degradation in Li Ion Batteries. Science 2013, 342, 716–720. [Google Scholar] [CrossRef]
- Mahmoudzadeh Andwari, A.; Pesiridis, A.; Rajoo, S.; Martinez-Botas, R.; Esfahanian, V. A review of Battery Electric Vehicle technology and readiness levels. Renew. Sustain. Energy Rev. 2017, 78, 414–430. [Google Scholar] [CrossRef]
- Dubarry, M.; Vuillaume, N.; Liaw, B.Y. Origins and accommodation of cell variations in Li-ion battery pack modeling. Int. J. Energy Res. 2010, 34, 216–231. [Google Scholar] [CrossRef]
- Santhanagopalan, S.; White, R.E. Quantifying Cell-to-Cell Variations in Lithium Ion Batteries. Int. J. Electrochem. 2012, 2012, 395838. [Google Scholar] [CrossRef]
- Chang, L.; Ma, C.; Zhang, C.; Duan, B.; Cui, N.; Li, C. Correlations of lithium-ion battery parameter variations and connected configurations on pack statistics. Appl. Energy 2023, 329, 120275. [Google Scholar] [CrossRef]
- Pordanjani, A.H.; Aghakhani, S.; Afrand, M.; Zhang, P.; Tang, R.; Mahian, O.; Wongwises, S.; Rashidi, M.M. Thermo-electrochemical simulation of the cooling process in a compact battery pack considering various configurations. J. Power Sources 2023, 553, 232112. [Google Scholar] [CrossRef]
- Liu, X.; Ai, W.; Naylor Marlow, M.; Patel, Y.; Wu, B. The effect of cell-to-cell variations and thermal gradients on the performance and degradation of lithium-ion battery packs. Appl. Energy 2019, 248, 489–499. [Google Scholar] [CrossRef]
- Song, Z.; Yang, N.; Lin, X.; Pinto Delgado, F.; Hofmann, H.; Sun, J. Progression of cell-to-cell variation within battery modules under different cooling structures. Appl. Energy 2022, 312, 118836. [Google Scholar] [CrossRef]
- Hosseinzadeh, E.; Arias, S.; Krishna, M.; Worwood, D.; Barai, A.; Widanalage, D.; Marco, J. Quantifying cell-to-cell variations of a parallel battery module for different pack configurations. Appl. Energy 2021, 282, 115859. [Google Scholar] [CrossRef]
- Shang, Y.; Zhu, C.; Fu, Y.; Mi, C.C. An Integrated Heater Equalizer for Lithium-Ion Batteries of Electric Vehicles. IEEE Trans. Ind. Electron. 2019, 66, 4398–4405. [Google Scholar] [CrossRef]
- Wang, L.; Cheng, Y.; Zhao, X. Influence of connecting plate resistance upon LiFePO4 battery performance. Appl. Energy 2015, 147, 353–360. [Google Scholar] [CrossRef]
- Wu, B.; Yufit, V.; Marinescu, M.; Offer, G.J.; Martinez-Botas, R.F.; Brandon, N.P. Coupled thermal–electrochemical modelling of uneven heat generation in lithium-ion battery packs. J. Power Sources 2013, 243, 544–554. [Google Scholar] [CrossRef]
- Offer, G.J.; Yufit, V.; Howey, D.A.; Wu, B.; Brandon, N.P. Module design and fault diagnosis in electric vehicle batteries. J. Power Sources 2012, 206, 383–392. [Google Scholar] [CrossRef]
- Grün, T.; Stella, K.; Wollersheim, O. Influence of circuit design on load distribution and performance of parallel-connected Lithium ion cells for photovoltaic home storage systems. J. Energy Storage 2018, 17, 367–382. [Google Scholar] [CrossRef]
- Lv, J.; Lin, S.; Song, W.; Chen, M.; Feng, Z.; Li, Y.; Ding, Y. Performance of LiFePO4 batteries in parallel based on connection topology. Appl. Energy 2019, 252, 113407. [Google Scholar] [CrossRef]
- Hosseinzadeh, E.; Marco, J.; Jennings, P. Combined electrical and electrochemical-thermal model of parallel connected large format pouch cells. J. Energy Storage 2019, 22, 194–207. [Google Scholar] [CrossRef]
- Hosseinzadeh, E.; Odio, M.X.; Marco, J.; Jennings, P.A. Unballanced Performance of Parallel Connected Large Format Lithium Ion Batteries for Electric Vehicle Application. In Proceedings of the 2019 International Conference on Smart Energy Systems and Technologies (SEST), Porto, Portugal, 9–11 September 2019; pp. 1–6. [Google Scholar]
- Chang, L.; Duan, B.; Li, P.; Zhang, K.; Zhang, C.; Xiao, L. In Influence of interconnect resistances on parallel-connected LiFePO4 cells performance. In Proceedings of the 2019 3rd Conference on Vehicle Control and Intelligence (CVCI), Hefei, China, 21–22 September 2019; pp. 1–4. [Google Scholar]
- Li, Y.; Lan, B.; Luo, J. In Modeling and Simulation Evaluation of Current and Temperature Inconsistency in Parallel Connected Lithium-Ion Batteries. In Proceedings of the 2018 International Conference on Information Systems and Computer Aided Education (ICISCAE), Changchun, China, 6–8 July 2018; pp. 12–18. [Google Scholar]
- Baumann, M.; Wildfeuer, L.; Rohr, S.; Lienkamp, M. Parameter variations within Li-Ion battery packs–Theoretical investigations and experimental quantification. J. Energy Storage 2018, 18, 295–307. [Google Scholar] [CrossRef]
- Zhang, Y.; Zheng, J.; Lin, S.; Bai, F.; Tanveer, W.H.; Cha, S.; Wu, X.; Feng, W. Nonuniform current distribution within parallel-connected batteries. Int. J. Energy Res. 2018, 42, 2835–2844. [Google Scholar] [CrossRef]
- Chang, L.; Ma, C.; Luan, C.; Sun, Z.; Wang, C.; Li, H.; Zhang, Y.; Liu, X. Influence of the Assembly Method on the Cell Current Distribution of Series–Parallel Battery Packs Based on Connector Resistance. Front. Energy Res. 2022, 10, 804303. [Google Scholar] [CrossRef]
- Rumpf, K.; Rheinfeld, A.; Schindler, M.; Keil, J.; Schua, T.; Jossen, A. Influence of cell-to-cell variations on the inhomogeneity of lithium-ion battery modules. J. Electrochem. Soc. 2018, 165, A2587. [Google Scholar] [CrossRef]
- Brand, M.J.; Hofmann, M.H.; Steinhardt, M.; Schuster, S.F.; Jossen, A. Current distribution within parallel-connected battery cells. J. Power Sources 2016, 334, 202–212. [Google Scholar] [CrossRef]
- Luan, C.; Ma, C.; Wang, C.; Chang, L.; Xiao, L.; Yu, Z.; Li, H. Influence of the connection topology on the performance of lithium-ion battery pack under cell-to-cell parameters variations. J. Energy Storage 2021, 41, 102896. [Google Scholar] [CrossRef]
- Plett, G.L.; Klein, M.J. In Simulating Battery Packs Comprising Parallel Cell Modules and Series Cell Modules. In Proceedings of the EVS 24, Stavanger, Norway, 13–16 May 2009. [Google Scholar]
- Brand, M.J.; Schmidt, P.A.; Zaeh, M.F.; Jossen, A. Welding techniques for battery cells and resulting electrical contact resistances. J. Energy Storage 2015, 1, 7–14. [Google Scholar] [CrossRef]
- Sadeghian, A.; Iqbal, N. A review on dissimilar laser welding of steel-copper, steel-aluminum, aluminum-copper, and steel-nickel for electric vehicle battery manufacturing. Opt. Laser Technol. 2022, 146, 107595. [Google Scholar] [CrossRef]
- Shui, L.; Chen, F.; Garg, A.; Peng, X.; Bao, N.; Zhang, J. Design optimization of battery pack enclosure for electric vehicle. Struct. Multidiscip. Optim. 2018, 58, 331–347. [Google Scholar] [CrossRef]
- Fill, A.; Koch, S.; Pott, A.; Birke, K.-P. Current distribution of parallel-connected cells in dependence of cell resistance, capacity and number of parallel cells. J. Power Sources 2018, 407, 147–152. [Google Scholar] [CrossRef]
- Fill, A.; Koch, S.; Birke, K.P. Analytical model of the current distribution of parallel-connected battery cells and strings. J. Energy Storage 2019, 23, 37–43. [Google Scholar] [CrossRef]


| Structure | Parameter | Dimension/mm | |
|---|---|---|---|
| Single cell | Length | 70 | |
| Diameter | 21 | ||
| Cell distance | 2.1 | ||
| Nickel plate of parallel module | Nickel plate 1 | Length | 75.3 |
| Width | 29.1 | ||
| Nickel plate 2 | Length | 75.3 | |
| Width | 6 | ||
| Nickel plate 3 | Length | 167.7 | |
| Width | 6 | ||
| Thickness | 0.1 | ||
| Cell tabs | Thickness | 1 | |
| Diameter | 6 | ||
| Parameter | Nominal/Ah | Ohmic Resistance/ | Polarization Resistance/ | Time Constant/s |
|---|---|---|---|---|
| Value | 4.82 | 25.2 | 17.3 | 34 |
| Single Cell | Cell 1 | Cell 2 | Cell 3 | Cell 4 |
|---|---|---|---|---|
| Calculation value/C | 1.09 | 0.91 | 0.91 | 1.09 |
| Simulation value/C | 1.07 | 0.93 | 0.93 | 1.07 |
| Relative error | 1.87% | 2.15% | 2.15% | 1.87% |
| Single Cell | 1 | 2 | 3 | 4 | 5 | 6 | 7 | 8 |
|---|---|---|---|---|---|---|---|---|
| Ck of pack configuration 1/Ah | 4.015 | 4.019 | 4.019 | 4.015 | 4.015 | 4.019 | 4.019 | 4.015 |
| Ck of pack configuration 2/Ah | 4.069 | 3.960 | 3.962 | 4.075 | 4.070 | 3.964 | 3.963 | 4.072 |
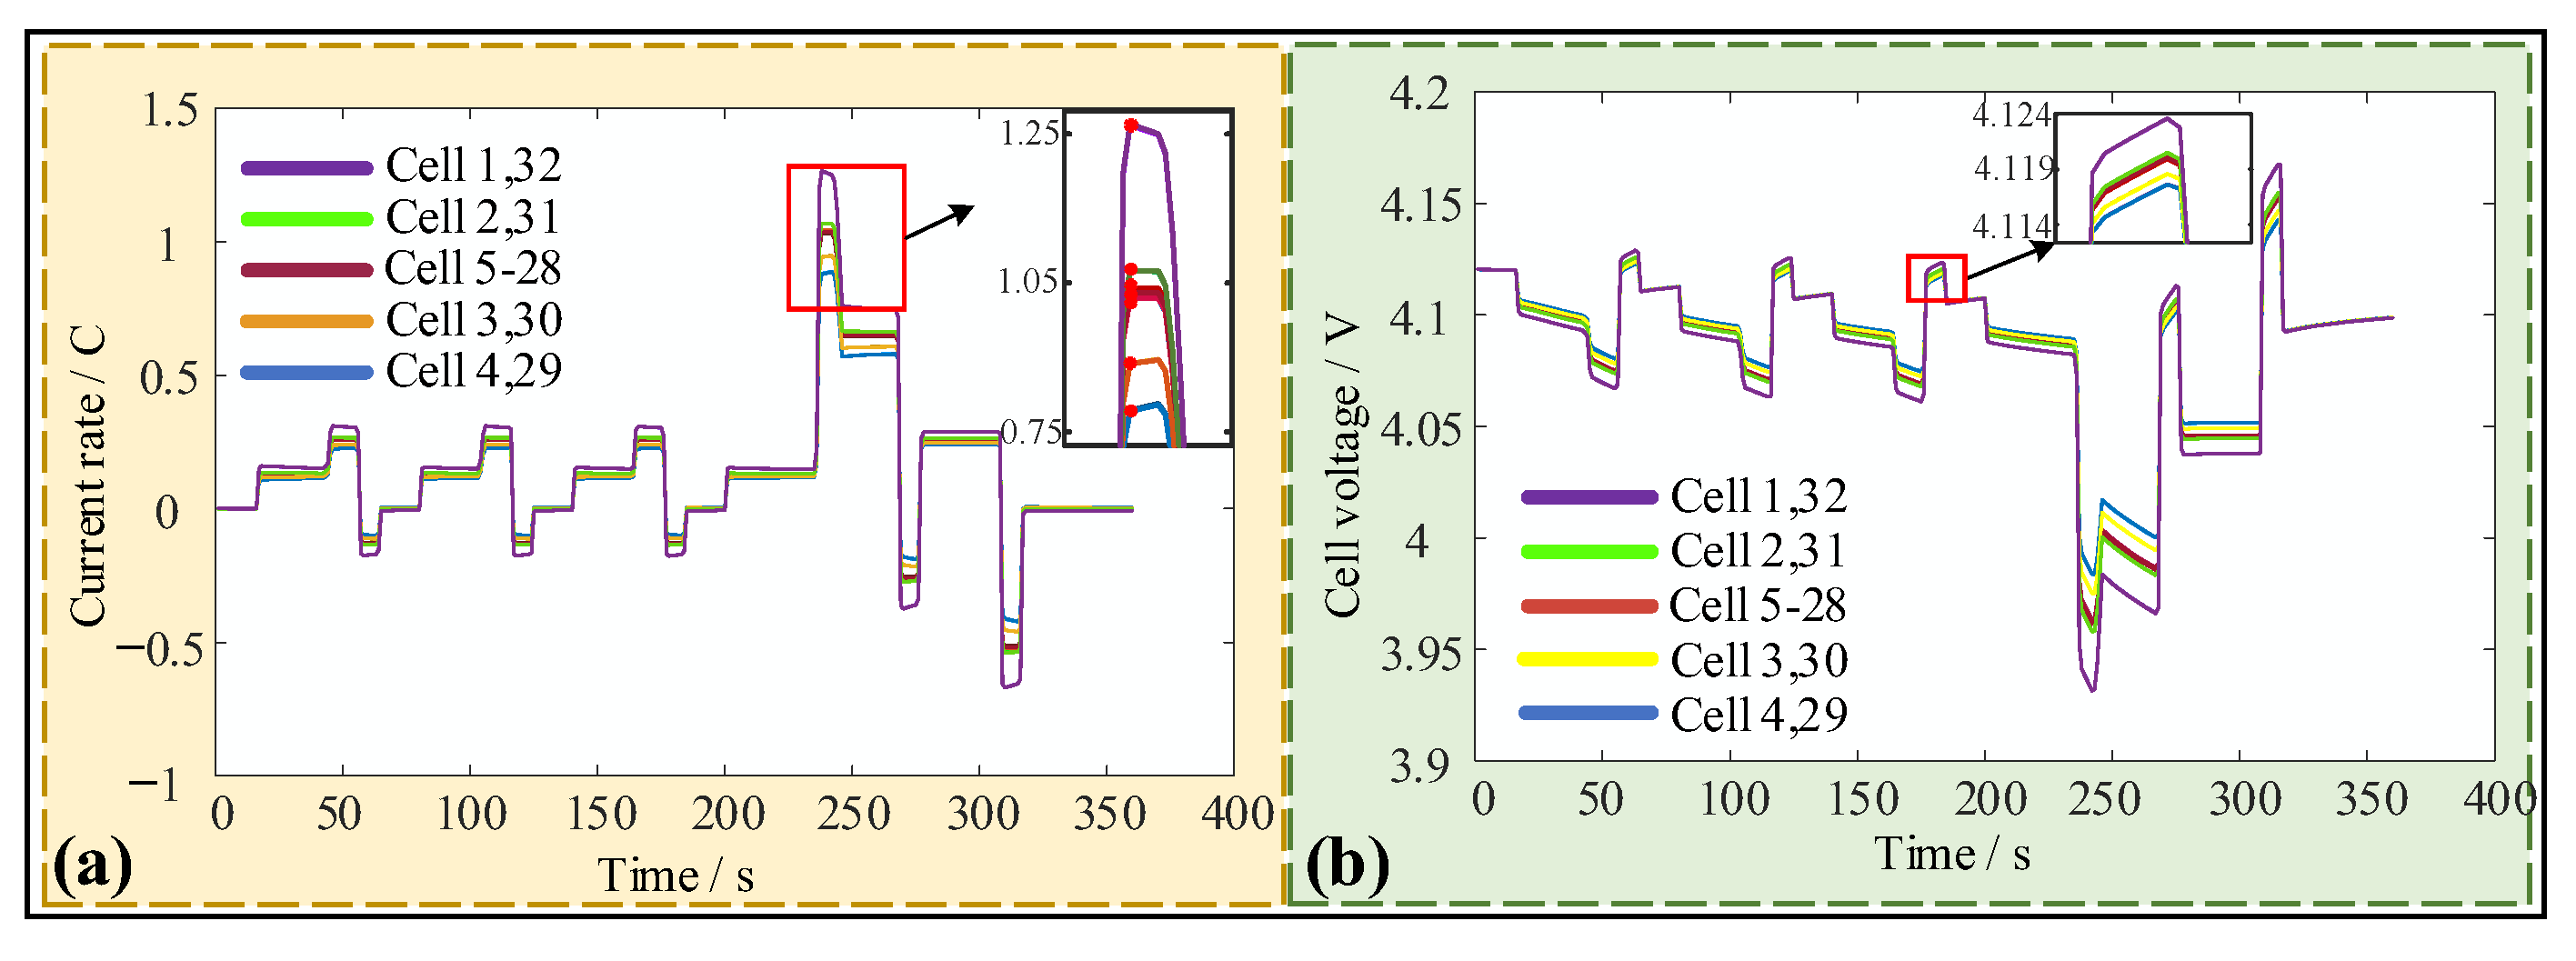
| Moment/s | Cell 5–28 (Average Current)/A | Cell 29 Current/A | Cell 32 Current/A |
|---|---|---|---|
| 237 | 4.83 | 4.07 | 5.90 |
| 238 | 5.00 | 4.23 | 6.09 |
| 239 | 5.00 | 4.24 | 6.08 |
| 240 | 5.00 | 4.25 | 6.06 |
| 241 | 5.00 | 4.26 | 6.04 |
| 242 | 5.00 | 4.27 | 6.02 |
| 243 | 4.93 | 4.23 | 5.93 |
| 244 | 4.67 | 4.02 | 5.58 |
| Quantity of Module Collector | Cell 1 | Cell 2 | Cell 3 | Cell 4 | |
|---|---|---|---|---|---|
| Current/A | Single module collector | 0.025 | 0.019 | 0.016 | 0.015 |
| Double module collectors | 0.028 | 0.026 | 0.026 | 0.028 |
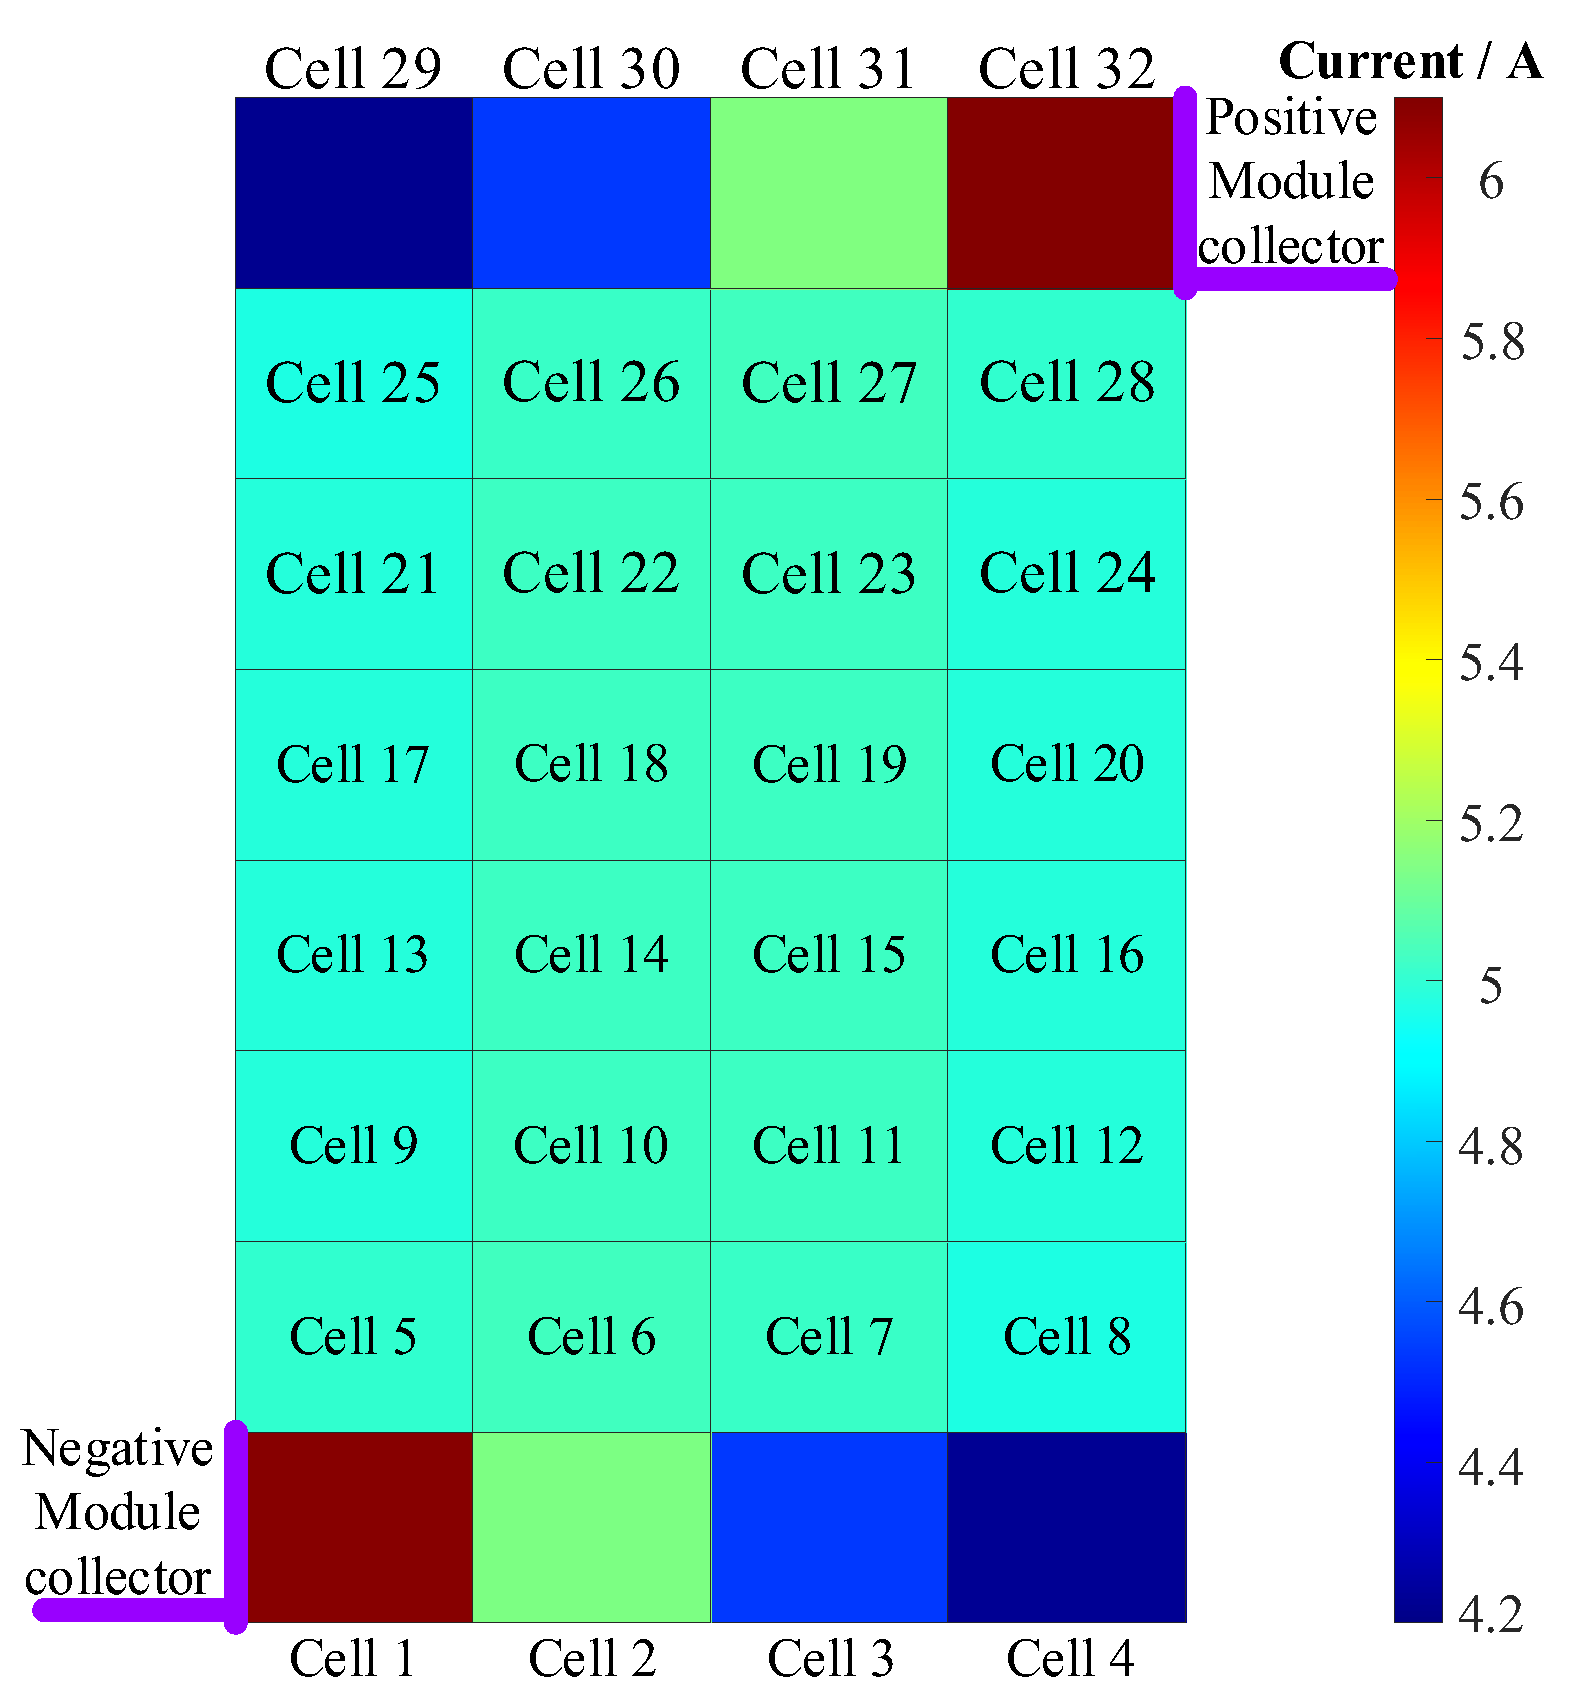
| Quantity of Module Collector | Single Cell | Current/A | |
|---|---|---|---|
| Single module collector | Cell 29 | 4.23 | 43.97% |
| Cell 32 | 6.09 | ||
| Double module collectors | Cell 29 | 5.14 | 6.64% |
| Cell 30 | 4.82 |
Disclaimer/Publisher’s Note: The statements, opinions and data contained in all publications are solely those of the individual author(s) and contributor(s) and not of MDPI and/or the editor(s). MDPI and/or the editor(s) disclaim responsibility for any injury to people or property resulting from any ideas, methods, instructions or products referred to in the content. |
© 2023 by the authors. Licensee MDPI, Basel, Switzerland. This article is an open access article distributed under the terms and conditions of the Creative Commons Attribution (CC BY) license (https://creativecommons.org/licenses/by/4.0/).
Share and Cite
Yu, Z.; Sun, Z.; Chang, L.; Ma, C.; Li, C.; Li, H.; Luan, C.; Al-saidi, M.Y.M. Impact of Multiple Module Collectors on the Cell Current Distribution within the Battery Pack. Batteries 2023, 9, 501. https://doi.org/10.3390/batteries9100501
Yu Z, Sun Z, Chang L, Ma C, Li C, Li H, Luan C, Al-saidi MYM. Impact of Multiple Module Collectors on the Cell Current Distribution within the Battery Pack. Batteries. 2023; 9(10):501. https://doi.org/10.3390/batteries9100501
Chicago/Turabian StyleYu, Zhihao, Zhezhe Sun, Long Chang, Chen Ma, Changlong Li, Hongyu Li, Chunxiao Luan, and Mohammad Y. M. Al-saidi. 2023. "Impact of Multiple Module Collectors on the Cell Current Distribution within the Battery Pack" Batteries 9, no. 10: 501. https://doi.org/10.3390/batteries9100501