Abstract
Real-time monitoring of the state of charge (SOC) of the batteries used in a wide variety of applications is becoming increasingly important, especially given the impetus by the current targets towards “net-zero”. In this research, an advanced approach was used involving fiber Bragg grating (FBG)-based sensors that were developed and implemented for the measurement of the key parameters required to ensure optimum battery performance. In this work, one of the biggest challenges to assess (and then map) the data from the sensor system developed is tackled in order to better understand the key parameters of the battery in an efficient and improved way. It is well known that the relationship between the changes in the resonance wavelength of the FBGs used in the sensor system, arising due to change in the electrical parameters of the battery, is complex and dependent on several different factors. In this work, this effect was evaluated by coupling the sensor data to a data-driven regression model approach that was developed for the measurement of the SOC of the batteries used, and this was obtained directly and conveniently from the FBG data. In this comprehensive study, FBG-based sensors were fabricated and then installed onto the battery, which then was subjected to a range of charging–discharging cycles, following which the electrical parameters of the battery were estimated from recorded data using a black-box machine learning (ML) model. Data-driven regression algorithms were employed for the training of the black-box model. The efficiency of the estimation of the SOC of the battery from the FBG-based sensor data was found to be high, at 99.62% (R2 values of Estimated SOC and True SOC line), creating a very satisfactory result for this key measurement. Thus, the work shows the robustness of the FBG-based sensor system combined with the neural network algorithm as an effective way to evaluate the electrical parameters of the battery, which is particularly important, as no physical/electrochemical/electrical model of the system is thus required.
1. Introduction
Renewable energy sources are widely favored as an effective way to limit the use of fossil-fuel-based energy sources, to minimize carbon emissions, and to move more rapidly towards “net zero”. Therefore, uses of energy storage devices such as batteries and super-capacitors have been increasing seemingly exponentially over the last decade [1]. Such devices are being widely employed across the world in fully electric vehicles, hybrid electric vehicles [2], wireless smart sensors, electronic gadgets, unmanned vehicles, and in biomedical instrumentation, and the variety and scope of such applications continue to develop [3]. Thus, the online monitoring of the performance of the battery has become critically important as the wide variety of uses continues to expand. A battery management system (BMS) for such an application can be considered as a control unit that can be modeled to monitor and thus where appropriate confirm the optimum mode of operation of the battery [4]. The estimation of the state of charge (SOC) and state of health (SOH) of a battery used in one of the applications mentioned is a critical task for a modern, effective BMS [5,6]. Most of the BMSs available today rely on monitoring electrical parameters, and thus, their operations are limited by the inevitable drift in the ambient temperature of the environment in which the battery is used and electromagnetic interference that can easily be introduced, resulting in sources of noise in the measurement. Key parameters such as battery voltage, current, and temperature can be collected and processed in the BMS and in this way estimate the SOC. As a result, the SOC data can be used directly to assess the remaining available energy and to form the basis for an informed judgement of the battery’s life cycle.
Over the years, numerous techniques have been proposed, and many are being adopted for the measurement of the SOC of batteries. The open-circuit voltage [7], the ampere–hour integral method [8], the Kalman filter [9], the neural network method [10], and the fuzzy control method [11] are the most used methods for the estimation of the SOC. However, the estimation of this parameter is often limited by the error in making the measurement of the electrical parameters, and the influence of polarization of the voltage of the battery is a key source of error. Accurate open-circuit voltage (OCV) measurement requires a long “standing time” before proper measurement of a LiFePO4 battery is possible, which limits the method [12]. An empirical model (the equivalent circuit model) and the Kalman filter algorithm, can be used to estimate the SOC more accurately, but this is limited, as it depends strictly on the physical model, and in most of the cases considered, the measured noise is assumed to be “white” noise (where in practical applications, some random noise can be expected to be added to the measurement system [13]). The neural network (NN) method can be used to estimate the SOC from the electrical parameters, where a complex nonlinear model can be developed after training the network with the input data. Parameters such as battery voltage, current, and capacity are used as input data, where the SOC is fixed as the output parameter used for the training of the NN [10]. It has been observed that the optimum training of the system depends on the input parameters, the model structures, and the training dataset used [14]. Over the years, a variety of different algorithms have been used for the estimation of SOC to ensure the highest accuracy and greatest flexibility [10,11,14,15]. Recently, a two-stage aging trajectory prediction was demonstrated to have a powerful transfer learning technique. A convolutional NN (CNN) model was developed for the estimation of the capacity of the battery [16]. However, as mentioned earlier, the electrical parameters are often perturbed due to noise that arises from factors such as temperature drift, the surrounding EMI, and the general white noise present from the resistive circuits involved. It is an ideal solution if the inputs of the neural network are robust and are immune to any sort of noise from the surroundings.
An innovative optical sensor approach thus forms a key component of the BMS. Researchers have taken advantage of its facility for the multiplexing of the sensors, its inherent immunity to electromagnetic interference, and the ease with which it can readily be attached to the battery, giving the benefits of a light weight and relatively small size [17,18,19]. Effective and easy monitoring of temperature and strain is important for enhanced safety in the operation of the battery. The sensors attached to the batteries in this way can thus protect them and the equipment to which they are connected before thermal runaway occurs or abnormal stress is seen due to malfunctioning of the system [19,20,21,22].
While optical-fiber-based evanescent wave, optical fiber interferometer, and distributed optical fiber sensor techniques [17,18] have been reported in the literature, fiber Bragg grating (FBG)-based systems show significant advantages, and these have been exploited by authors in previous works, for example, [20,21,22,23]. FBG-based sensors have been used for monitoring temperature and strain in several different types of battery, such as the “standard” lithium battery, the prismatic lithium-ion (Li-ion) battery (LiFeO4) [19], the lithium sulfur battery [20], the anode free lithium-ion battery [21,22], and the Li-ion pouch cell (LiMn2O4) [22], for example. The FBG sensors used were typically embedded into the battery [20,22] and in that way work quite well, without any observable, significant degradation of the battery. In some of the papers published, the FBG sensors used were attached to the external surface of the battery [21,23]. It was clear that along with the measurement of the key parameters that underpin the safety of the battery, further measurements of the SOC and the SOH are of vital importance to ensure efficient and uninterrupted services where battery-driven applications are used. Both strain and temperature can change during the charging/discharging cycles of the battery [24,25,26], and fortunately, the changes occurring in temperature and in strain can be detected by using specially designed FBG-based sensors, with appropriate instrumentation and sensor packaging. FBGs in fibers can be configured into sensors that are responsive to both temperature and strain changes, even when they occur simultaneously.
It has been observed that the change in strain over the surface of the electrode is prominent enough to quantify the parameters of the battery [21,22,23]. As a result, the SOC and SOH of the battery can be estimated from the measured strain by using the changes monitored with the use of the FBG-based system. Proper temperature compensation techniques are used for the discrimination of strain effect from temperature to evaluate the proper strain effects on FBGs [21,22,23]. Interestingly, more recently, polarization-maintained fiber was used to decouple the effect of strain from the temperature [27]. Without the compensation of temperature, the estimation efficiency can also be high, but electrical parameters such as current through the battery/voltage across the battery are required along with FBG sensor data for the estimation of SOC [28]. In one study, FBG-based sensors were used to measure the SOC of the batteries used to drive a model train. A dynamic time-warping algorithm was used for the determination of the SOC of the batteries of the model train from the variation of strain over the surface of the battery. This method works in a satisfactory manner, but change in temperature needs to be compensated so a bit complex in the analysis part [23]. The FBGs used, along with open cavity FPI sensors, demonstrated the prediction of the initiation of thermal runway of the battery [29]. To do so, cell temperature and pressure data were monitored continuously with the sensors as well as key parameters for the prediction of any thermal runway; thus, the thermal state of the cell was continuously monitored with FBG sensor [30].
These sensors are thus valuable for the monitoring of the solid electrolyte interphase (SEI) formation and cell lifetime [30]. In this paper, a further objective was to take advantage of machine learning methods to directly assess the parameters of the battery from FBG data, where the combined effect of change in temperature and strain were encompassed by the change in Bragg wavelength of the sensor.
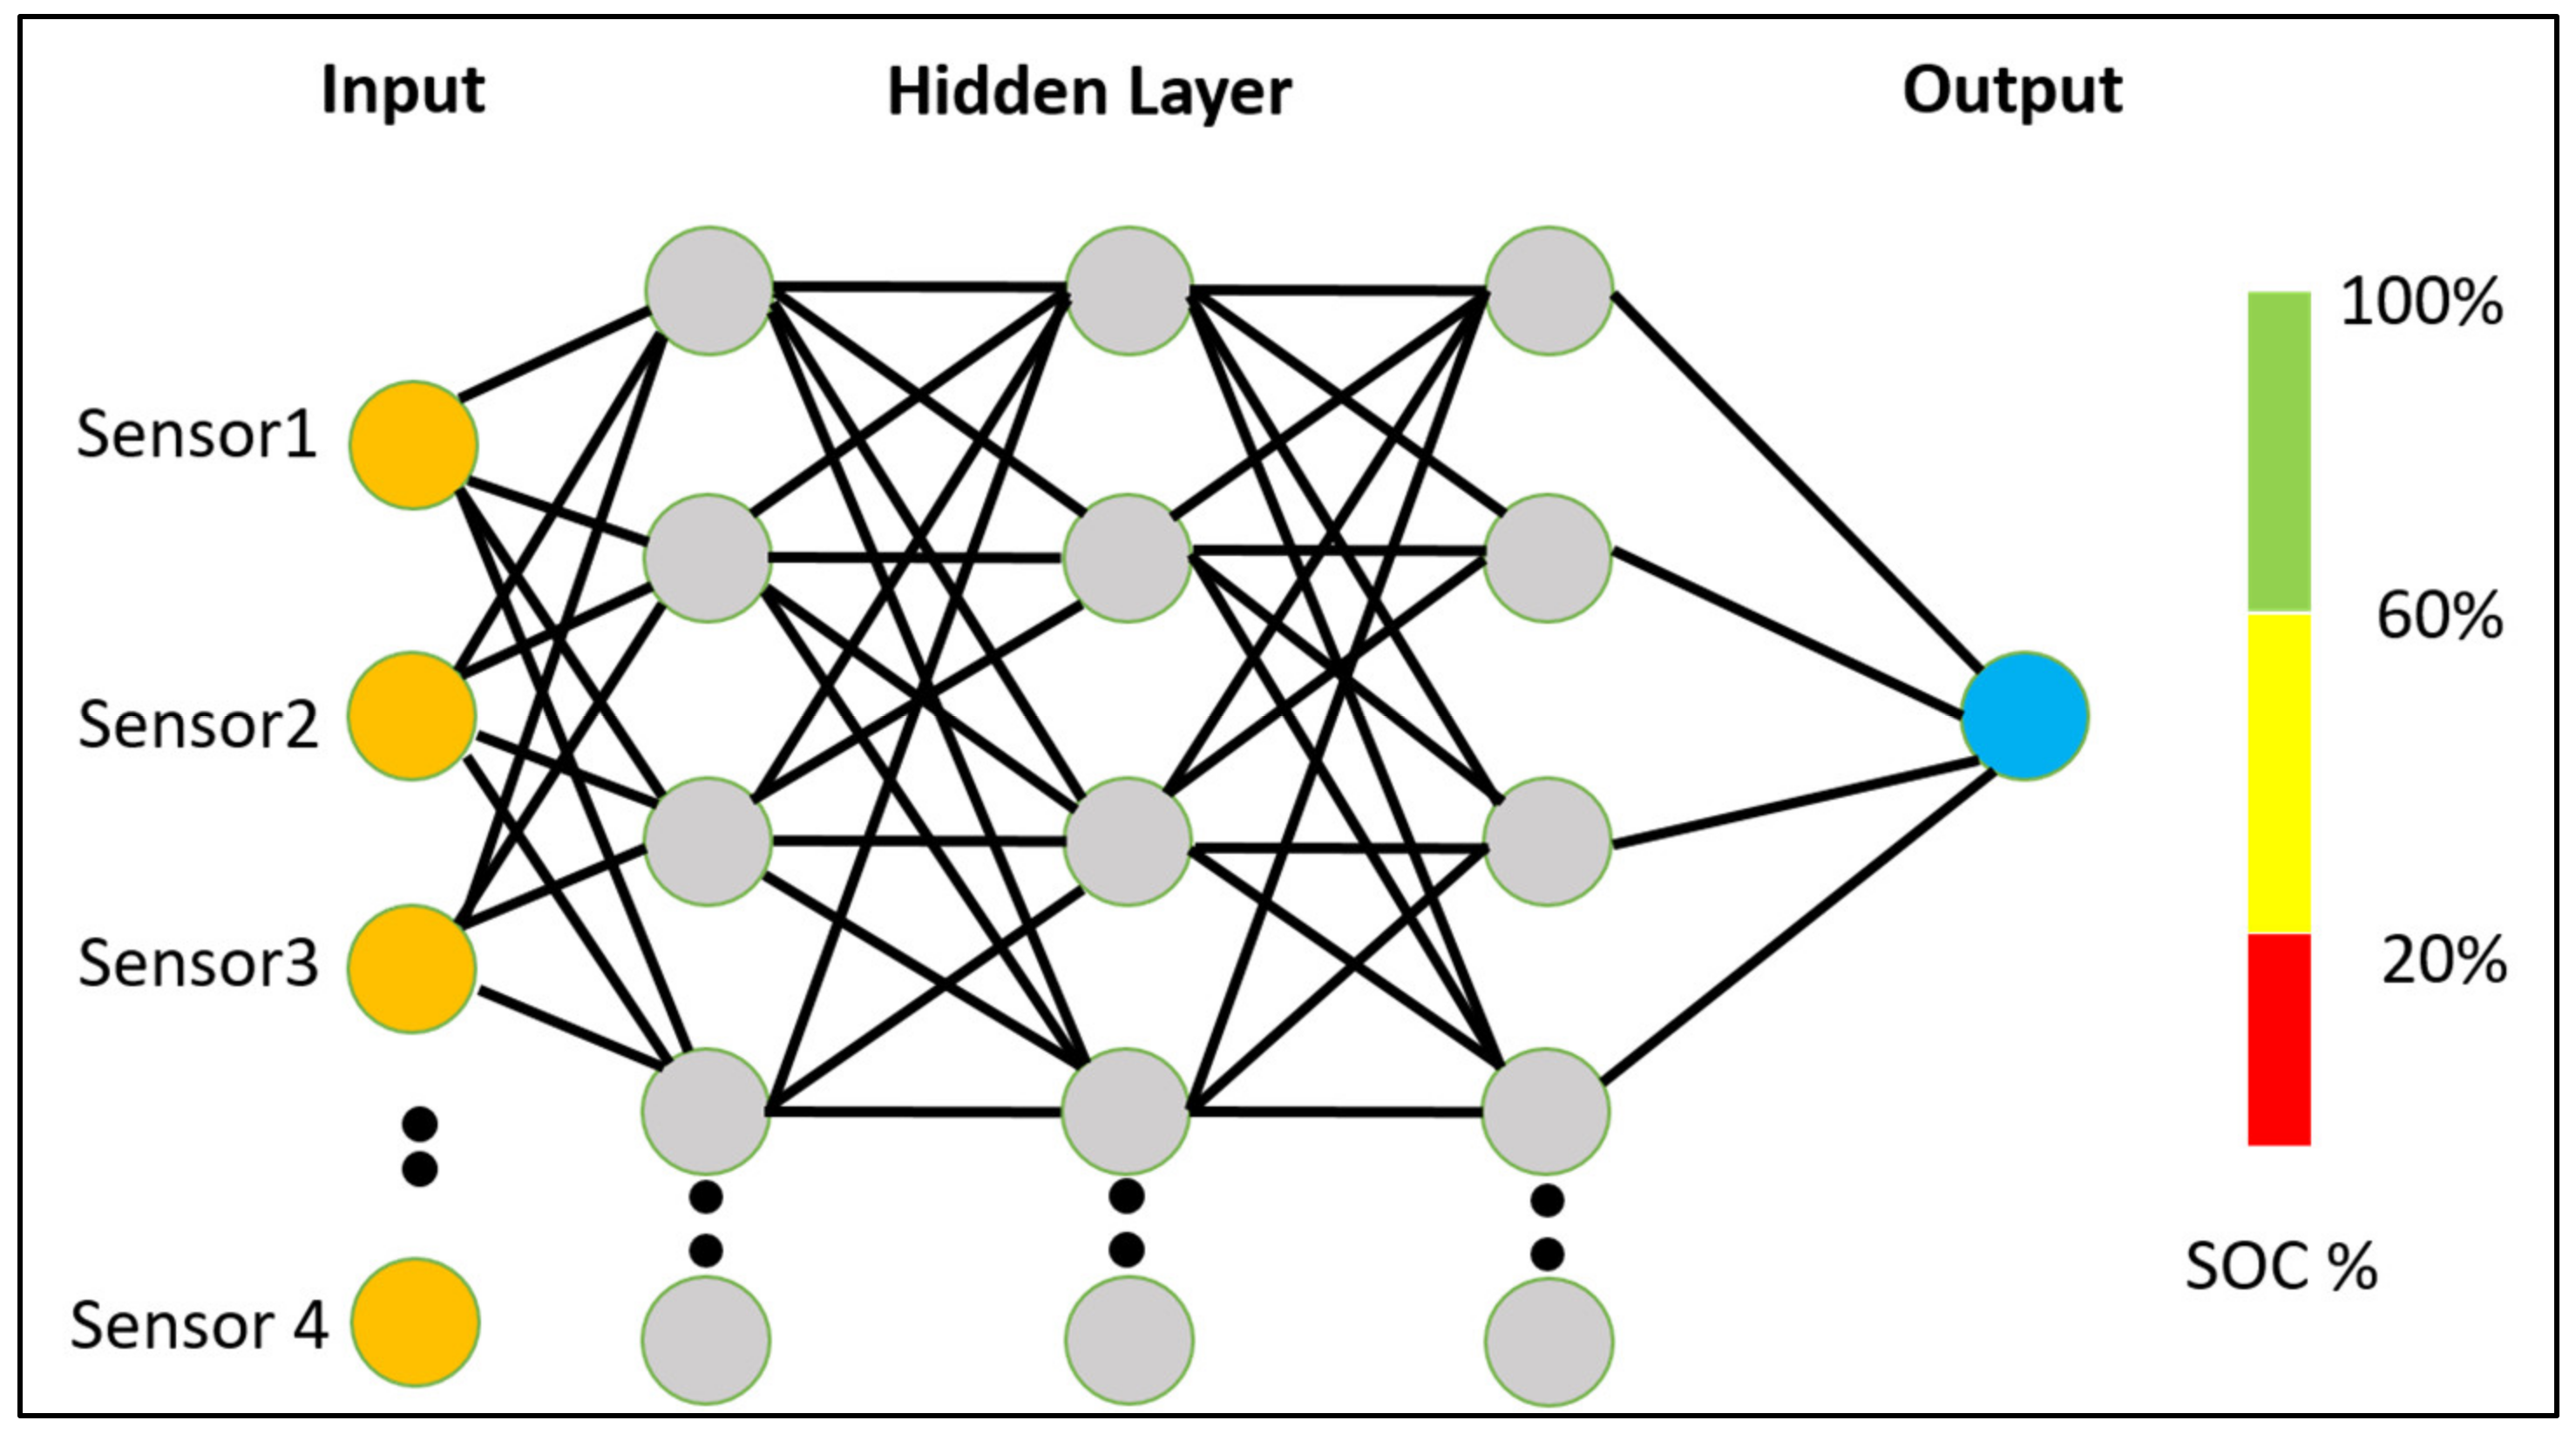
In the undertaken research, a general black-box model was developed, where the inputs from the characteristic wavelengths of the fiber Bragg gratings (FBGs) used were coupled to a NN model that had been trained with the SOC as output. Figure 1 represents a simple graphical representation of black-box ML model, where sensor data are used for the estimation of the SOC of the battery. The developed system can estimate the SOC of the battery from the instrumented FBG sensors over the surface of the battery. In our previous work [23], we established that after proper temperature compensation, DTW algorithms can estimate the SOC with an accuracy of (±5%). However, a well-known limitation of dynamic time-warping algorithms is that if the target/test sequence is slightly different from the training sequence, the algorithm introduces significant error in the estimation. The use of the DTW algorithm requires a large reference dataset and enough memory to allow the result to be evaluated. The response time of such a system is also somewhat higher than that for other machine-learning-based algorithms. The training with reliable sampling reference data is vital for the DTW-based tools, and access to these may not always be available in many industrial situations. Moving forward, the use of FBG-based sensor systems as the basis of an effective SOC monitoring system and combining this with advanced ML technology offers real promise for the future. Thus, in this work, classification and data-driven regression of machine learning tools were used to estimate the key battery electrical parameters of interest, with this being based on the optical data collected. Here, results from such a machine learning tool employing data-driven regression methods are reported and used to supervise the “black-box” model, where no physical model or referencing model was required. In this work, it was shown that raw, FBG-derived data can effectively be utilized for the estimation of the SOC of the battery with the use of a ML-based black-box model, where details of neither any of the electrical parameters nor temperature compensation are required after the training of the black-box model has been undertaken.

Figure 1.
Graphical representation of the ML “black-box” model for the estimation of the SOC from the optical sensors data.
Data-driven regression is a powerful tool for modeling, estimating, and calibrating any scientific and engineering measurement system, as no physical modeling is required. A data-driven regression model was used to optimize the wind turbine power output [31], and bidirectional long short-term memory (BiLSTM) was used to perform fiber channel modeling for on–off keying and pulse amplitude modulation signals [32] as well as calibrating galvanometric laser scanners [33]. Further, a data-driven model of an FBG-based sensor system is being used for shape sensing and for the estimation of distal-end positioning of a surgical continuum manipulator [34]. The technique of data-driven regression is also being used in designing glasses with desirable optical properties [35]; a data-driven model has also been used to estimate depth for applications in optical micro robot manipulation [36], in prognostic techniques for high-power white LEDs [37], and in several other areas. Some early results of the estimation of the SOC of batteries from the use of the FBG sensors were published previously by other authors [38]. However, this current work expands on this significantly, where more general methods were described and presented. In summary, in this work (and for the first time, to our knowledge), the robustness of the FBGs written into the optical fiber, coupled to the flexibility of the data-driven NN model, was used for the estimation of the SOC of a battery. A linear algorithm, a support vector machine algorithm, and decision tree algorithms were explored for use and assessed in terms of their estimation efficiency. Finally, a “black-box” NN model was optimized, with an demonstrated estimation efficiency of 99.62%. The RMSE error for the estimation of SOC was determined to be 0.5461.
2. Sensor Design and Instrumentation
A relatively simple set-up was used in the laboratory to demonstrate the design and then show the performance of the sensor system developed in this work. The aim was to create a system that could readily be “scaled up” to a much larger number of batteries and thus create a quasi-distributed fiber-optic-based system, one in which the spacing between the grating sensors used could be increased up to hundreds of meters as needed for some specific applications. In this laboratory evaluation to demonstrate the principle on a small scale, three FBGs were used to form each sensor rosette structure, and this was mounted on the surface of the battery to measure the strain induced by normal battery use. Here, FBG-based sensors were employed in the experiments, and cylindrical batteries (type 18650) were used for the demonstration of different charging–discharging cycles that were monitored. The FBG-based sensors that were used were specially fabricated using light from a high-power semiconductor Nd-YAG laser by writing the gratings as required by the design into commercially available fibers (type PS1250—Fibercore), employing three different commercially available phase masks (Ibsen Photonics) for the fabrication of the three sensors with different Bragg reflection wavelengths used in the system. The lithium-ion batteries placed under test were instrumented with the FBG-based sensor rosettes in the way described. To do so, a UV-cured epoxy glue (Bostik Born2Bond light lock gel, cyanoacrylate instant adhesive, with viscosity 30,000–45,000 cP and bond strength ~5 MPa) was applied over the battery surface to arrange the sensors in a 45° rosette structure. A commercial UV light source (Dymax, Bluewave QX4) was used to illuminate the area and to cure the glue spot, where the intensity of the UV light and the timing of curing was optimized for the specific amount of glue used in the attachment of the FBGs to the battery. Then, to protect the sensors, a further, different epoxy layer (Duralco 4525-IP Resin and hardener, electrically resistant epoxy) was used.
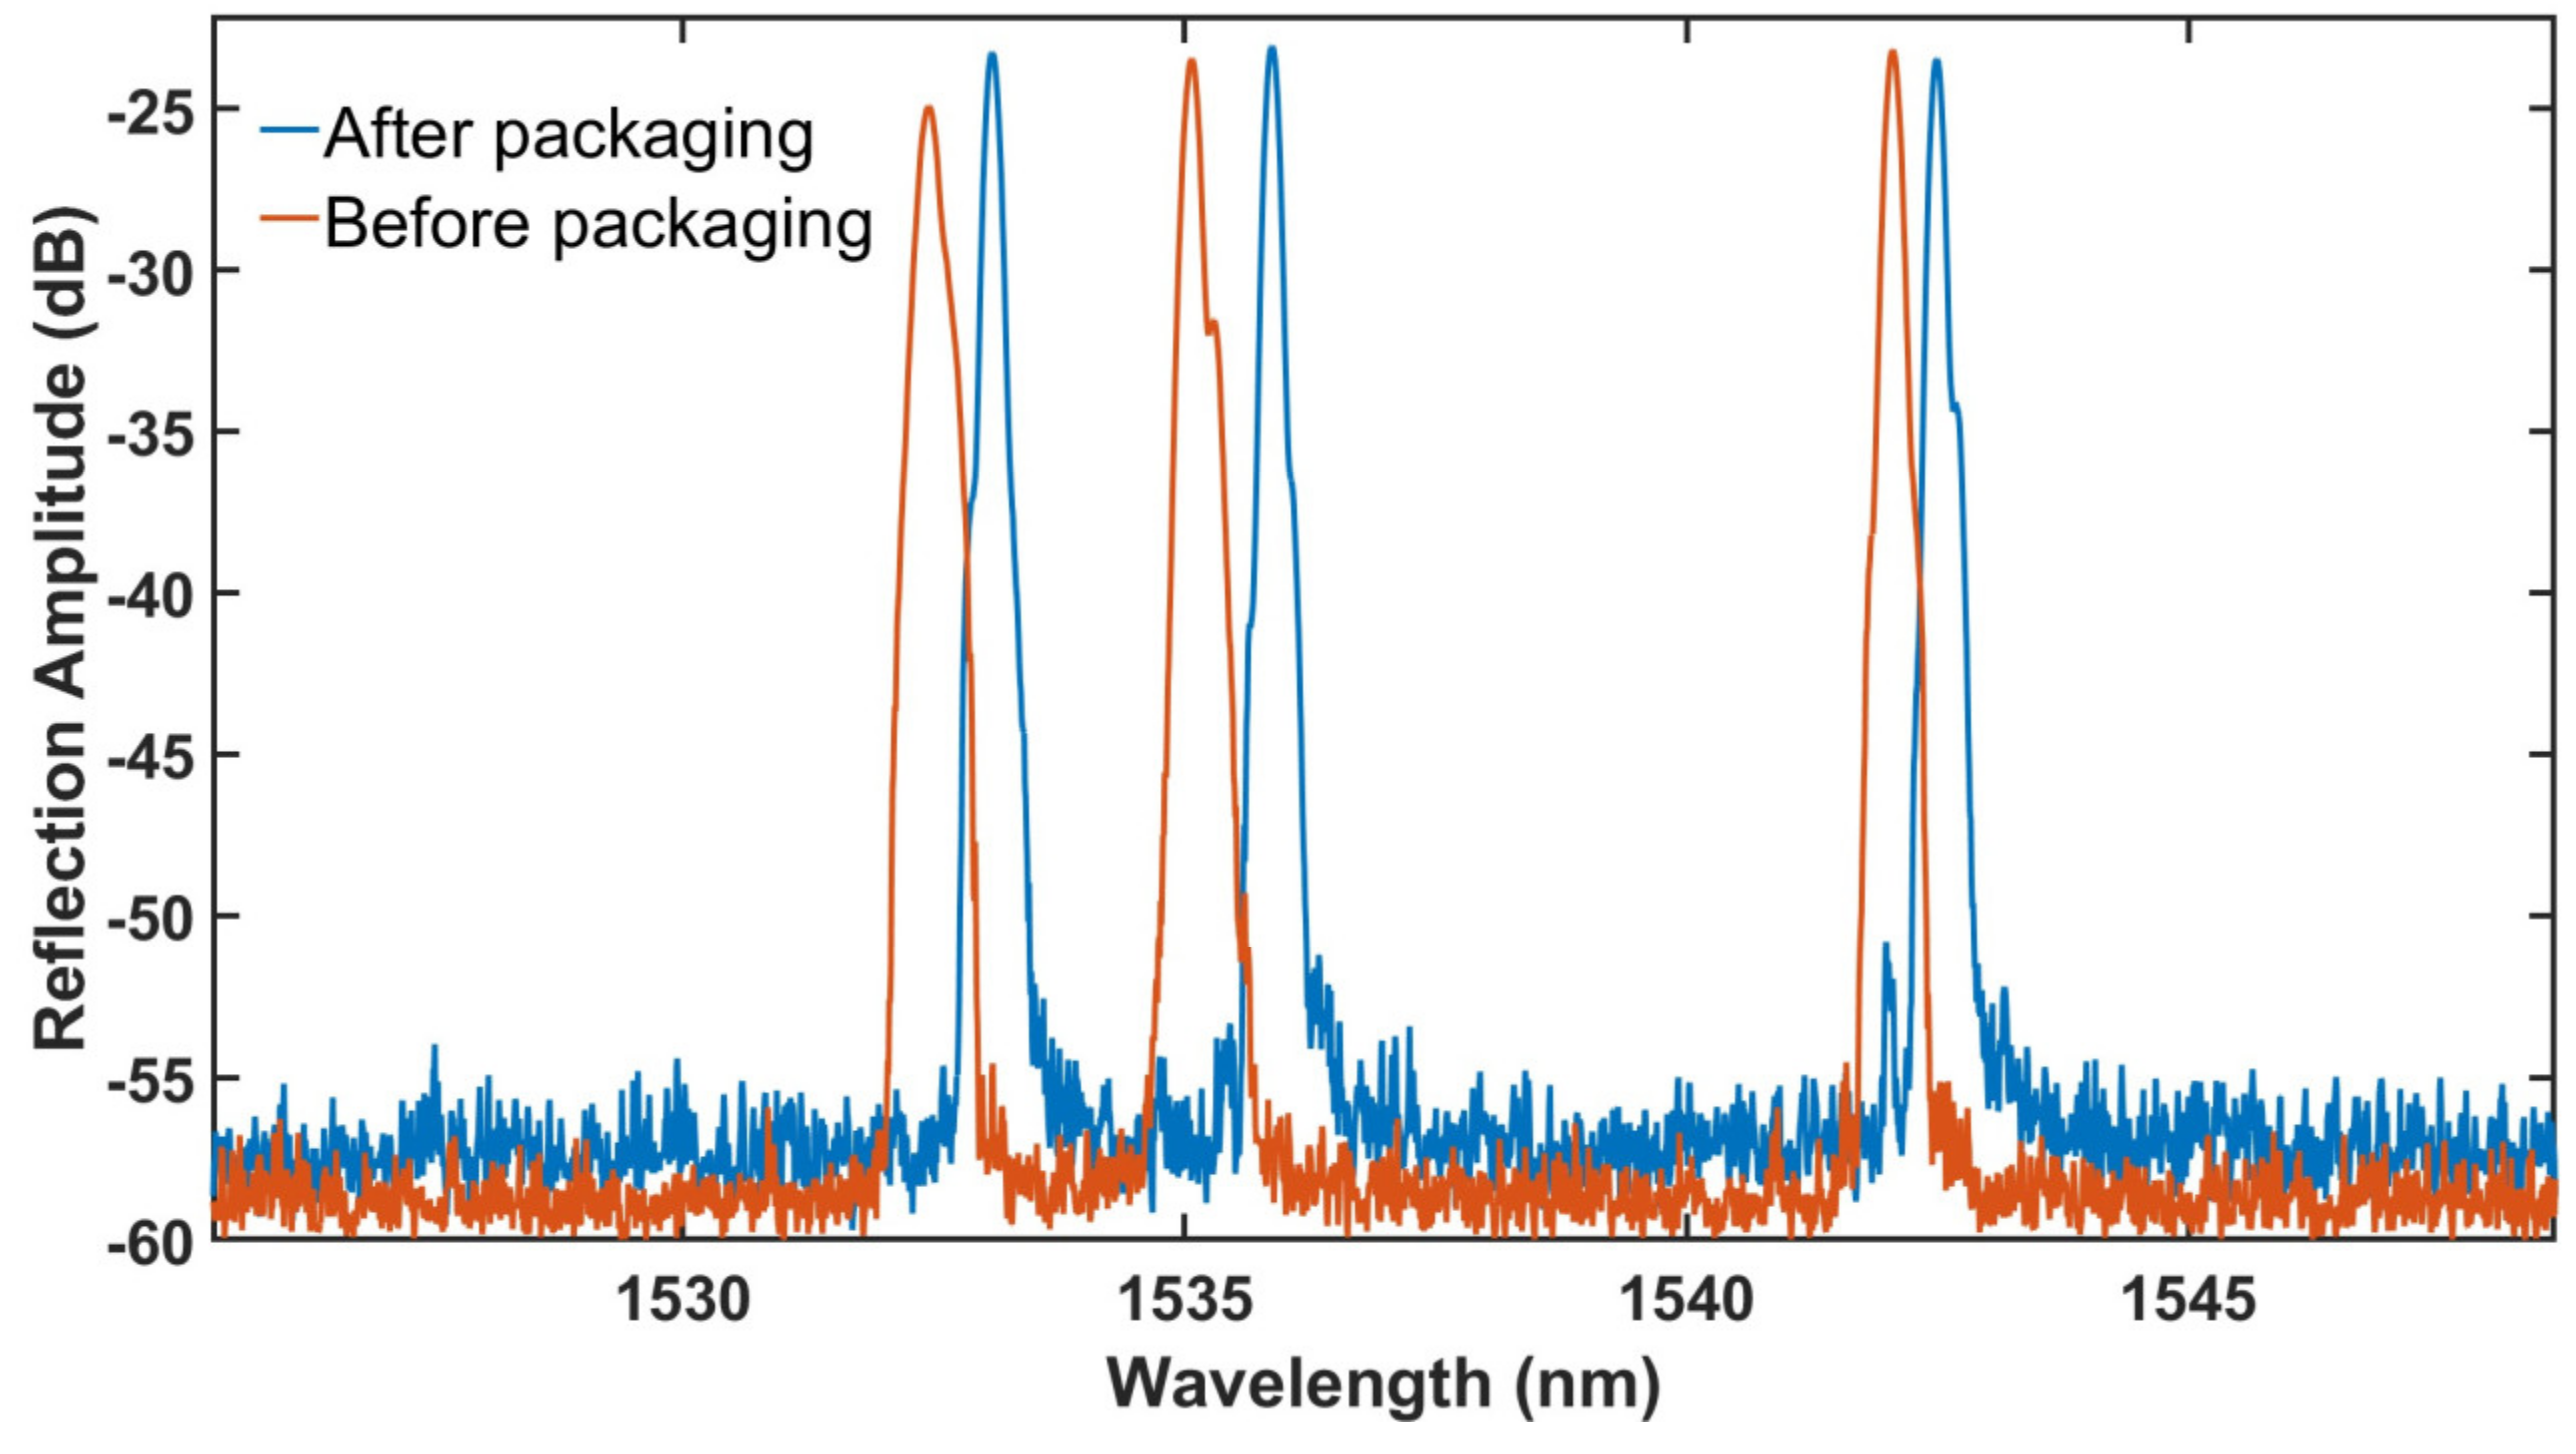
The sensor arrangement employed is shown in Figure 2. The diameter of the battery was 18 mm, so optimizing the length of the fiber containing the FBGs was important for the best packaging and overall instrumentation. In this particular case, the length of the FBG grating was ~4 mm. Two batteries were instrumented with 3 FBG sensors each in the fiber to form a rosette structure over the surface of the battery. The same wavelengths of the FBGs were used in a similar arm of each of the rosettes used. To “read out” the performance of the FBGs, a commercially available Micron-Optics Sm-130 was chosen as the interrogator (with an operating frequency of 1 Hz, as this is more than adequate for this purpose). In this laboratory investigation, the FBG sensor system was carefully attached using a selected epoxy glue to create an intimate contact with the cylindrical surfaces of the Li-ion batteries. The recorded spectrum of the instrumented sensors before and after attachment to the battery is shown in Figure 3. The three reflection peaks of FBG sensors before instrumentation and packaging were 1532.43 nm, 1535.18 nm, and 1542.11 nm, respectively, which form the individual arms of the rosette structure; after attachment to the surface of the battery with spot glue and epoxy, the recorded spectrum showed reflection peaks at 1533.17 nm, 1535.92 nm, and 1542.53 nm, respectively.
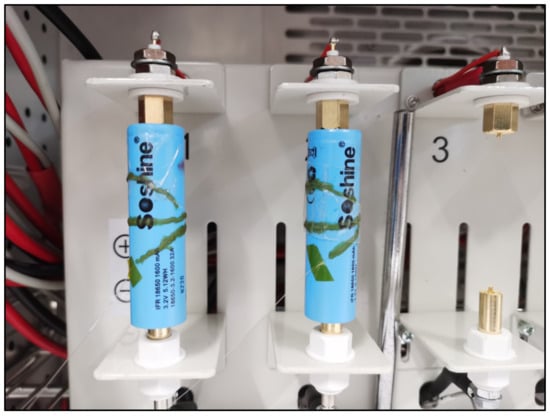
Figure 2.
Photograph of the battery cycling set-up, with embedded FBG-based sensor system installed inside the BTS 4000 environmental chamber.
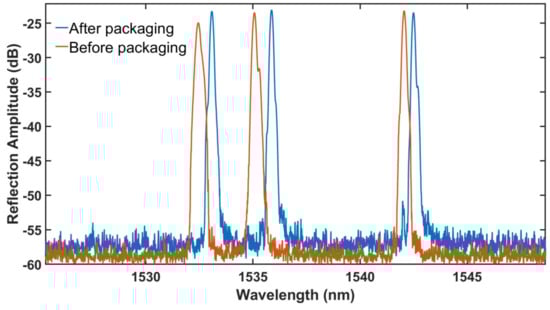
Figure 3.
Recorded spectrum of FBG rosette sensors after and before packaging with the LiFePO4 battery.
The FBGs used in the sensor system did not experience any excess stress/strain before being attached and packaged onto the battery, but while applying the glue and the epoxy, the fibers experienced a certain level of strain, as it was necessary to stretch the fiber across the curved, cylindrical surface of the battery to make sure the attachment was strong and uniform. To do so, a UV-cured spot of glue was used at several different positions along the length of the fiber, and the final coating of epoxy was then used to make the attachment stronger. This whole process created a “pre-strain” effect, so a blue shift was observed for each of the FBGs before and after packaging. However, this was not a problem, as the device was then (re-)calibrated for “zero strain” after attachment and bonding of the fibers.
After the packaging and attachment, the instrumentation was ready for use, and the batteries were placed in an assembly and their performance measured using a constant-current/constant-voltage (CC-CV) charging procedure, followed by a CC discharge. The BTS 4000 battery test system was used for the cycling of the battery and to record the current and voltage. The corresponding current and voltage were recorded over a long period of time during consecutive charging–discharging cycles. The data from the optical interrogator system were also recorded simultaneously to measure the change in Bragg wavelengths during continuous charging and discharging cycles. The strain and temperature of the battery were expected to vary within a battery cell during the continuous charging–discharging cycles. A stable shift in the Bragg wavelengths of the sensors was found with continuous charging–discharging cycles. The Bragg reflection wavelength varies while both the strain and temperatures of the surface of the batteries are altered during charging–discharging cycles. With the charging–discharging cycles, the temperature and strain of the battery vary, which in turn alters the refractive index of the core of the fiber through the strain optic coefficient and electrooptic coefficient of the battery, resulting a stable shift in the Bragg wavelength of each sensor [39].
In this present work, an aim was set to estimate the SOC of the battery directly from the Bragg reflection wavelengths obtained from the sensor system used without any temperature compensation or the knowledge of any other electrical parameters. A “black-box” model was first trained with FBG reflection peak wavelength as input and the SOC derived from the measured current as output. The machine learning algorithms for data-driven regression techniques were employed to evaluate the SOC of the battery from the Bragg grating data obtained. The detailed process of how this was performed is discussed in the subsequent subsections.
2.1. Theoretical Background
The Bragg wavelength of any FBG that is a part of the sensor system can be defined by a familiar equation:
where is the reflected Bragg wavelength at the input end, is the effective refractive index of the core mode, and 𝛬 is the grating period.
In this sensor device, the Bragg reflected wavelength of the core mode is influenced by the change of strain and temperature of the surroundings. The shift of the Bragg wavelength is governed by the equation given below [35].
where ν is Poisson’s ratio, ε is the applied strain over the fiber, and α is the coefficient of thermal expansion. The prevailing battery charging/discharging conditions influence the stress of the battery electrodes and the internal temperatures. The FBG-based sensor system will reflect the changes that occur during charging/discharging cycles in the changes both in temperature and strain, with these combining to alter the monitored Bragg wavelengths. The change in Bragg wavelengths during continuous charging–discharging cycles is governed by Equation (2).
Decoupling of the effect of strain and temperature can be achieved in a well-established way [39], as used in previous research [23]. Hence, in this work, the estimation of the state of charge (SOC) of the battery was achieved by monitoring the instrumented FBG sensors using a data-driven regression model. In this method of measurement, no special techniques were required to determine the individual strain and temperature effects on the battery. Such an approach can minimize the complexity of the measurement and ensure high accuracy in the estimation of the SOC, as temperature and strain data are recorded simultaneously (through the raw Bragg resonance wavelengths) over consecutive cycles of battery charging and discharging.
2.2. Training of the Black-Box Model
The time-varying SOC of the instrumented battery, SOC(t), was measured using the Coulomb counting method by recording the current through the battery as follows:
where Ib is the current through the battery, and Crated is the maximum capacity of the battery. SOC(t) is the state of the battery at the instantaneous time, t, and the value SOC(t0) is the initial state of the charge of the battery (at time t0). The current through the battery and the voltage across the battery were recorded during a series of charging–discharging cycles. The instrumented batteries were placed in an assembly, and their performance was measured with a constant-current/constant-voltage (CC-CV) charging procedure, followed by a CC discharge. The cross-calibration of the fiber optic system was achieved by using data obtained directly from a BTS 4000 battery test system to monitor the required electrical parameters in the conventional way. The FBG sensor system data were measured synchronously with the electrical interrogator system. As a result of the long experiments, a large set of data from optical sensors and electrical measurements was available. The “black-box” model was initially trained with the FBG data as input and with the SOC derived by Equation (3) as output.
A data-driven machine learning model of this type is important, as it can be used to estimate or predict the outputs from the training dataset, and thus, it can provide a suitable platform whereby any noise in the input data can be removed proficiently to enhance the estimation efficiency of the system. Such a data-driven model was already been used for Li-ion battery parameter estimation, based on the electrical parameters, to estimate the state of the health of the battery [40]. In this research, the ML model developed was trained with data from the fiber-Bragg-grating-based sensor system, incorporating the diversity of data-driven model and taking advantage of the robustness of optical sensor data to provide a means to evaluate the SOC of the battery. Algorithms such as the linear regression model support the vector machines model, the Gaussian regression model, the decision tree model, and ensemble models, which are mostly used in data-driven regression. A cascaded decision tree model and neural network model were adopted here for the training of the “black-box” model and the subsequent estimation of the SOC from the recorded optical fiber sensor data. Decision tree algorithms are used for soft classification of remote sensing data [41]; for example, the estimation of the degree of salt-affected soil was also accomplished successfully [42] with remote sensing data. Further, the concentrations of mixed VOC gases were estimated successfully from the sensor array data with the neural network and using decision tree learning [43]. A decision tree classification partitions the space of all the joint output variable values, x, into J–disjoint regions . A response value was assigned to each corresponding region . For a given set of joint predictor values x, the tree prediction was assigned as the response estimate, with the value assigned to the region containing (x), where . These particular decision tree algorithms served as a gateway before the use of the regression NN model. This decision tree model classified the FBG data based on only (a) charging, (b) discharging, and (c) the rest conditions. It could also be used to classify the data, with different rates of charging and discharging. Following this gateway, the datasets were transferred to the next regression NN block, where the data were mapped to the corresponding SOC depending on the nature of the classification.
A schematic representation of the training and evaluation of utilized ML “black-box” model is shown in Figure 4. The mapping mechanism from the input data to the output data of a machine learning regression model was explored. The decision tree model helps in using a specific neural network model, as per the observable dataset. The variations of FBG wavelengths have consecutive linear and non-linear regions during the charging–discharging cycles. In the black box, initially, the FBG-derived data were checked in the decision leaf before entering the following neural network model and then were finally mapped with output SOC. The efficiency of the black-box model depends on number of factors: root nodes, internal nodes, leaf size, and leaf node in the first block, where they are classified, and then, in case of regression block, parameters such as the number of hidden layers, weight, bias, and activation function hold the key for the optimum estimation. Low bias and small variability of the black-box model were ensured with the activation function of each neural network model. Depending on the pattern of FBG wavelength change, three activation functions are mainly used: (a) sigmoidal, (b) RelU, and (c) soft activation function. Given a set of regions, the optimal response values associated with each data frame were easily obtained; these values minimize the prediction risk in that segmented region. Commercial mathematical software was used for the development of the codes forming the black-box model. Conclusive and rigorous training of the black-box model is required to optimize the performance of the black-box model in the estimation of the SOC. The training time of the black-box model was several hours (5–8 h); this depends on the type of application and case used. Such an extended training time for the black-box model was required, as a large set of data was used for training purposes.
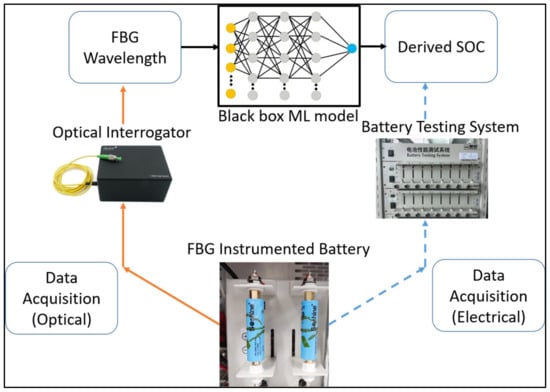
Figure 4.
Schematic representation of the training process of the “black-box” model, where the orange arrow represents the optical data (wavelength of FBG), and the blue dashed arrow represents the electrical data (current through the battery), which is connected to the output of the black-box model.
In this work, the approach taken was as follows: The instrumented FBG-based sensor system was installed in the controlled-environment battery tester, type BTS 4000, and several long cycles of charging and discharging were undertaken. The current, voltage, and the associated Bragg wavelengths of each of the individual sensors in the system were recorded in a synchronized way. A clear pattern demonstrating the Bragg wavelengths of each of the sensors could thus be obtained in a very stable and repetitive manner, with the data being recorded over a series of consecutive charging and discharging cycles.
3. Results and Discussion
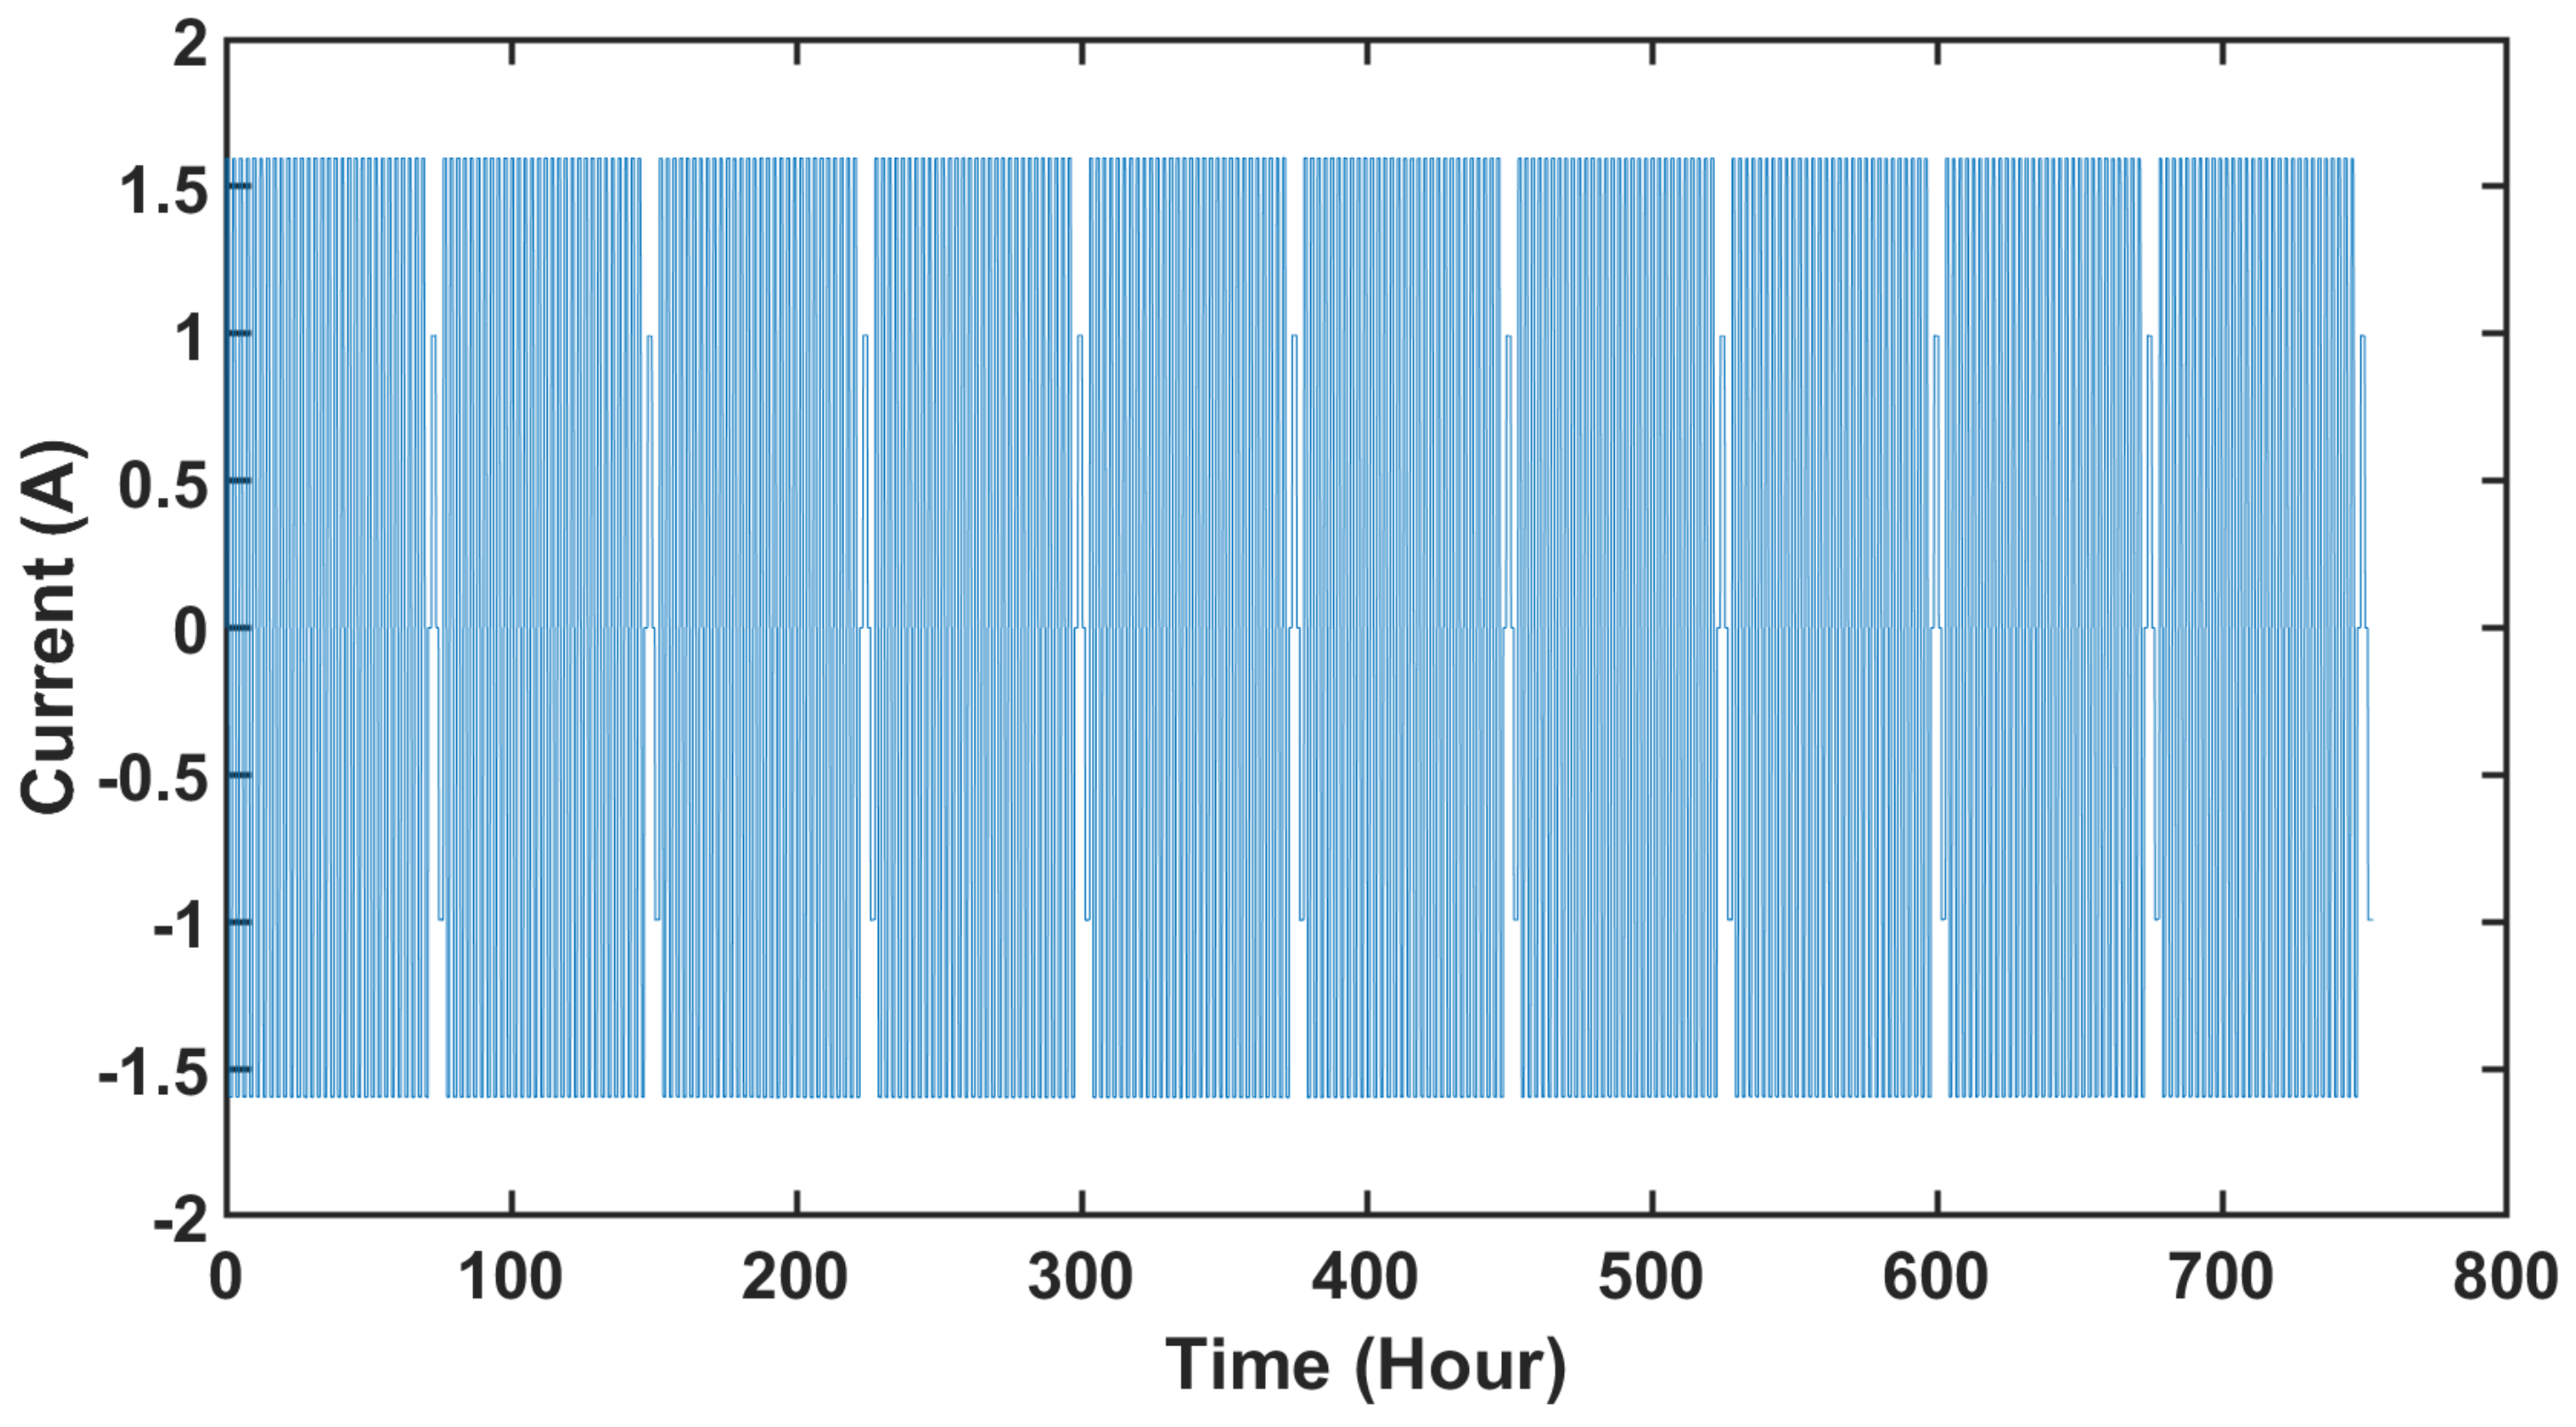
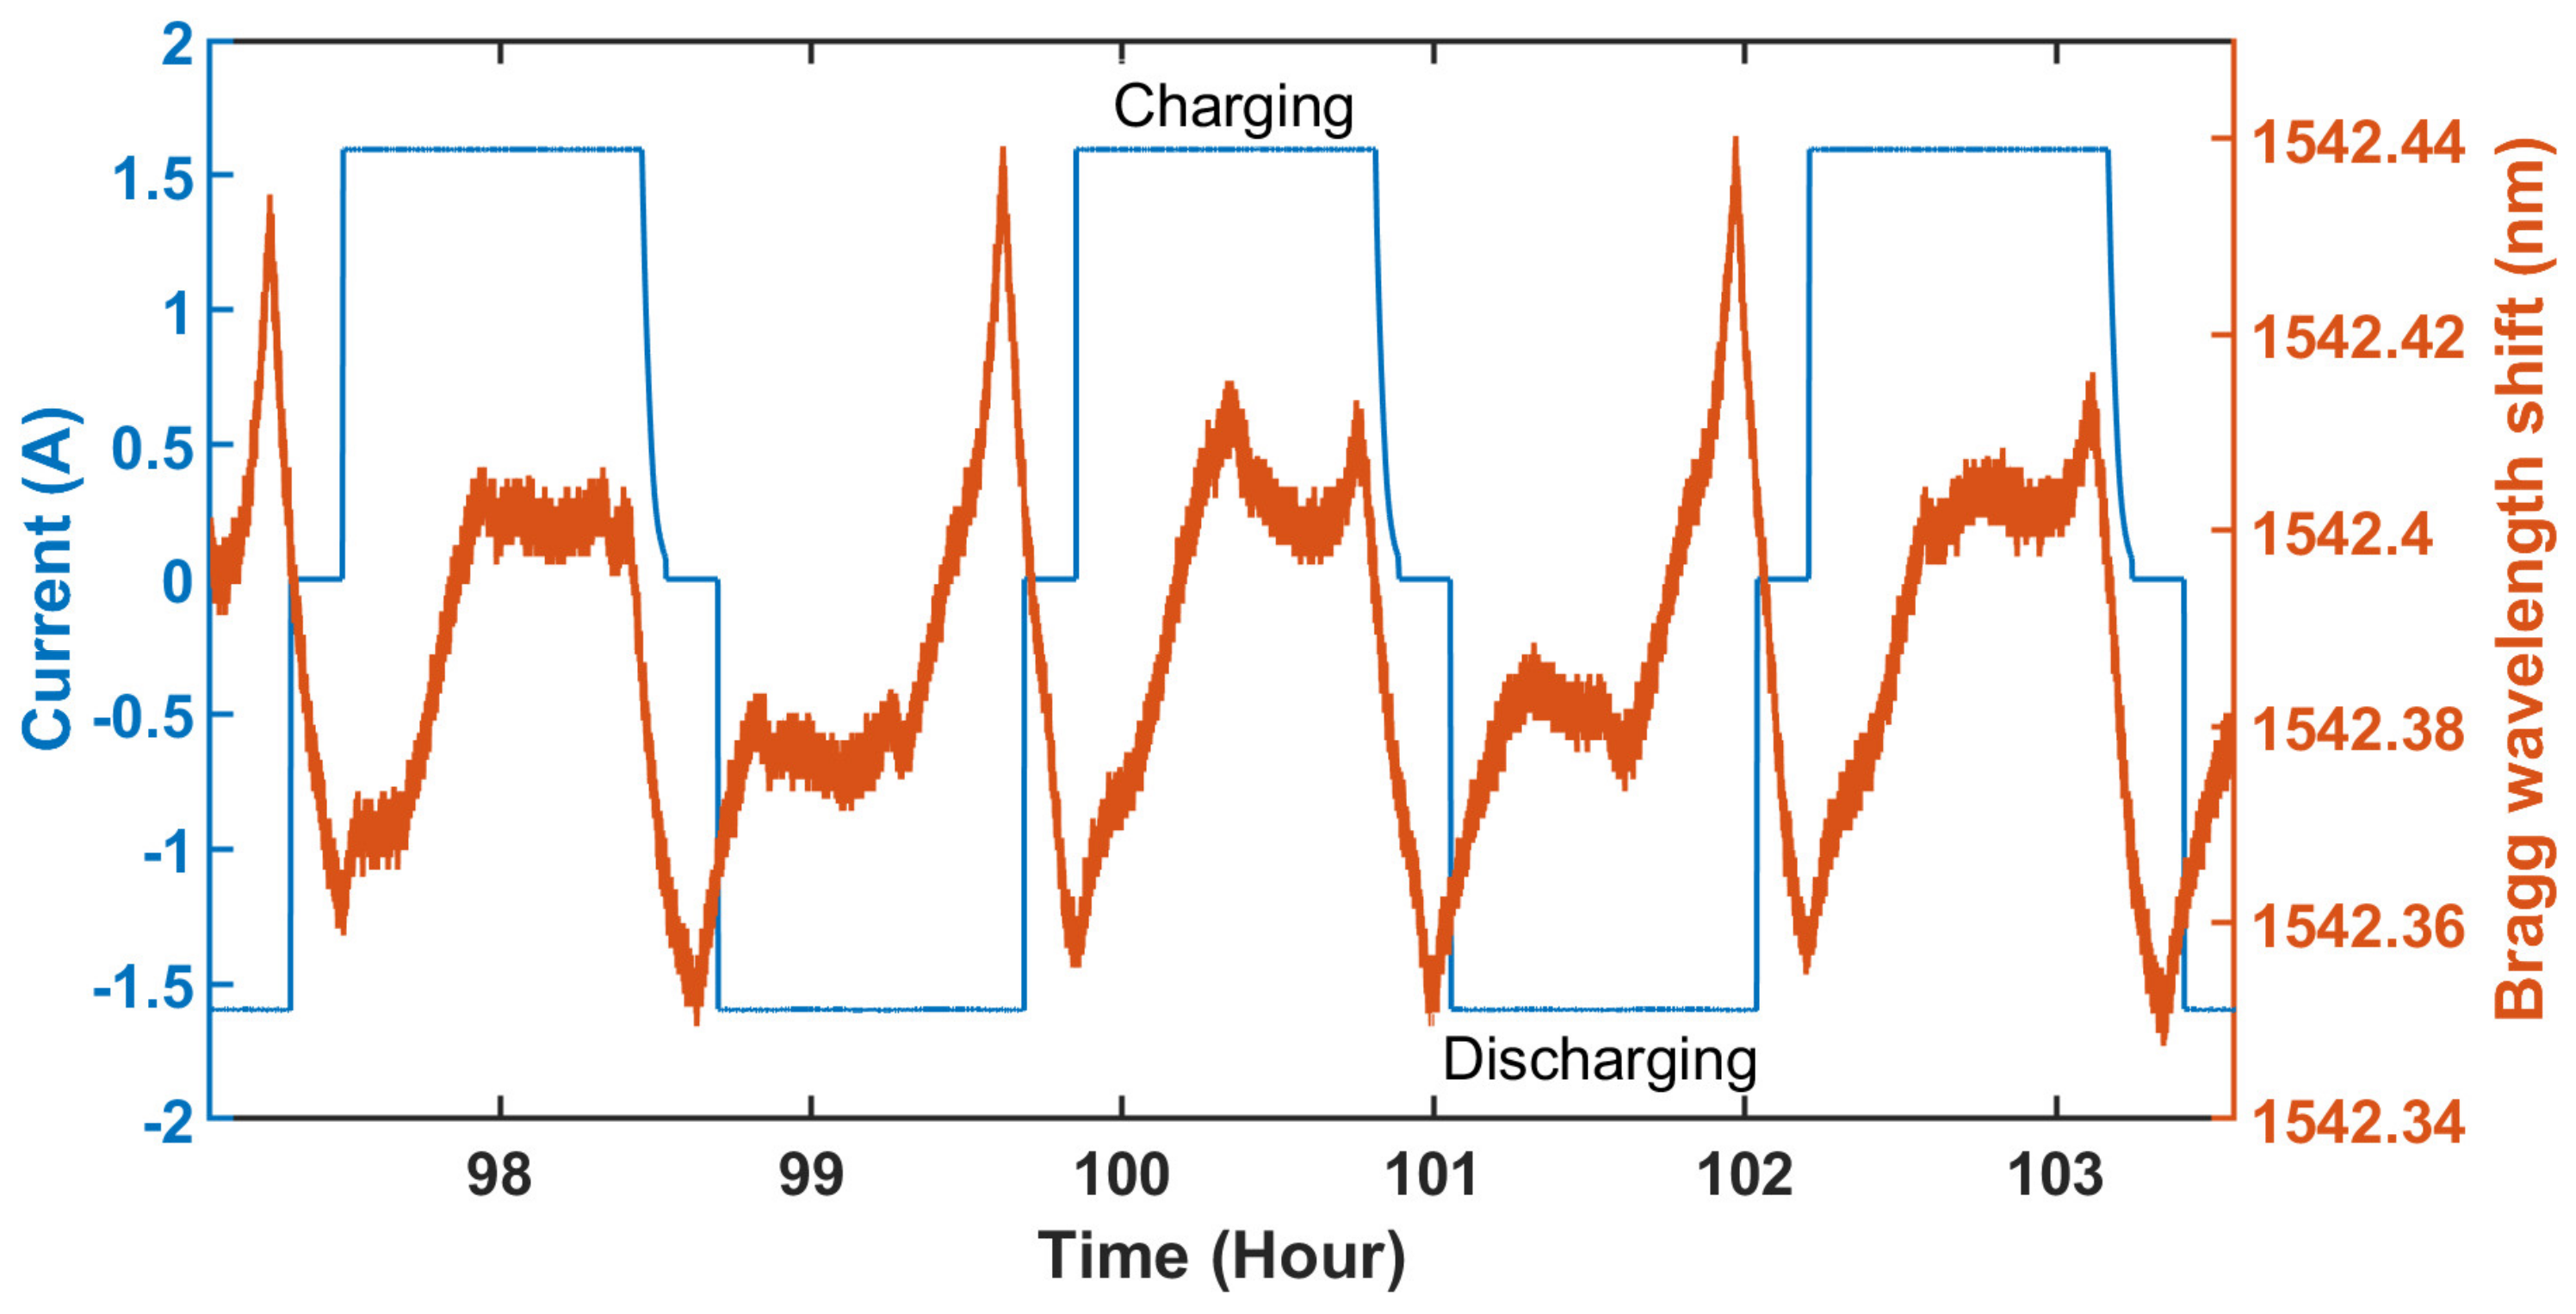
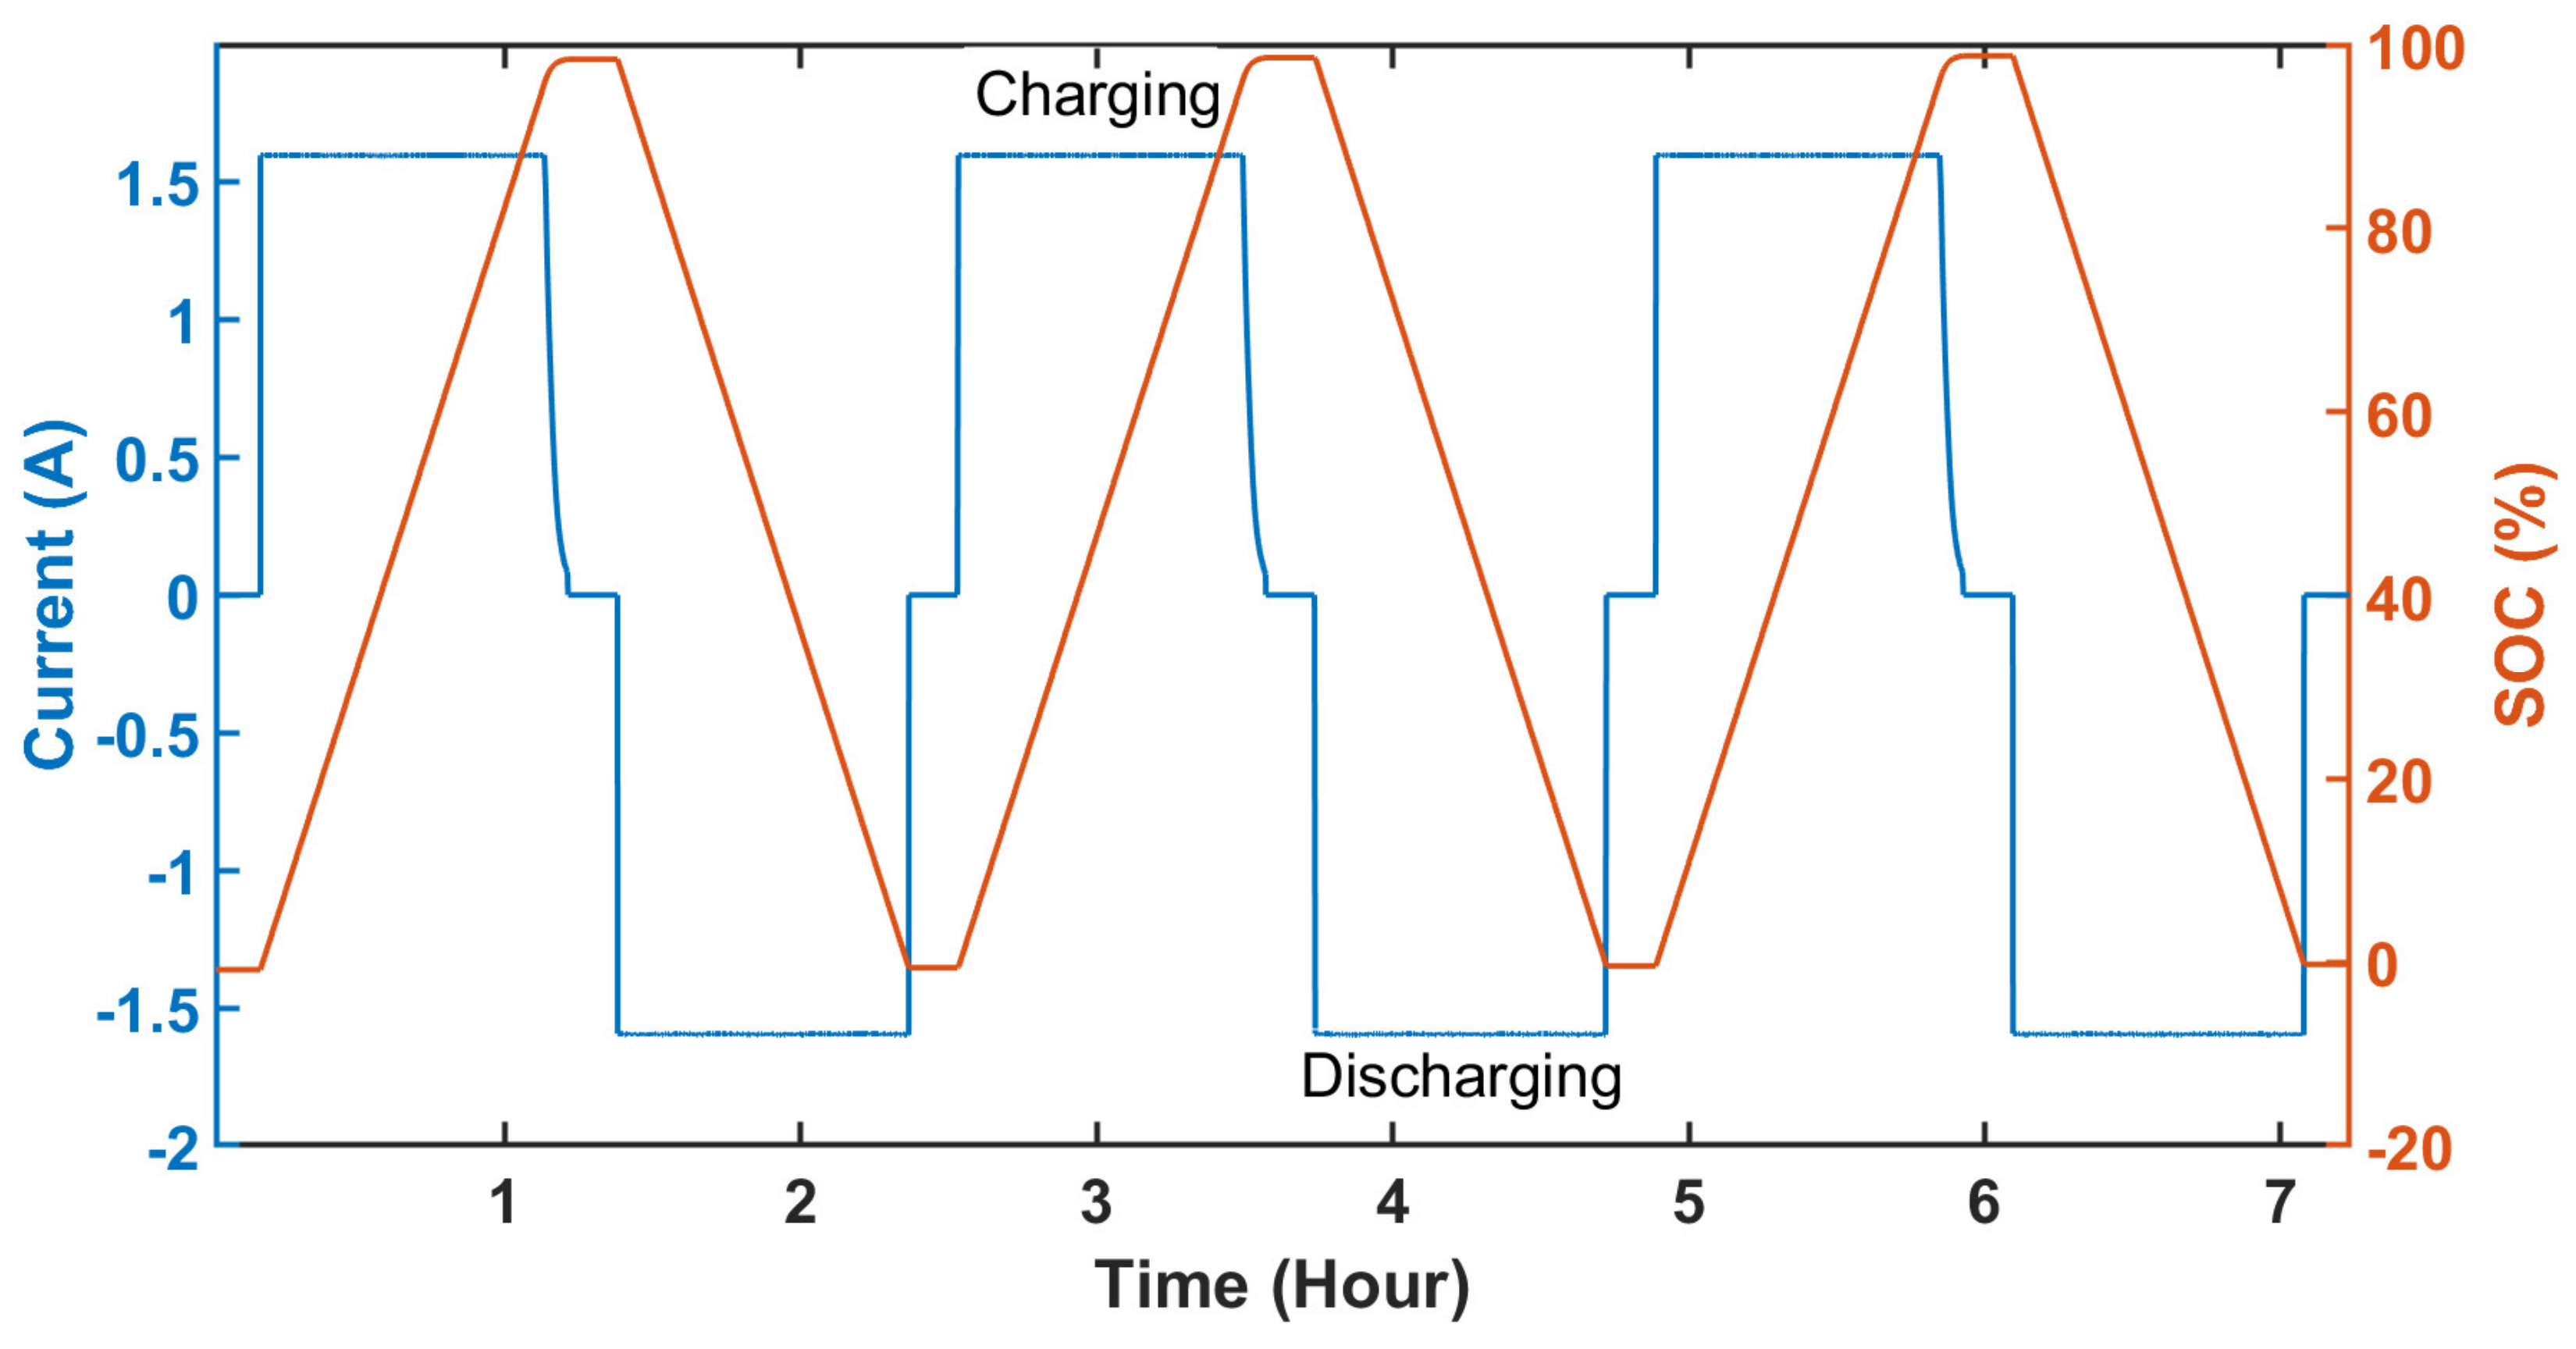
The batteries evaluated and thus instrumented with the FBG-based sensor system designed in this work were chosen for convenience and are representative of the type of battery cells used in many industrial applications, with characteristics as follows: 3.2 V, 1.6 Ah, and cylindrical LiFePO4 cells (Soshine, IFR 18650), as illustrated in Figure 2. The instrumented batteries were subjected to a series of consecutive, long charging–discharging cycles, as shown in Figure 5. During the tests carried out for calibration, the current was measured with a standard BTS 4000 battery testing unit. To ensure that the tests carried out were truly representative, the batteries were subjected to long, consecutive charging and discharging for a period in excess of one month. Figure 5 depicts the recorded current over one-month long, continuous charging/discharging cycles at a rate of 1C, which means the battery was allowed to discharge within 1 h from full capacity, and during charging, the battery would take 1 h to reach the maximum capacity from “zero” capacity. To do so, the charging current was ~1.6 A, and the discharging current was ~−1.6 A. While this was happening, the FBG wavelengths in the sensor system were also determined, and the recorded current and the Bragg wavelength of an FBG sensor during a single charging and discharging cycle are shown in Figure 6. Each of the batteries considered in this test has a sensor “package” based on a three-FBG rosette glued to the surface of the battery, and thus, the variation of each of the FBG characteristic wavelengths, varying with the change of the current, is almost similar. The FBG wavelength follows a stable, repetitive pattern, allowing the data to be used for the training of the “black-box” model. Caution was taken to synchronize the electrical and optical data over time. It is understandable due to electrochemical reactions inside the battery: both temperature and strain varied in a typical, representative manner, and the signature of both effects is reflected in the Bragg wavelengths of the FBG sensors. As mentioned earlier, at first, the SOC value was derived from the current through the battery by the Coulomb counting method (Equation (3)), where Figure 7 represents the variation of the SOC of the battery along with the current for a few charging and discharging cycles. This SOC derived from the current was used as the output of the “black-box” model, and the simultaneously recorded Bragg wavelengths of the FBG-based sensor system were used as the input. A stable and repetitive data pattern is necessary for the training of the black-box model, and this was ensured during the experiment.
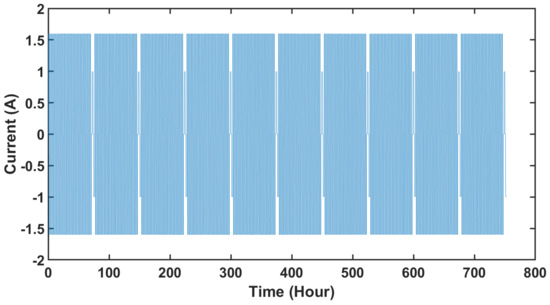
Figure 5.
Recorded current through the battery during continuous charging–discharging cycles for ~1 month (~750 h).
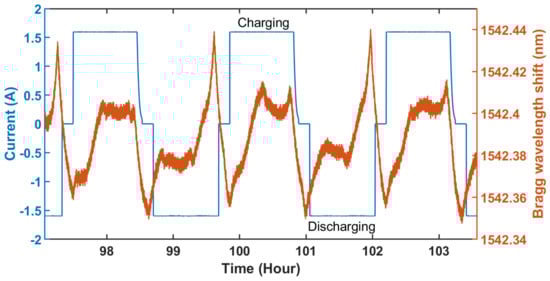
Figure 6.
Recorded current through the battery (left axis, blue graph) and variation of Bragg wavelength (right axis, orange graph) during continuous charging-discharging cycles; one charging and discharging cycle each are labeled in the graph.
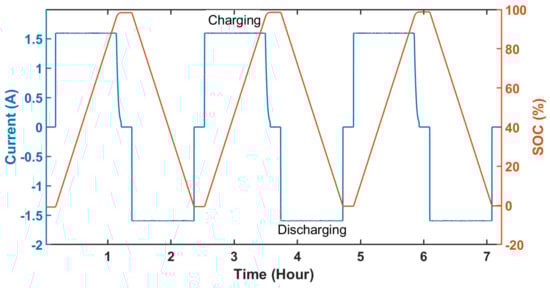
Figure 7.
Derived SOC (%) by coulomb counting method.
The training of the “black-box” model was carried out as mentioned above. The “black-box” contains a cascaded classification of an NN regression model. The node points, tree-branching weighted points, and separate activation function for each segment of the data were tuned to achieve maximum efficiency. In this work, “gradient descent techniques” were used for the optimization of the parameters during training for the “black-box” model. The creation of the data-driven model was undertaken, in association with appropriate optical fiber hardware development, to create the complete battery monitoring system. Making its use most effective involves four primary steps: (1) collecting the data from the sensors, (2) preprocessing the data, (3) “black-box” model training, and (4) testing with further datasets. In the tests carried out, the “black box” was trained with the preprocessed FBG-based sensor data and used to estimate the state of the charge of the battery. The pre-processing of the data included steps such as (a) data cleaning and (b) feature scaling, which significantly improved the training efficiency as well as the estimation efficiency. Equation (3) was used to determine the SOC of the battery, and a large number of consecutive cycles of charging and discharging of batteries were studied. While training the “black-box” model, ~3 million data points from three FBG-based sensors in the system acted as an input, where the output was the SOC evaluated in relation to the recorded current. A further “snapshot” of data recorded over a short time span with the corresponding derived SOC is shown, where the proper training of the black-box model was ensured, as the black box successfully maps the output data from the input optical sensor data. Several loops were used for the same algorithm unless the prediction of SOC gave a suitable residual error for the estimation. In this way, a training regime for the “black box” was created, which can be used to estimate the SOC of the battery from the FBG data.
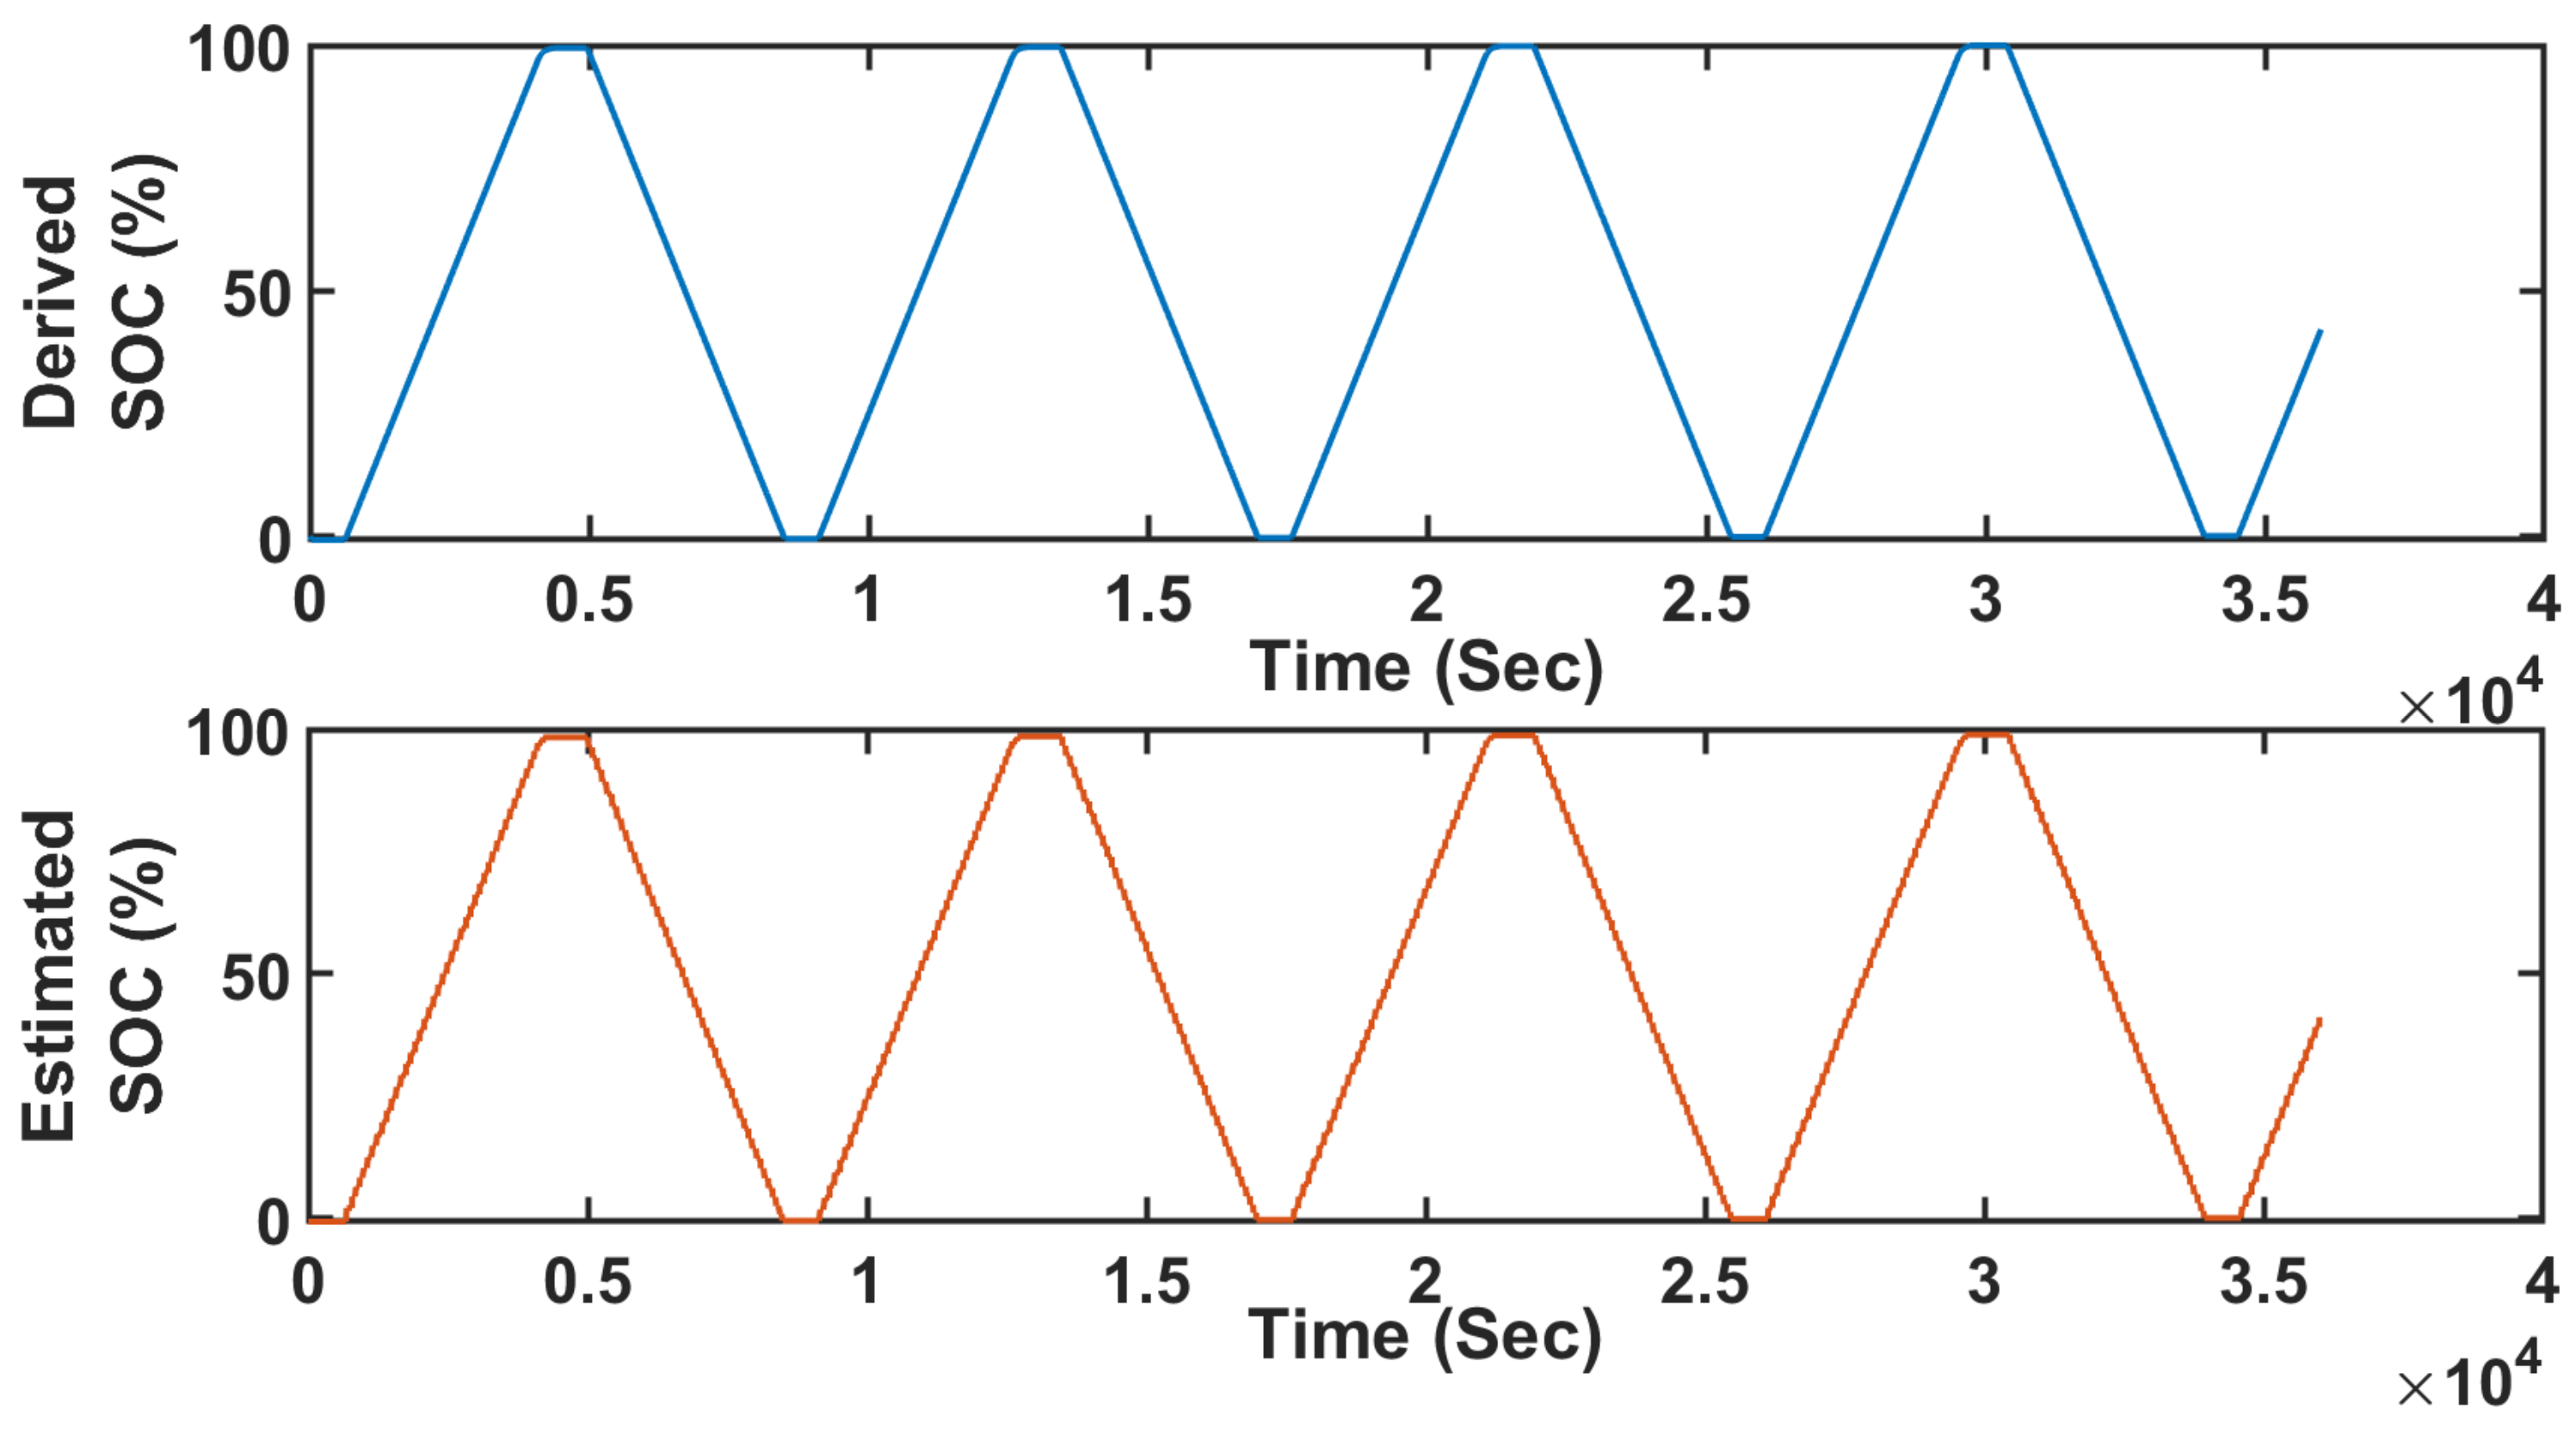
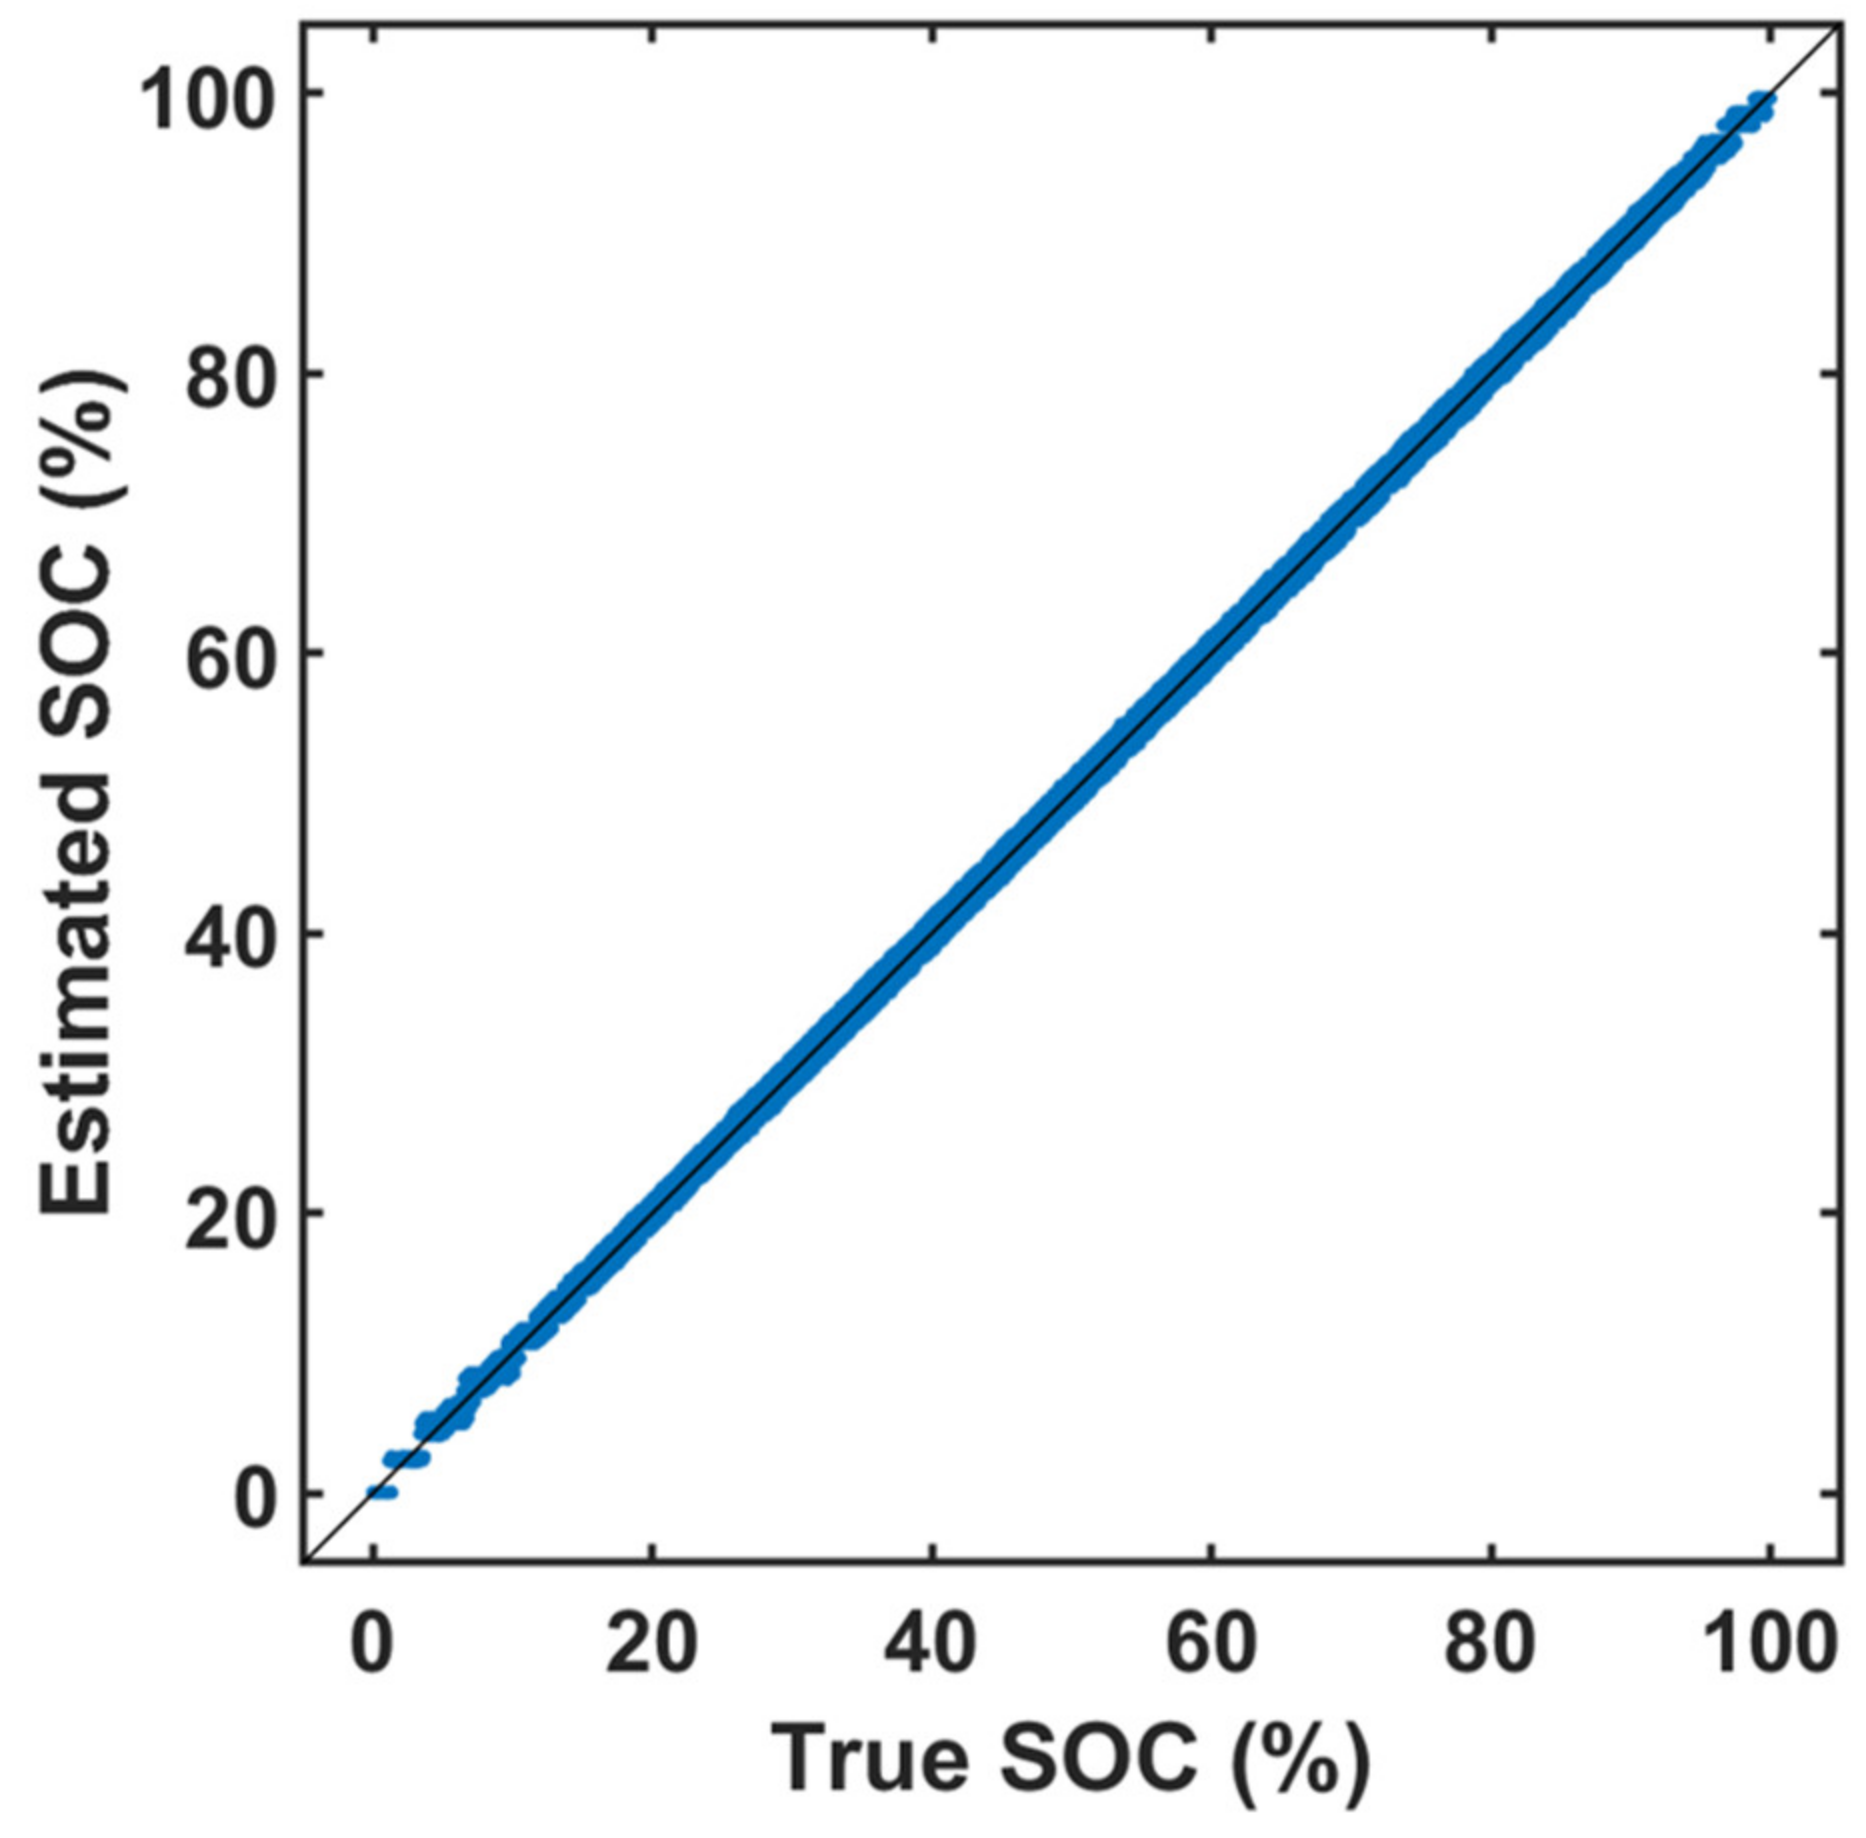
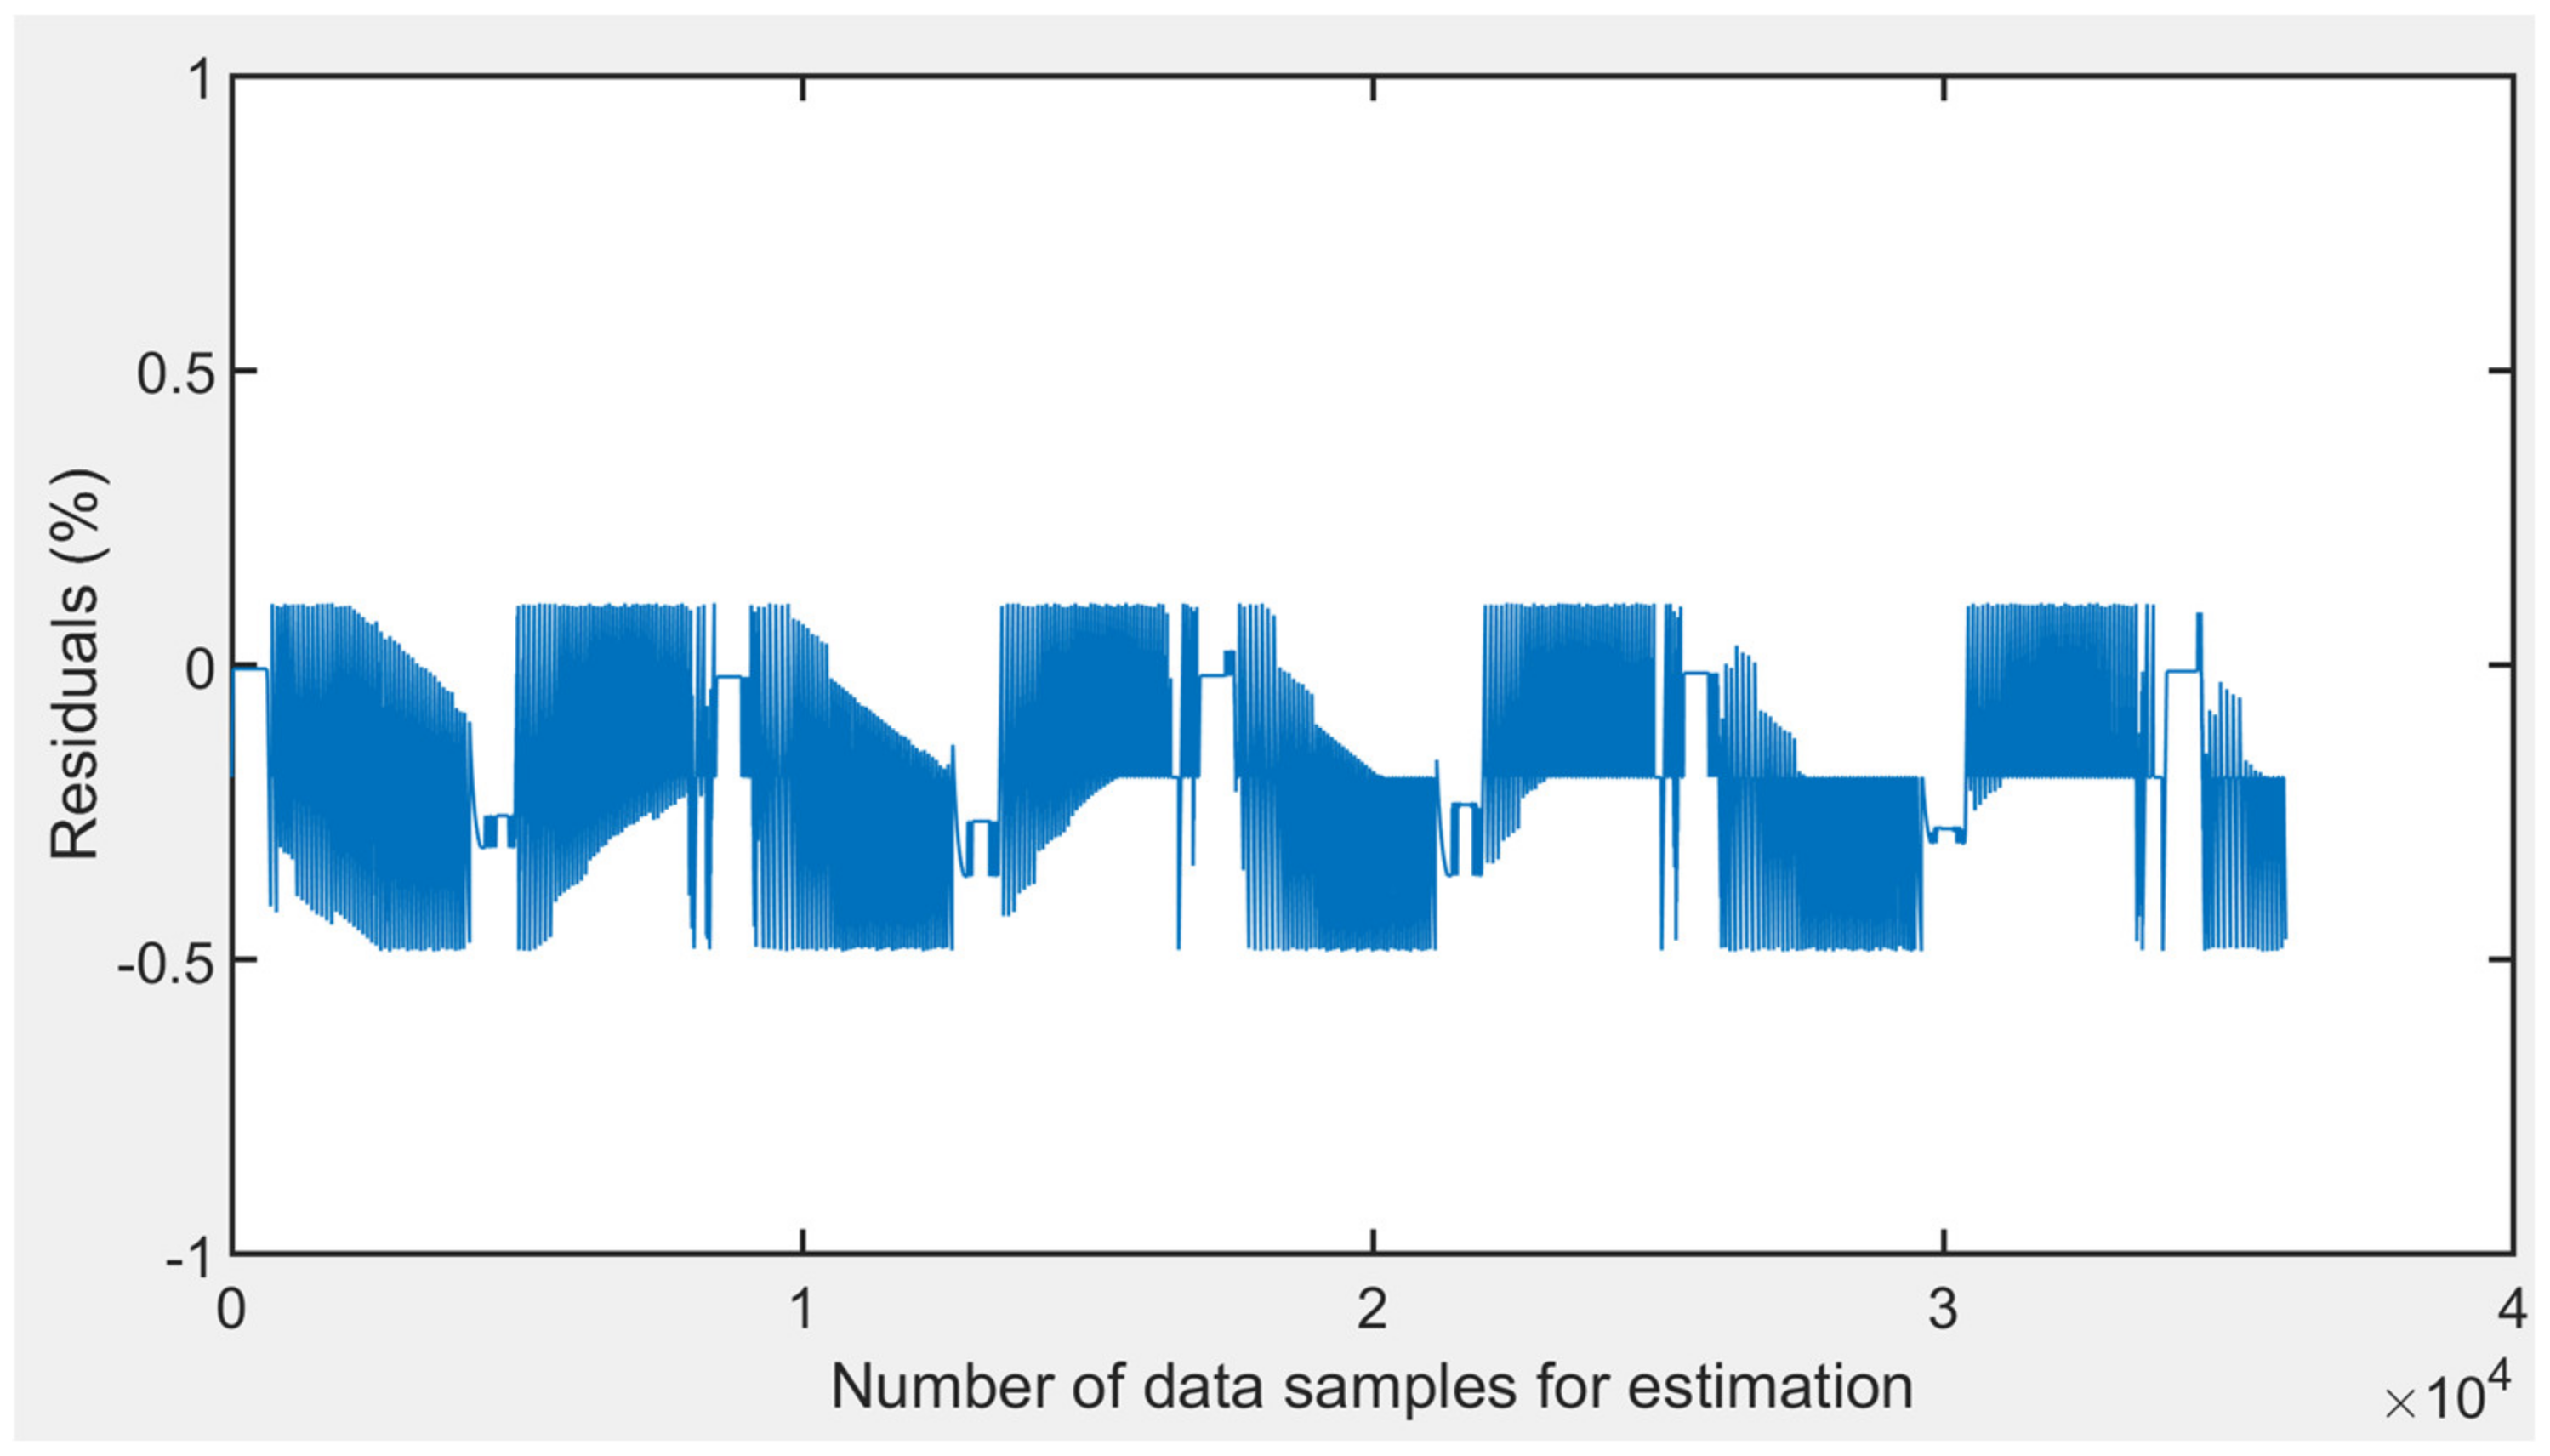
The estimated SOC was then compared with the evaluated SOC (from the BTS 4000 device made by Neware, Belleville, IL, USA) by integrating the current through the battery during the performed series of test charging–discharging cycles. Figure 8 shows the SOC derived from the measured current with data from the electronic system (BTS 4000—in blue) compared to that from the output of the “black-box” model, which was trained with FBG data, for estimation of SOC of the battery (in orange) over four consecutive charging–discharging cycles. Nearly 36,000 sample data points were used in the testing phase, where from visual inspection, an estimation of the efficiency of the “black-box” model is very good. Here, the spread of the SOC values estimated by the “black-box” model showed only a small deviation from a perfect prediction line. To do so, the algorithm used three million datasets for the training of the “black-box” ML model from the series of sensors used. Figure 9 represents the spreading of the estimation values from the perfect prediction line. The training computation time was quite high, but it proved to be more than adequate for this application, which is excellent. The residuals of each of the data points are shown in Figure 10. Residuals were calculated as %ages, defined as follows: [(original SOC − estimated SOC)/Original SOC] × 100, where the residual was calculated for ~36,000 test data samples, and the results obtained are shown in Figure 10. The R2 value of the prediction is 0.996, which was seen as a good result and of positive significance for the success of the regression model. It could even be enhanced with some further tuning of the bias, the weighted function values, and the nodal point values. The root mean square error (RMSE) of the data-driven regression ML model was determined to be 0.5481 (% in SOC).
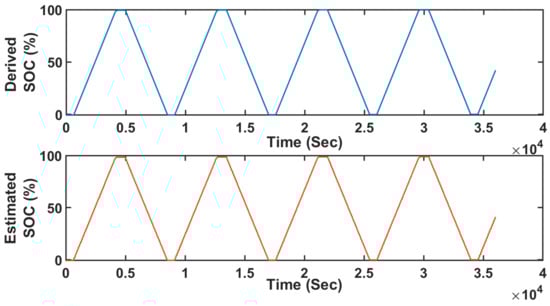
Figure 8.
Derived SOC (%) by Coulomb counting method (top, blue graph) and estimated SOC (bottom, orange graph) during continuous charging–discharging cycles for ~4 cycles (~36,000 s).

Figure 9.
Estimated SOC (%) vs. true SOC (%) during continuous charging–discharging cycles for ~4 cycles (~36,000 sample points).
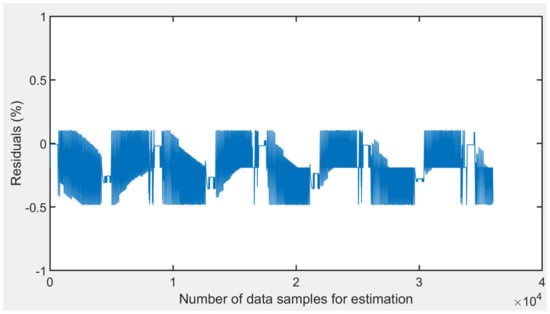
Figure 10.
Residuals of the estimation with the number of data points.
4. Conclusions
In this work, it was shown that a data-driven regression NN model can be employed efficiently for the estimation of the SOC of a battery under study during continuous charging–discharging cycles, using information recorded from the designed and installed FBG-based sensor systems. Lithium-ion batteries were used in the experiments, where the FBG-based sensor system was mounted onto the surface of the batteries. Temperature and strain were known to vary during the charging–discharging cycles studied, as the lithium-ion intercalation causes stresses on the battery, where the effect of strain was observed in the anode by the swelling of the graphitic structure [24,25,26]. The temperature of the battery during the charging–discharging process was also recognized to change in response to the dynamic of the electrochemical reactions, and it was found that the battery’s observed temperature increases were higher during the discharging cycle than during the charging cycle [22,23], arising from a combination of the physical and chemical processes occurring.
A key aim of this work was to show the value of the FBG-based sensor system developed in estimating the SOC of the battery by using only the data obtained from sensor. Such an approach can offer a simple and effective monitoring method for obtaining the key performance data, which reduces complexity, making the process of estimation more robust in nature. In previous work [23] from some of the authors, a (DTW) algorithm was applied for the measurement of the SOC from the processed optical sensor system data, but as it was derived from the strain information, a temperature-compensation method is required to avoid significant error due to such fluctuations. In that previous study [23], it was observed that the response time for the estimation of SOC from the temperature-compensated change in strain measured by FBG sensor was ~8.35 s. With the newly developed NN black-box model, the response time for the estimation of SOC from raw FBG data is ~1 s, which allows us to estimate the SOC in a faster and more convenient way; the response time was improved by almost ~8 times from our previous work. The DTW algorithm has its own limitations for estimation, with fluctuations from input reference data, so the estimation can be poor. The efficiency for estimation was ~95%, while the SOC was estimated from the profile of change in strain [23]. In one of the similar work, the reported estimation efficiency of the SOC from strain response of the FBG sensor was ~99% [20,21], but the FBG was attached directly to the electrode surface of the battery with special packaging. Attaching the FBG to one of the electrode surfaces with insulation requires additional effort, and there remains a risk of degradation of the battery quality.
To offer an improvement on this, in this paper, an effective data-driven regression NN model was discussed, and based on the data obtained, it is thus proposed that this can be a better choice for the estimation of the SOC of a battery over many charging–discharging cycles. The utilized NN model shows a sufficient efficiency (which is more than 99%) for this application. In developing this concept, we have shown that with proper training of the “black-box” model, the SOC could even be determined by using a single FBG sensor with high accuracy. Such an approach shows less complexity in the overall instrumentation needed because, as noted above, previously reported methods used multiple FBGs over the surface of the battery for the estimation of SOCs, but it is now possible to use a single FBG with a proper black-box ML model. The new sensing system will significantly reduce the complexity of the design and also will be able to minimize the cost. A single FBG attached to the battery can fire an alarm with any kind of thermal runway or abnormal expansion of electrodes along with estimation of SOC during continuous applications cycles, which will be immensely helpful for commercial battery-driven applications.
The research carried out indicates that a model that is completely data-driven (which means no physical relationship between input and output is required) is very effective. Further, the noise in the output signal can be reduced significantly with the use of an appropriate level of training. The RMSE value of the estimation was found to be 0.5483, which was satisfactory over the defined range of SOC (0 to 100) with a R2 value of 99.62%. A resolution of <1% in the estimation of the SOC was achieved, and this is a significant improvement on data reported from other sources using with optical fiber sensors. Even though the work reported was undertaken in the laboratory in a controlled environment chamber, the approach has already been used in other non-laboratory cases characterized by different charging–discharging rates, as the trained ML “black box” gives sufficient accuracy for the estimation of the SOC.
The training of the black-box model for the estimation of the SOC directly from the optical sensors data depends on the signal-to-noise ratio (SNR) of the Bragg peaks, shapes of the Bragg peaks, and also the spacing of the adjacent sensors. The fiber properties are also very important, as the parameters varies from fiber to fiber. The instrumentation of the sensors also plays a key role for successful estimation, as the attachment of the sensors onto the cylindrical surface of the battery is a bit tricky. It has been observed sometimes that the Bragg peaks split, or the fiber was broken after few complete cycles of charging–discharging of the battery.
In the software part, the efficiency of the decision blocks was dependent on the number of leaf sizes, branches, and root nodes, which need to be adjusted accordingly. The accuracy of the neural networks of regression mapping is depending on the weight function, the bias values, offset, and gain values. It is to be noted that, as we used the raw wavelengths of the battery for the estimation of the sensors, all of these values normally change for different Bragg wavelength sensors. Nevertheless, this approach is very much case-specific towards particular applications. Therefore, the black-box model is not robust, and for different applications, this black-box model requires training with new sets of the data.
Future work will extend this through a more advanced, case-specific, cascaded regression NN model, where other neural network models (spike NN model or adaptive NN model) will be included to make this “black-box” approach well suited to real-time measurement, for example, applications in electrical vehicles. The employed method illustrates a non-invasive method for the estimation of the SOC of the battery using an FBG-based sensor system that can perform well in harsh environments. Thus, sensor systems of this type are suitable for safe installation in a battery management system to give uninterrupted performance monitoring of the battery condition.
Author Contributions
S.B., conceptualization, methodology, validation, data analysis, and writing—draft; M.F., conceptualization and methodology; K.L., conceptualization, methodology, and writing—review and editing; T.S., conceptualization, methodology, writing—review and editing, supervision, project administration, and funding acquisition; K.T.V.G., conceptualization, methodology, writing—review and editing, supervision, project administration, and funding acquisition. All authors have read and agreed to the published version of the manuscript.
Funding
This research received no external funding.
Data Availability Statement
The data can be available on specific request to the authors and can be used for academic and research purposes only.
Acknowledgments
Authors Tong Sun and Kenneth Grattan are pleased to acknowledge the support from the Royal Academy of Engineering for this work.
Conflicts of Interest
The authors declare no conflict of interest.
References
- Alotto, P.; Guarnieri, M.; Moro, F. Redox flow batteries for the storage of renewable energy: A review. Renew. Sust. Energy Rev. 2014, 29, 325–335. [Google Scholar] [CrossRef]
- Pistoia, G. Lithium-Ion Batteries: Advances and Applications; Elsevier: Amsterdam, The Netherlands, 2014. [Google Scholar]
- IEA. Innovation in Batteries and Electricity Storage. 2020. Available online: https://iea.blob.core.windows.net/assets/77b25f20-397e-4c2f-8538-741734f6c5c3/battery_study_en.pdf (accessed on 4 November 2021).
- Gabbar, H.A.; Othman, A.M.; Abdussami, M.R. Review of battery management systems (BMS) Development and Industrial Standards. Technologies 2021, 9, 28. [Google Scholar] [CrossRef]
- Jiang, J.; Zhang, C. Fundamentals and Applications of Lithium-Ion Batteries in Electric Drive Vehicles; Wiley Online Library: Hoboken, NJ, USA, 2015. [Google Scholar]
- Pop, V. (Ed.) Battery Management Systems: Accurate State-of-Charge Indication for Battery Powered Applications; Springer: Dordrecht, The Netherlands, 2008. [Google Scholar]
- Pattipati, B.; Balasingam, B.; Avvari, G.V.; Pattipati, K.R.; Bar-Shalom, Y. Open circuit voltage characterization of lithium-ion batteries. J. Power Sources 2014, 269, 317–333. [Google Scholar] [CrossRef]
- Li, Z.; Huang, J.; Liaw, B.Y.; Zhang, J.B. On state-of-charge determination for lithium-ion batteries. J. Power Sources 2017, 348, 281–301. [Google Scholar] [CrossRef]
- Xia, B.; Wang, H.; Tian, Y.; Wang, M.; Xu, Z. State of Charge Estimation of Lithium-Ion Batteries Using an Adaptive Cubature Kalman Filter. Energies 2015, 8, 5916–5936. [Google Scholar] [CrossRef]
- Zeng, Y.; Li, Y.; Yang, T. State of Charge Estimation for Lithium-Ion Battery Based on Unscented Kalman Filter and Long Short-Term Memory Neural Network. Batteries 2023, 9, 358. [Google Scholar] [CrossRef]
- Zheng, W.; Xia, B.; Wang, W.; Lai, Y.; Wang, M.; Wang, H. State of Charge Estimation for Power Lithium-Ion Battery Using a Fuzzy Logic Sliding Mode Observer. Energies 2010, 12, 2491. [Google Scholar] [CrossRef]
- Roscher, M.A.; Sauer, D.U. Dynamic electric behavior and open-circuit-voltage modeling of LiFePO4-based lithium-ion secondary batteries. J. Power Sources 2011, 196, 331–336. [Google Scholar] [CrossRef]
- Li, D.; Ouyang, J.; Li, H.Q.; Wan, J.F. State of charge estimation for LiMn2O4 power battery based on strong tracking sigma point Kalman filter. J. Power Sources 2015, 279, 439–449. [Google Scholar] [CrossRef]
- Cui, Z.; Wang, L.; Li, Q.; Wang, K. A comprehensive review on the state of charge estimation for lithium-ion battery based on neural network. Int. J. Energy Res. 2021, 46, 5423–5440. [Google Scholar] [CrossRef]
- He, W.; Williard, N.; Osterman, M.; Pecht, M. Prognostics of lithium-ion batteries based on Dempster-Shafer theory and the Bayesian Monte Carlo method. J. Power Sources 2011, 196, 10314–10321. [Google Scholar] [CrossRef]
- Zhou, Z.; Liu, Y.; You, M.; Xiong, R.; Zhou, X. Two-stage aging trajectory prediction of LFP lithium-ion battery based ontransfer learning with the cycle life prediction. Green Energy Intell. Transp. 2022, 1, 100008. [Google Scholar] [CrossRef]
- Su, Y.-D.; Preger, Y.; Burroughs, H.; Sun, C.; Ohodnicki, P.R. Fiber Optic Sensing Technologies for Battery Management Systems and Energy Storage Applications. Sensors 2021, 21, 1397. [Google Scholar] [CrossRef]
- Lao, J.; Sun, P.; Liu, F.; Zhang, X.; Zhao, C.; Mai, W.; Guo, T.; Xiao, G.; Albert, J. In situ plasmonic optical fiber detection of the state of charge of supercapacitors for renewable energy storage. Light. Sci. Appl. 2018, 7, 34. [Google Scholar] [CrossRef] [PubMed]
- Nascimento, M.; Ferreira, M.S.; Pinto, J.L. Simultaneous sensing of temperature and bi-directional strain in a prismatic li-ion battery. Batteries 2018, 4, 23. [Google Scholar] [CrossRef]
- Miao, Z.; Li, Y.; Xiao, X.; Sun, Q.; He, B.; Chen, X.; Liao, Y.; Zhang, Y.; Yuan, L.; Yan, Z.; et al. Direct optical fiber monitor on stress evolution of the sulfur-based cathodes for lithium–sulfur batteries. Energy Environ. Sci. 2022, 15, 2029–2038. [Google Scholar] [CrossRef]
- Li, Y.; Zhang, Y.; Li, Z.; Yan, Z.; Xiao, X.; Liu, X.; Chen, J.; Shen, Y.; Sun, Q.; Huang, Y. Operando Decoding of Surface Strain in Anode-Free Lithium Metal Batteries via Optical Fiber Sensor. Adv. Sci. 2022, 9, 2203247. [Google Scholar] [CrossRef]
- Ganguli, A.; Saha, B.; Raghavan, A.; Kiesel, P.; Arakaki, K.; Schuh, A.; Schwartz, J.; Hegyi, A.; Sommer, L.W.; Lochbaum, A.; et al. Embedded fiber-optic sensing for accurate internal monitoring of cell state in advanced battery management systems part 2: Internal cell signals and utility for state estimation. J. Power Sources 2017, 341, 474–482. [Google Scholar] [CrossRef]
- Rente, B.; Fabian, M.; Vidakovic, M.; Liu, X.; Li, X.; Li, K.; Sun, T.; Grattan, K.T. Lithium-Ion battery state of-charge estimator based on FBG-based strain sensor and employing machine learning. IEEE Sens. J. 2021, 21, 1453–1460. [Google Scholar] [CrossRef]
- Chen, Y.; Evan, J.W. Thermal Analysis of Lithium-Ion Batteries. J. Electrochem. Soc. 1996, 143, 2708–2712. [Google Scholar] [CrossRef]
- Zhang, N.; Tang, H. Dissecting anode swelling in commercial lithium-ion batteries. J. Power Sources 2012, 218, 52–55. [Google Scholar] [CrossRef]
- Lee, J.H.; Lee, H.M.; Ahn, S. Battery dimensional changes occurring during charge/discharge cyclesdthin rectangular lithium ion and polymer cells. J. Power Sources 2003, 119–121, 833–837. [Google Scholar] [CrossRef]
- Matuck, L.; Pinto, J.L.; Marques, C.; Nascimento, M. Simultaneous Strain and Temperature Discrimination in 18650 Li-ion Batteries Using Polarization-Maintaining Fiber Bragg Gratings. Batteries 2022, 8, 233. [Google Scholar] [CrossRef]
- Li, Y.; Li, K.; Liu, X.; Li, X.; Zhang, L.; Rente, B.; Sun, T.; Grattan, K.T.V. A hybrid machine learning framework for joint SOC and SOH estimation of lithium-ion batteries assisted with fiber sensor measurements. Appl. Energy 2022, 325, 119787. [Google Scholar] [CrossRef]
- Mei, W.; Liu, Z.; Wang, C.; Wu, C.; Liu, Y.; Liu, P.; Xia, X.; Xue, X.; Han, X.; Sun, J.; et al. Operando monitoring of thermal runaway in commercial lithium-ion cells via advanced lab-on-fiber technologies. Nat. Commun. 2023, 14, 5251. [Google Scholar] [CrossRef]
- Huang, J.; Blanquer, L.A.; Bonefacino, J.; Logan, E.R.; Corte, D.A.D.; Delacourt, C.; Gallant, B.M.; Boles, S.T.; Dahn, J.R.; Tam, H.-Y.; et al. Operando decoding of chemical and thermal events in commercial Na(Li)-ion cells via optical sensors. Nat. Energy 2020, 5, 674–683. [Google Scholar] [CrossRef]
- Tan, M.; Zhang, Z. Wind turbine modeling with data driven methods and radially uniform designs. IEEE Trans. Ind. Inform. 2016, 2, 1261–1268. [Google Scholar] [CrossRef]
- Wang, D.; Song, Y.; Qin, J.; Yang, T.; Zhang, M.; Chen, X.; Boucouvalas, A.C. Data-driven Optical Fiber Channel Modeling: A Deep Learning Approach. J. Light. Technol. 2020, 38, 4730–4743. [Google Scholar] [CrossRef]
- Wissel, T.; Wagner, B.; Stüber, P.; Schweikard, A.; Ernst, F. Data-Driven Learning for Calibrating Galvanometric Laser Scanners. IEEE Sens. J. 2015, 15, 5709–5717. [Google Scholar] [CrossRef]
- Datta, A.; Augustin, M.J.; Gupta, N.; Viswamurthy, S.R.; Gaddikeri, K.M.; Sundaram, R. Impact Localization and Severity Estimation on Composite Structure Using Fiber Bragg Grating Sensors by Least Square Support Vector Regression. IEEE Sens. J. 2019, 19, 4463–4470. [Google Scholar] [CrossRef]
- Tokuda, Y.; Fujisawa, M.; Packwood, D.M.; Kambayashi, M.; Ueda, Y. Data-driven design of glasses with desirable optical properties using statistical regression. AIP Adv. 2020, 10, 105110. [Google Scholar] [CrossRef]
- Zhang, D.; Lo, F.P.-W.; Zheng, J.Q.; Bai, W.; Yang, G.Z.; Lo, B. Data-Driven Microscopic Pose and Depth Estimation for Optical Microrobot Manipulation. ACS Photonics 2019, 7, 3003–3014. [Google Scholar] [CrossRef]
- Sun, B.; Jiang, X.; Yung, K.; Fan, J. A review of prognostic techniques for high power white LEDs. IEEE Trans. Power Technol. 2017, 32, 6338–6352. [Google Scholar] [CrossRef]
- Bandyopadhyay, S.; Fabian, M.; Bremner, J.; Liu, X.; Li, X.; Li, K.; Sun, T.; Grattan, K.T.V. Machine Learning Model using a Fiber Bragg Grating-based Sensor System to measure Battery State-of-Charge. In Proceedings of the 27th International Conference on Optical Fiber Sensors 2022, Alexandria, VA, USA, 29 August–2 September 2022. Technical Digest Series, W4.17. [Google Scholar]
- Grattan, K.T.V.; Meggitt, B.T. (Eds.) Optical Fiber Sensor Technology: Advanced Applications—Bragg Gratings & Distributed Sensors; Springer: London, UK, 2000. [Google Scholar]
- Lyu, Z.; Gao, R.; Chen, L. Li-Ion Battery State of Health Estimation and Remaining Useful Life Prediction Through a Model-Data-Fusion Method. IEEE Trans. Power Electron. 2021, 36, 6228–6240. [Google Scholar] [CrossRef]
- Watanachaturaporn, M.X.P.; Varshney, P.K.; Arora, M.K. Decision tree regression for soft classification of remote sensing data. Remote Sens. Environ. 2005, 97, 322–336. [Google Scholar]
- Elnaggar, A.A.; Noller, J.S. Application of Remote-sensing Data and Decision-Tree Analysis to Mapping Salt-Affected Soils over Large Areas. Remote Sens. 2009, 2, 151–165. [Google Scholar] [CrossRef]
- Chen, Z.; Zheng, Y.; Chen, K.; Li, H.; Jian, J. Concentration Estimator of Mixed VOC Gases Using Sensor Array with Neural Networks and Decision Tree Learning. IEEE Sens. J. 2017, 17, 1884–1892. [Google Scholar] [CrossRef]


Disclaimer/Publisher’s Note: The statements, opinions and data contained in all publications are solely those of the individual author(s) and contributor(s) and not of MDPI and/or the editor(s). MDPI and/or the editor(s) disclaim responsibility for any injury to people or property resulting from any ideas, methods, instructions or products referred to in the content. |
© 2023 by the authors. Licensee MDPI, Basel, Switzerland. This article is an open access article distributed under the terms and conditions of the Creative Commons Attribution (CC BY) license (https://creativecommons.org/licenses/by/4.0/).