1. Introduction
Over the past few years, there has been a growing recognition of the importance of minimizing environmental pollution. This awareness has led to a gradual increase in the popularity of electric vehicles (EVs) with each passing year. Among the various energy options available, lithium-ion (Li-ion) batteries have emerged as the preferred choice for powering electric vehicles. This preference is primarily due to their established superiority over other types of batteries in terms of characteristics such as power and energy density, self-discharge rate, and cycle life [
1].
For efficient battery operation, it is vital to conduct performance prognostics on both new and recycled batteries. The primary goal of performance prognostics is to enable users to predict potential future issues, such as Remaining Useful Life (RUL), by analysing measurement data until failure occurs [
2,
3,
4,
5].
Li-ion batteries, due to their nonlinear and dynamic degradation, face challenges like capacity fade, thermal runaway, and fire risks. Specifically, in the case of Li-ion batteries, Prognostics and Health Management (PHM) aims to continuously monitor and identify internal changes in the battery’s state of health (SOH), while predicting its RUL [
3,
6,
7,
8].
The main factors contributing to SOH deterioration and decreased RUL are physical and chemical changes in the battery’s structural elements, including electrodes, separators, and electrolytes, caused by discharge and charge cycles during operation. These processes also lead to increased internal battery temperatures. Consequently, temperature monitoring plays a crucial role in optimizing battery performance, ensuring its overall health, and extending its lifespan. This necessitates temperature measurements in all battery-powered devices.
Exceeding certain temperature limits can result in mechanical damage to the battery structure, making temperature monitoring critical during battery storage and transportation.
In battery research, a wide range of temperature measurement methods has been investigated, each with its distinct advantages and limitations. Many studies primarily use empirical thermal measurements to validate established numerical models [
3]. It is noticeable that the literature is largely dominated by numerical models, with limited emphasis on experimental studies. The heat-related studies in the literature are summarized in the following subsections.
1.1. Thermal Measurements by Thermocouples
The most common are contact methods for monitoring and measuring the temperature of batteries, which use a temperature sensor that is mechanically attached to one point of the battery’s housing. The method has a number of disadvantages that essentially limit its application in measuring the batteries temperature on the whole housing.
The main limitation of this method is that the temperature is monitored only at one point of the housing, and it is necessary to use interface materials in the contact area between the sensor and the battery. The mechanical attachment of the temperature sensor to the housing is also a significant limitation in the usage of this method and depends on the type and profile of the used batteries. Another disadvantage of the method is related to the type of insulating materials which are used as a covering material over the metal housing of the battery. They have a high temperature resistance and need to be removed during temperature monitoring. An additional deficiency is the necessitated implementation of an electrical connection between the sensor and the measuring system.
The measurement of battery temperature by thermocouples has been thoroughly investigated [
9,
10,
11,
12,
13,
14,
15,
16], but such systems are limited to measuring purely relative temperature changes and require a cold junction element and analogue conditioning circuits to compensate for their poor sensitivity and linearity. In addition, it is not possible to multiplex thermocouples to a single conductor, thereby limiting their miniaturization, adding additional points of failure, and increasing the complexity, mass, and cost of the system. Further investigations [
17] were performed with fibre-optic (FBG) sensors. However, such sensors are affected by mechanical stress, thus limiting the proper and accessible mounting sites over the battery at which they can be placed and provide a sufficiently accurate temperature measurement. Their implementation is complicated and expensive. Optical technology is extremely sensitive to bending and vibration, causing significant long-term reliability issues and severely limiting its application within real-world operating conditions.
Therefore, it is necessary to place the measuring system in close proximity to the batteries, the maximum distance between them being limited purely by the requirements imposed upon the maximum length of the connecting wires.
1.2. Heat Measurements by Calorimeter
In recent years, many research teams have directed their interest towards optimizing the design of batteries and the materials from which they are made. This is related to monitoring their temperature throughout their whole structure and analysing the reasons behind its increase at certain points. Measuring the temperature at one point is not sufficiently informative and does not provide a broader idea regarding the temperature distribution throughout the whole battery structure.
In order to correctly measure the entire heat amount released by the full surface of the battery, calorimeters are used. They are bulky and expensive laboratory devices, and the temperature measurements performed by them makes the whole process time-consuming and requires specific laboratory conditions and qualified operational personnel.
There are two methods used for measuring the rate of heat generation by lithium-ion batteries.
(1) Accelerated rate calorimeter (ARC) [
18];
(2) Isothermal heat conduction calorimeter (IHC) [
19].
Both apply a control volume around the battery and calculate the heat generation rate [
20] by using Equation (1).
where
m is the battery mass (kg),
is the battery heat capacity (J/kg.K),
is the change in battery temperature with respect to time (V/K),
is the calorimeter constant (W/K),
is the surface temperature of the battery (K), and
is the temperature of the medium around the battery (K).
The ARC method measures the rate at which heat is generated by measuring the temperature rise in the battery and the heat radiated by the battery towards the environment in accordance with Equation (1).
The IHC method uses a large heat sink, contacting with the battery’s surface, to keep the battery running at a constant temperature (isothermal operation) during the measurements and therefore eliminates the first term in Equation (1). This method is limited to performing measurements only for low discharge rates, since fast discharge rates of a battery result in higher heat generation rates, which the heat sink cannot emit—resulting in a temperature gradient over the battery.
1.3. Infrared Thermography
Infrared (IR) thermography is an excellent tool for non-invasive temperature measurement [
21]. The most important factors that influence the result of the thermal imaging measurement are the values of the radiation coefficient ε, the reflected temperature, the distance between the camera lens and the object of observation, the ambient temperature, the temperature of the external optical system, and the relative humidity [
22]. For example, a significant error in thermographic measurements may occur as a result of the low value of the coefficient of ε of the material from which the battery housing is made out. The correct determination of these values allows for the minimization of their influence over the measured temperature. This can be achieved by selecting the appropriate coefficients in the thermal imaging camera software.
Another factor which affects the accuracy of thermal imaging measurements is the unsatisfactory contrast found within a recorded thermogram [
23]. Modern thermographic cameras are often equipped with automatic contrast adjustment systems, which operate in a similar manner in respect to systems used in digital cameras [
24].
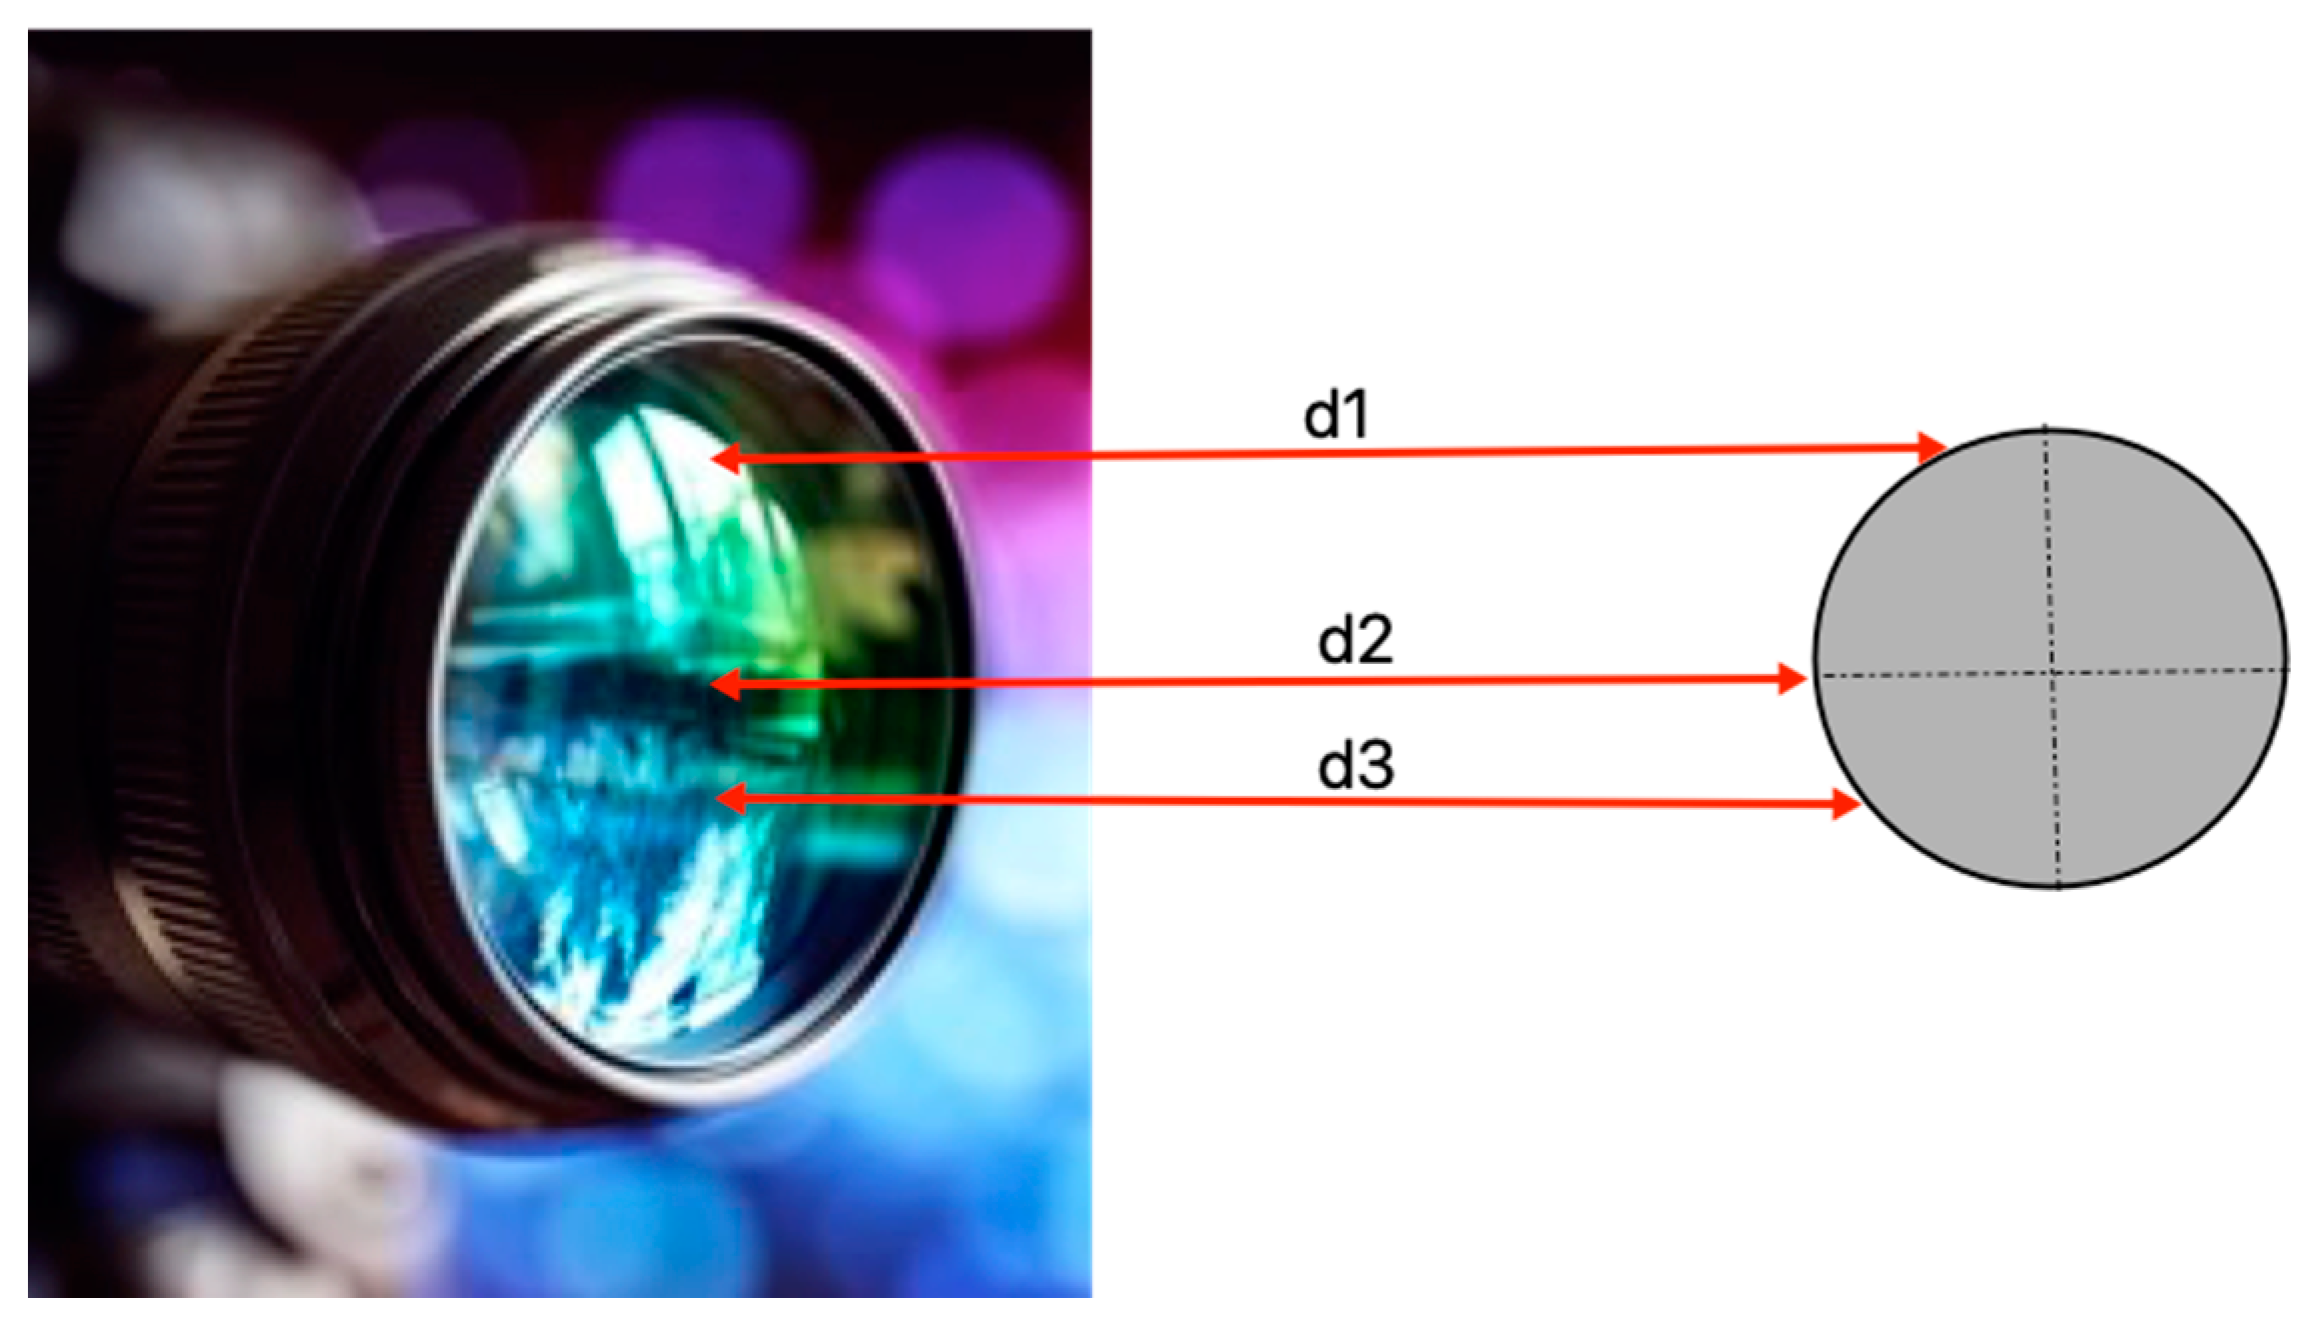
A major problem in IR temperature measurement arises as a result of the cylindrical shape of the battery housing, with this problem not existing for flat rechargeable batteries. The value of the temperature, measured at the portion of the housing that is located directly in front of the thermographic camera, differs from the value of the temperature measured in another part of the housing due to the different angular radiation coefficients
, and the differences in the distance between the thermographic camera lens and the points of interest for the battery casing, as shown in
Figure 1.
As proposed in [
25,
26], if we take into consideration the difference between the curved surface’s temperature and the environmental temperature, at shorter wavelengths, the detected error for the actual site’s temperature (due to the surface’s curvature) can be linearized for small temperature intervals through the following manner:
where
Ts is the surface temperature,
T(
) is the measured temperature at angle of view
, which depends on the position on the curved surface, and
Ta is the ambient temperature, ɛ(
) is the directional emissivity, which is a function of the viewing angle
,
C is proportionality coefficient. The measurement error Δ
T is therefore proportional to two factors: the temperature difference between the surface and ambient temperatures and the deviation of the irradiance factor value.
It is found that the recorded temperature starts to drop slightly when the viewing angle is between 40° and 60°. However, when the viewing angle is greater than 60°, the temperature drop becomes more significant with this trend being kept constant for all object of interest temperature levels [
26,
27].
1.4. Thermal Measurements by Smart Cells
Another approach for monitoring battery temperature is through smart cells, allowing for the precise monitoring of the in situ temperature within the battery’s volume [
28]. Studies have been carried out by modifying the batteries, with embedded thermal sensors (discrete thermistor elements) being placed within the battery during their manufacturing. A major limitation of this method can be found within the difficult task of achieving a long-term stability and resilience of the sensors when operating within the unfavourable operational environment of the lithium-ion cell’s inner structure. The approach allows for monitoring the actual state of the battery and a deeper knowledge regarding battery performance. It achieves an early diagnosis in cases where a violation of the safe operation limits has occurred, such as in cases of rapid discharging. By this way, the charging time of batteries can be significantly reduced without compromising the defined safety limits.
1.5. Battery Thermal Investigation by Numerical Models
The development of a numerical model for a battery heating involves the identification of all physical processes that take place during battery operation. It is necessary to understand the impact which these processes have over the components that make up a battery. In most cases, in order to describe how these components respond to the different processes, known physical laws are used, which describe the behaviours of different materials under different operating conditions. Through numerical modelling, it can be assessed how battery heating depends on different ambient temperatures, operating conditions, and materials [
29].
After a detailed analysis of the most widely used temperature measurement methods, a conclusion is made about the need for a non-destructive, non-contact method for measuring both the temperature of the entire surface of the battery housing and for visualizing the temperature fields and gradients on it. This information is extremely useful for evaluating SOH and RUL of batteries. Understanding the ongoing physicochemical processes within a battery during various operating conditions is crucial. In this context, infrared thermography emerges as a promising non-contact method for surface temperature measurement, addressing the drawbacks associated with contact methods. It enables the determination of battery temperature within the field of view of an infrared camera lens. While certain physical limitations exist, they can be mitigated through the implementation of suitable structural and software solutions.
In this study, we introduce an innovative approach for monitoring battery temperature using infrared thermography. Our objective is to leverage the key advantages of this method, particularly its non-contact nature and its ability to capture temperature data across a significant portion of the battery housing within a specific plane. By recording a video clip, we can visualize how temperature changes over time in this region. To overcome the challenge posed by the cylindrical shape of batteries, we have developed a unique method that enables us to monitor and capture temperature data across the entire battery housing. The developed method is for testing batteries in laboratory conditions. The system can be successfully used in automate quantitative and qualitative thermographic studies of the thermal behaviour of batteries during development, diagnostics, quality control in the manufacturing process, and testing.
2. Methods
In our study, we have constructed an experimental system to enhance measurement accuracy. This system enables the battery to rotate around its axis, synchronized with the thermal imaging camera’s frame rate. The resulting thermographic images are then processed using custom software. This approach effectively mitigates errors caused by viewing angle variations, representing a novel method to minimize viewing angle influence on surface temperature measurements when utilizing thermal imaging cameras. Our method allows for the determination of the temperature across the entire battery surface, providing a substantial advantage, particularly when assessing heat generation during charge or discharge. In order to achieve good repeatability in the conduct of the experiments and in order to have the possibility of carrying out comparative analyses between individual samples of batteries, the application of the method is carried out by the sequential execution of the following steps which are presented in the flowchart shown in
Figure 2.
For the purpose of the study, a system has been developed, consisting of a thermally insulated chamber, in which an executive mechanism is placed, by which the rotational movement of the battery under study is carried out. A block diagram of the developed system is presented in
Figure 2. The battery is attached to this mechanism by a holder that is made of a material with low thermal conductivity. The FLIR E8 thermal camera is placed at a distance from the test object (battery) and levelled in respect to the base at which they are placed to ensure parallelism between them. The battery is positioned relative to the central axis of the camera, which coincides with the centre of the matrix. The scheme of the developed system is presented in
Figure 3. The surface of the tested battery is at a constant temperature and is painted with thermographic paint for standard applications HERP-LT-MWIR-BK-11 which has a known emissivity of = 0.94 for the angle range from 0° to 45° (according to the data sheet of the paint). During the study, the thermal imaging camera was operating in a video recording mode with a known frame rate (fps).
Table 1 below provides information on the equipment used in constructing the laboratory system and conducting the research.
To study the temperature processes occurring in the battery during its operation, it is necessary to capture the entire surface. Therefore, while recording with the thermal camera, the battery must rotate around its axis, while being connected both to an electronic load through which the discharging current is controlled and kept stable, and to a system for measuring the voltage between the two electrodes. The main difficulties here arise due to the necessitated making of an electrical contact between the battery and the measuring devices during battery movement. To overcome these problems, an executive mechanism is developed and presented in
Figure 4.
In the developed executive mechanism, the studied battery is clamped in two holders 6 and 9, which are made out of a material with a low thermal conductivity (polyacetal). A hole is drilled in the centre of the holders, in which electrical contacts (spring loaded contacts 7) are placed. They connect the battery to the collectors 15, which are made of copper. Each of the collectors’ contacts have 4 graphite brushes, which are connected in parallel in a two-by-two manner, thus separating two different electrode pairs. One of them connects the battery to the electronic load, the other connects the battery to the voltage measurement system. Therefore, two separate pairs of wires are needed to perform the measurement. By means of one of the wire pairs, an electric circuit is realized between the electronic load and the battery, where the discharge current flows through, and by means of the second pair of wires, the voltage between the electrodes of the battery is measured. The separation of current and voltage electrodes eliminates the error arising from contact resistances during measurement. The rotational movement of the battery is carried out by the stepper motor 1. The rotor axis of the stepper motor is connected to one of the holders 6, through a flexible coupling 2. The rotary movement of the holders is carried out in the bearing bodies 13 by means of four ball bearings. The bearing bodies are clamped to the foundation by means of square clamps 5 at the centre of which a hole is turned. Inserting the battery into the device is performed by loosening the clamps. In this way, it is possible to carry out an axial displacement of the holders and change the distance between them. The control of the stepper motor is realized by a microcontroller board, which is connected to a personal computer via a Bluetooth interface. Specially developed software is installed on the computer, through which the speed of rotation of the motor can be controlled.
Battery movement and camera recording speeds are constant and synchronized. Therefore, the angular displacement of the battery can be easily determined for each frame of the captured video. The following formula can be used for this purpose:
where:
N [°/f] defines the angular displacement of the battery, which represents the degrees for one frame;
V [rps] is the battery rotation speed; fps is the frame rate.
To process the obtained thermographic video, a specialized author’s software based on the Python programming language is developed. The thermographic video is captured during the test procedure according to the algorithm of the developed method. The battery is rotating in a synchronized step motion as it is discharging. IR video processing is then performed, dividing the clip into individual frames (images). The presented photos at the
Figure 5,
Figure 6,
Figure 7,
Figure 8,
Figure 9,
Figure 10,
Figure 11,
Figure 12,
Figure 13,
Figure 14,
Figure 15,
Figure 16 and
Figure 17 are informative, and they are intended only to illustrate the operation of the developed software.
Figure 5 shows a thermographic image of the tested battery clamped in the holder, with the consecutive numbers of the pixels on the
x and
y-axis. The thermographic image is a specifically selected frame from a captured thermographic clip.
Figure 6 shows the same image rotated so that its axis is perpendicular to the
x-axis.
Figure 5.
A thermographic image of the tested battery clamped in the holder.
Figure 5.
A thermographic image of the tested battery clamped in the holder.
Figure 6.
A rotated thermographic image of the tested battery.
Figure 6.
A rotated thermographic image of the tested battery.
Figure 7 shows a cropped part of the image, which represents the corresponding area of interest in which the studied battery is located. The black horizontal line shows the cross-section for a plane of our choice, perpendicular to the plane of the presented image. The boundaries of the battery surface are outlined with dashed lines on the left and right (
Figure 7 and
Figure 8).
The distribution of temperature over the selected cross-section is shown in
Figure 8, with the serial numbers of the pixels on the
x-axis, and the temperature in °C on the
y-axis. In this figure, the variation of the measured temperature at different parts of the battery surface is clearly visible, which is due to the curvature of the cylindrical surface.
Figure 8 shows that the temperature is highest in the centre of the battery (in this case between 20 and 45 pixels) and decreases towards the edges of its surface.
The main reason for this effect is the curvature of the cylindrical surface, due to which the radially located elements of the surface are oriented at a different angle in respect to the lens of the thermal imaging camera.
Figure 7.
A cropped part of the image, which represents the corresponding area of interest.
Figure 7.
A cropped part of the image, which represents the corresponding area of interest.
Figure 8.
The distribution of temperature in the selected cross-section, presented in
Figure 7.
Figure 8.
The distribution of temperature in the selected cross-section, presented in
Figure 7.
As it is known, the energy of the infrared radiation falling over the detector of a thermal imaging camera depends on the viewing angle at which the object under study is photographed. Therefore, this angle has a significant influence on the magnitude of this error, which occurs when measuring temperature. Since in some practical applications the viewing angle can vary widely, its relationship with the measurement error has been studied in detail [
30]. The research carried out so far clearly proves that the change in viewing angle affects the measurement accuracy of thermal imaging cameras and that this will lead to an error in the obtained results. When conducting temperature studies by capturing a thermal image, it has been found that a viewing angle of 60° leads to a 4–5% error in temperature measurement [
31].
To minimize the error that occurs when measuring the temperature of cylindrical Li-ion batteries at different areas of their surface—the causes of this error must be analysed and eliminated. The main reason behind the occurrence of this error is the curvature of the cylindrical surface, due to which the radially located elements of the surface are oriented at a different angle in respect to the lens of the thermal imaging camera (
Figure 9).
Figure 9.
Location of the investigated battery relative to the central axis of the camera.
Figure 9.
Location of the investigated battery relative to the central axis of the camera.
To correctly conduct temperature studies by a thermal imaging camera, it is necessary to know the following parameters: the emissivity of the surface of the studied object, atmospheric absorption, which is a function of the distance between the camera and the object, and the viewing angle at which the object is photographed. The hemispherical emissivity depends on the physicochemical properties of the object and is described by the following formula:
where
T is the temperature,
M(
T) is the radiant exitance of that surface,
MB(
T) is the radiant exitance of a black body at the same temperature as that surface. The emissivity of an object is not only a function of its temperature, but also depends on wavelength and time [
30].
In most cases, the value of the emissivity as a function of the viewing angle is unknown [
26,
32,
33]. The emissivity is known only when the viewing angle is equal to 0°. Thus, the present study is aimed towards determining the value of the viewing angle at which the temperature of cylindrical batteries can be reliably measured. With respect to the central axis of the camera, the viewing angle
θv at any point on the surface is determined by the angle between its normal line and the central axis of the IR camera.
The relationship between pixel sequence number and viewing angle for a particular measurement is illustrated in
Figure 10.
Figure 10.
The relationship between pixel sequence number and viewing angle.
Figure 10.
The relationship between pixel sequence number and viewing angle.
The viewing angle is determined by the following formula:
where:
r is the radius of the battery,
d is the distance from the camera lens to the battery.
The angular position of the corresponding pixel is determined by the formula:
where:
n is the number of pixels between the dashed lines (area of interest from the battery surface—
Figure 11 and
Figure 12).
Figure 11.
The distribution of temperature of the area presented in
Figure 12.
Figure 11.
The distribution of temperature of the area presented in
Figure 12.
Figure 12.
The area of interest from the battery surface.
Figure 12.
The area of interest from the battery surface.
The experimentally obtained plotting of temperature versus viewing angle is consistent with the results described in [
30].
The influence of the viewing angle is evaluated based on the analysis of the measurement error values. The measurement errors are calculated using the following dependencies:
where:
Tα is the temperature value measured with a thermal imaging camera for the given viewing angle,
T0 is the temperature measured with a thermal imaging camera for the angle 0°.
The developed method allows for us to determine the magnitude of error in measuring the temperature of each pixel depending on its angular position relative to the central axis of the camera. In this way, it is possible to exclude pixels with an error greater than a certain value by cutting the corresponding area from the thermographic image of the battery. The linear profile of the temperature distribution in a particular cross-section is shown in
Figure 11. Through this profile, the area of the battery surface (surrounded by dashes) which is the object of the measurement, is determined.
Figure 12 shows the cut segment of the battery surface, which is within a spatial angle error of angular position below 0.25 °C.
To analyse the temperature gradients occurring on the surface of the battery, a method is developed for 3D visualization of the temperature in the cut area of interest.
Figure 13 shows the cut area from the thermographic image of the battery with an error up to a certain value which corresponds to the 3D visualization of the temperature in
Figure 14. In this way, a detailed picture of the occurrence of hot spots and temperature changes over the battery surface, which cannot be seen easily in the thermographic image, is obtained. This method improves the quality of the analysis.
Figure 13.
The cut area from the thermographic image of the battery with an error up to a certain value.
Figure 13.
The cut area from the thermographic image of the battery with an error up to a certain value.
Figure 14.
A 3D visualization of the temperature in the cut area of interest.
Figure 14.
A 3D visualization of the temperature in the cut area of interest.
Since the area and angular position of the cut part of the battery surface are known, the number of segments required to build a 3D image of the temperature distribution of the battery surface can easily be determined. To create this image, it is necessary to know the number of segments from which the corresponding areas should be cut. This is performed according to the formula:
where:
is the number of segments,
is the viewing angle.
After determining the number of segments, it is necessary to determine the angular displacement N of the battery for each segment by Formula (3).
Based on 2
θ and
N, it is determined how many segments should be skipped over all captured images and which frames will participate in the construction of the 3D thermal image of the battery surface. According to this algorithm the 3D thermal image of the battery surface is constructed.
Figure 15 clearly shows the temperature distribution on the surface of the battery during the discharge process. The 3D battery temperature profile is a rotational figure presented in 3D space. The height of the figure corresponds to the number of pixels marked along one of the axes corresponding to the height of the object. The centre of rotation of the figure has coordinates (0, 0) in the plane described by the other two axes, which represent a temperature scale. Each point on the graph is described by a temperature vector in this plane. The length of the vector is equal to the temperature of that point. The colour scale of the figure allows a clearer perception of the temperature distribution on the surface of the object. The software provides an option to rotate the image, which enables a detailed analysis of the temperature distribution.
Figure 15.
A 3D thermal image of the battery surface.
Figure 15.
A 3D thermal image of the battery surface.
The developed method allows determining the temperature distribution throughout the battery surface, making it possible to visualize the temperature gradients occurring at the surface and at different times of its operation. The resulting measurement values also allow to accurately determine the average value of the real battery temperature.
As shown above, the 3D image is constructed by a certain number of segments calculated by Formula (10). The average temperature of each segment is calculated by the Formula (11):
where:
Tsegment is the average temperature of a segment;
m is the number of pixels contained in this segment;
Tm is the temperature of the
mth pixel.
The average temperature of the battery surface is determined using the Formula (12):
where:
Tsurfase is the average temperature of the battery surface;
nc is the number of frames contained in 3D image;
T is the temperature of the
ncth segment.
To extend the applicability and feasibility of the developed method by using the data obtained by a larger set of thermal imaging cameras, available on the market, an algorithm is developed for analysing the temperature in non-radiometric JPEG images. In this way, it is possible to analyse data obtained by cheap thermal imaging cameras that cannot record in a radiometric format.
To determine the temperature of each pixel of the thermographic image, which is recorded in a JPEG format, some settings must be adjusted. For this purpose, after the software loads the corresponding frame, the temperature scale is automatically cut out from the image.
The position of the temperature scale in each frame depends on the model of the specific thermal imaging camera and the resolution of the image. Therefore, in all frames captured with a certain IR camera, the temperature scale will be located at the same place. For this reason, it is possible to pre-set the coordinates of which part of the area covering the temperature scale is cut out, as shown in
Figure 16a,b.
Figure 16.
(a) JPEG thermal image with temperature scale. (b) JPEG thermal image with the cropped temperature scale.
Figure 16.
(a) JPEG thermal image with temperature scale. (b) JPEG thermal image with the cropped temperature scale.
After cutting the scale, the total number of the pixels part of the colourbar image are determined, as well as their distribution along the X and Y axes (the number of columns and rows).
The numerical values representing the colour coordinates (R, G, B) of each pixel are extracted and stored in an array with a specific structure. This array is used to construct a k-d binary tree, where each node corresponds to a point in k-dimensional space. This process allows us to index n data points, which in this case are the pixels of the temperature scale image, in the dimension defined by (R, G, B). To determine the temperature of a specific pixel from the thermogram image, a fast nearest neighbour search is performed. This algorithm aims at finding the point in the tree that is closest to a given input point which is most closely representative of the pixel whose temperature we want to determine.
The relationship between temperature
Tc and different scale colours can be determined by the following formula:
where
Tmax and
Tmin are the minimum and maximum temperature values that are written in the thermogram.
N is the number of rows in the matrix of pixels depicting the scale.
Therefore, if we can determine the position of the nearest neighbour of the studied pixel in the k-d tree, we will know on which row of the scale image it is located.
Another major disadvantage of digital thermal imaging systems is related to their limited resolution. The spatial resolution of a thermal imaging camera defines the smallest detail within the field of view (FOV) which can be captured. To correctly determine the temperature of an object, its size must be greater than the spatial resolution of the thermal imaging camera. Higher resolution provides the ability to clearly see more and finer details over measured object’s surface. Therefore, a clearer infrared (IR) image can be obtained, resulting in a more accurate measurement. Since the cost of a thermal imaging camera increases with increasing resolution, the available budget often dictates the choice of such a camera.
The physical nature of emerging limitations in digital thermal imaging systems has long been known. The discrete nature and finite number of pixels of detector arrays is a major limiting factor that limits the size of the smallest image area that can be detected. Another source of error is the camera’s optical system, which contributes to image blur [
9]. This effect is particularly pronounced in thermal imaging systems due to their relatively low resolution. All this leads to a lack of essential information in thermographic images.
The developed software offers the possibility of a fourfold increase in resolution of the images obtained by the thermal imaging camera. This is achieved using a mathematical algorithm that is applied to the image obtained from a lower resolution detector. It can be said that in this way the effective image quality is improved without increasing the cost of the entire measurement system. An EDSR method proposed by Lim et al. is used [
32], which has a performance exceeding that of current methods for upscaling the resolution.
The effect of applying the used algorithm for increasing the resolution of the image is presented in
Figure 17, where in
Figure 16a the original image obtained by the thermal camera is presented, and in
Figure 17b an image with a four times higher resolution is presented.
Figure 17c shows the magnified fragment of the original image and
Figure 17d shows the enlarged fragment of the image with an increased resolution.
Figure 17.
(a) Original image. (b) 4× resolution image. (c) Enlarged fragment of the original image. (d) Enlarged fragment of the image with increased resolution.
Figure 17.
(a) Original image. (b) 4× resolution image. (c) Enlarged fragment of the original image. (d) Enlarged fragment of the image with increased resolution.


