Abstract
Lithium–ion batteries (LIBs) are used in many personal electronic devices (PED) and energy-demanding applications such as electric vehicles. After their first use, rather than dispose of them for recycling, some may still have reasonable capacity and can be used in secondary applications. The current test methods to assess them are either slow, complex or expensive. The voltage integral during the constant current (CC) charge of the same model of LIBs strongly correlates with the state of health (SOH) and is faster than a full capacity check. Compared to the filtering requirement in the incremental capacity (IC) and differential voltage (DV) or the complex analysis in the electrochemical impedance spectrum (EIS), the voltage integral offers a simple integration method, just like the simple capacity Coulomb’s counter that is installed in many BMS for estimating the SOC of LIBs. By obtaining the voltage integral of a relatively new cell and an old cell of the same model with known SOH at a given ambient temperature and CC charge, the SOH of other similar cells can be easily estimated by finding their voltage integrals.
1. Introduction
Many personal electronic devices (PEDs) such as smartphones, laptops, e-cigarettes, digital cameras, consumer drones and higher-energy-demanding applications such as electric vehicles, electric bikes, electric power tools and grid applications use lithium–ion batteries (LIBs) [1]. The increasing growth in the adoption of the LIB in rechargeable batteries can be attributed to its light weight and size, low self-discharge, higher energy density, higher power density as well as its longer life span and efficiency when compared to nickel metal hydride (Ni-MH), nickel–cadmium (Ni-Cd) and lead–acid batteries, which had an earlier start [2,3].
After their first use, rather than dispose of them for recycling, some may still have reasonable capacity and can be used in a secondary application. Some used batteries taken from electric vehicles and reused in grid applications have been found to have performance similar to new lithium batteries at a reduced cost [4,5,6]. This may be the case for LIBs in PEDs with the potential for a second life in other electrical systems. With the staggering number of discarded PEDs, the second-life LIB may have valuable capacity for miniature renewable systems such as <100 Wh solar systems. Other examples of secondary use can be in off-grid low-energy-intensity applications such as phone chargers, home lighting, flash lights and radios. Despite the supposed benefit of a second life, old cells must be assessed to ascertain whether they still have some useful capacity.
The assessment for the second life includes a physical examination, a review of historical records and performance-based tests [7]. Physical examination checks for any deformity, cracks, corrosion or leakages that could immediately condemn the cells for recycling if present. Historical examination checks for the calendar year, cycling time and specific operating conditions in the past that can damage the cells. The records in the Battery Management System (BMS) have been used to study how the cycle life and calendar life affect the degradation of the battery [8]. Unfortunately, some BMS data have proprietary laws protecting them, and historical data of some BMS do not exist. Another challenge to assessing the LIBs with a chance of being re-used is the unavailability of information on the technical specifications of many installed LIBs. The reason for this is that many battery manufacturers directly supply electric device manufacturers, so details on LIB specification are known between the companies but not available to the public or prospective second-life assessors. As observed in opened battery packs, internal codes or model numbers printed on the LIB do not provide enough details for second-life assessment. This makes physical and performance-based examination of the spent cells expedient.
Consequently, understanding the failure modes gives some valuable information for proper assessment. During manufacturing, the moisture content of the cell electrolytes and electrodes can result in early ageing [9]. After production, LIBs have been found to experience capacity fades during the charge and discharge cycle and even when stored for a long time. The temperature, the current during charge and discharge, the operational voltage (overcharge and over-discharge), depth of discharge and the state of charge during storage affect the battery’s overall health [10]. The mechanisms that lead to the degradation may result from growth in the solid electrolyte interphase (SEI) and decomposition of the binder and electrolyte [11]. Other mechanisms include lithium deposition, structural disordering, electrode particle cracking, corrosion of current collectors and transition metal dissolution. These mechanisms can lead to loss of active material (LAM) and loss of lithium inventory (LLI) and may increase the battery’s internal resistance. The various degradations lead to both capacity and power fade.
The power fades in spent LIB cells is related to the increase in the internal resistance of the cells [12,13]. Moreover, the fade in the capacity of a spent LIB, which can be described as the state of health (SOH), is the ratio of the battery’s present capacity compared to its nominal rated capacity [10].
where Q is the current capacity and is the nominal capacity. A benchmark on the SOH can then be used to decide whether it can have a second life. For example, ref. [7] says that retired batteries with an SOH of value less than 75% when charged and discharged at 0.3 C at room temperature are not appropriate to use for a second time. Generally, the intended second life application would determine the tolerable SOH limit, while the SOH level where the cell shows signs of rapid degradation becomes the hard limit for reuse [14].
Therefore, for the SOH calculation, a capacity test is carried out first by fully charging the LIB to the maximum cut-off voltage with constant current (CC) and then with constant voltage (CV) until the cut-off current is reached [7]. This is 100% state of charge (SOC). Subsequently, the cell is discharged at a constant current and ambient temperature until the cell terminal voltage reaches the low cut-off voltage. The discharge capacity obtained by Coulomb’s counting in the discharge phase is the present capacity of the cell.
where is the time at full charge, is the time at low cut-off voltage and is the discharge current at time, t. This value depends on the temperature and the current. Unfortunately, carrying out a full charge and discharge of a spent lithium–ion cell will take considerable time with attendant resources.
Other methods used in estimating the SOH include data-driven methods, model-based methods, experimental methods and a combination of two or more methods [15,16]. The model-based methods include the equivalent circuit model (ECM), electrochemical models, Kalman filters and empirical models. The data-driven techniques use machine learning, including neural networks, autoregressive-moving average models and support vector machines. Unfortunately, the limitation of the model-based and data-driven methods for assessing the SOH of spent LIB is the lack of historical data from the BMS for prospective second-life companies until the regulatory framework for full disclosure of battery data is developed and enforced [6]. Having a repository of model parameters of all the available commercial cells to assess old cells for a second life is a daunting challenge.
Another experimental method, besides the full capacity check for estimating the SOH, is the electrochemical impedance spectroscope (EIS). It can be used to study LIB characteristics [17]. This method involves applying a small sinusoidal perturbation signal, which can be voltage or current, to the cell and measuring the corresponding sinusoidal response. The gain in amplitude and phase change shows the characteristic behaviour of the cell over a wide frequency range. Over the frequency spectrum, some relationship exists between EIS measurement results and battery ageing [18,19,20,21]. For example, ref. [22] carried out EIS measurements on commercial 18650-format LiCoO2 cells and found that the impedance response at 316 Hz is reflective of the SOH and is less affected by the change in the SOC at that frequency. Essential factors to consider in EIS measurements are the nature (current or voltage) and magnitude of disturbance to optimise the signal-to-noise ratio while sustaining a linear system response [17]. Unfortunately, these are difficult to standardise in spent cells, where original settings or historical measurements that can serve as a reference may not be available.
Likewise, incremental capacity (IC) and differential voltage (DV) have been applied in studying various degradation modes together with estimating and predicting the SOH [23]. From the measurement in the CC charge of the LIB, the IC curve is derived by differentiating the cell’s capacity with respect to terminal voltage and plotting against the open circuit voltage. At the same time, the DV is the inverse of IC, whereby the terminal voltage is differentiated with respect to capacity. The various peaks and valleys in the IC and DV decrease and increase, respectively, as the cell degrades; this correlates with the SOH. However, special filtering needs to be implemented to minimise the effect of noise in the IC/DV methods for proper estimation.
Another research used the CV phase to determine the SOH for nickel–manganese–cobalt (NMC), nickel–cobalt–aluminium (NCA) and lithium–cobalt–oxide (LCO) batteries. The cells were subjected to calendar ageing, and the first-order response of the current during the CV phase of charging was used to calculate a parameter that strongly correlates with the SOH [24]. In the same paper, the CV duration for the lithium–iron–phosphate (LFP) battery had a simple linear relationship with the SOH. From the above result, the CV phase behaves differently for different chemistry types, so different algorithms must be adopted for different cell types. In another work, the integrated voltage was used to carry out online SOH estimation on an LIB in which the voltage was integrated during a CC charge between 3.85 V and 4.2 V [25]. It was tested on an accelerated-aged cell, and a strong correlation between the integral and the SOH was observed as the cell degraded. However, the test was not carried out with varying currents to see the impact of the current on the correlation with the voltage integral value. Many battery testing and charging systems measure current, voltage and temperature and find the cell’s capacity using the simple integration of current measurement with respect to time [25,26,27]. This can be easily adapted to the voltage integral whereby a simple addition of the algorithm for computing the voltage integral, similar to Coulomb’s counting for the charge capacity, can be made. Using an existing system with less retrofitting of new hardware or electronics motivated the research into the relationship between the SOH and the voltage integral values when the spent cells are charged at constant current and temperature.
Thus, this work examines the relationship between the voltage integral and the SOH while considering the entire voltage range during the CC charge for a spent LIB. In addition, various charge currents were applied to see the current’s effect on the integrated voltage. The voltage integral, , or the integrated voltage, as in Equation (1), is expressed as the integration of the terminal voltage across the cell with respect to time at a particular constant current charge and constant ambient temperature.
where is the time at low cut-off voltage or beginning of CC charge, is the time at high cut-off voltage or end of CC charge and is the terminal voltage at the time t. The value of the voltage integral was compared with the SOH of spent cells, and the result is presented here.
2. Materials and Methods
The 18650-format lithium–ion cells were obtained from old laptop battery packs and cells with unknown history. Table 1 shows the list of the cells. The following parameters were searched online: nominal capacity (mAh), nominal voltage, low cut-off voltage, high cut-off voltage, charge mode, standard charge current and standard discharge current [28,29,30,31]. Note that the source of the details could not be verified with the battery manufacturers because they do not make the details readily available on their websites.

Table 1.
Spent lithium–ion batteries.
The actual capacity of the cells was obtained after a charging and discharging cycle in a 25 C temperature chamber. The cells were charged using CC (750 mA) and constant voltage (4.2 V) with a cut-off current of C/50. Discharge was carried out at C/3 to 3 V to obtain the discharge capacity, and the discharge capacity ratio to the nominal capacity was used to calculate the SOH.
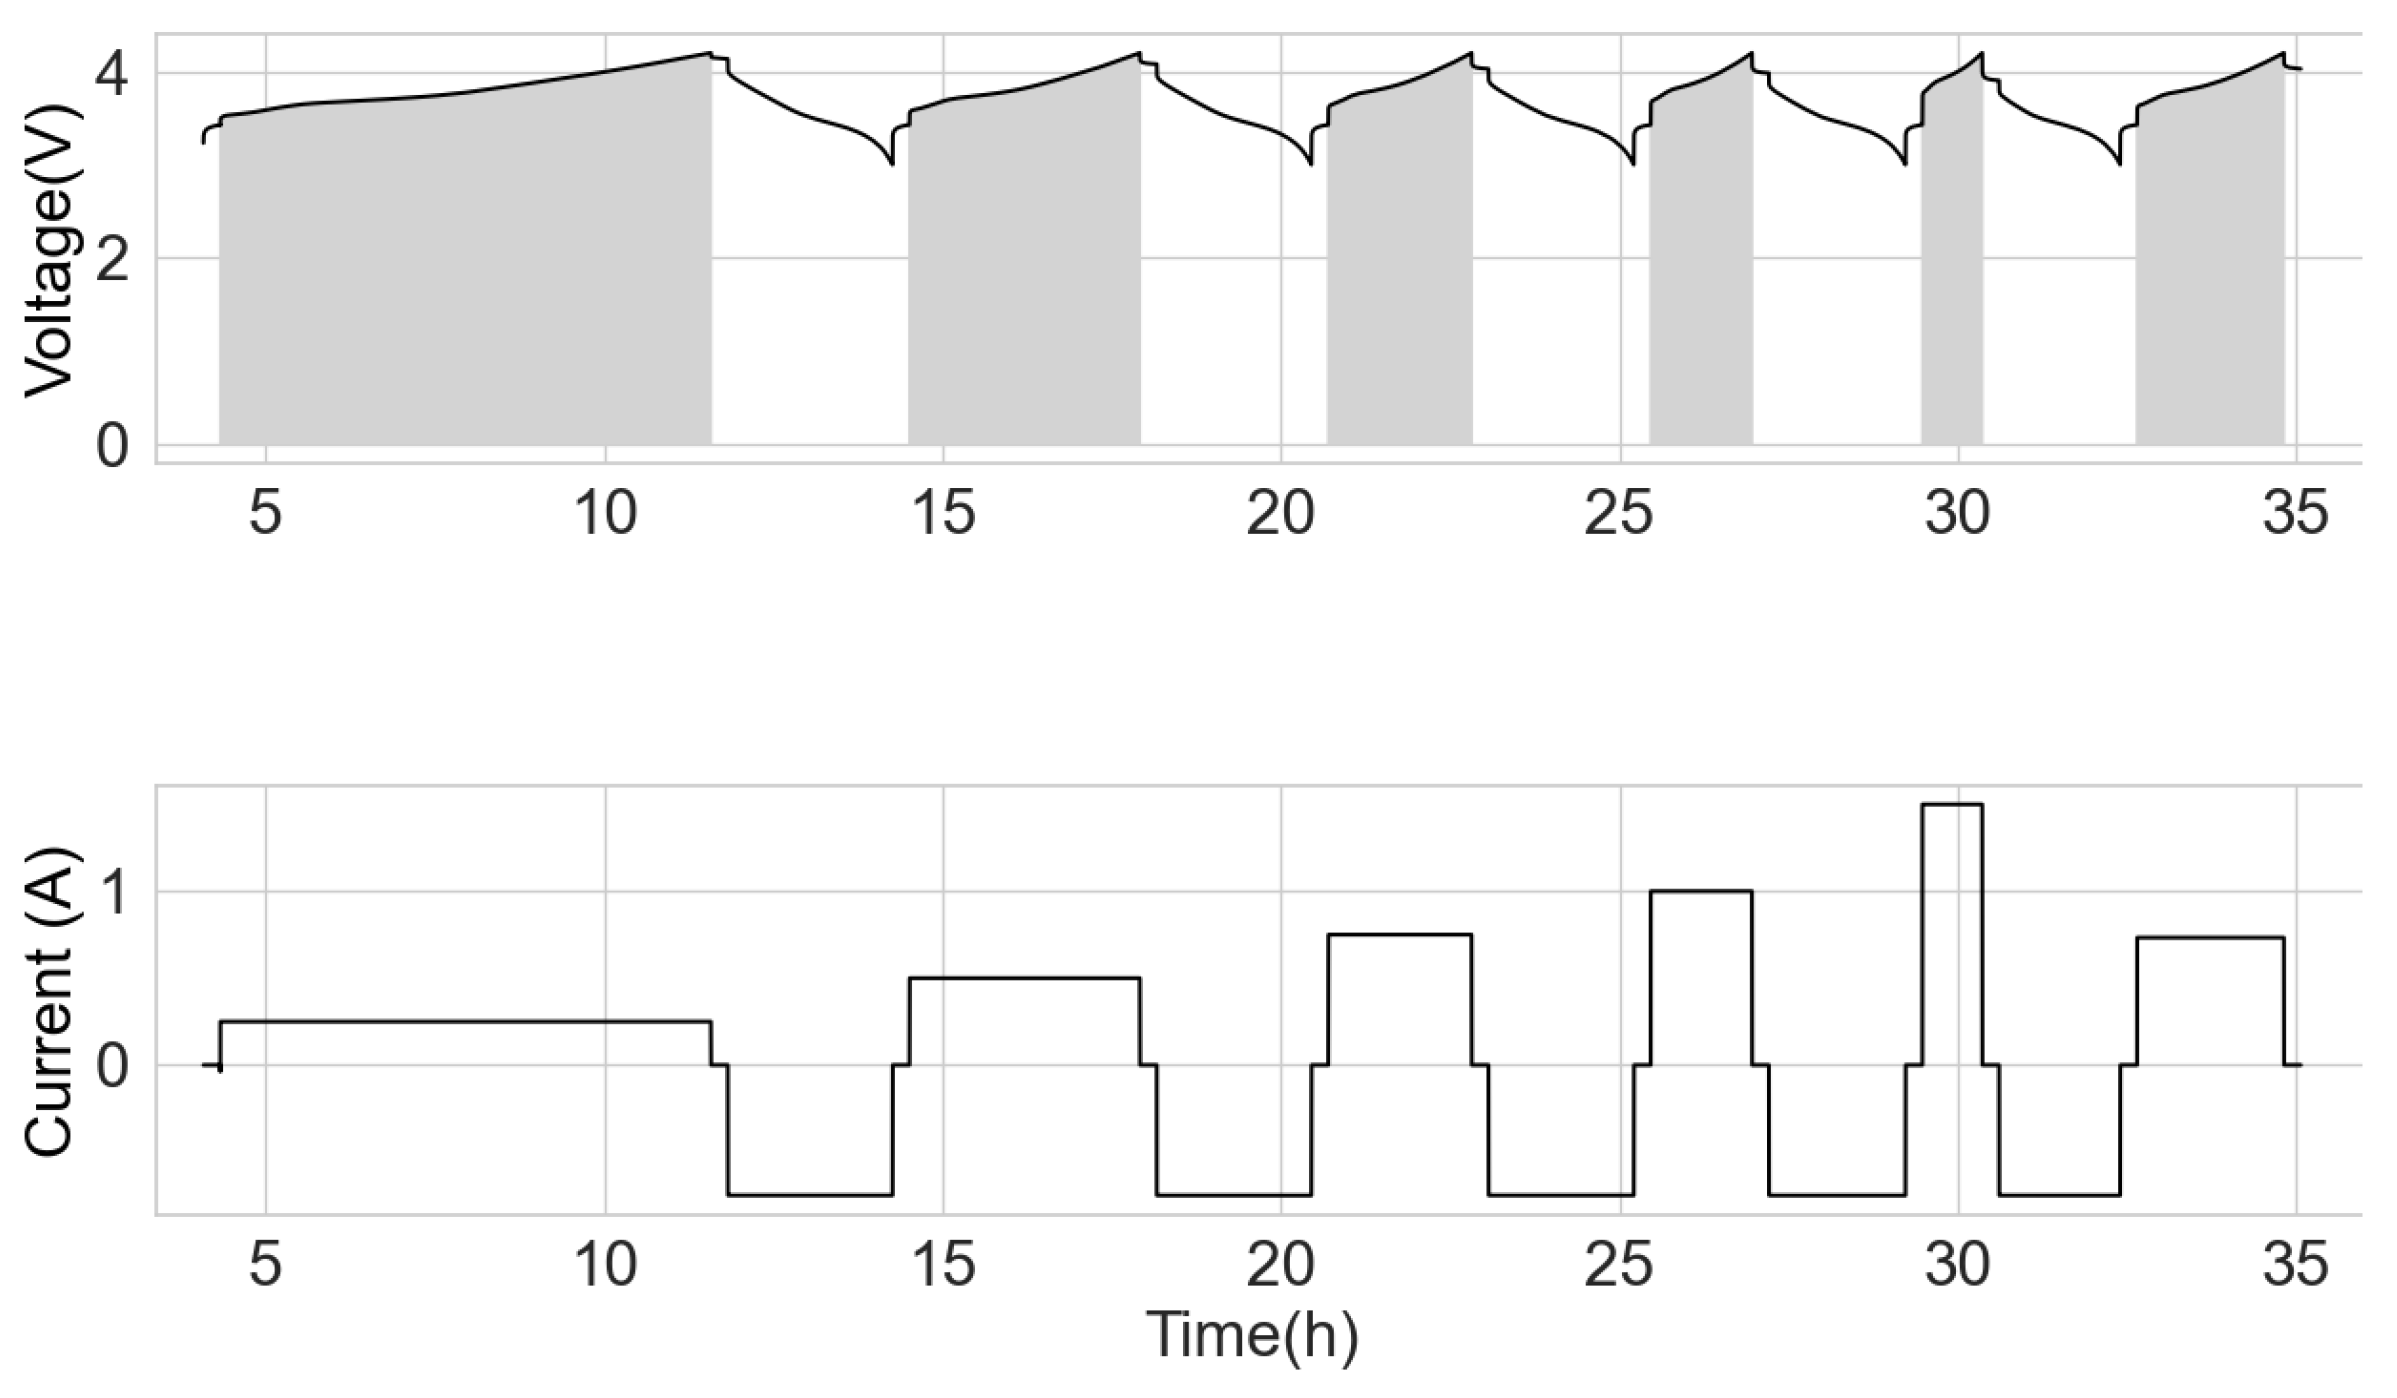
After the capacity test, the cells were charged in the CC mode at the current of 250 mA, up to the cut-off voltage of 4.2 V with a rest of 15 min. Subsequently, it was discharged to 3 V at 750 mA and had a 15 min rest time. This cycle was repeated at various CC charge currents of 500 mA, 750 mA, 1000 mA, 1500 mA and C/3 (current = nominal capacity divided by 3 of the respective cells). The range from 3 V to 4.2 V was adopted to have some uniformity for all the various cells, more so that only fringe capacity exists at the lower boundary. The cells were subjected to the test procedure, as shown in Figure 1. The shaded area is the voltage integral at the respective charge current.
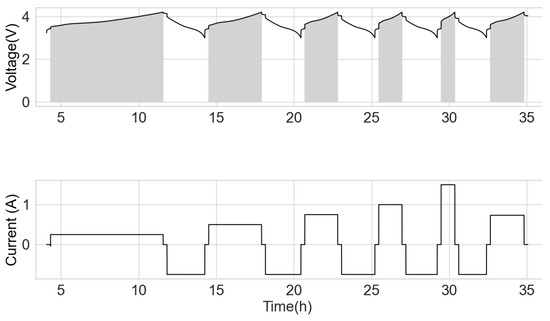
Figure 1.
Voltage integral test schedule.
With a uniform sampling time in the voltage measurement, the approximate integral can be obtained using Simson’s rule for integration [32].
where
where
and where N is an even number of sub-intervals of [, ].
3. Results
Using a measurement interval of 1 s, Simpson’s rule [33] was implemented in Python to obtain the voltage integral during the CC charge. For easy comparison, normalised voltage integral (A · Vh) was calculated by multiplying the voltage integral by the charge current.
3.1. Same Models with Common History
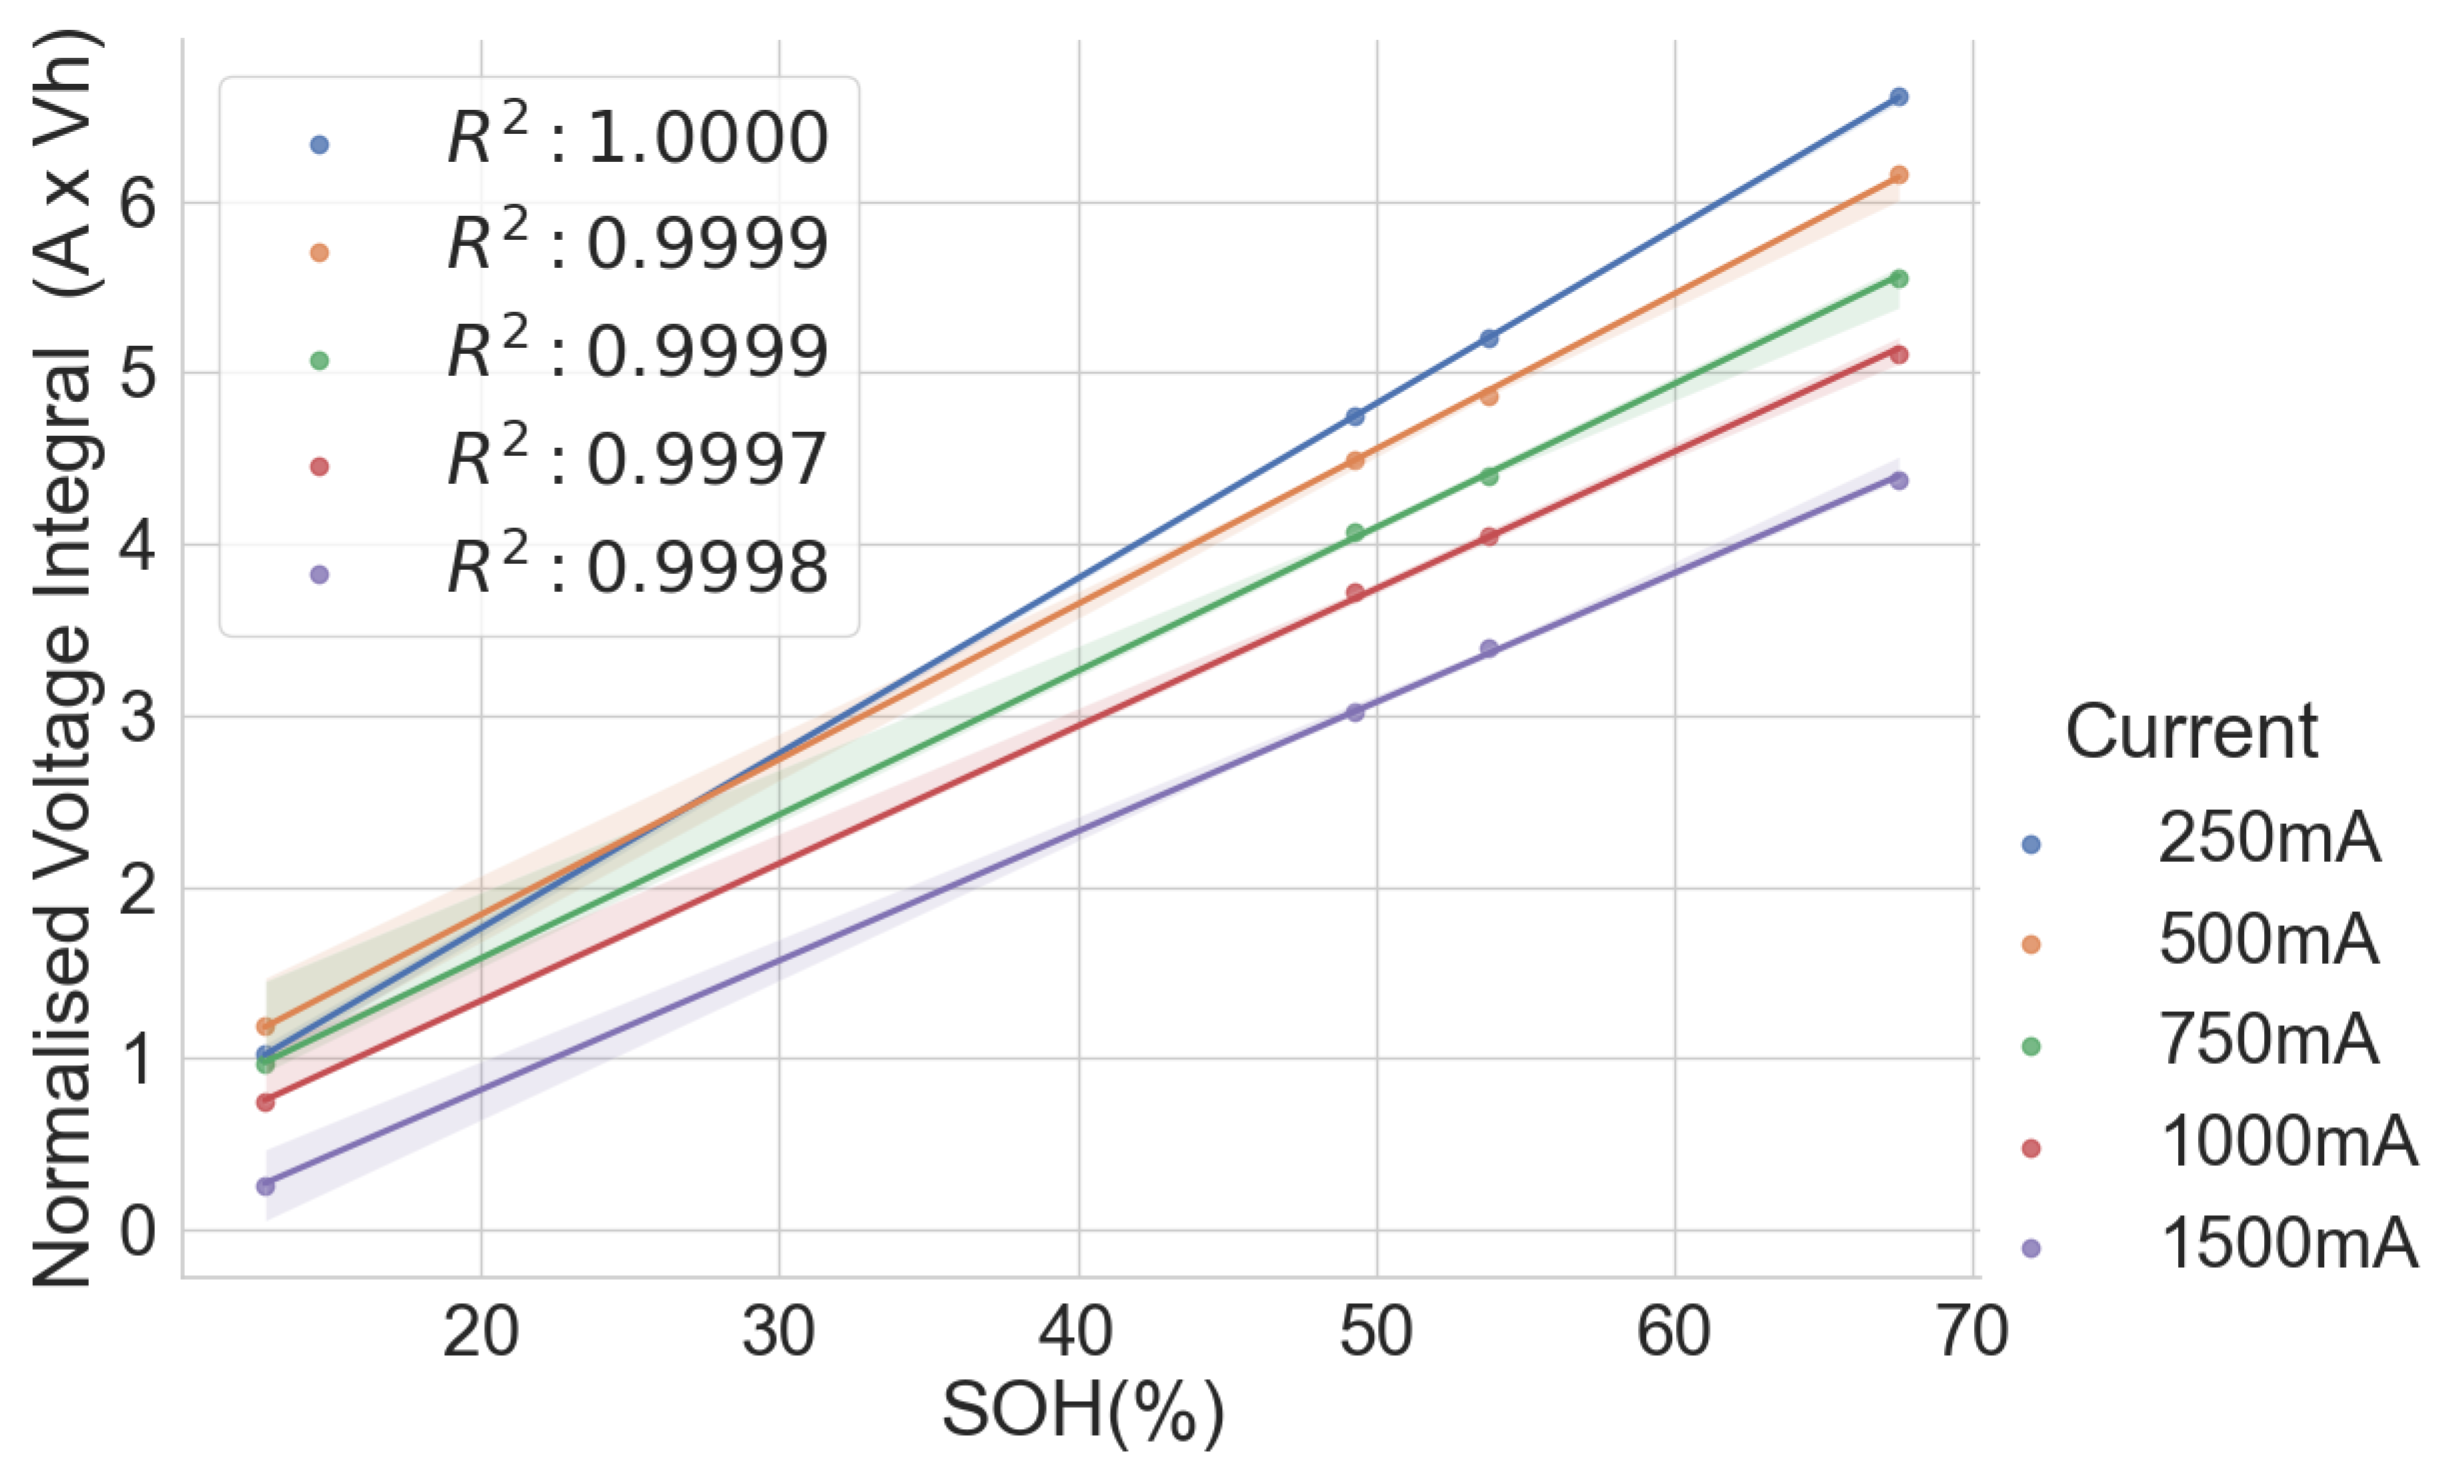
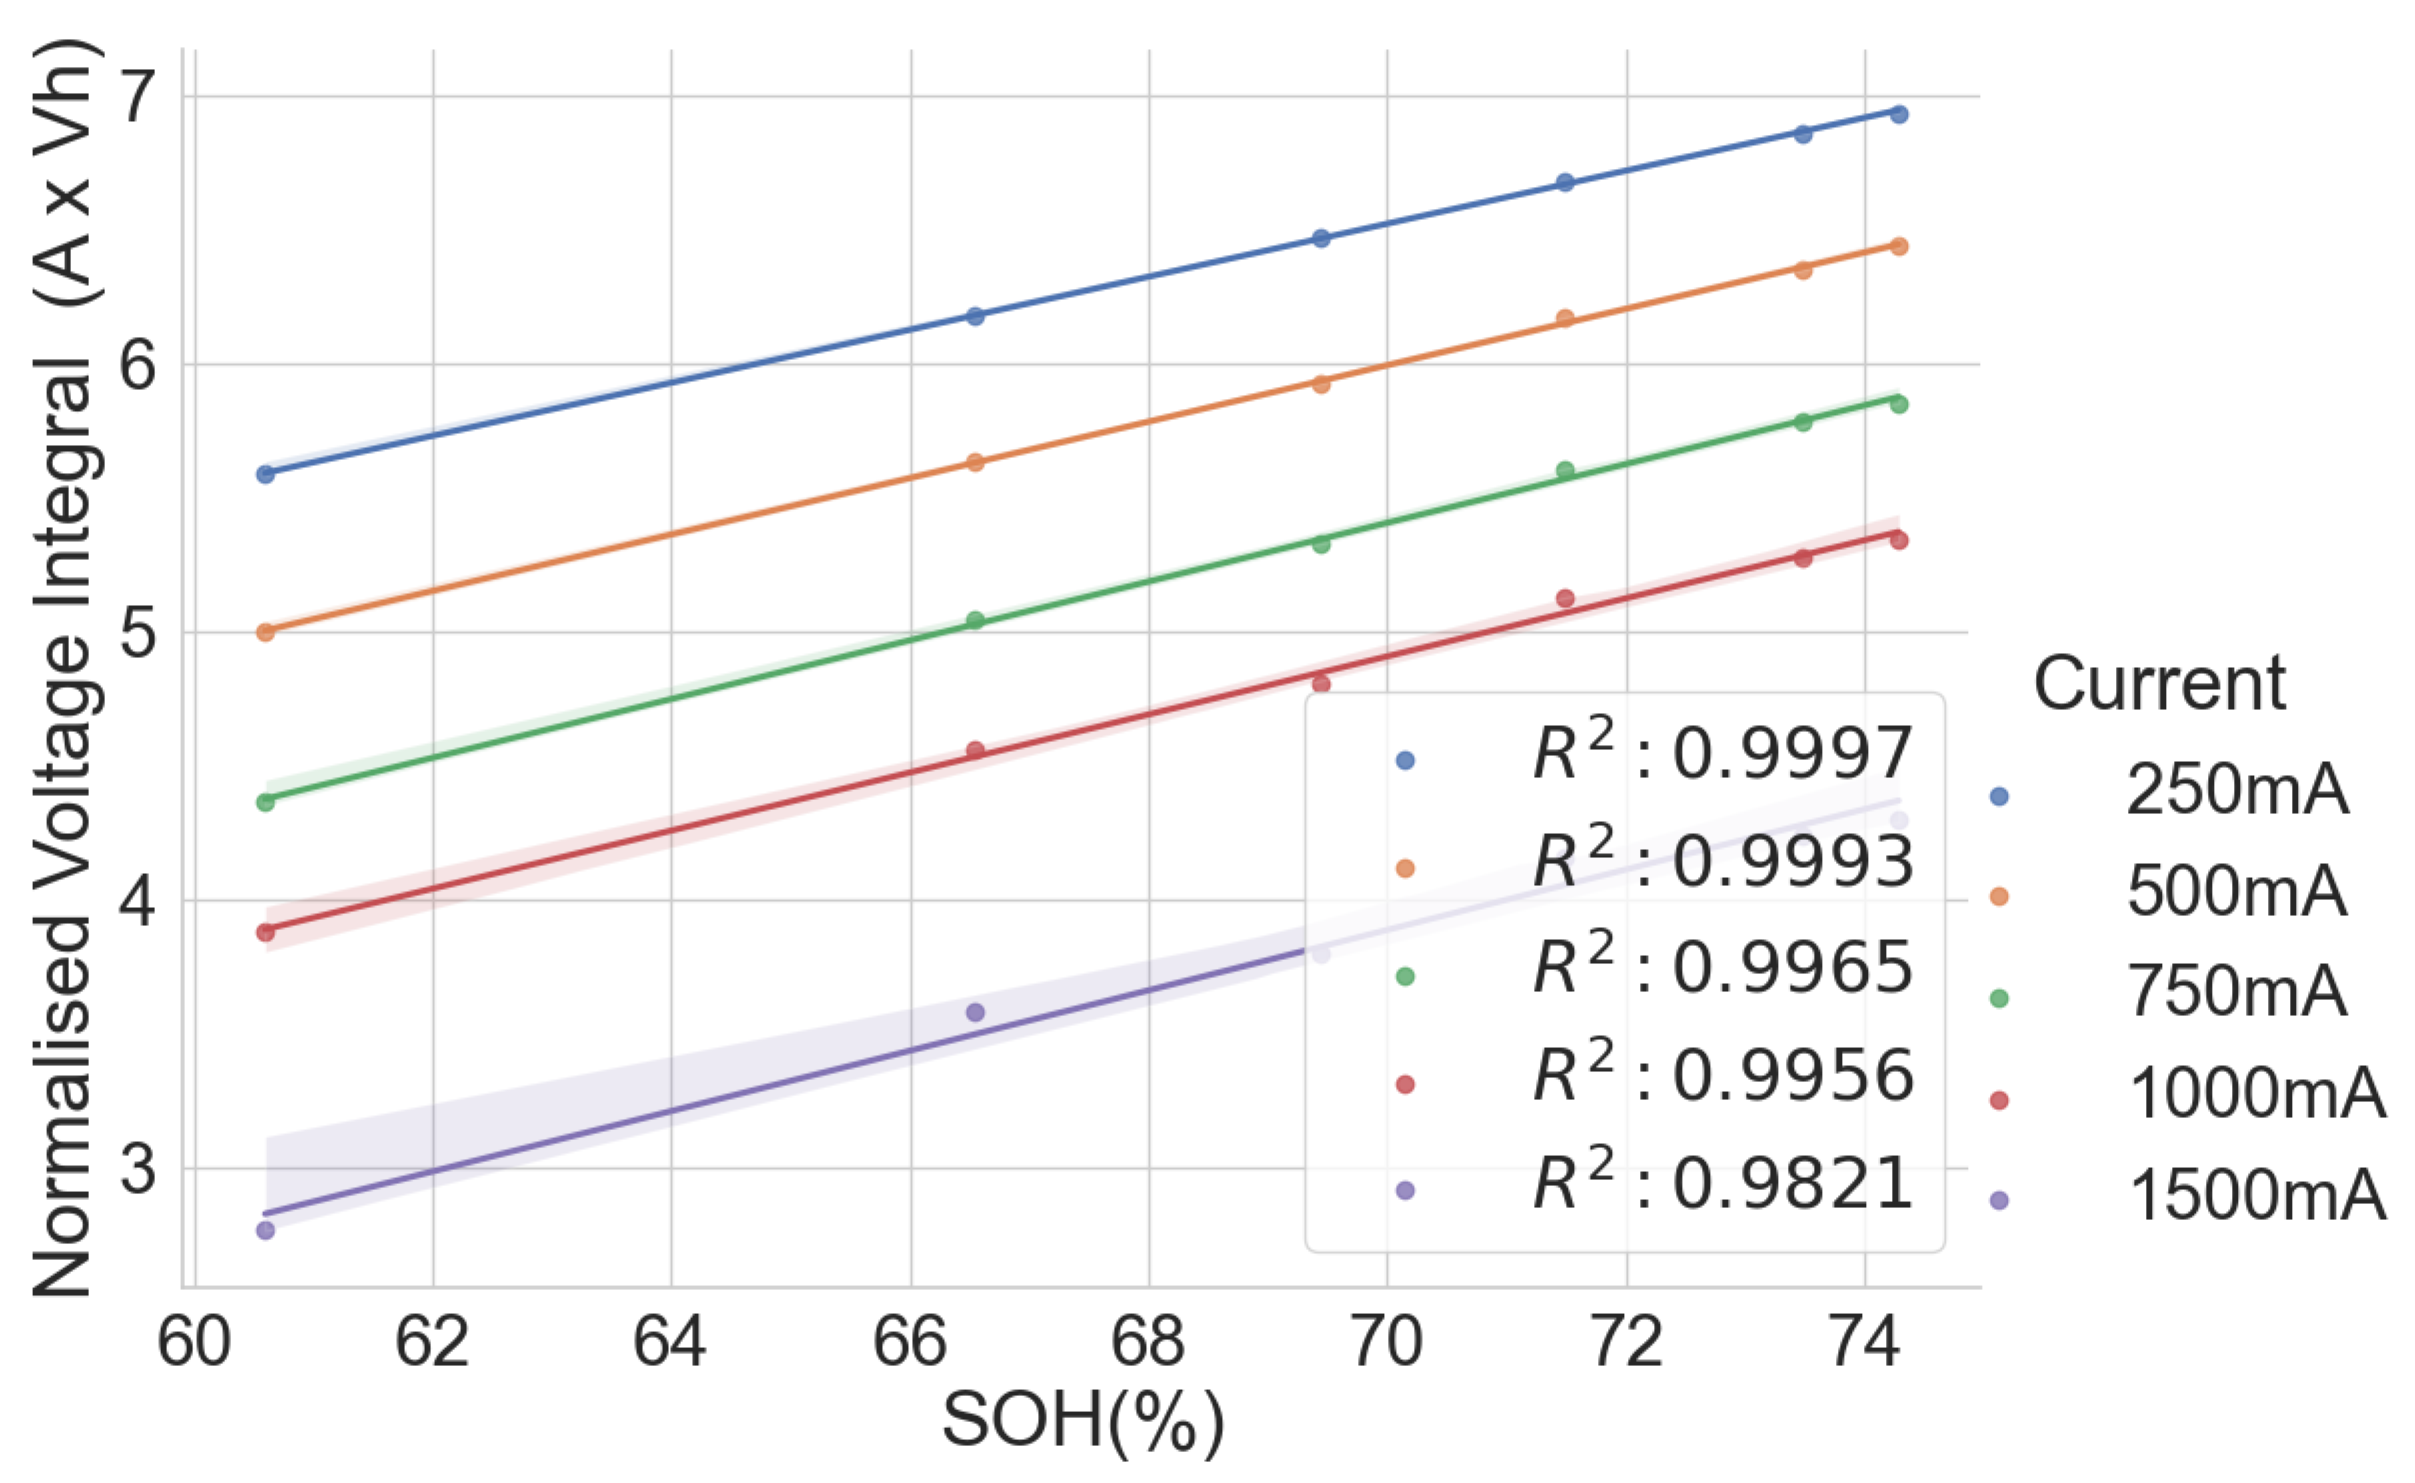
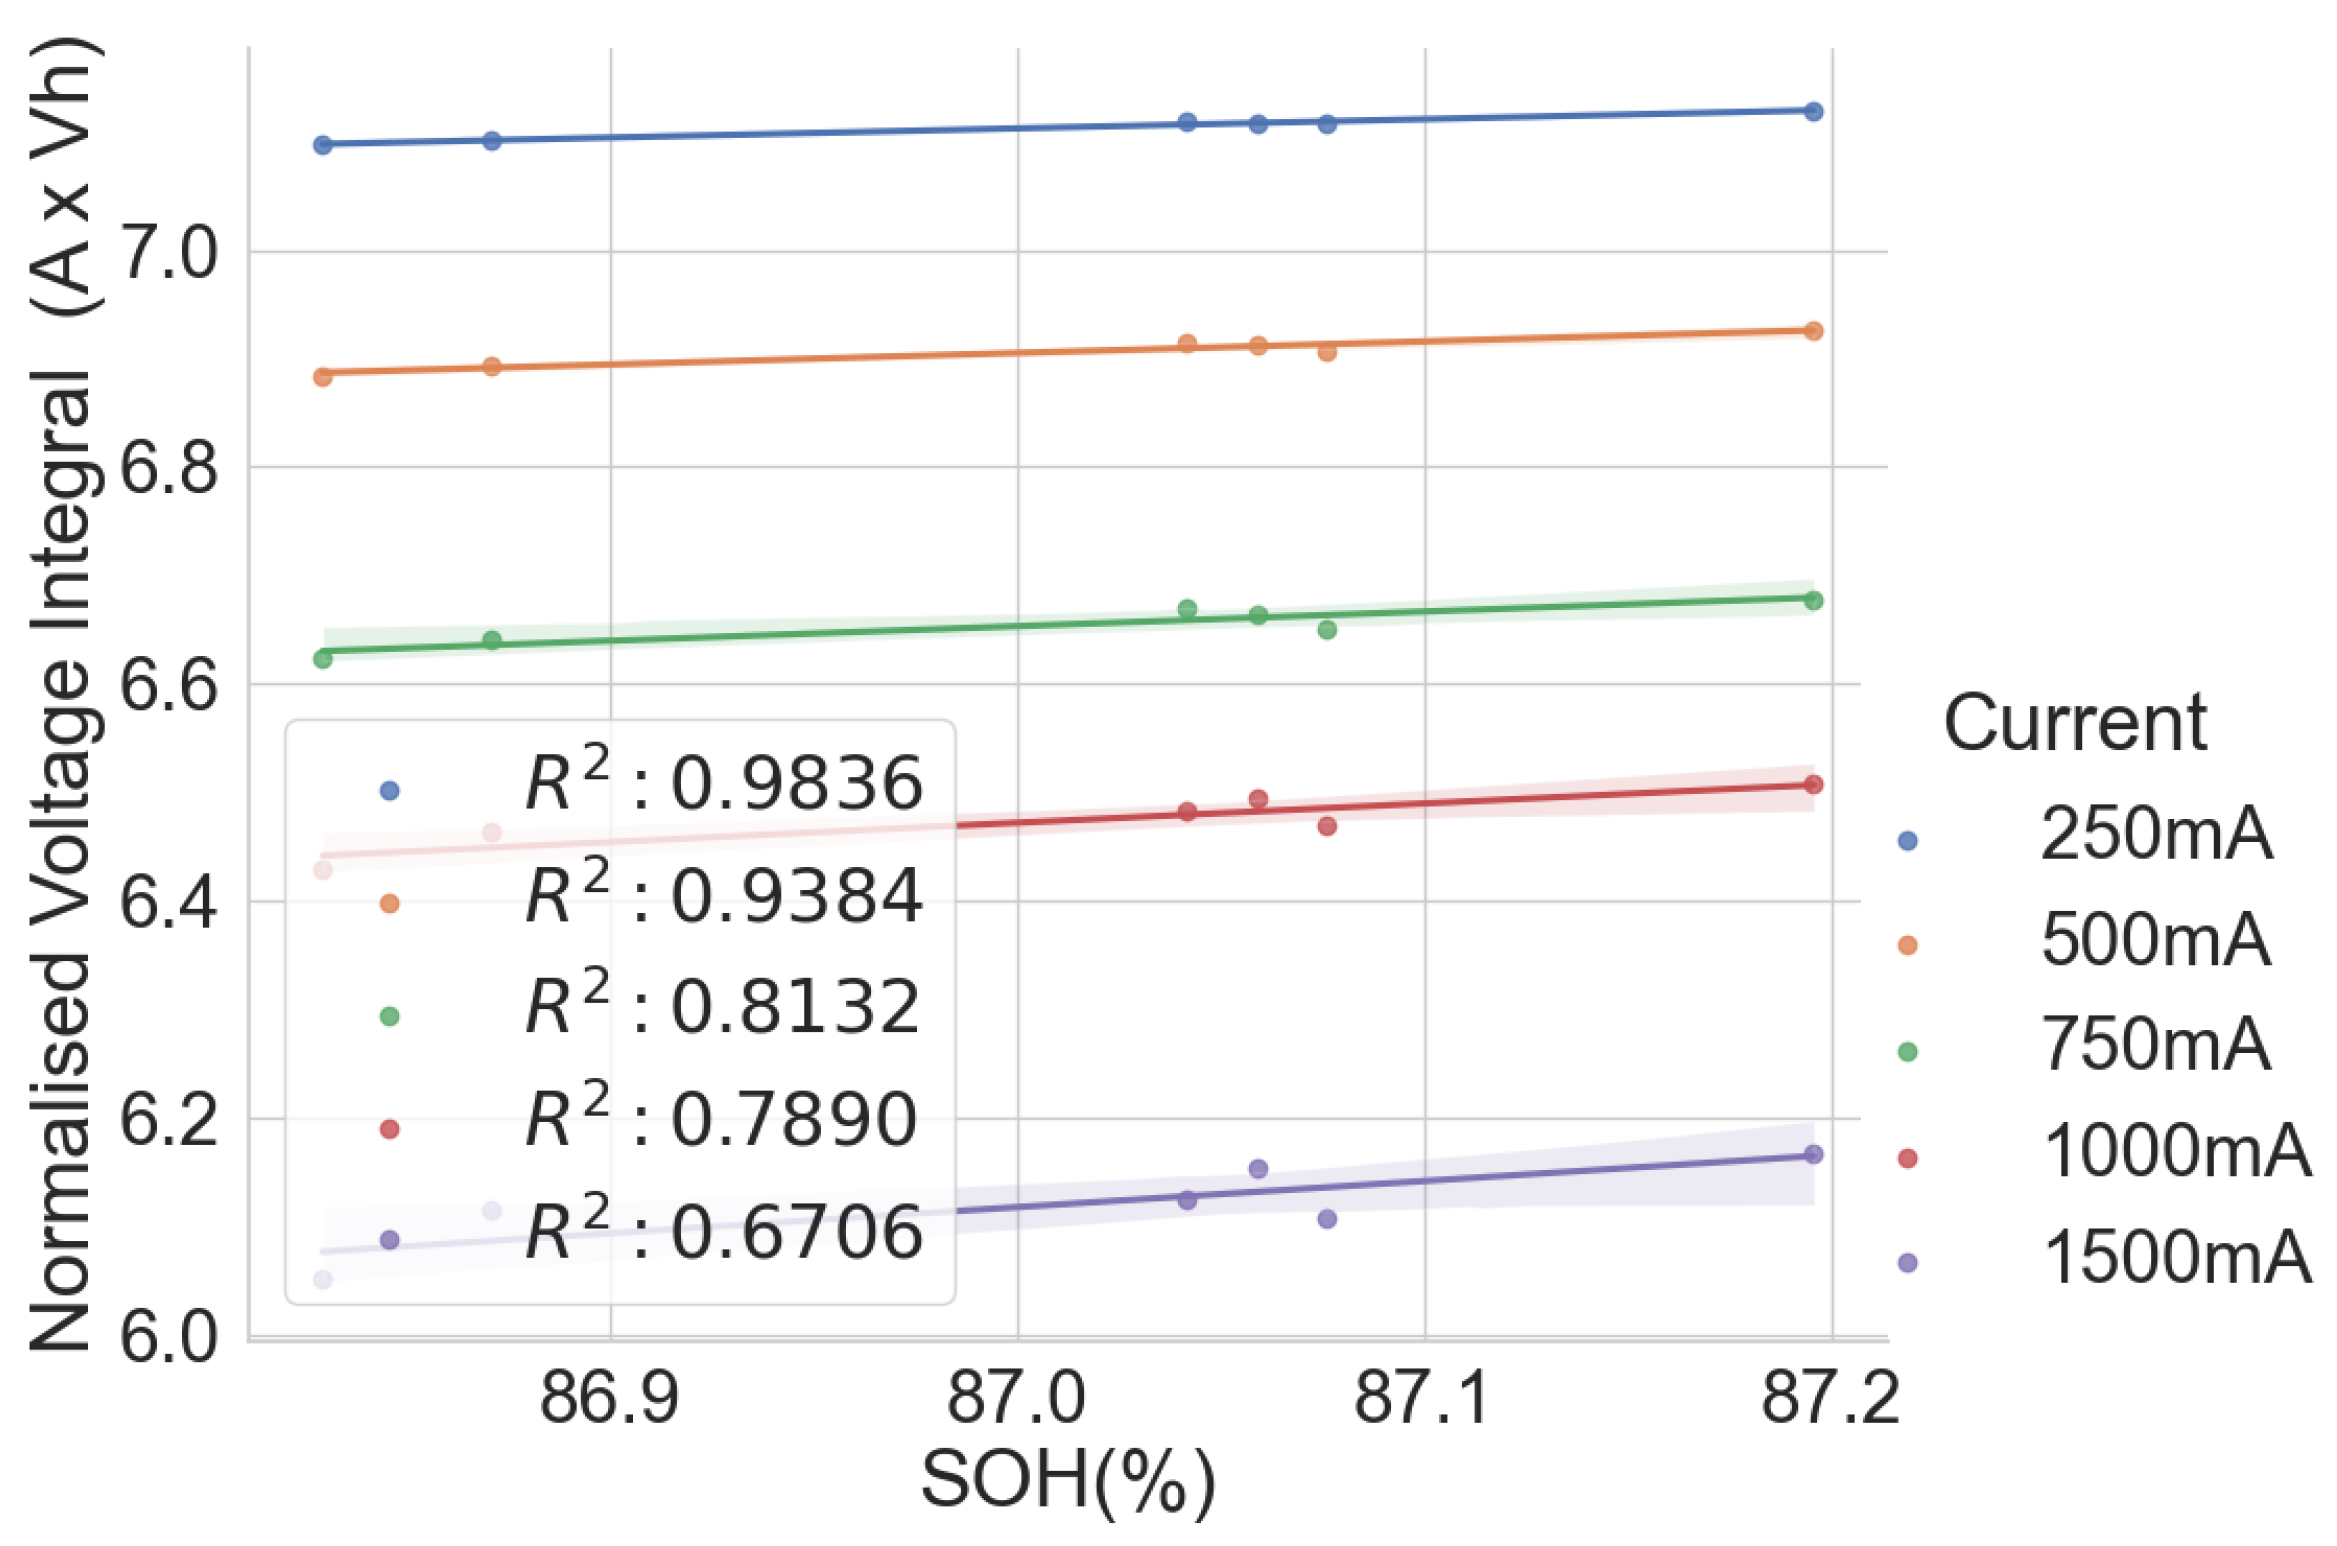
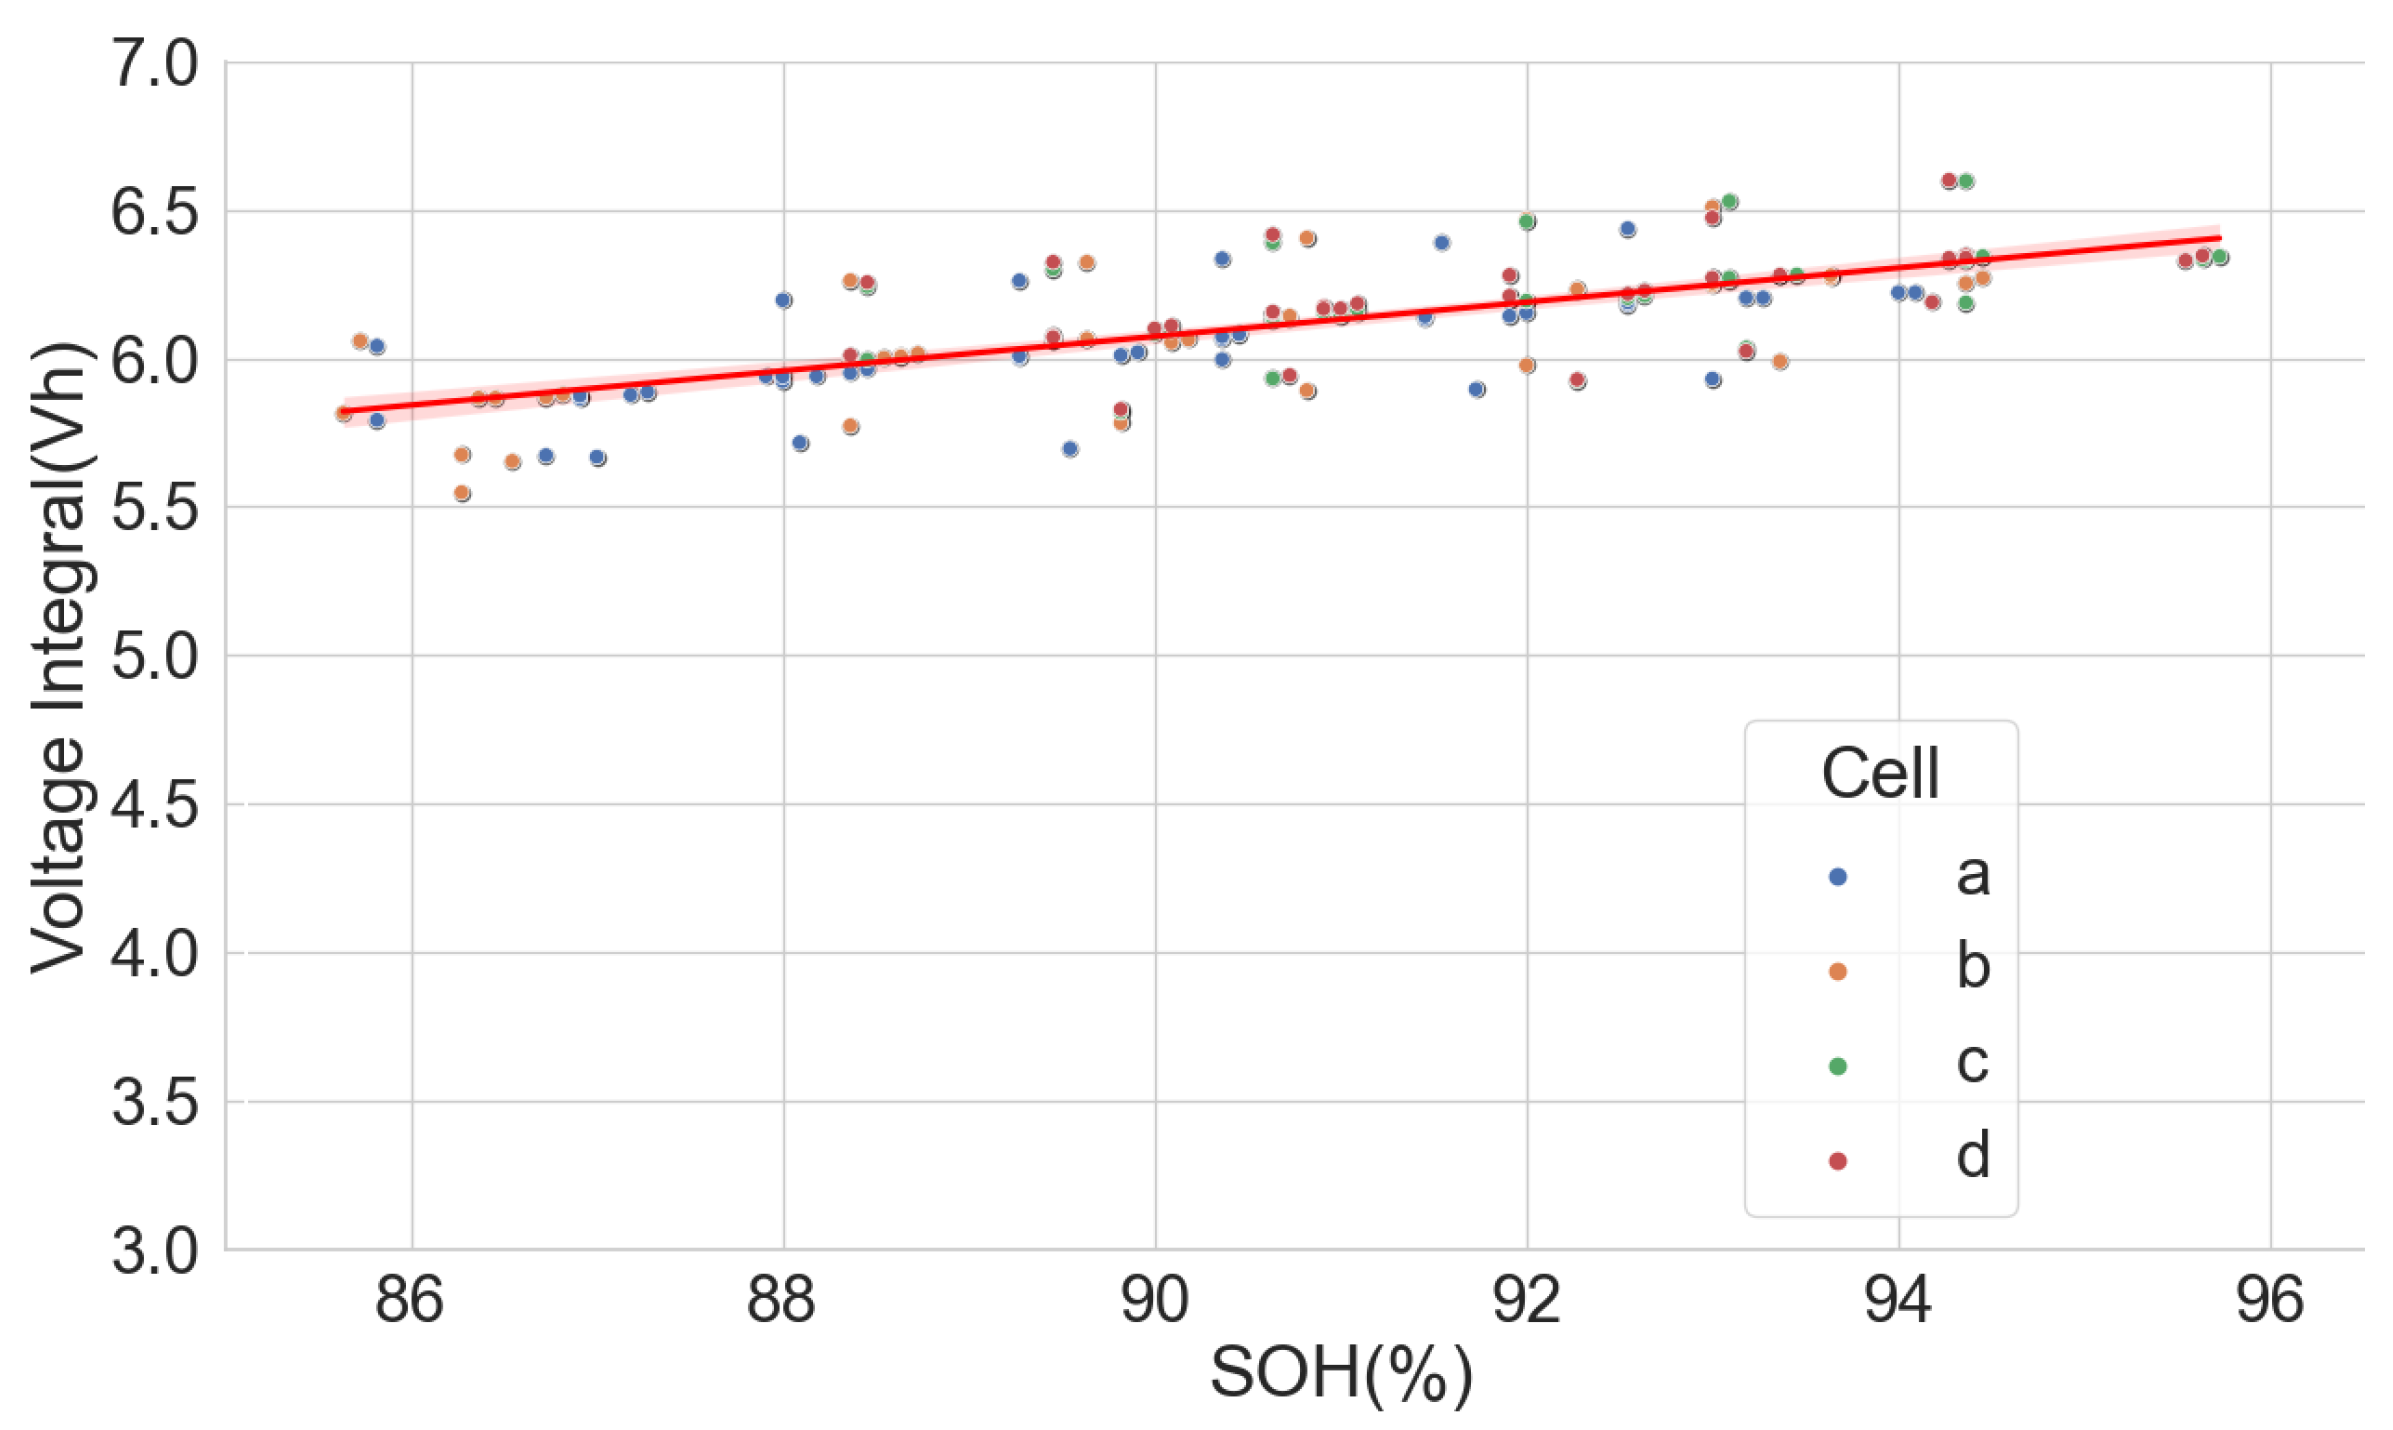
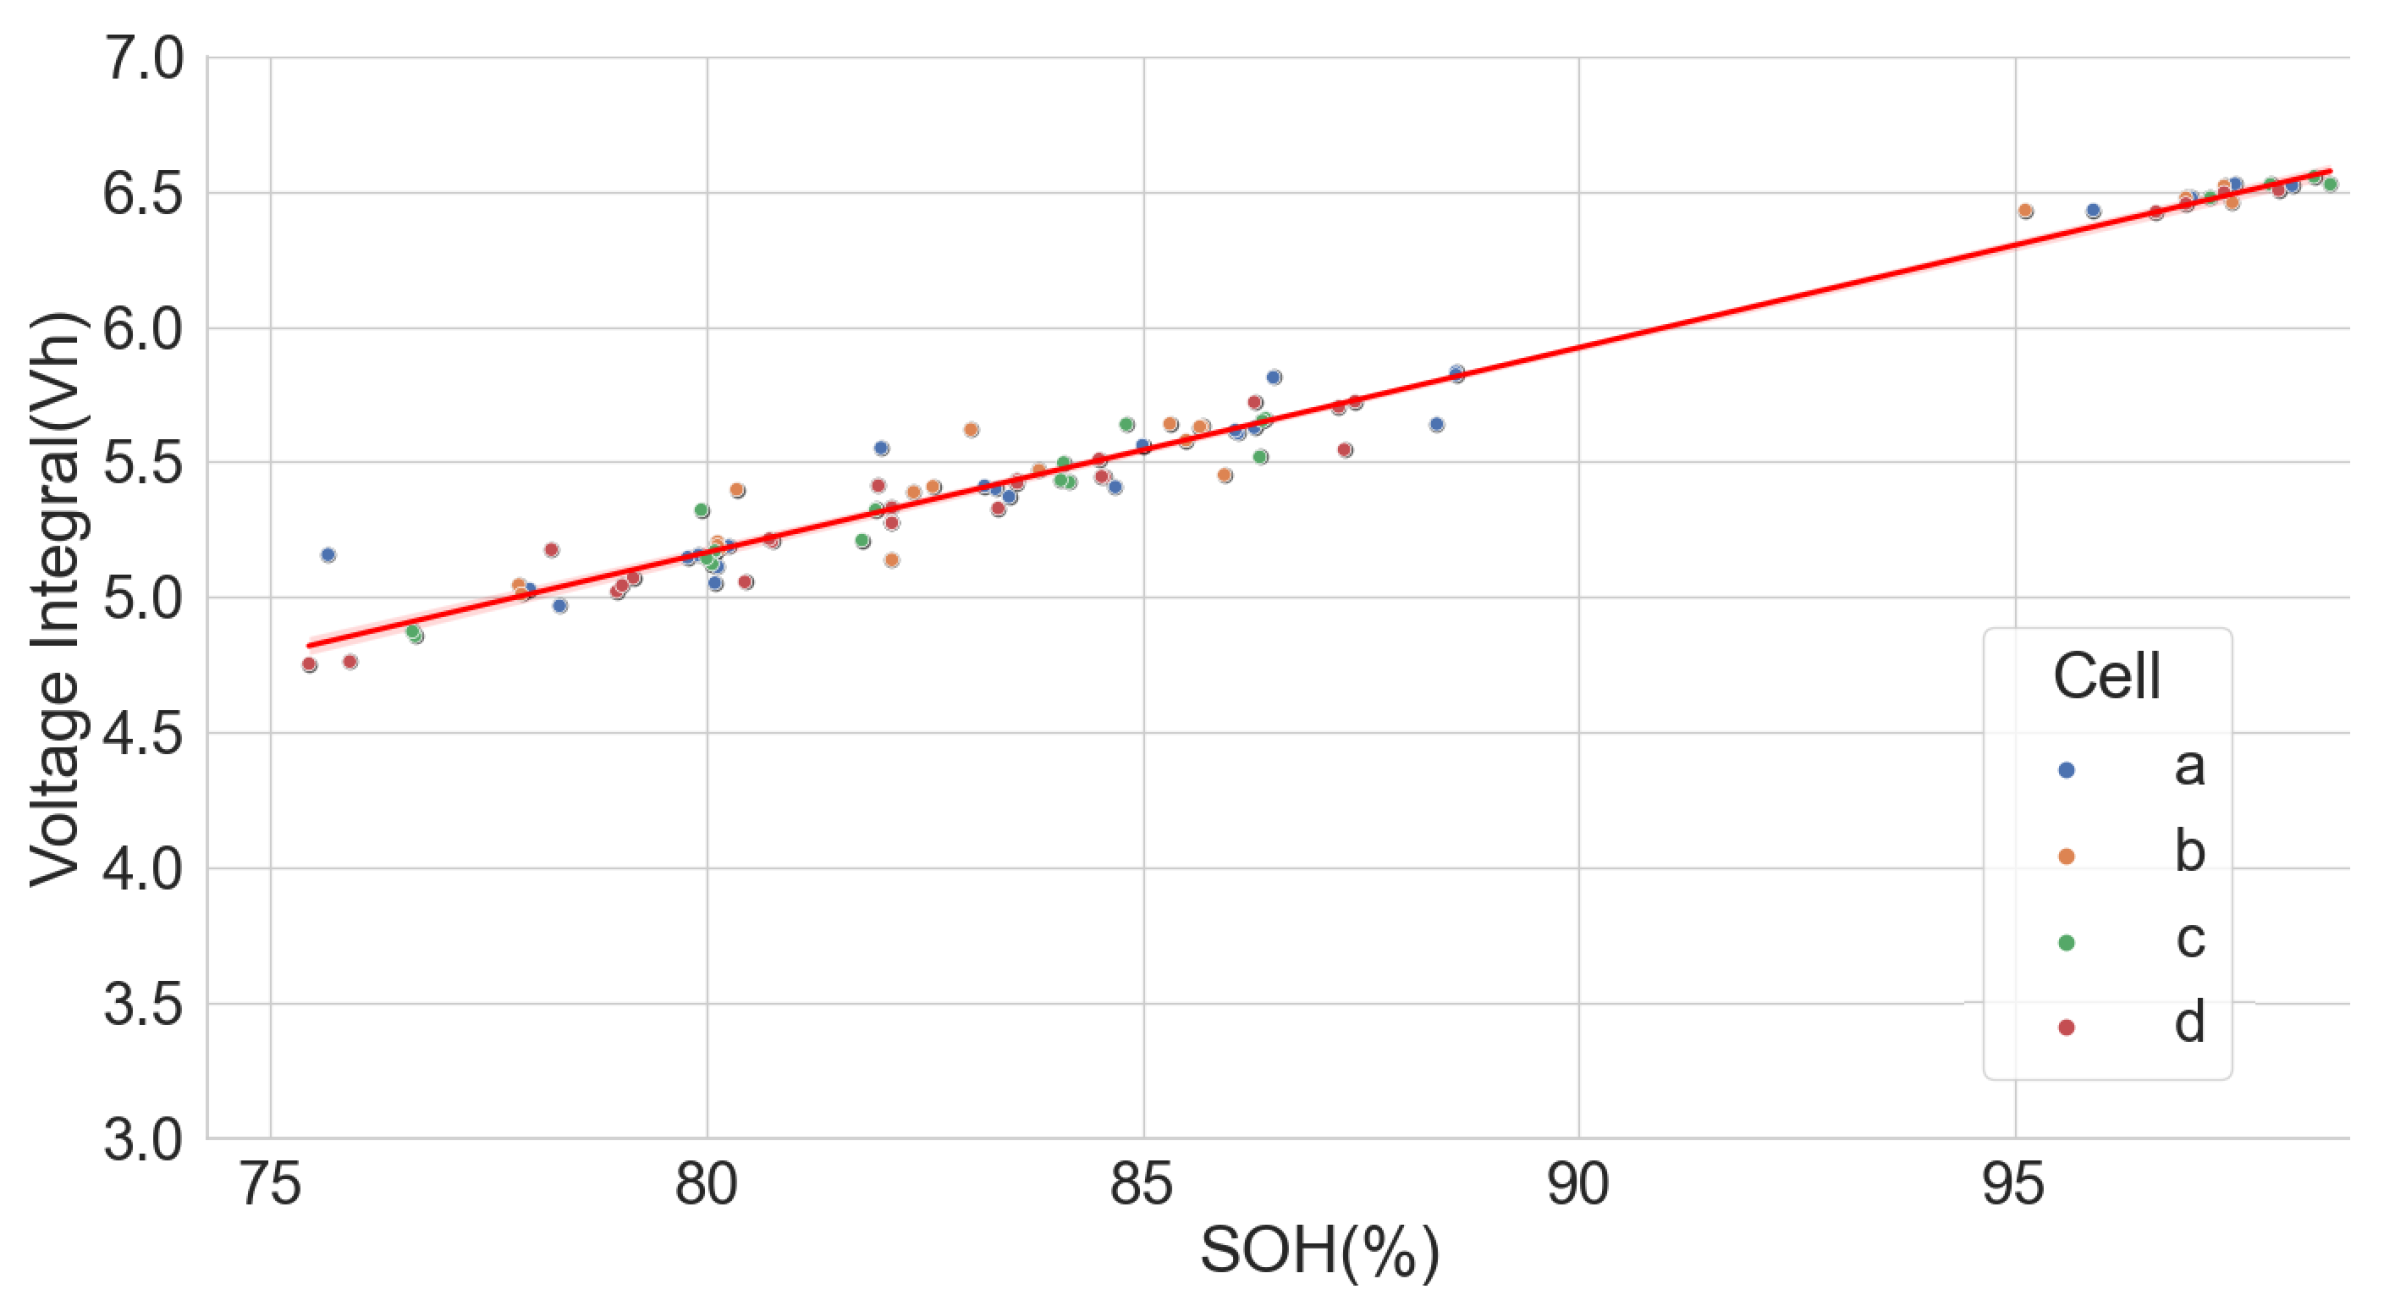
The scattered plots in Figure 2, Figure 3, Figure 4 and Figure 5 show the relationships between the SOH and the normalised voltage integral for four groups of cells, A71–A76, H91–H94, L141–L146 and L171–L176, respectively; each group with a shared history. For the cells H91–H94 and L141–L146 (Figure 3 and Figure 4), the plots fit a linear regression line with a good correlation of , when the charge current is below 750 mA. Also, the ranges of their SOH measurements are 54.74% and 13.9%, respectively. Even though they were obtained from the same old laptop battery pack, their broad degradation spectrum relates to the fact that the cells are rather aged, with an SOH below 75%. For groups A71–A76 and L171–L176 (Figure 2 and Figure 5), they have a higher SOH above 85%, and the range of their SOHs are 2.34% and 0.366%, respectively. The A71–A76 and L171–L176 groups have a lower correlation of and , respectively, when the charge current is below 750 mA.
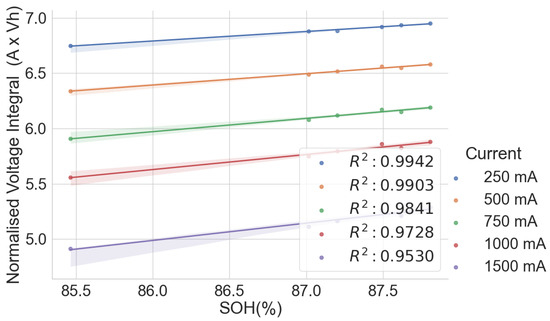
Figure 2.
Normalised voltage integral and SOH plot for A71–A76.
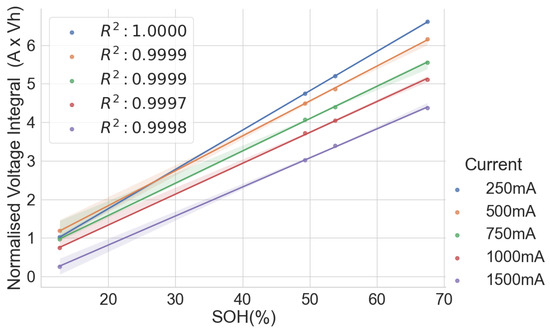
Figure 3.
Normalised voltage integral and SOH plot for H91–H94.
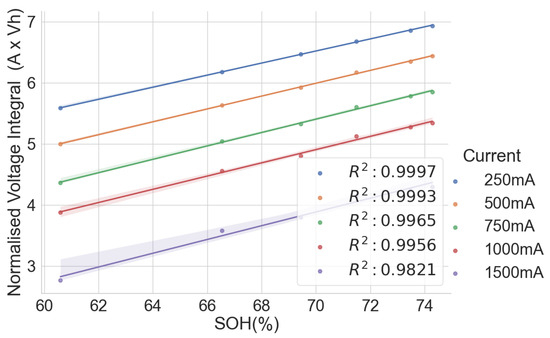
Figure 4.
Normalised voltage integral and SOH plot for L141–L146.

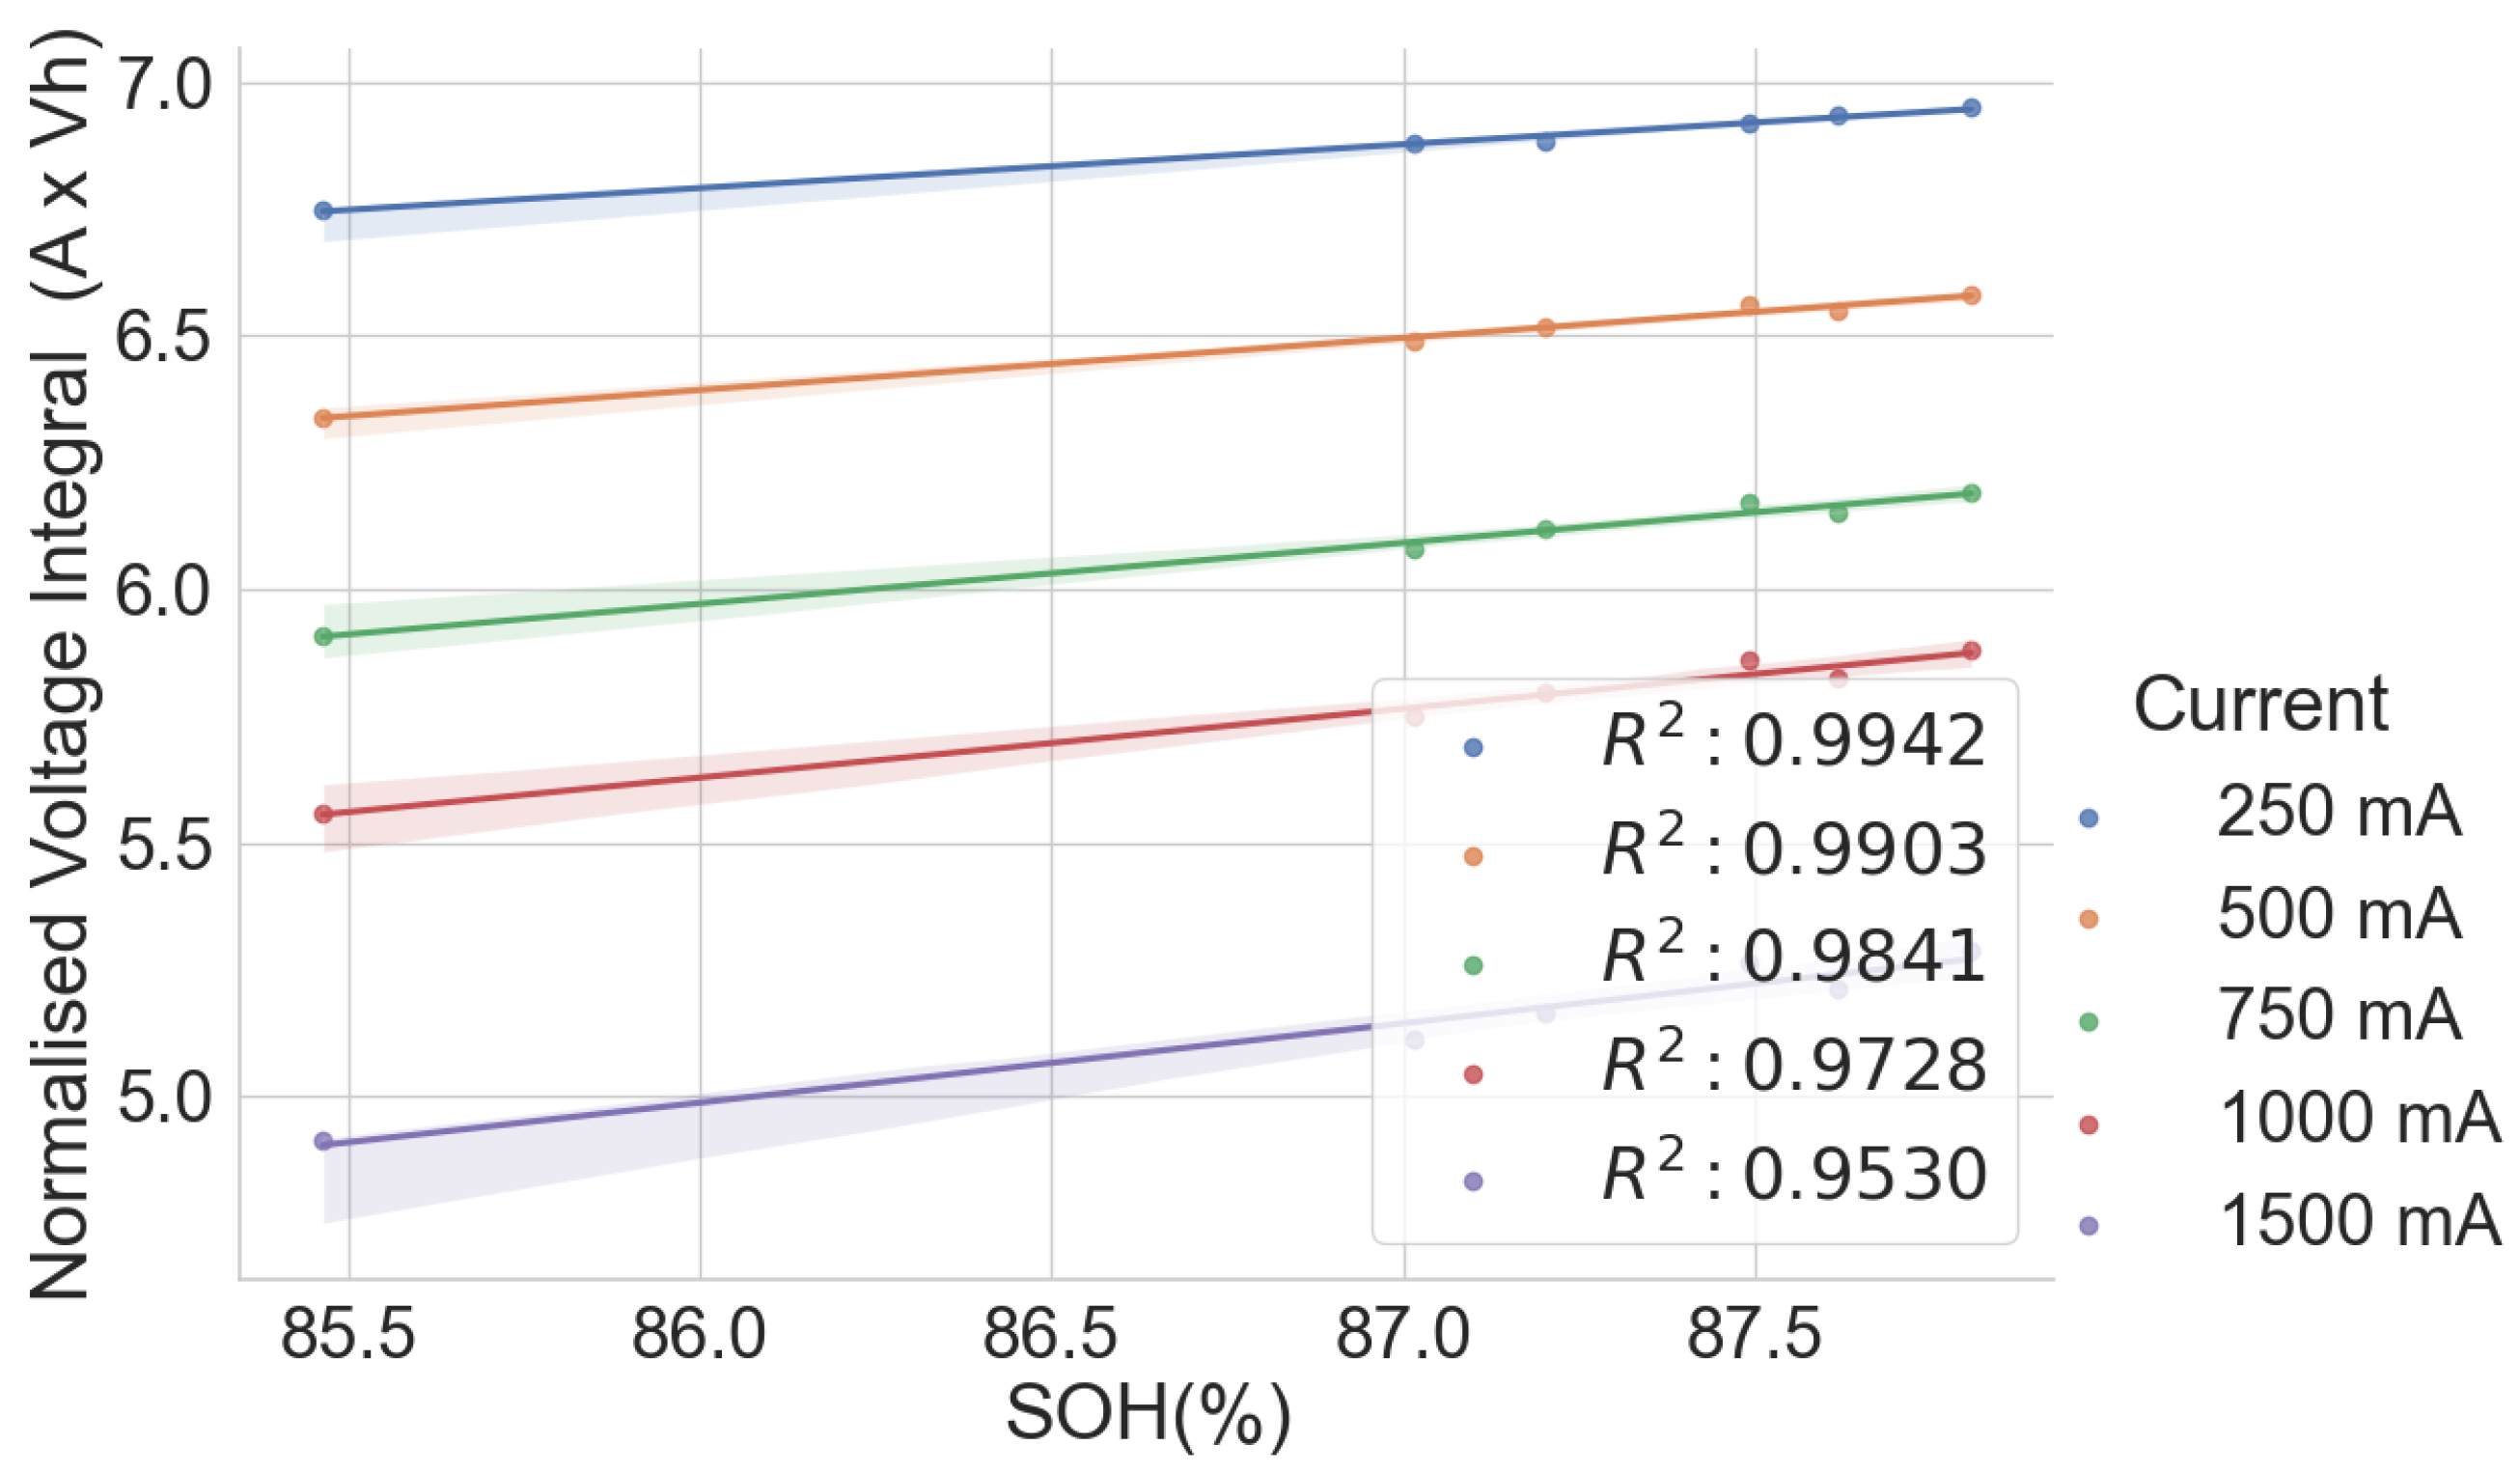
Figure 5.
Normalised voltage integral and SOH plot for L171–L176.
This shows that the correlation is lesser when the range in the SOH of the cells is low when all the cells have almost the same SOH. This lower correlation can be attributed to measurement errors. Therefore, the correlation is higher for cells with widely dispersed SOH and cell degradation. Another observation is that the voltage integral value is higher when charging at low currents than at higher currents because it takes longer for the cell to charge at lower currents. Also, charging at a low current gives a higher correlation between the SOH and the voltage integral than when charging at a higher current.
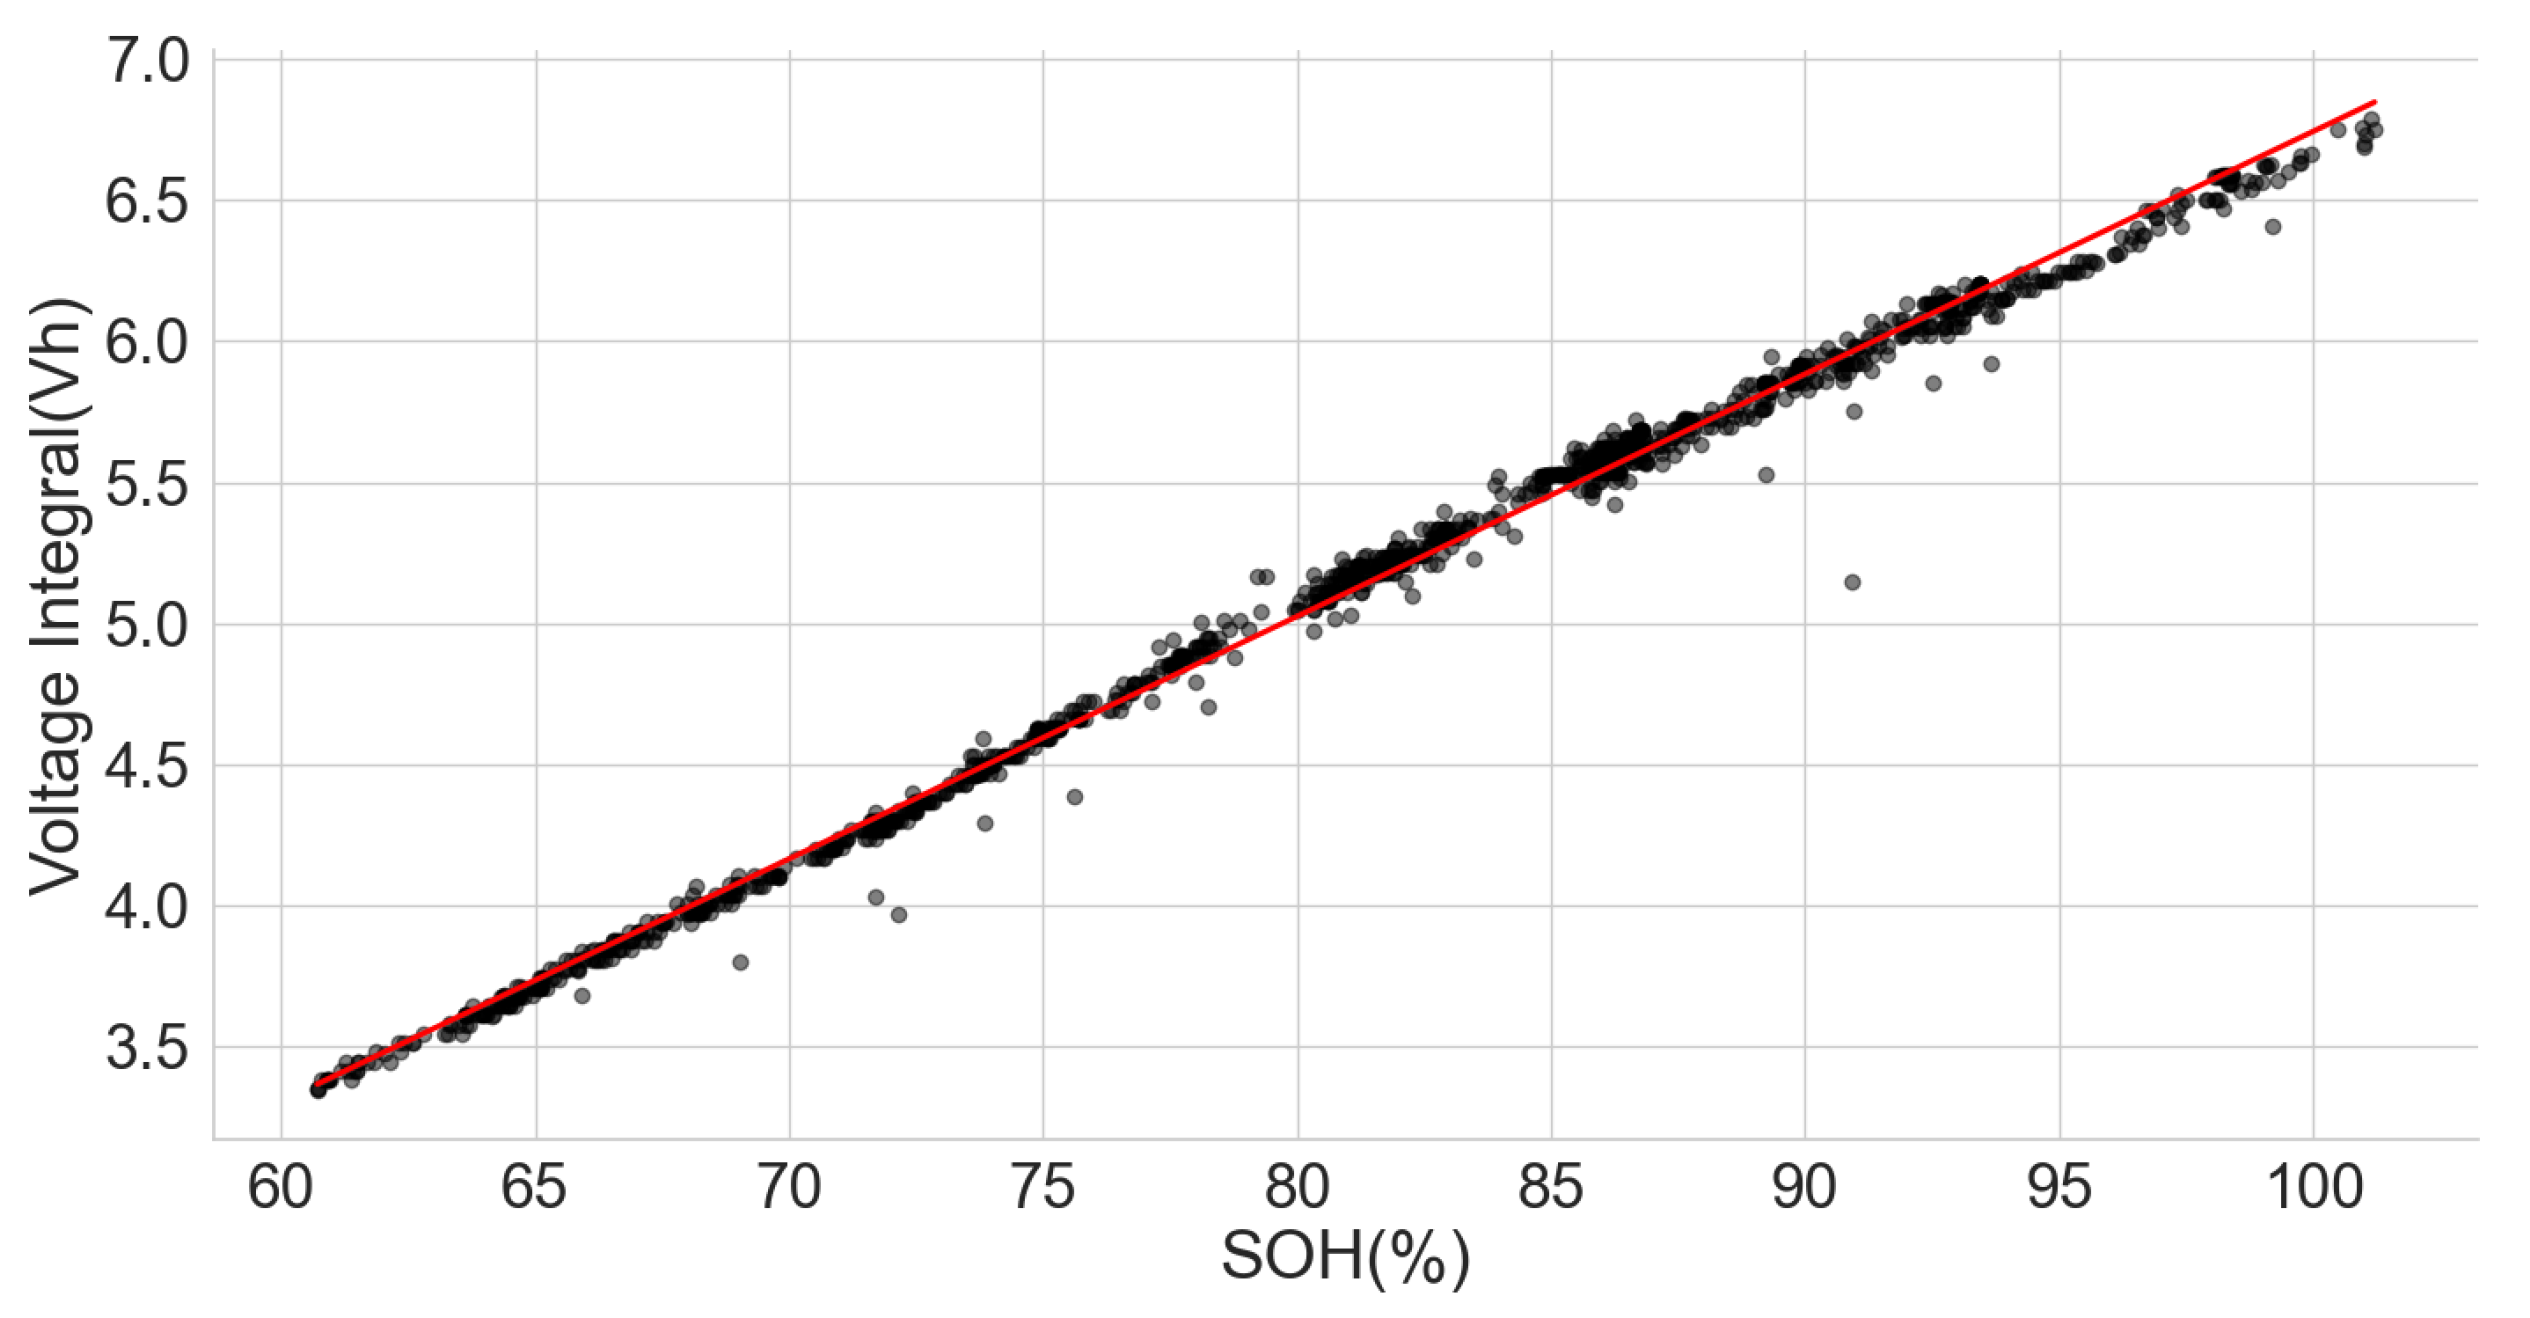
The voltage integral during CC charge at 1C was obtained from the cyclic ageing test data on a lithium–ion cell with model number INR18650-2600 SP01 to validate the test results above. The result shows a strong correlation between the SOH and the voltage integral at the various cycles. See Figure 6 for the scattered plot and Table 2 for the estimation performance parameters. The following parameters: maximum error (ME), mean absolute error (MAE), root mean squared error (RMSE) and mean absolute relative error (MARE), were obtained using the following formulae in Equations (7)–(10).
where N is the number of the cells in the group, is the actual SOH and is the estimated SOH from the voltage integral.
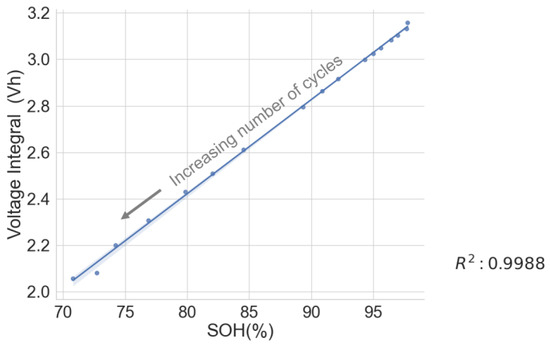
Figure 6.
Voltage integral and SOH plot for cycled aged cell during CC charge at 1C.
Table 2.
Estimation performance for the cycled cell.
A high correlation and a low ME below 1.06 prove that the voltage integral during CC charge at constant ambient temperature can be used to estimate the capacity SOH and is suitable for assessing whether first-use batteries of the same model have the potential for a second use.
3.2. Different Models and Different History
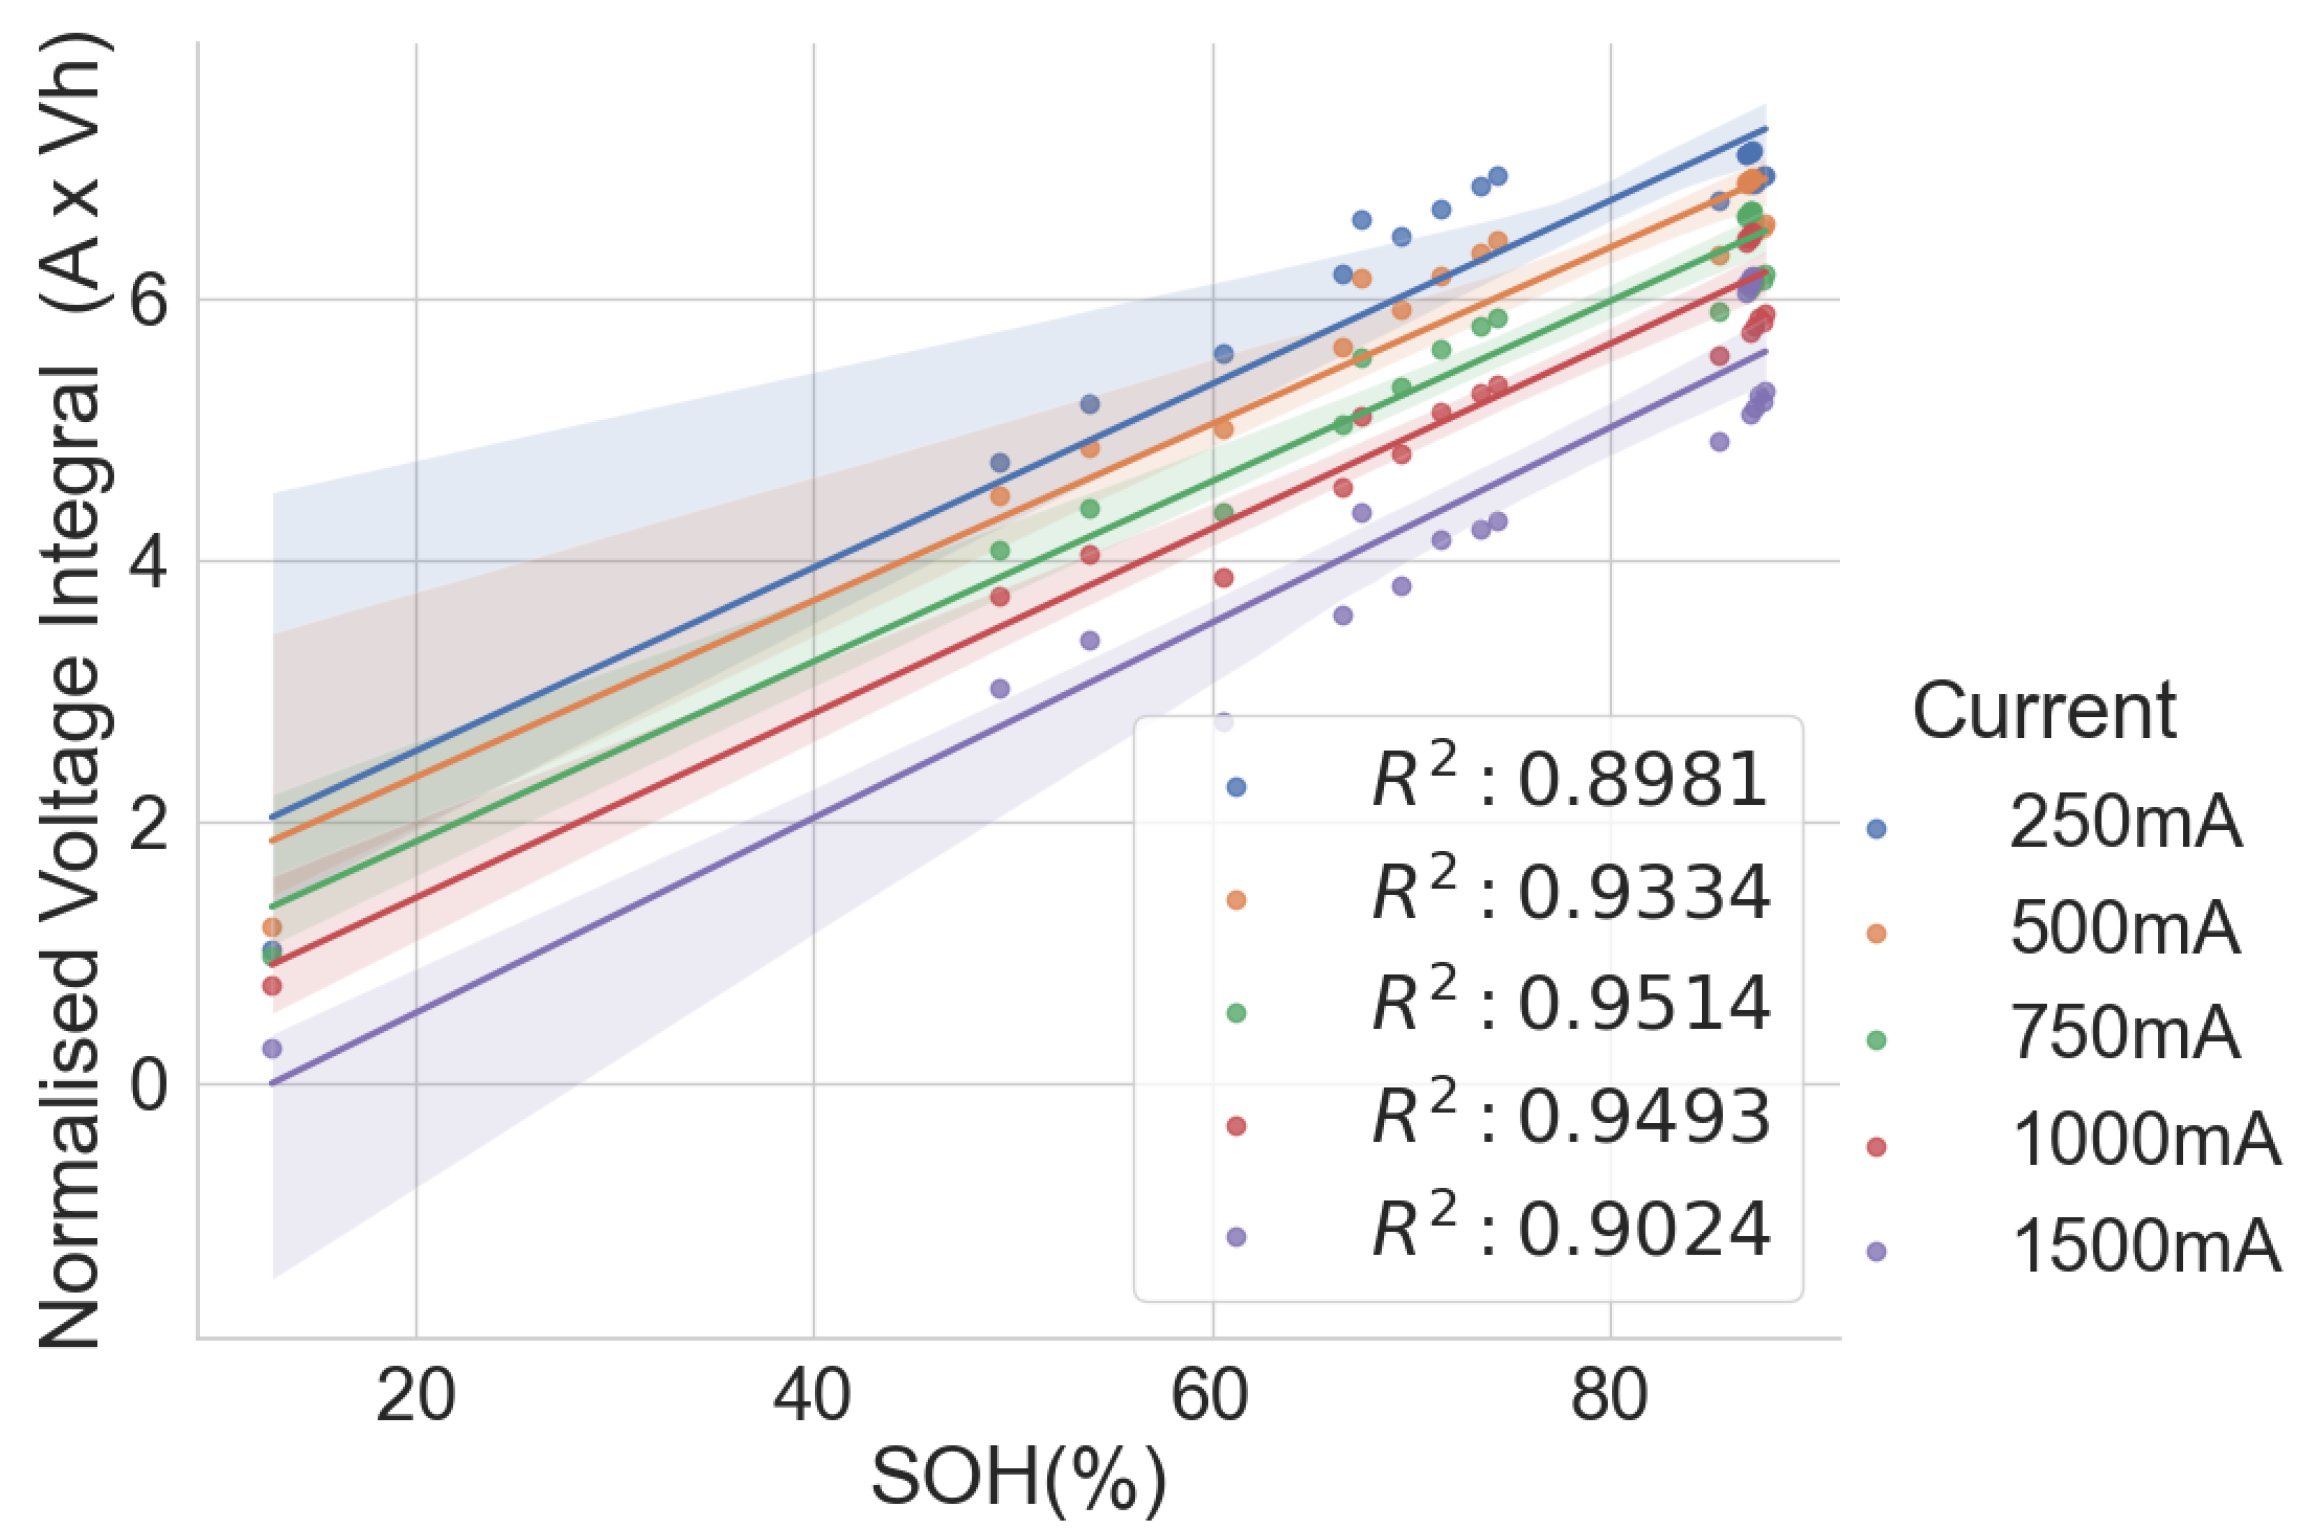
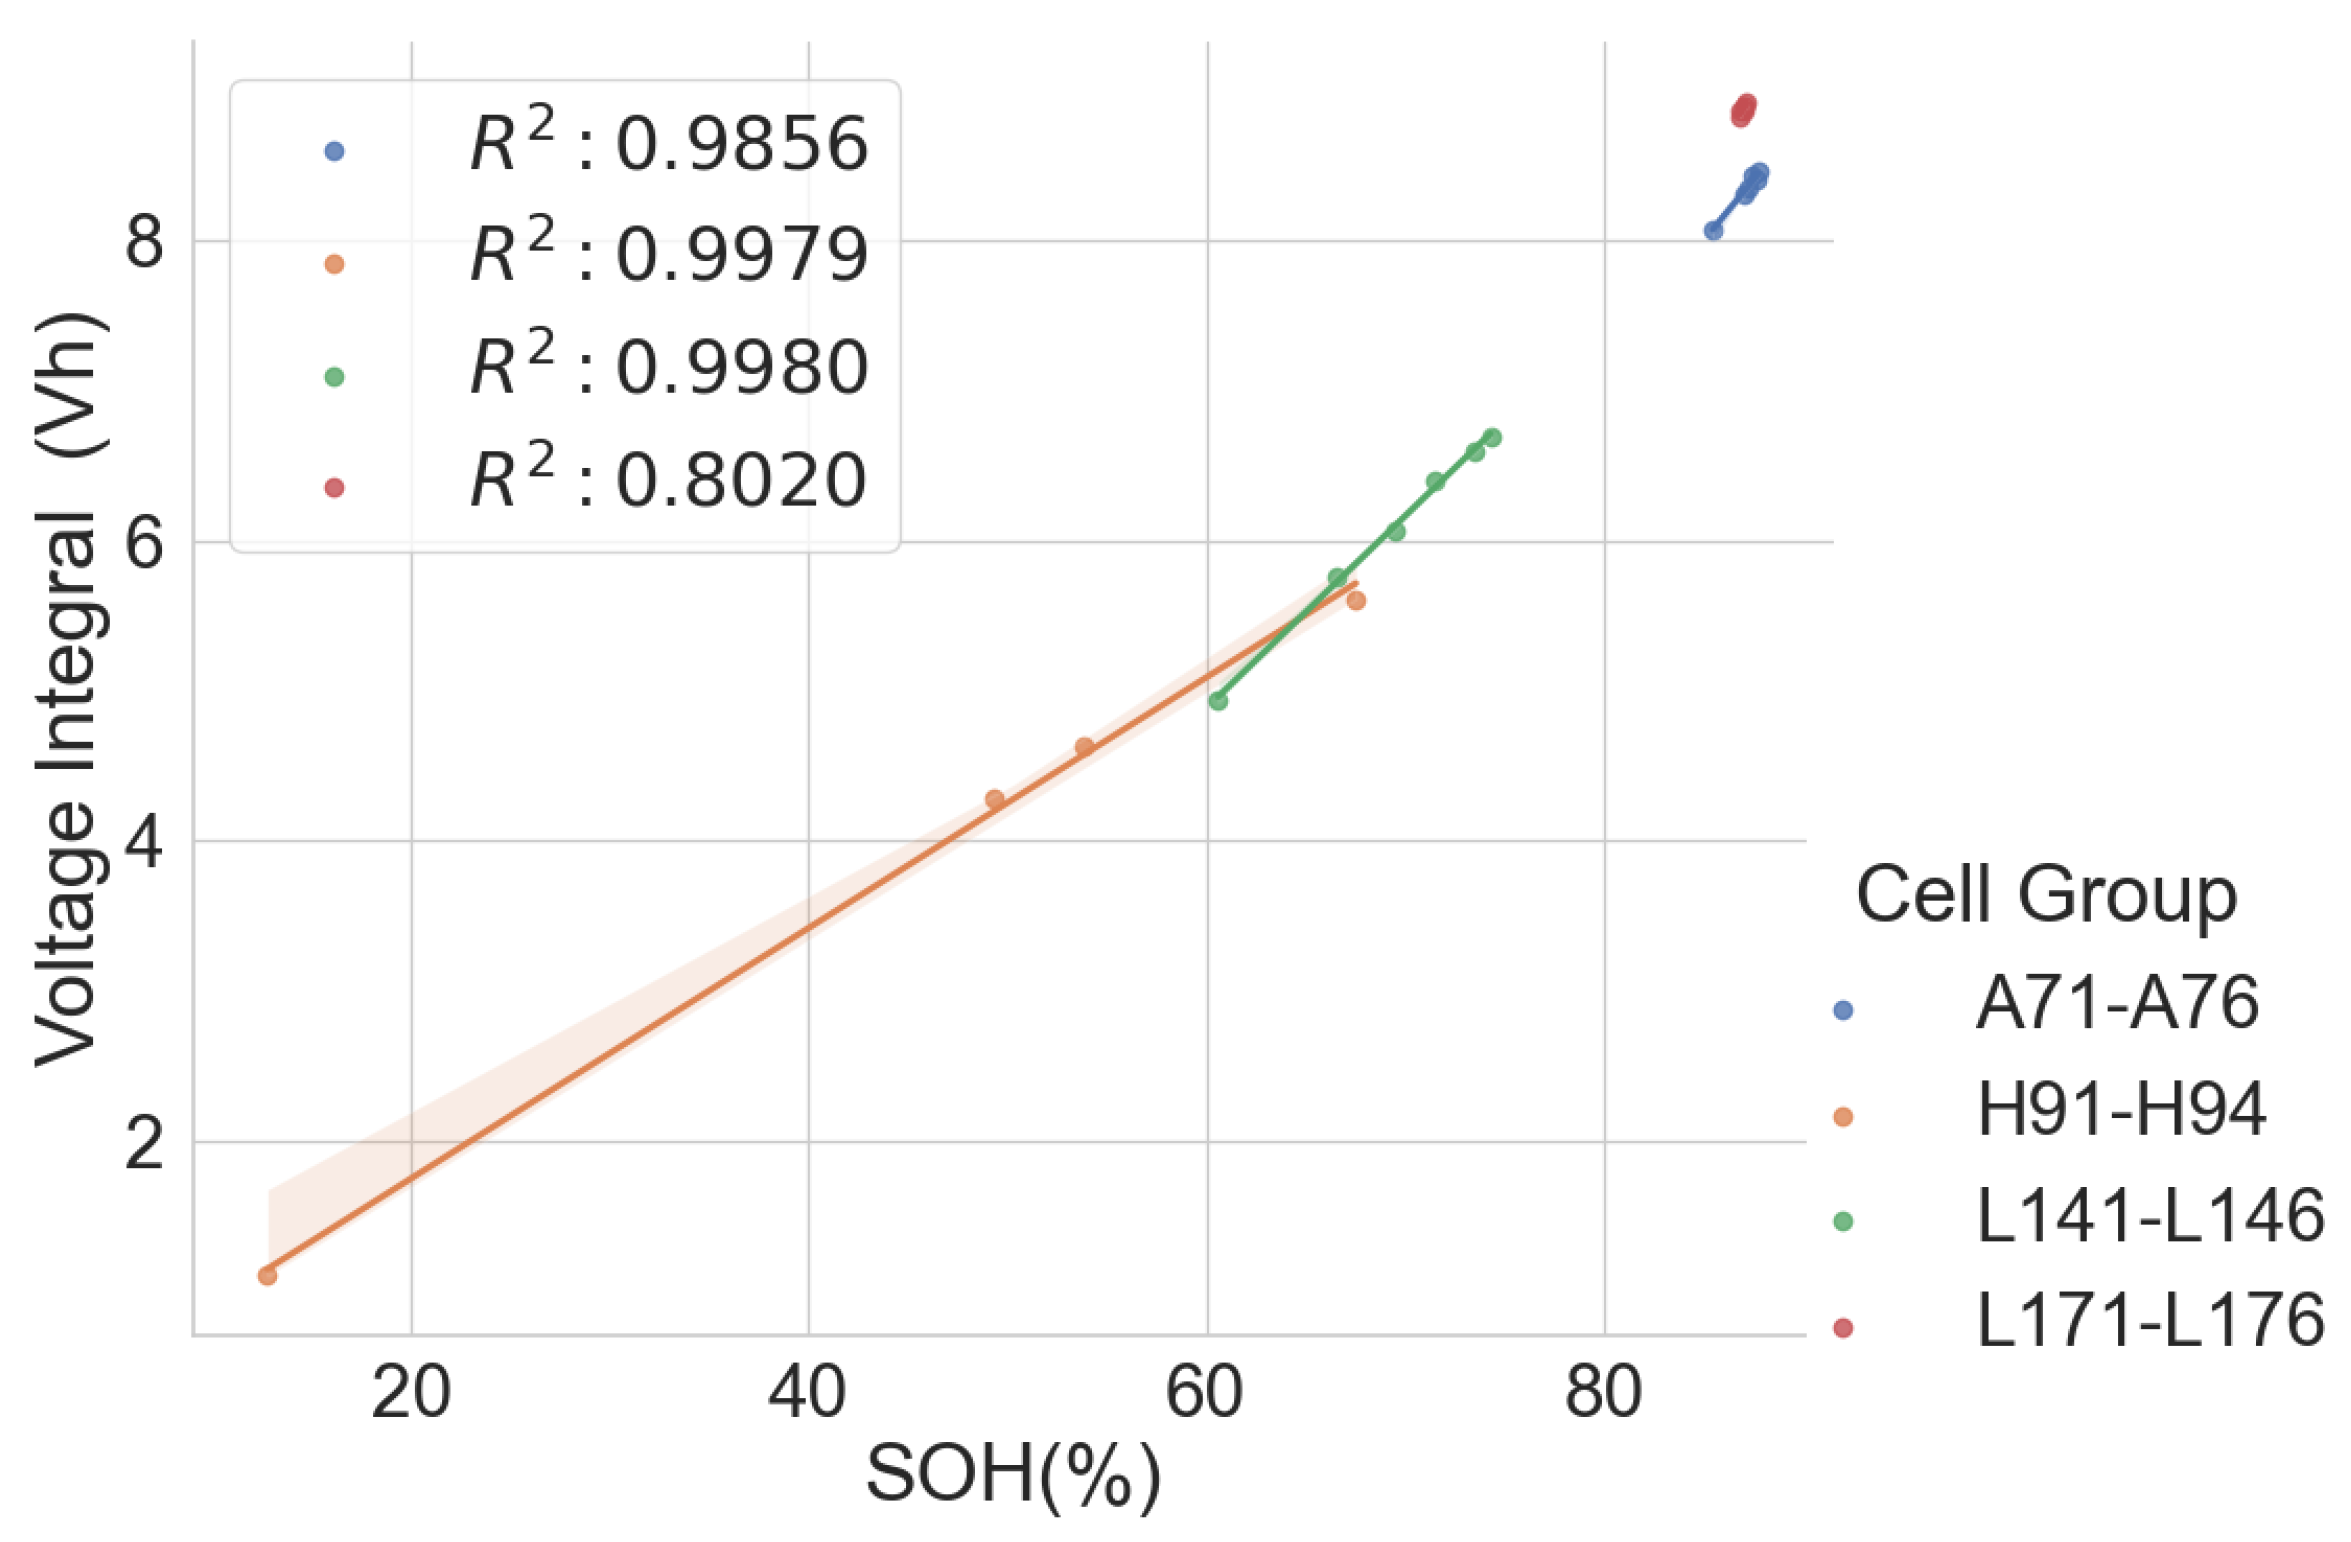
In the combined scattered plot between the normalised voltage integral and SOH of the four groups of cells, namely A71–A76, H91–H94, L141–L146 and L171–L176 at various currents, as shown in Figure 7, the correlation is lesser when compared to the same model’s correlation analysis at lower currents. Also, the correlation is higher at 750mA CC charge, approximately C/3 of the cells. For more clarity, a scattered plot of the actual voltage integral versus SOH for 22 aged cells at C/3 CC charge is shown in Figure 8, where the different groups show different linear relationships. Even though a linear pattern is observed in the voltage integral with respect to the SOH, similar models have separate regression equations. This may have resulted from different design specifications, production methods, electrodes, electrolytes and binders. This implies that an approximate limit can be set for the voltage integral for all the various models to select good and bad cells. This, however, would be prone to more estimation error. The result shows that a simple general voltage integral plot may not be used to estimate the SOH of different models of LIB.
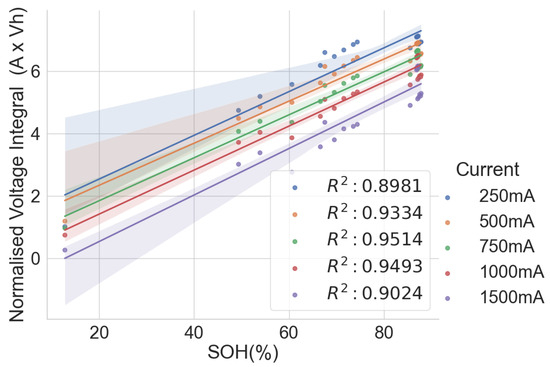
Figure 7.
Normalised voltage integral and SOH plot for the 22 aged cells.
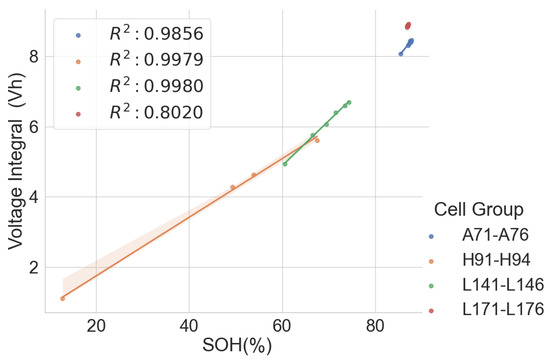
Figure 8.
Voltage integral and SOH plot for the 22 aged cells during CC charge at C/3.
Table 3 shows combined regression analysis for each of the four groups and the combined 22 cells in Figure 8 above. Despite the good correlation for all five groups above, the maximum error when all the 22 cells are considered high is at , compared to the cells with the same models. This confirms that it is recommended that cells with different models should not be combined, as the error is intolerable.
Table 3.
Estimation performance for different groups at C/3.
3.3. Same Model and Different History
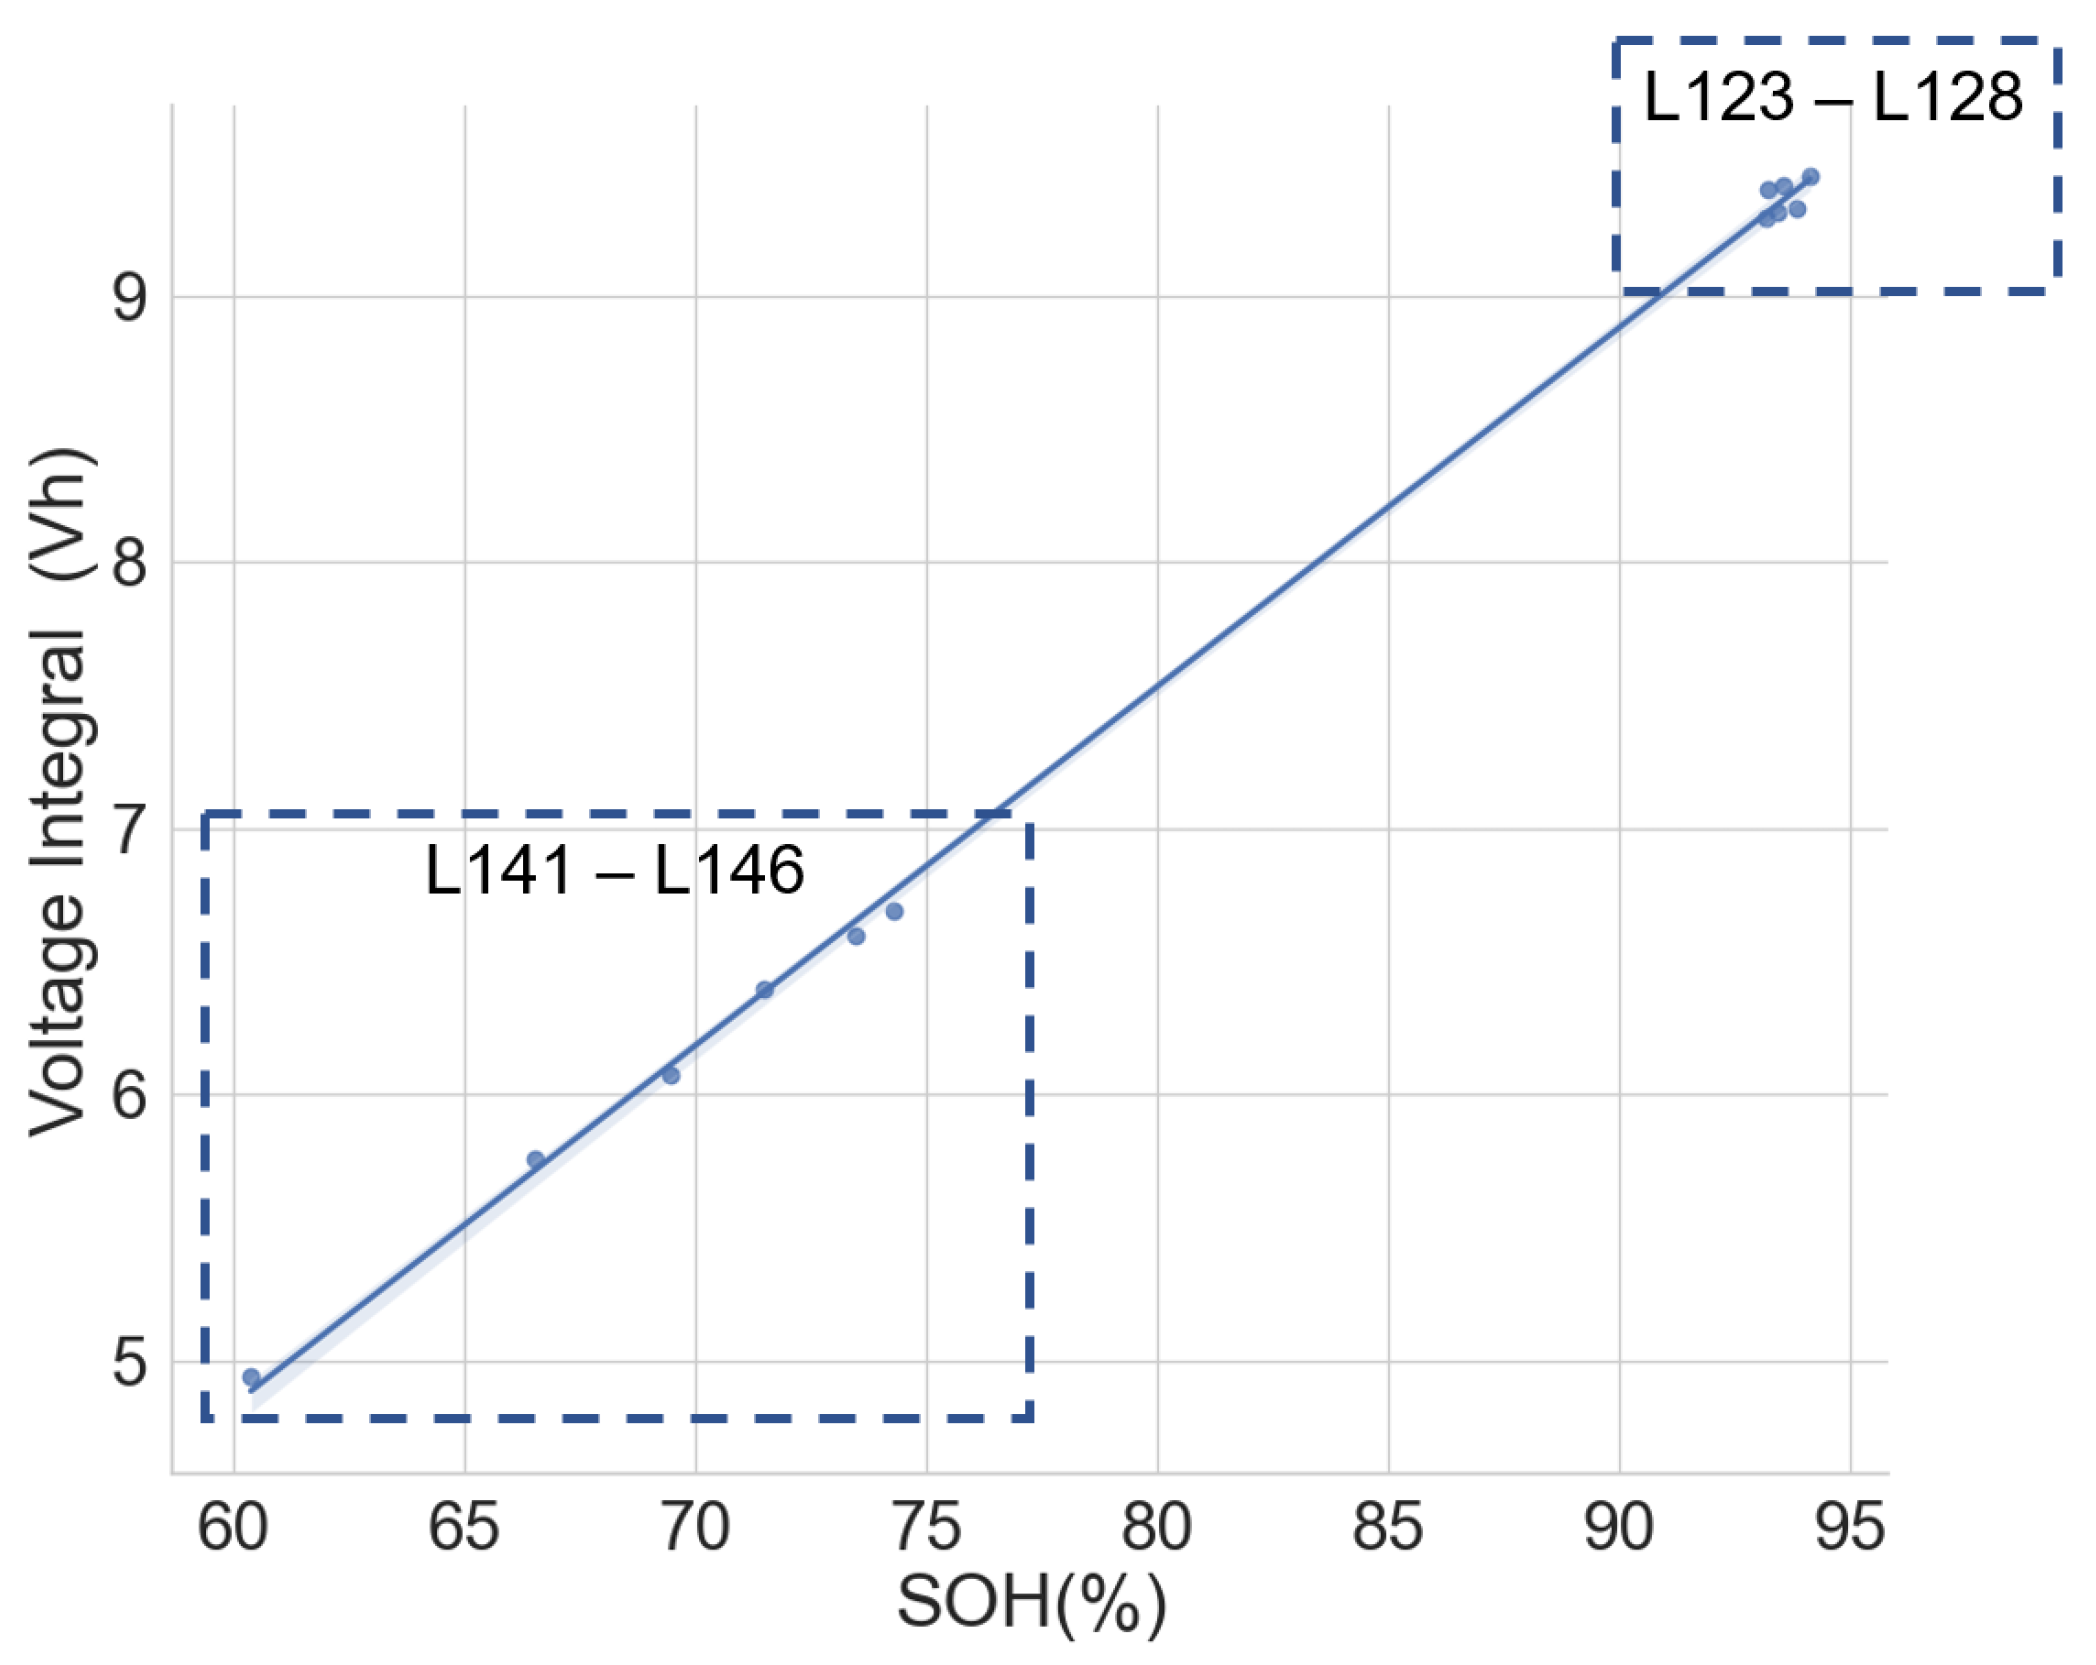
The same model of cells subjected to different applications and histories may have different voltage integral relationships to the SOH. To verify this, the voltage integral versus SOH plot for the cell of the same model CGR18650E, namely L141–L146 from the same laptop battery pack and L123–L128, which are random cells picked up from the laboratory with no known application or use, is shown in Figure 9. The estimation performance parameters are shown in Table 4. The CC charge was carried out on L123–L128 at C/3 (850 mA) in a 25 C temperature chamber.

Figure 9.
Voltage integral and SOH plot for the Panasonic CGR18650E cells from different histories during CC charge at C/3.
Table 4.
Estimation performance for same model and different history.
While the cells in each group had the same operational use and may have been subjected to similar stress and degradation modes, Figure 8 provides a promising insight. The two different groups are well aligned along the regression line. This shows that the history and application may have little effect on the voltage integral versus SOH relationship if the cells are of the same model and have similar production materials, processes and specifications.
A high correlation and maximum error at 0.50 prove that the voltage integral during CC charge at constant ambient temperature can be used to estimate the capacity SOH of batteries of the same model even when they are from applications.
3.4. Voltage Integral on Ageing Test on Cells with Known Chemistry
Following the results above, a dataset of the ageing test of some cells with known chemistry type was analysed to find the relationship between their SOH and the voltage integral. These cells include a positive electrode of LCO, as well as a blend of LCO and NMC, LFP, NCA and NMC. The dataset (CS2-37) consists of the measurements from the Arbin tester that was used to perform a cycle test with the charge at 0.5 C using the CCCV and discharge at 1 C on a 1.35 Ah LCO pouch cell at an approximately constant temperature of 25 C [34,35]. The time series dataset was analysed such that each full discharge was used to calculate the SOH of the cell, and the constant current charge phase was used to obtain the voltage integral. The scattered plot of the SOH and the voltage integral in Figure 10 show a good correlation of 0.9977.

Figure 10.
Voltage integral and SOH plot CS2-37 LCO cell (Adapted from [34,35]).
In another ageing test data for 14 cells with LCO-NMC in the positive electrode and nominal capacity of 2800 mAh, the cells were charged at 0.5 C in CCCV and discharged using 1.5 C at an ambient temperature of 25 C [36,37]. Plotting the SOH and the voltage integral also gave similar linear behaviour, with a correlation of 0.9919. See Figure 11.
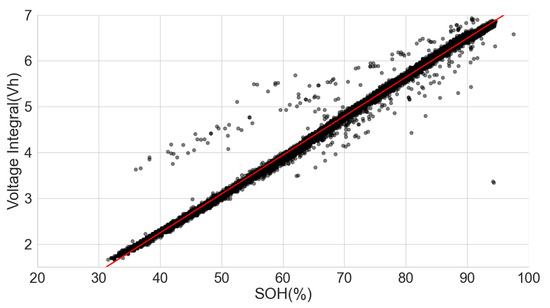
Figure 11.
Voltage integral and SOH plot for LCO-NMC cell (Adapted from [36,37]).
The extensive degradation test for four sets of 18650-format cells with chemistry types LFP, NCA and NMC by [37,38] under various conditions also provided useful data for analysing the LIB voltage integral and SOH. Only the time series dataset for the measurement at 25 C and 100% full cycle with 0.5 C and discharge with 1 C was used in the analysis. The dataset, however, had irregular sampling times for the readings. Some readings were also taken at 120 s intervals, which caused some erroneous results in the voltage integral. Despite that, the results prove that voltage integral during the CC charge for various chemistries is useful in estimating the SOH. The result is shown in Figure 12, Figure 13 and Figure 14 for the LFP (), NCA () and NMC (), respectively.
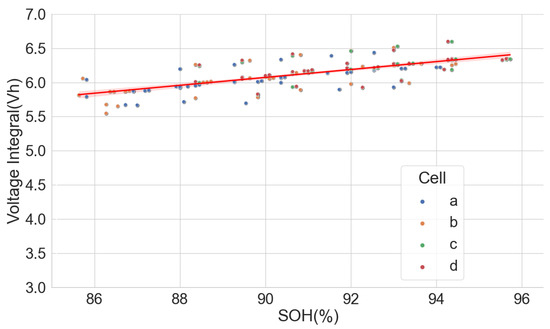
Figure 12.
Voltage integral and SOH plot for LFP cell (Adapted from [37,38]).
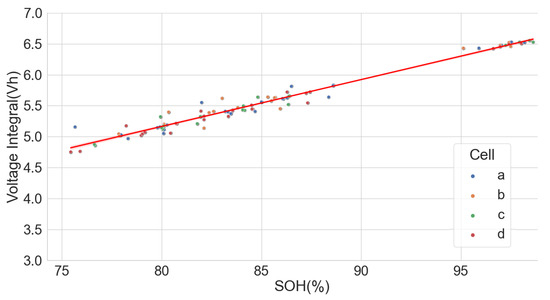
Figure 13.
Voltage integral and SOH plot for NCA cell (Adapted from [37,38]).
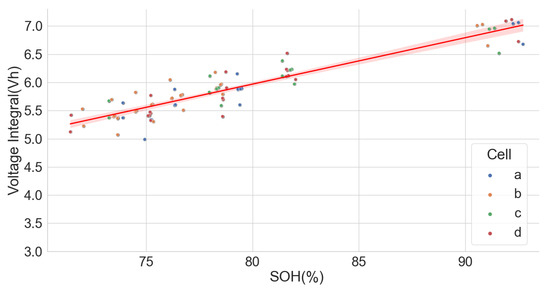
Figure 14.
Voltage integral and SOH plot for NMC cell (Adapted from [37,38]).
4. Discussion
4.1. Comparing Voltage Integral with Full Capacity Check
Following the high correlation of the SOH and the voltage integral, four scenarios are presented below to compare the time between carrying out the full capacity check and the voltage integral. Scenario 1 assumes that the cell initially has 0% SOC; in this case, the conventional capacity check-up requires charging the cell from 0% SOC to complete 100% SOC using the CCCV charge and then discharging to 0% SOC. However, for the voltage integral, the cell is charged to 4.2 V using CC. Scenario 2 is at 50% SOC, and Scenario 3 is the boundary condition of when the cells have had a complete CC charge to 4.2 V but have yet to undergo CV charge. Scenario 4 is when the cell is 100% charged. The CV charge capacity and time, CC charge capacity and time as well as CC discharge capacity and time obtained from the full capacity check-up and voltage integral at C/3 were used to calculate the estimated test duration for the 22 cells. The formulae used in estimating the test duration for the various scenarios are shown in Table 5. Method I is the full capacity check, and method II is the voltage integral.
Table 5.
Formula to calculate the test duration.
A ratio of the time taken when carrying out a full capacity check to the time taken to carry out a CC charge for obtaining the voltage integral under the scenarios described in Table 5 is shown in Figure 15. It is observed that the voltage integral method will improve the testing time for cells with an SOC at 0%, 50% and to the boundary phase of CC-CV. The exceptions are the few cells with a short CV phase time of less than 70 min, and the percentage of charge capacity during the CV charge of the total charge is less than 11%. In Scenario 4, where the cells are fully charged after CC and CV phase, a simple discharge to obtain the discharge capacity is faster to test because it is not necessary to charge at CC for the voltage integral calculation. If the effect of self-discharge in fully charged lithium–ion cells is considered [39], the likelihood of spent cells, discarded or out of service, remaining at 100% full charge is slim.
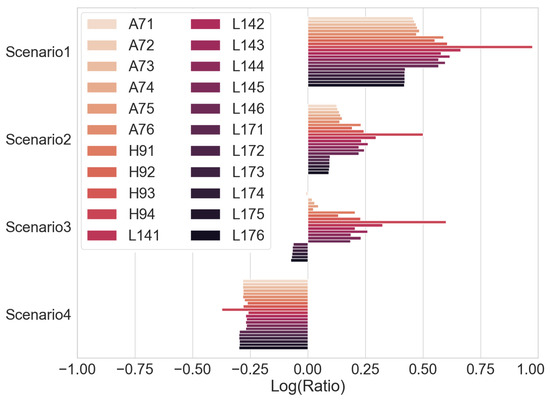
Figure 15.
Ratio of full capacity check time to voltage integral CC time.
In Scenario 4 above, it is possible to carry out a partial CC discharge and a CC charge to obtain the voltage integral between the voltages 3.85 V and 4.20 V. The voltage integral plot versus the SOH is shown in Figure 16. Unfortunately, poor correlation is seen for cells A71–A76 and L171–L176 because the cells in these groups have almost the same SOH; in this case, the voltage integral obtained during the partial charge did not bear a relationship with the SOH. Conversely, the correlation is better in H91–H94 and L141–L146, which have a broader degradation spectrum but have lower correlation when compared to the voltage integral of the entire voltage range from the low cut-off voltage, 3 V, to the high cut-off voltage, 4.2 V. Higher estimation errors were found with a partial charge, as shown in Table 6, compared to the estimation errors during the full CC charge seen in Table 3.
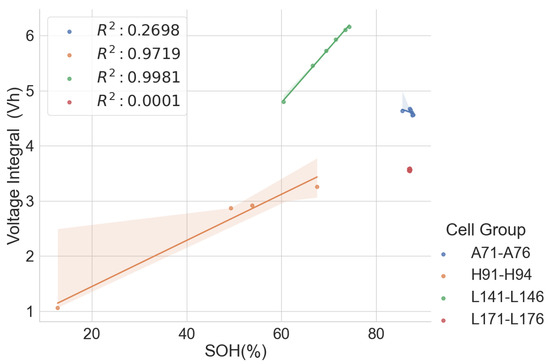
Figure 16.
Voltage integral and SOH plot for the 22 aged cells during CC charge at C/3 from 3.85 V to 4.2 V.
Table 6.
Estimation performance for partial charge from 3.85 V to 4.2 V.
This implies that cells can be discharged to half the nominal capacity and then charged to the high cut-off voltage to calculate the voltage integral from 3.85 V to 4.20 V if carried out on the same model of cells with varied degradation. A regression equation can be obtained, which could be used to estimate the SOH of other cells from their voltage integral. This can significantly reduce the test time for second-life cells.
Thus, using the voltage integral during the CC charge will improve the test time in estimating the SOH of spent lithium–ion cells compared to a full capacity check. Once the linear degradation equation for LIBs of the same model is obtained, a threshold voltage integral can be decided for a specific range of SOHs that can be applied in second-life applications. Therefore, during the CC charge, any cell that does not meet the minimum threshold voltage integral at 4.2 V can be discarded early in the test without subjecting it to other performance tests. The improvement in the test duration makes voltage integral cheaper than a full capacity check.
4.2. Comparing Voltage Integral with IC/DV
The IC/DV typically requires charging the LIB with a CC to see the various peaks and valleys representing the cell processes during charging. Thus, there is no extra time improvement compared to the voltage integral. In some online applications where partial charge or discharge may be considered to obtain the peaks and used to estimate the SOH [40], the approach may not be applicable in old cells that have limited historical data and whose degradation may be so varied that adopting just a particular voltage range may be erroneous. This view is, however, up for some more investigation.
As against the complex filtering requirement in the IC/DV, the voltage integral offers a simple integration, just like the simple capacity Coulomb’s counter that is installed in many BMS for estimating the SOC of LIBs. The Simpson’s rule of integration can be implemented in a microcontroller to obtain the voltage integral of the voltage readings during the CC charge. Care should be given to selecting a proper sampling time to limit integration errors.
4.3. Comparing Voltage Integral with EIS
Researchers who estimate the SOH using EIS tend to charge or discharge the LIB to a specific SOC before carrying out the EIS measurement because the EIS measurement also depends on the SOCs. If the method adopted by [22] is followed, the reference cells of the same models will be charged to various SOCs, for example, 0%, 25%, 50%, 75% and 100%, and their EIS measurement carried out. After that, the frequency with the slightest change in the impedance will be determined. Subsequently, the relationship between the impedance and the SOH obtained from a full capacity check at the selected frequency can be investigated. This activity can take considerable time if a few cells are considered. However, further tests may be needed to confirm whether the selected frequency would be constant for cells of the same model irrespective of their first application. EIS would be faster than the voltage integral if the optimum frequency and amplitude of the sinusoidal perturbation were constant for the same model of LIB, as a fixed device can be designed for the same model LIB at a fixed frequency. The complex signal processing required in the EIS measurements makes EIS more expensive than the voltage integral.
5. Conclusions
The linear relationship between the SOH and the voltage integral of cells of the same model provides a good indication for assessing spent lithium–ion cells’ potential for second life without carrying out a full charge and discharge on each cell. In addition, a dataset of ageing tests on cells with known chemistry, namely LFP, NMC, LCO and NCA, was analysed, and the result also shows a good correlation. Therefore, for first-life cells with unknown historical data, complete cycle charge and discharge can be carried out on a few similar cells with apparent differences in easily measurable variables such as resistance and open-circuit voltage to obtain the relationship between SOH and voltage integral during CC charge. This can be used to provide a simple degradation equation from which the SOH of the other cells can be estimated by substituting the voltage integral, which is obtained for the other cells by charging only from 0% SOC at low cut-off voltage to the high cut-off voltage using the same charge current and ambient temperature as the model cells. This would result in a significant reduction in the time required for testing all the cells. This method is also less complicated that only an adaptation of the existing algorithm, for an SOC check-up to voltage integral during the CC charge is sufficient to estimate the SOH and make a selection decision for second-life applications.
A particular voltage integral limit may be decided such that, during the CC charge, any cell that does not reach the limit at 4.2 V is discarded because it may not have a good capacity for reuse. Moreover, manufacturers can perform an ageing test on their models and provide such linear plots as performance information to end-users who can, in turn, use it in the online estimation of the SOH of the cells provided from the voltage integral, which was calculated from the measurements obtained at the same current and ambient temperature.
The recommendation from the result of this paper is to include the voltage integral in the evaluation methods for assessing the SOH of lithium–ion batteries. Further work is needed to investigate its viability in battery packs.
Author Contributions
O.A. contributed to the conceptualisation, methodology, software, validation, formal analysis, investigation, data curation, writing—original draft preparation and visualisation; J.K. contributed to supervision and review. All authors have read and agreed to the published version of the manuscript.
Funding
This research was funded by the German Academic Exchange Service (DAAD) and Petroleum Technology Development Fund (PTDF) under the Nigerian–German Postgraduate Training Programme Ph.D., 2022, grant number 57610608.
Data Availability Statement
The dataset is available under https://depositonce.tu-berlin.de/handle/11303/20006 (accessed on 15 September 2023).
Acknowledgments
We acknowledge support by the German Research Foundation and the Open Access Publication Fund of TU Berlin.
Conflicts of Interest
The authors declare no conflict of interest.
Abbreviations
The following abbreviations are used in this manuscript:
| BMS | Battery Management System |
| CC | Constant Current |
| CCCV | Constant Current Constant Voltage |
| CV | Constant Voltage |
| DV | Differential Voltage |
| EIS | Electrochemical Impedance Spectrometry |
| ECM | Equivalent Circuit Model |
| IC | Incremental Capacity |
| LAM | Loss of Active Material |
| LCO | Lithium–Cobalt–Oxide |
| LFP | Lithium–Iron–Phosphate |
| LIB | Lithium–Ion Battery |
| LLI | Loss of Lithium Inventory |
| MAE | Mean Absolute Error |
| MARE | Mean Absolute Relative Error |
| ME | Maximum Error |
| NMC | Nickel–Manganese–Cobalt |
| NCA | Nickel–Cobalt–Aluminium |
| PED | Personal Electronic Devices |
| RMSE | Root Mean Squared Error |
| SEI | Solid Electrolyte Interphase |
| SOC | State of Charge |
| SOH | State of Health |
References
- Tarvydas, D.; Tsiropoulos, I.; Lebedeva, N. Li-Ion Batteries for Mobility and Stationary Storage Applications; Publications Office of the European Union: Luxembourg, 2018. [Google Scholar] [CrossRef]
- Liang, Y.; Zhao, C.Z.; Yuan, H.; Chen, Y.; Zhang, W.; Huang, J.Q.; Yu, D.; Liu, Y.; Titirici, M.M.; Chueh, Y.L.; et al. A review of rechargeable batteries for portable electronic devices. InfoMat 2019, 1, 6–32. [Google Scholar] [CrossRef]
- Arora, A.; Lele, S.; Medora, N.; Souri, S. Lithium-Ion Battery Failures in Consumer Electronics; Artech House: Norwood, MA, USA, 2019. [Google Scholar]
- Tong, S.J.; Same, A.; Kootstra, M.A.; Park, J.W. Off-grid photovoltaic vehicle charge using second life lithium batteries: An experimental and numerical investigation. Appl. Energy 2013, 104, 740–750. [Google Scholar] [CrossRef]
- Wolfs, P. An economic assessment of “second use” lithium-ion batteries for grid support. In Proceedings of the 2010 20th Australasian Universities Power Engineering Conference, Christchurch, New Zealand, 5–8 December 2010; pp. 1–6. [Google Scholar]
- Eleftheriadis, P.; Leva, S.; Gangi, M.; Rey, A.V.; Borgo, A.; Coslop, G.; Groppo, E.; Grande, L.; Sedzik, M. Second life batteries: Current regulatory framework, evaluation methods, and economic assessment. In Proceedings of the 2022 IEEE International Conference on Environment and Electrical Engineering and 2022 IEEE Industrial and Commercial Power Systems Europe (EEEIC/I&CPS Europe), Prague, Czech Republic, 28 June–1 July 2022; pp. 1–6. [Google Scholar] [CrossRef]
- Zhao, G. Reuse and Recycling of Lithium-Ion Power Batteries; John Wiley & Sons: Hoboken, NJ, USA, 2017. [Google Scholar] [CrossRef]
- Salinas, F.; Kowal, J. Classifying aged Li-ion cells from notebook batteries. Sustainability 2020, 12, 3620. [Google Scholar] [CrossRef]
- Kosfeld, M.; Westphal, B.; Kwade, A. Moisture behavior of lithium-ion battery components along the production process. J. Energy Storage 2023, 57, 106174. [Google Scholar] [CrossRef]
- Glaize, C.; Genies, S. Lithium Batteries and other Electrochemical Storage Systems; John Wiley & Sons: Hoboken, NJ, USA, 2013. [Google Scholar]
- Shahjalal, M.; Roy, P.K.; Shams, T.; Fly, A.; Chowdhury, J.I.; Ahmed, M.R.; Liu, K. A review on second-life of Li-ion batteries: Prospects, challenges, and issues. Energy 2022, 241, 122881. [Google Scholar] [CrossRef]
- Chen, L.; Lü, Z.; Lin, W.; Li, J.; Pan, H. A new state-of-health estimation method for lithium-ion batteries through the intrinsic relationship between ohmic internal resistance and capacity. Measurement 2018, 116, 586–595. [Google Scholar] [CrossRef]
- Stroe, D.I.; Swierczynski, M.; Kær, S.K.; Teodorescu, R. Degradation behavior of lithium-ion batteries during calendar ageing—The case of the internal resistance increase. IEEE Trans. Ind. Appl. 2017, 54, 517–525. [Google Scholar] [CrossRef]
- Montes, T.; Etxandi-Santolaya, M.; Eichman, J.; Ferreira, V.J.; Trilla, L.; Corchero, C. Procedure for assessing the suitability of battery second life applications after ev first life. Batteries 2022, 8, 122. [Google Scholar] [CrossRef]
- Neupert, S.; Kowal, J. Model-Based State-of-Charge and State-of-Health Estimation Algorithms Utilizing a New Free Lithium-Ion Battery Cell Dataset for Benchmarking Purposes. Batteries 2023, 9, 364. [Google Scholar] [CrossRef]
- Nuroldayeva, G.; Serik, Y.; Adair, D.; Uzakbaiuly, B.; Bakenov, Z. State of Health Estimation Methods for Lithium-Ion Batteries. Int. J. Energy Res. 2023, 2023, 4297545. [Google Scholar] [CrossRef]
- Meddings, N.; Heinrich, M.; Overney, F.; Lee, J.S.; Ruiz, V.; Napolitano, E.; Seitz, S.; Hinds, G.; Raccichini, R.; Gaberšček, M.; et al. Application of electrochemical impedance spectroscopy to commercial Li-ion cells: A review. J. Power Sources 2020, 480, 228742. [Google Scholar] [CrossRef]
- Jiang, J.; Lin, Z.; Ju, Q.; Ma, Z.; Zheng, C.; Wang, Z. Electrochemical impedance spectra for lithium-ion battery ageing considering the rate of discharge ability. Energy Procedia 2017, 105, 844–849. [Google Scholar] [CrossRef]
- Lohmann, N.; Weßkamp, P.; Haußmann, P.; Melbert, J.; Musch, T. Electrochemical impedance spectroscopy for lithium-ion cells: Test equipment and procedures for aging and fast characterization in time and frequency domain. J. Power Sources 2015, 273, 613–623. [Google Scholar] [CrossRef]
- Schuster, S.F.; Brand, M.J.; Campestrini, C.; Gleissenberger, M.; Jossen, A. Correlation between capacity and impedance of lithium-ion cells during calendar and cycle life. J. Power Sources 2016, 305, 191–199. [Google Scholar] [CrossRef]
- Liu, Y.; Xie, J. Failure study of commercial LiFePO4 cells in overcharge conditions using electrochemical impedance spectroscopy. J. Electrochem. Soc. 2015, 162, A2208. [Google Scholar] [CrossRef]
- Love, C.T.; Virji, M.B.; Rocheleau, R.E.; Swider-Lyons, K.E. State-of-health monitoring of 18650 4S packs with a single-point impedance diagnostic. J. Power Sources 2014, 266, 512–519. [Google Scholar] [CrossRef]
- Pastor-Fernández, C.; Widanage, W.D.; Chouchelamane, G.; Marco, J. A SoH diagnosis and prognosis method to identify and quantify degradation modes in Li-ion batteries using the IC/DV technique. In Proceedings of the 6th Hybrid and Electric Vehicles Conference (HEVC 2016), London, UK, 2–3 November 2016; pp. 1–6. [Google Scholar] [CrossRef]
- Eddahech, A.; Briat, O.; Vinassa, J.M. Determination of lithium-ion battery state-of-health based on constant-voltage charge phase. J. Power Sources 2014, 258, 218–227. [Google Scholar] [CrossRef]
- Zhou, Y.; Huang, M.; Pecht, M. An online state of health estimation method for lithium-ion batteries based on integrated voltage. In Proceedings of the 2018 IEEE International Conference on Prognostics and Health Management (ICPHM), Seattle, WA, USA, 11–13 June 2018; pp. 1–5. [Google Scholar] [CrossRef]
- Bayati, M.; Abedi, M.; Farahmandrad, M.; Gharehpetian, G.B.; Tehrani, K. Important technical considerations in design of battery chargers of electric vehicles. Energies 2021, 14, 5878. [Google Scholar] [CrossRef]
- Yi, Z.; Chen, Z.; Yin, K.; Wang, L.; Wang, K. Sensing as the key to the safety and sustainability of new energy storage devices. Prot. Control. Mod. Power Syst. 2023, 8, 27. [Google Scholar] [CrossRef]
- SecondLifeStorage. Cell Database. Available online: https://secondlifestorage.com/index.php?pages/cell-database/&fsort=1&fbrand=&fform=&fkeys= (accessed on 2 February 2023).
- Shopee. Sony-US18650GS Datasheet. Available online: https://shopee.com.my/Sony-US18650GS-18650-2200mAh-3.7V-4.2V-gs-Rechargeable-japan-lithium-ion-Li-ion-Battery-laptop-flash-torch-light-i.95789828.2097066876 (accessed on 2 February 2023).
- TexasInstruments. Chemistry Selection Table. Available online: https://e2e.ti.com/cfs-file/__key/telligent-evolution-components-attachments/00-196-01-00-00-62-07-85/chemistry_5F00_selection_5F00_table.xls (accessed on 2 February 2023).
- NKON. How to Know the Date Code. 12 August 2021. Available online: https://eu.nkon.nl/blog/ (accessed on 2 February 2023).
- Shklov, N. Simpson’s Rule for Unequally Spaced Ordinates. Am. Math. Mon. 1960, 67, 1022–1023. [Google Scholar] [CrossRef]
- Cartwright, K.V. Simpson’s Rule Integration with MS Excel and Irregularly-spaced Data. J. Math. Sci. Math. Educ. 2016, 11, 34–42. [Google Scholar]
- Xing, Y.; Ma, E.W.; Tsui, K.L.; Pecht, M. An ensemble model for predicting the remaining useful performance of lithium-ion batteries. Microelectron. Reliab. 2013, 53, 811–820. [Google Scholar] [CrossRef]
- CALCE. Battery Data. Available online: https://web.calce.umd.edu/batteries/data/ (accessed on 3 October 2023).
- Devie, A.; Baure, G.; Dubarry, M. Intrinsic variability in the degradation of a batch of commercial 18650 lithium-ion cells. Energies 2018, 11, 1031. [Google Scholar] [CrossRef]
- HNEI; SNL. Battery Archive. Available online: https://batteryarchive.org (accessed on 7 October 2023).
- Preger, Y.; Barkholtz, H.M.; Fresquez, A.; Campbell, D.L.; Juba, B.W.; Romàn-Kustas, J.; Ferreira, S.R.; Chalamala, B. Degradation of commercial lithium-ion cells as a function of chemistry and cycling conditions. J. Electrochem. Soc. 2020, 167, 120532. [Google Scholar] [CrossRef]
- Shan, H.; Cao, H.; Xu, X.; Xiao, T.; Hou, G.; Cao, H.; Tang, Y.; Zheng, G. Investigation of self-discharge properties and a new concept of open-circuit voltage drop rate in lithium-ion batteries. J. Solid State Electrochem. 2022, 26, 163–170. [Google Scholar] [CrossRef]
- Weng, C.; Cui, Y.; Sun, J.; Peng, H. On-board state of health monitoring of lithium-ion batteries using incremental capacity analysis with support vector regression. J. Power Sources 2013, 235, 36–44. [Google Scholar] [CrossRef]


Disclaimer/Publisher’s Note: The statements, opinions and data contained in all publications are solely those of the individual author(s) and contributor(s) and not of MDPI and/or the editor(s). MDPI and/or the editor(s) disclaim responsibility for any injury to people or property resulting from any ideas, methods, instructions or products referred to in the content. |
© 2023 by the authors. Licensee MDPI, Basel, Switzerland. This article is an open access article distributed under the terms and conditions of the Creative Commons Attribution (CC BY) license (https://creativecommons.org/licenses/by/4.0/).