Article

Experimental Investigation of State and Parameter Estimation within Reconfigurable Battery Systems

by
Michael Theiler
1,*,
Dominik Schneider
1,2 and
Christian Endisch
1
1
Research Group Electromobility and Learning Systems, Technische Hochschule Ingolstadt, D-85049 Ingolstadt, Germany
2
School of Engineering & Design, Institute for Electrical Drive Systems and Power Electronics, Technical University of Munich, D-80333 Munich, Germany
*
Author to whom correspondence should be addressed.
Batteries 2023, 9(3), 145; https://doi.org/10.3390/batteries9030145
Submission received: 11 November 2022 / Revised: 30 January 2023 / Accepted: 14 February 2023 / Published: 21 February 2023

Abstract

:
The battery system is one of the most-important, but also -critical components in the electric power-train. The battery’s system states and parameters are commonly tracked by the battery monitoring system. However, in reality, the accuracy of the state and parameter estimation may suffer from insufficient excitation of the system. Since the current states and parameters serve as the basis for many battery management system functions, this might lead to incorrect operation and severe damage. Reconfigurable battery systems allow enhancing the system’s excitation by applying a switching operation. In this contribution, the state and parameter estimation of a reconfigurable battery module were simulated and tested experimentally. Thereby, a low-exciting and a high-exciting drive cycle were compared. Furthermore, the switching patterns were applied to enhance the excitation and, hence, improve the estimation of an extended Kalman filter. The cells were switched via a pulse-width modulation signal, and the influence of frequency and duty cycle variation on the estimation accuracy were investigated. Compared to the low-excitation input, a significant improvement in the estimation of up to 46 % for the state of charge and 78 % for the internal resistance were achieved. Hereby, low frequencies and duty cycles proved to be particularly advantageous. Switching, however, has only a limited influence on an already highly excited system and may lead to additional aging due to higher heat generation.

1. Introduction

With the ongoing change of the mobility sector from combustion engines to battery electric vehicles (BEVs), the need for appropriate energy storage technologies has become apparent. Lithium-ion battery systems have been proven to be a capable solution for this task with respect to energy and power density, durability, and cost. However, permanent monitoring of the battery cells is necessary to prevent cell defects and to avoid the violation of the operation limits. This involves lower and upper voltage limits and a defined temperature range. Outside these boundaries, the battery’s degradation is accelerated and serious defects may occur. Therefore, a battery monitoring system (BMS) is an essential part of each lithium-ion storage system [1]. Furthermore, to predict the BEV’s remaining range and lifetime, the determination of the state of charge (SOC) and state of health (SOH) is of high interest from the costumer’s perspective. For that purpose, model-based approaches such as the well-known Kalman filter are widely used in BMSs. These methods combine measurement data of voltage and current with a priori model knowledge and require low computational effort. Although, in recent years, many scientific publications have dealt with the state and parameter estimation of lithium-ion batteries with Kalman filters [2,3,4,5], commonly, their approaches have been validated using excitation profiles of high dynamics, e.g., hybrid pulse power characterization (HPPC) [6,7], dynamic stress tests (DSTs) [8,9], or current profiles based on driving profiles such as the Urban Dynamometer Driving Schedule (UDDS) [8,10,11]. However, in real-world operations of BEVs, the current excitation is often of low dynamics, e.g., while charging over night or when driving with constant velocity on a highway. These operation conditions are challenging for the state and parameter estimation, bearing in mind that, for nonlinear systems, single states can become unobservable, if the system’s input is small [12,13]. In [14], the input current of a lithium-ion cell was superimposed by a pseudo-random binary sequence (PRBS), which led to smaller estimation errors due to the additional excitation.
A promising evolutionary step of energy storage systems is reconfigurable battery systems (RBSs), where the connection of single battery cells with each other is flexible during operation [15,16]. For this purpose, the cells are equipped with power switches that can disable or bypass single cells or strings. This enables functionalities such as balancing [17], fault localization [18], or even a time-varying output voltage. Thus, the so-called multi-level inverter arises [19].
In a previous work of the authors [13], the influence of the switching operation of RBSs on the state and parameter estimation was investigated. The contribution showed that applying a high dynamic switching pattern during periods of low current excitation improved the estimation accuracy of both the states and parameters. Especially using a pulse-width modulation (PWM) as the switching pattern has been assessed as a promising approach. These findings have been validated by experiments of a battery system consisting of three lithium-ion battery cells connected in parallel. However, the frequency of the switching pattern and the duty cycle of the PWM were kept constant.
In our contribution, an RBS was excited by two different current profiles, whereby one of them is of low dynamics. Switching patterns with varying frequencies and duty cycles were applied to find the optimal parameters. Furthermore, the input current profiles and their frequency spectrum were carefully analyzed without and with the switching operation of the RBS, respectively. The approach was validated by simulations and experiments. The goal of this work was to investigate the influence of the switching pattern’s characteristics on the accuracy of state and parameter estimation. These experiments with varying frequencies and pulse widths, respectively, were conducted for the first time to the best of the authors’ knowledge. With a profound understanding of the relation between switching operation and its influence on the state and parameter estimation, control strategies for RBSs can be developed that account for system excitation properly.
An overall methodology is shown in Figure 1, and the work is structured as follows: In Section 2, the used state and parameter estimation based on the Kalman filter is introduced. The method was based on an equivalent circuit model of the battery cell, which was parameterized by characterization tests. The used switching patterns are shown as well. Section 3 deals with the input current profiles used and analyzes them in detail in terms of their ability to excite the system. In Section 4, the applied simulations, the sensor model, and the experimental setup are described, and the results are presented and discussed in Section 5, before summarizing the major findings.

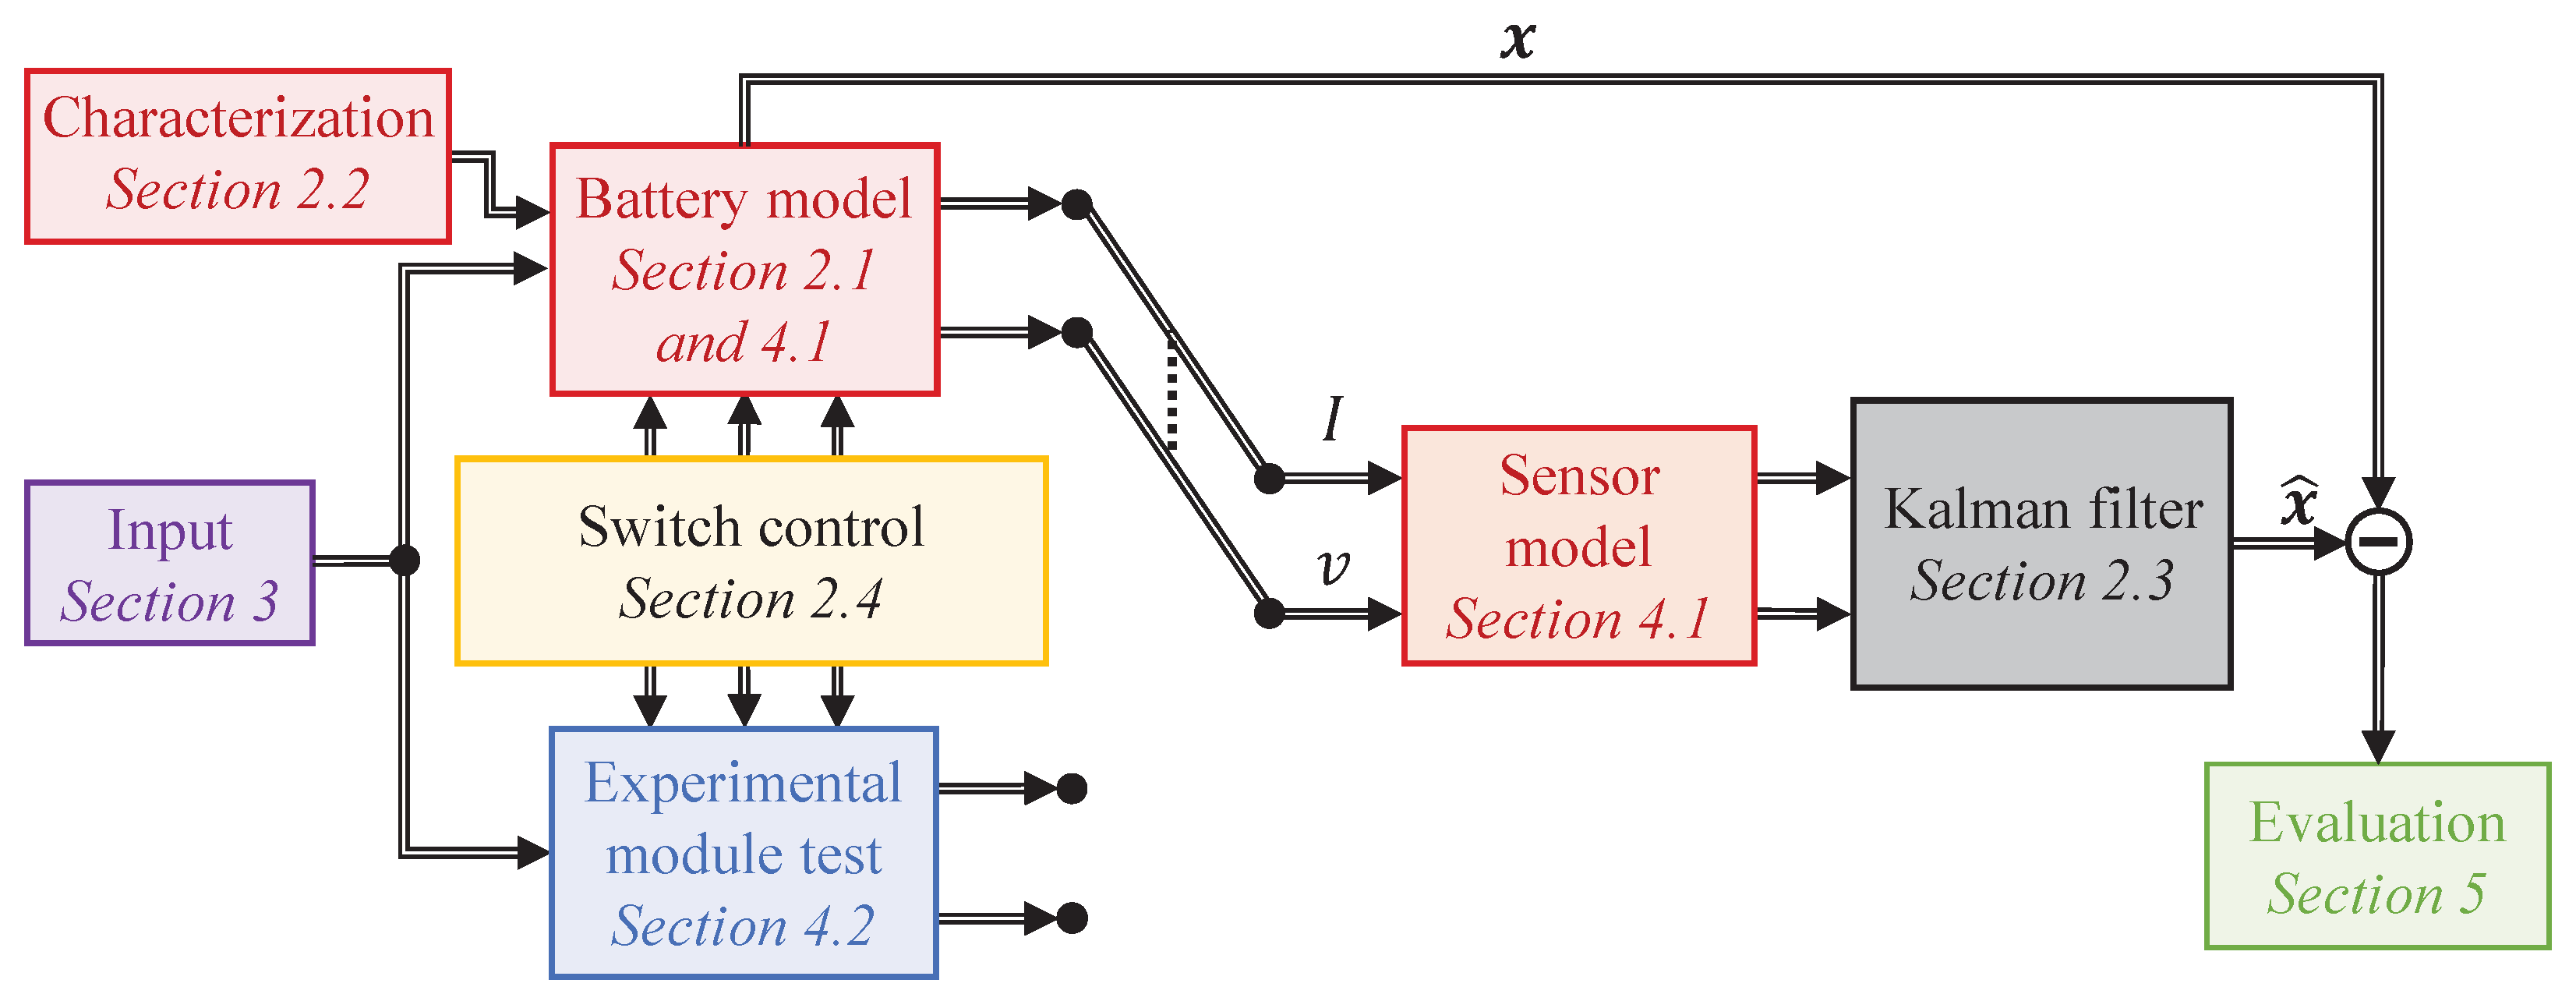
2. Enhanced State and Parameter Estimation
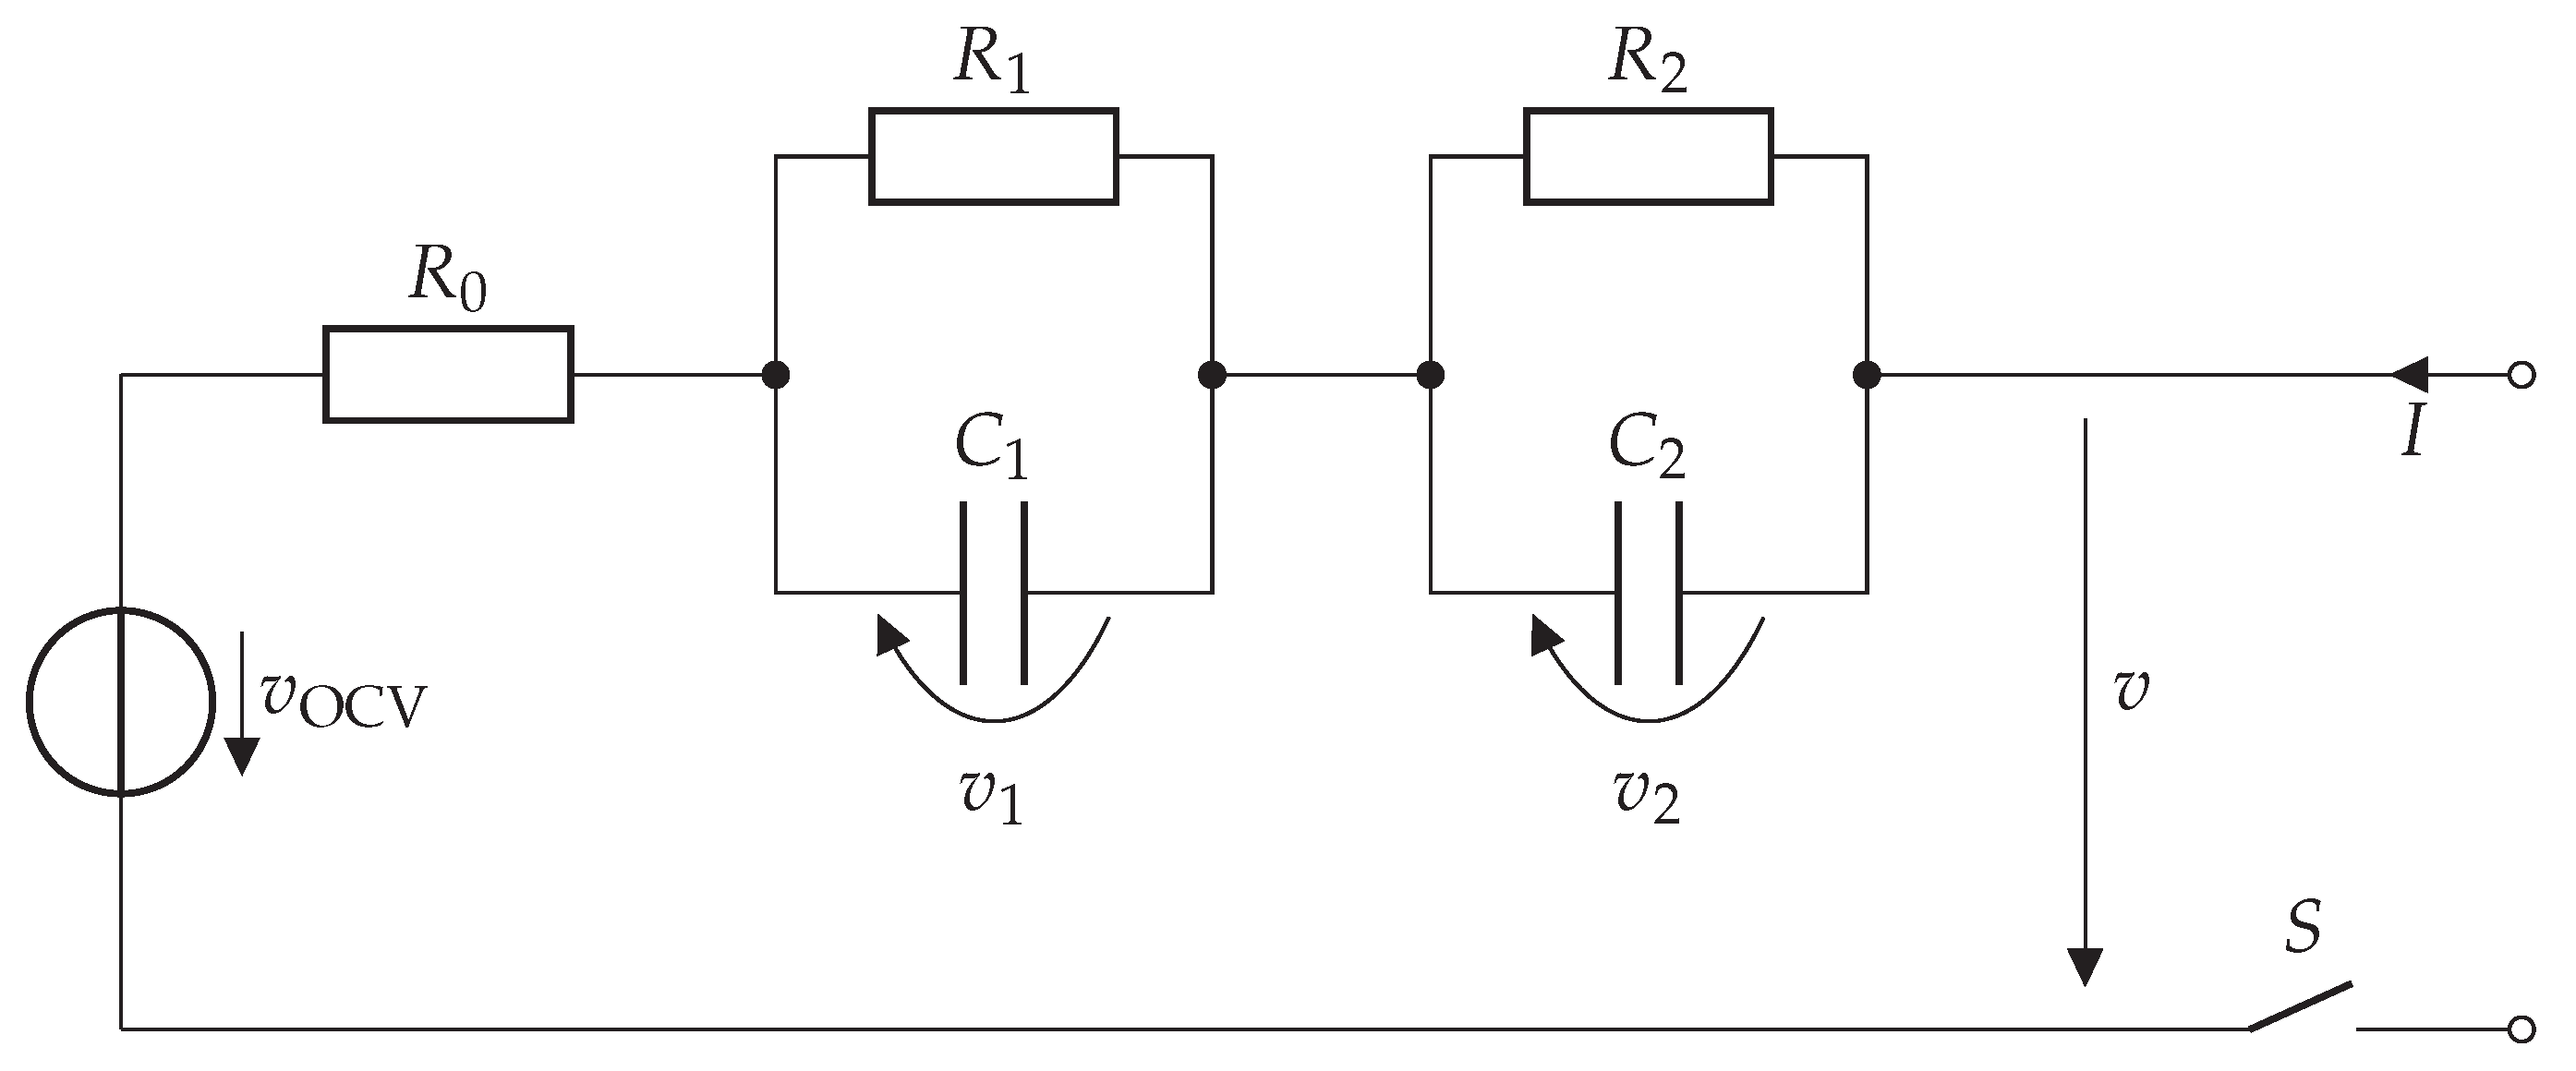
2.1. Battery Model

Equivalent circuit models (ECMs) have proven to be an efficient solution to model the electrical behavior of lithium-ion batteries. The dual-polarization model that was used in this work is displayed in Figure 2. It consists of an SOC-dependent voltage source v OCV , an ohmic resistance R 0 , and two resistor–capacitor (RC) elements, which are characterized by the resistance R 1 / 2 and capacitance C 1 / 2 . All resistances and capacitances, as well as v OCV are SOC- and temperature-dependent. Additionally, the switch S 0 , 1 allows interrupting the current path through the battery.
Based on v OCV and the polarization voltages of the RC elements v 1 / 2 , the cell’s terminal voltage is
v = v OCV + v 1 + v 2 .
Considering the RC elements’ time constants τ 1 / 2 = R 1 / 2 C 1 / 2 , their differential equation is given as
v ˙ 1 / 2 = v 1 / 2 τ 1 / 2 + R 1 / 2 τ 1 / 2 · I .
The SOC is obtained by Coulomb counting, i.e., by integrating the current according to
SOC ( t ) = t = 0 t η I ( ν ) 36 Q d ν + SOC ( t 0 ) ,
where Q is the capacity of the lithium-ion cell in Ah and  η is the Coulombic efficiency, which is assumed to be nearly equal to 1 for lithium-ion batteries. Please note that charging currents are defined as positive in this work, whereas discharging currents have a negative sign.
Based on the aforementioned equations, a single-input, single-output (SISO) system in discrete state-space notation is given, whereas the state vector is defined as x = SOC , v 1 , v 2 T . The discrete input is u k = S · I ( k · Δ t ) , and the measurement is y k = v ( k · Δ t ) with the simulation step size Δ t .
x k + 1 = 1 0 0 0 e Δ t τ 1 0 0 0 e Δ t τ 2 A x k + η Δ t 36 Q R 1 ( 1 e Δ t τ 1 ) R 2 ( 1 e Δ t τ 2 ) B u k + q k
y k = v OCV ( SOC k ) SOC k 1 1 C x k + R 0 D u k + r k
Additionally, the system Equation (4) comprises a random noise  q k R n × 1 of the same order n as the state, and the measurement Equation (5) is superimposed by the measurement noise r k . Both are assumed to be normal distributed with mean zero and known variance. Please note that by updating the nonlinearity of v OCV ( SOC ) in the first element of C for every iteration, the resulting system in state-space is linear with respect to its state.

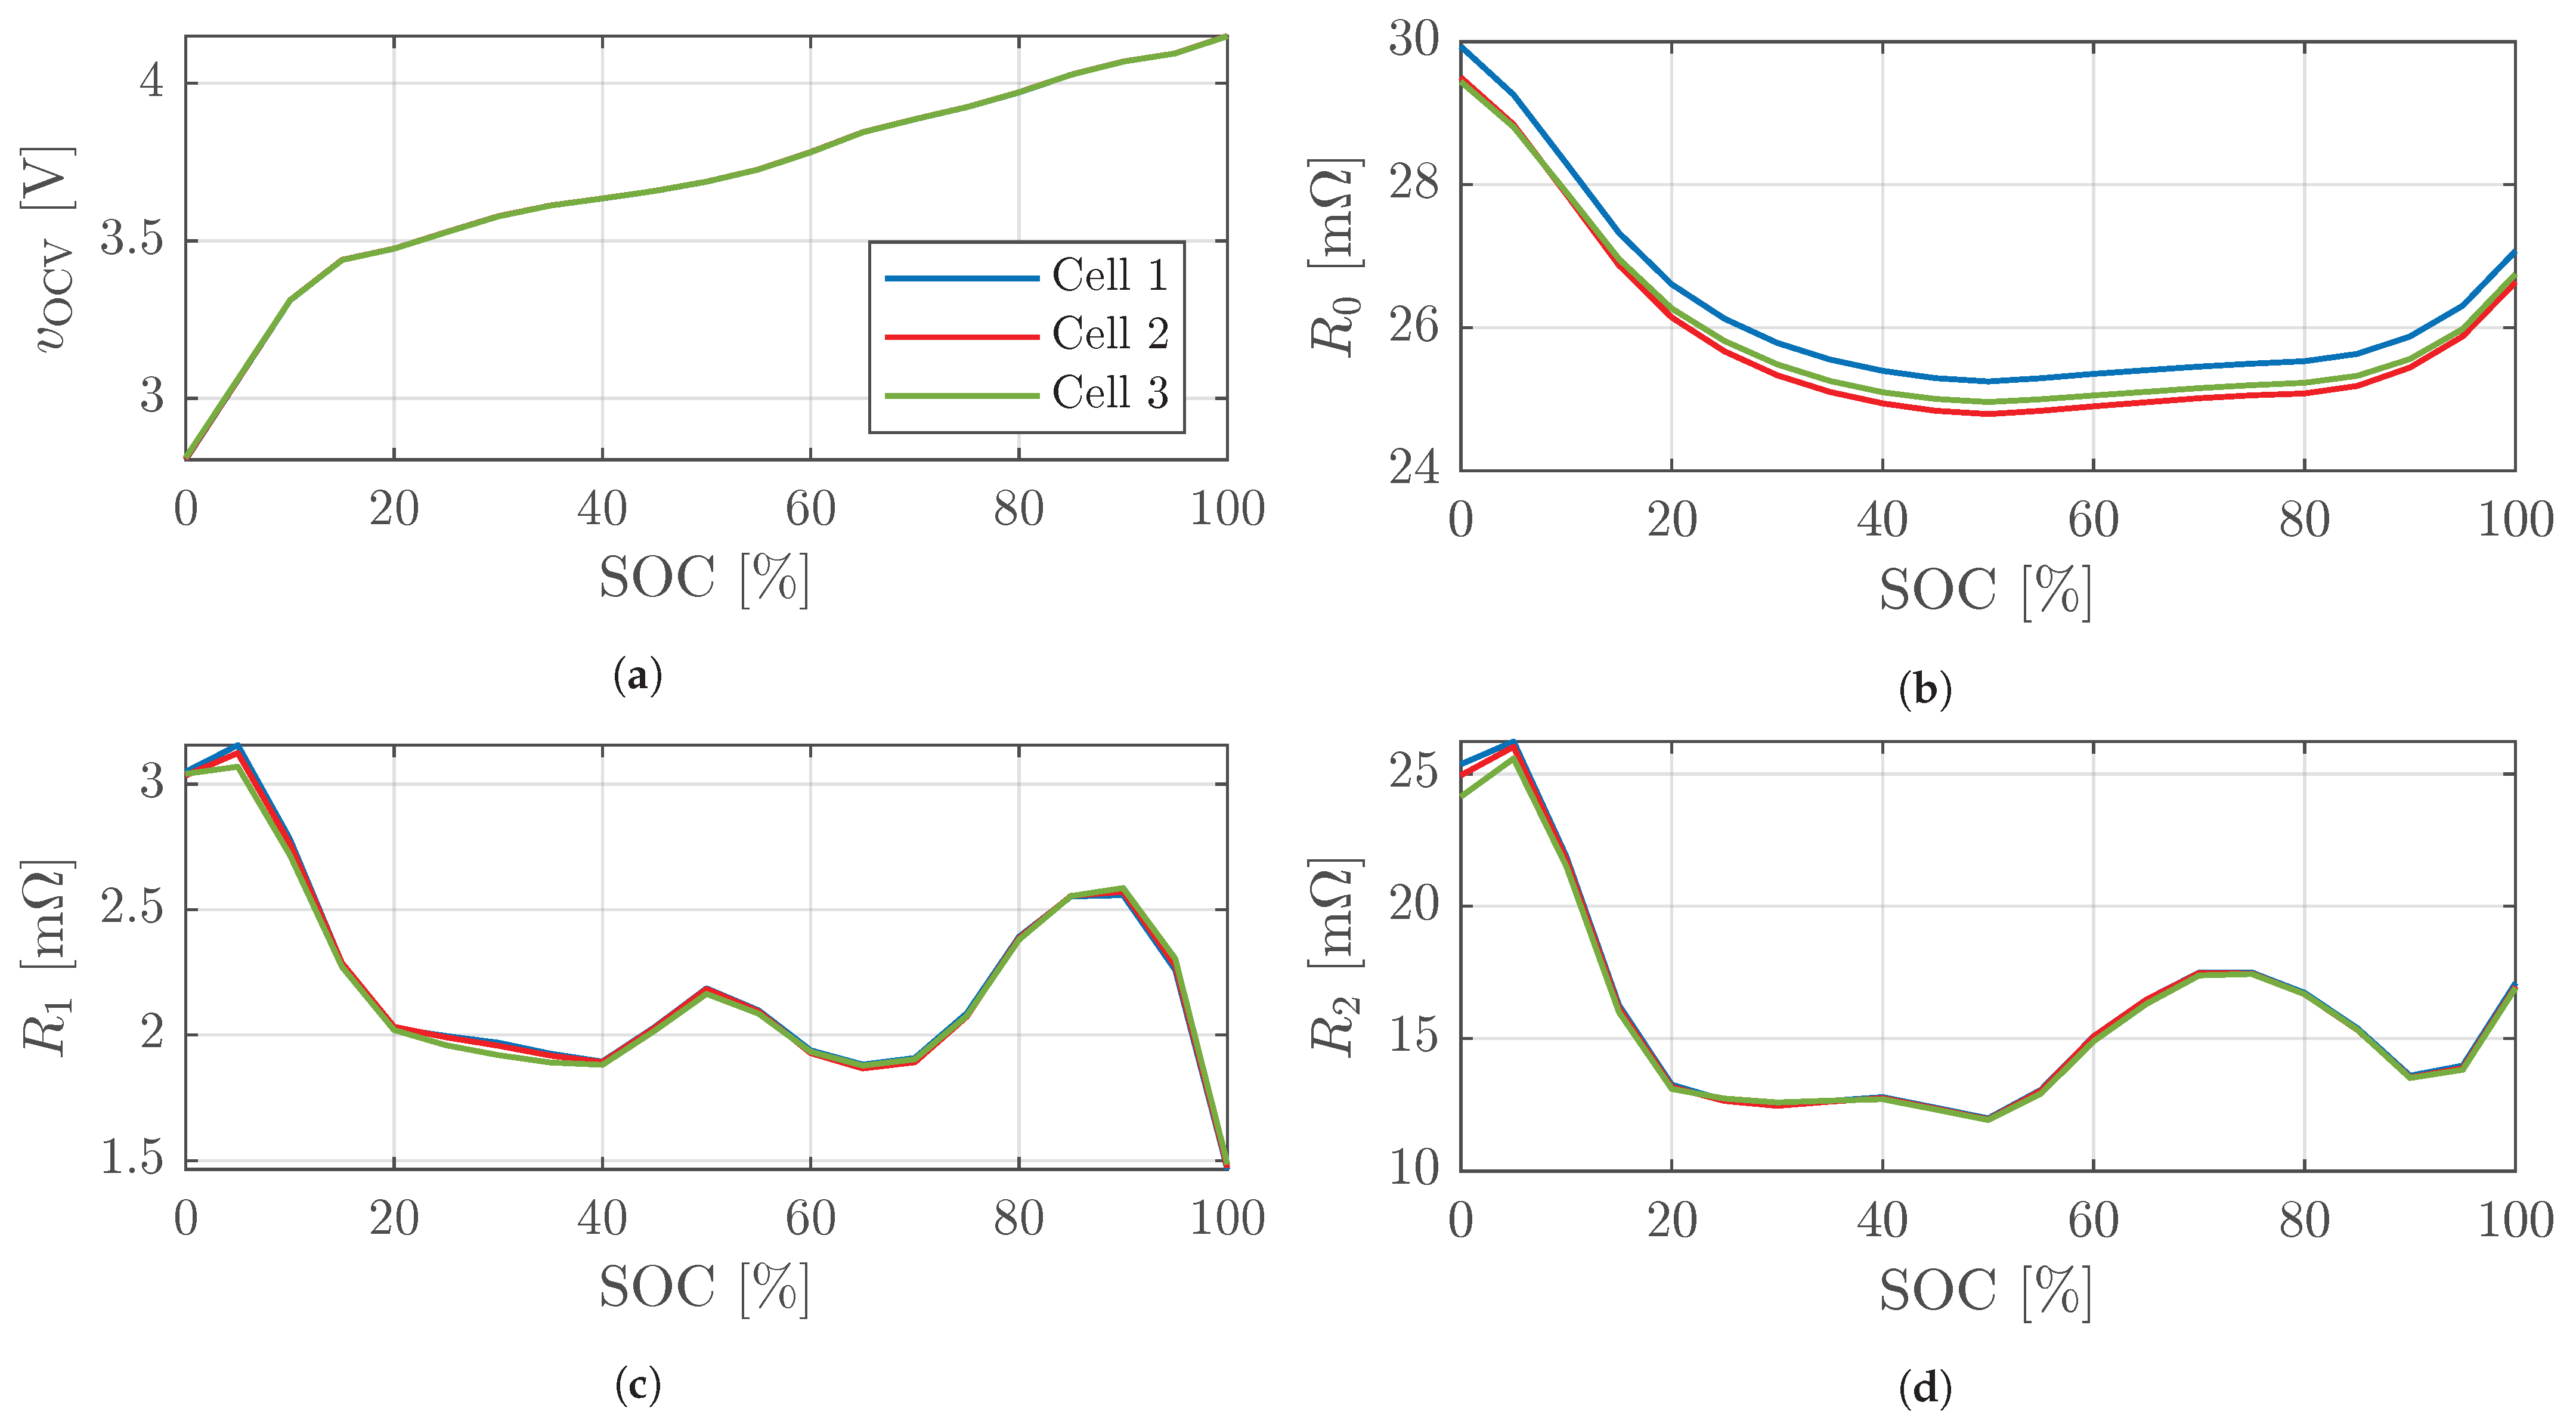
2.2. Cell characterization

Characterization tests were conducted to parameterize the presented ECM with respect to the lithium-ion battery cells used in our experiments. Furthermore, the determined cell parameters served as reference values in order to access the performance of the parameter estimator. The used lithium-ion cell of Type INR18650-25R is a commercial 18650 cell from the manufacturer Samsung. The important specifications of this cell type according to the data sheet and [20] are summarized in Table 1.
The characterization tests were performed with an Arbin LBT 5 V/60 A battery tester, and the battery cells were placed in a KB 115 Binder temperature chamber at 25 ± 2 °C. Therefore, the temperature dependence of the ECM parameter were neglected in the following, but  v OCV , R 0 , R 1 , and R 2 were still SOC-dependent values. Furthermore, we modeled the RC elements’ time constants to be constant with τ 1 = 1 s and τ 2 = 20 s . These values are defined based on previous characterization work and are in good agreement with [21] over a wide SOC range. Each of the three cells that were used in the later experiments was characterized individually. All of the tests were initiated with constant current/constant voltage (CCCV) charging with a current rate of 1 C until the upper voltage limit of 4.2 V was reached. The constant voltage phase terminated for a current rate less than C/10. To determine the SOC-dependent open-circuit voltage, an incremental open-circuit voltage (OCV) test was applied, with 5% SOC steps in the charge and discharge direction, respectively. The rest time between the charge/discharge steps was always set to 30 min . The  v OCV was determined by averaging the voltages of the charge and discharge curve to compensate for hysteresis effects. Dynamic pulse current tests were applied at 10 different SOC stages to identify the respective resistances R 0 , R 1 , and R 2 . The excitation consisted of 2 pulses in the charge and discharge direction each with an amplitude of 2 C and a duration of 1 s and 10 s , respectively (see Figure 3). With the MATLAB function fminsearch, the root-mean-squared error (RMSE) between the measured and modeled terminal voltage was minimized with respect to the unknown model parameters. The results for the three used cells are displayed in Figure 4 over the entire SOC range. For all parameters, a clear SOC-dependent behavior was visible, and only a slight deviation in internal resistance was evident among the cells. Validation tests revealed an RMSE of the modeled terminal voltage of 6 mV. The determined model parameters were used in the simulations, as well as in the experiments, where they served as reference values.

2.3. Kalman Filtering

Online state and parameter estimation was realized by the well-known extended Kalman filter (EKF). Given the discrete state-space Equations (4) and (5), the state vector was augmented by a random walk model for the estimation of the parameters R 0 , R 1 , and R 2 , which resulted in the following nonlinear equation of the augmented system.
x k + 1 w k + 1 = f ( x k , w k , u k ) w k + q k
y k = h ( x k , w k , u k ) + r k
Hereby, the assumptions holds that the process noise q is Gaussian noise with zero mean and known covariance matrix Q . Similarly, the measurement noise is normally distributed with an expectation of zero and the variance R. Furthermore, the process and measurement noise are uncorrelated among other. Because the augmented system of (6) and (7) is nonlinear, the EKF was applied. For this, the system and measurement equation, respectively, were linearized at each time step using Taylor series. The EKF equations are displayed in Algorithm 1. We used Joseph’s form for updating the covariance matrix P ^ , because we achieved better numerical stability this way. Furthermore, at the end of each iteration of the Kalman filter, the covariances between the states that were not physically linked were discarded. These involved the SOC and R 0 , whose temporal evolution was not linked to the RC elements or to and among each other, and the RC elements, which were independent of each other. Hence, (8) was applied. The improved stability of this approach was investigated by [13,22].
P ^ k * : = 1 0 0 0 0 0 0 1 0 0 1 0 0 0 1 0 0 1 0 0 0 1 0 0 0 1 0 0 1 0 0 0 1 0 0 1 · P ^ k *
Algorithm 1 Extended Kalman filter.
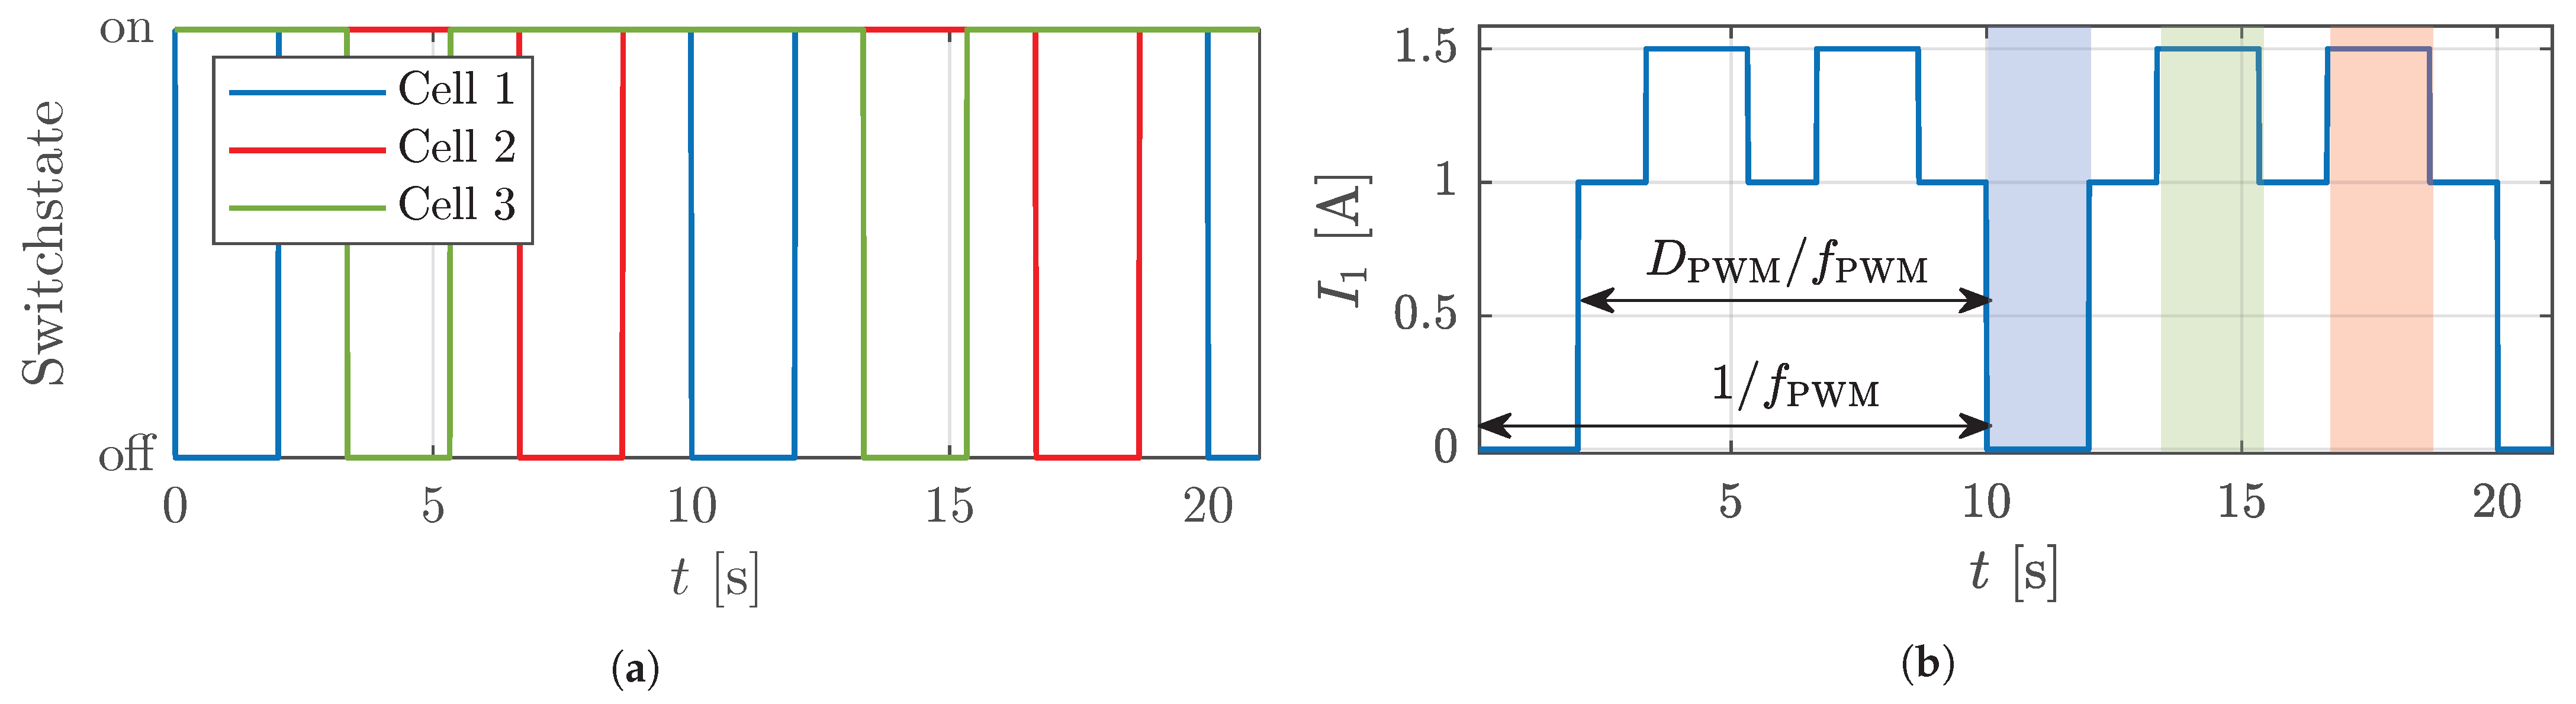
  • Initialization:
  •      x ^ 0 = E x 0 | 0
  •      P ^ 0 = E ( x ^ 0 | 0 x 0 ) ( x ^ 0 | 0 x 0 ) T
  • Prediction:
  •      A ^ = f ( x , u ) x | x = x ^ k 1 | k 1 , u = u k 1
  •      x ^ k | k 1 = f ( x ^ k 1 | k 1 , u k 1 )
  •      P ^ k | k 1 = A ^ P ^ k 1 | k 1 A ^ T + Δ t Q
  • Update:
  •      C ^ = h ( x , u ) x | x = x ^ k | k 1 , u = u k
  •      K = P ^ k | k 1 C ^ T ( C ^ P ^ k | k 1 C ^ T + R ) 1
  •      x ^ k | k = x ^ k | k 1 + K ( y k h ( x ^ k | k 1 , u k ) )
  •      P ^ k | k = ( I K C ^ ) P ^ k | k 1 ( I K C ^ ) T + K R K T

2.4. Switching

In this work, not a single cell, but a battery module consisting of three cells in parallel was investigated, whereas each cell was equipped with a switch S, as illustrated in Figure 2. The switches disconnect the corresponding cell from the module, and only the two other cells remain connected to the current load. The three switches are controlled by a PWM signal shifted by 120° to each other with the frequency f PWM and the duty cycle D PWM . To ensure a safe operation within the cell current limits, the duty cycle of the PWM signal must be greater than 66.7%, such that at least two cells are turned on at all times. Otherwise, one single cell would carry the whole current load. By sequential switching of the cells connected in parallel, they are charged and discharged nearly equally. An example of the PWM switching pattern is shown in Figure 5a for three parallel cells. The switch state “on” stands for a closed switch in which the cell is connected, whereas “off” means that the cell is disconnected. In Figure 5b, the current of Cell 1 I 1 corresponding to a constant total current is illustrated. When the switch of Cell 1 (blue in Figure 5a) is open, the cell current decreases down to 0 A, as highlighted in blue. If one of the other two cells is decoupled from the system, the current of Cell 1 increases by a factor 1.5, as highlighted in red (Cell 2 is disconnected) and green (Cell 3 is disconnected). According to the chosen f PWM and D PWM , the switching manipulates the input current of the cell and, thus, changes the system’s excitation. The time duration t off for a disconnected cell can be calculated with the following equation:
t off = ( 100 % D PWM ) 1 f PWM .

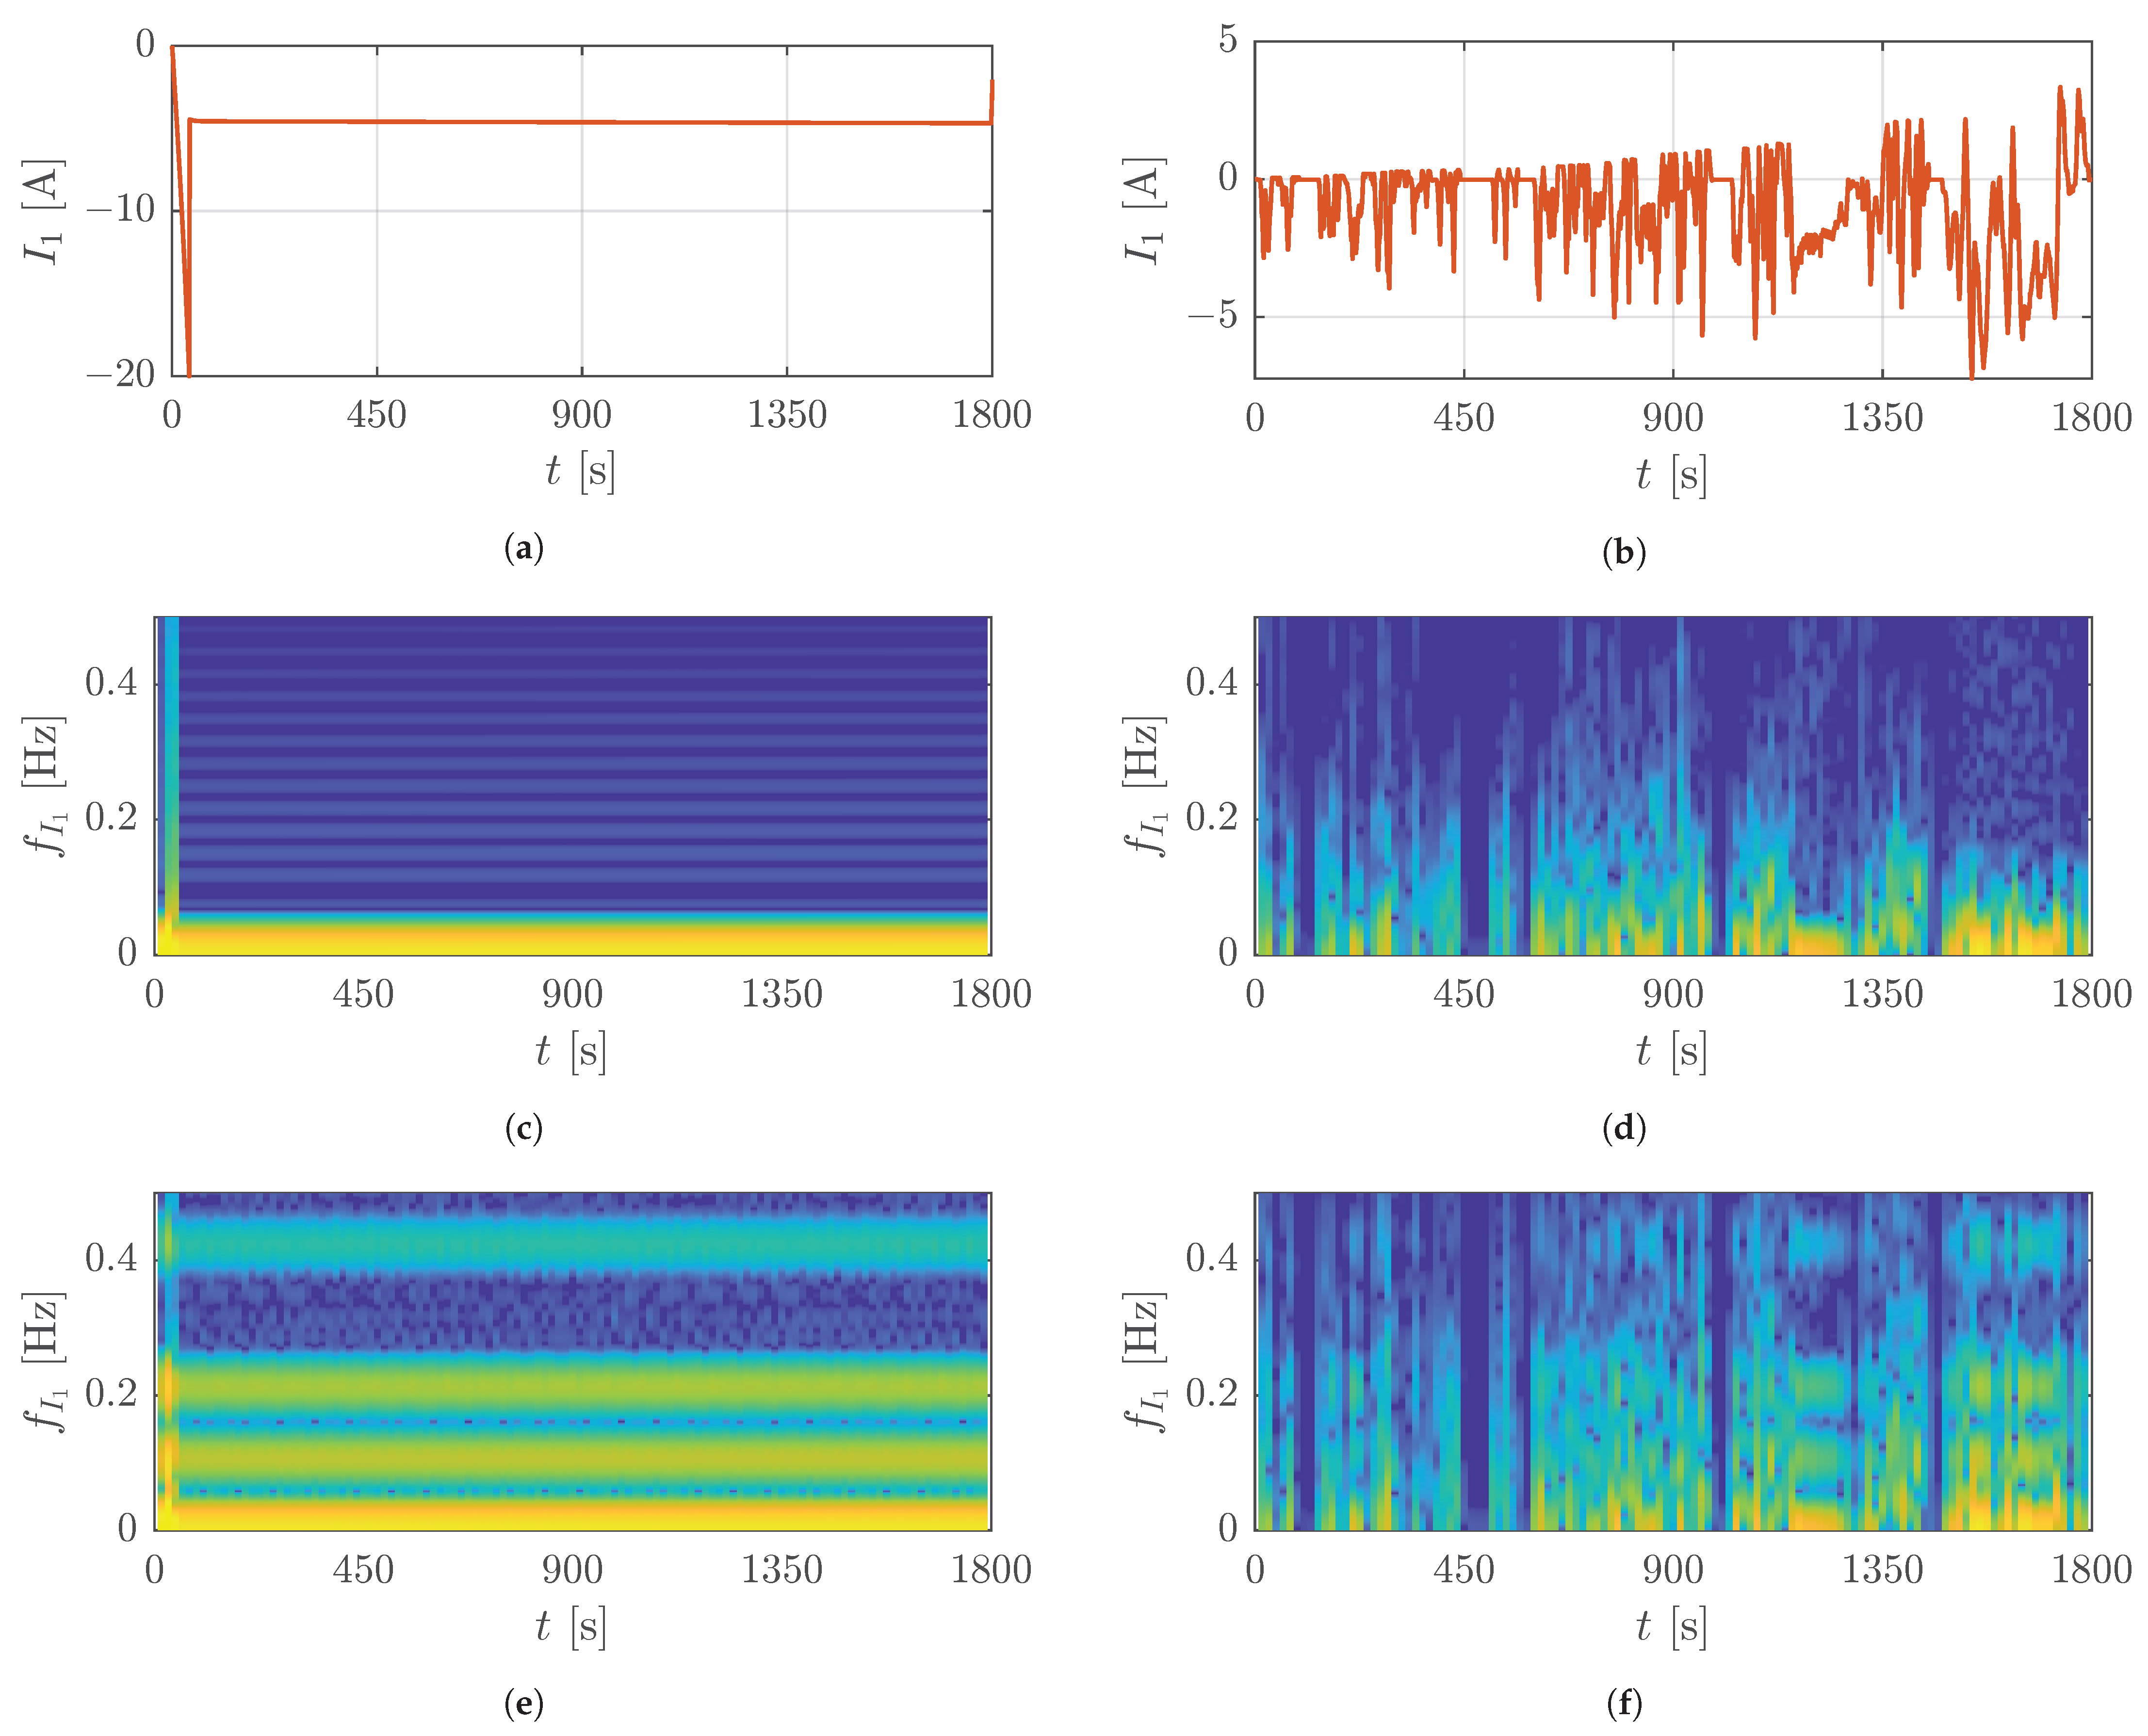
3. Input Signal Analysis

In this work, two different current profiles, each with a duration of 1800 s, were investigated. The first one was a profile based on a highway drive, shown in Figure 6a. It contains at the beginning an acceleration phase with a maximum current of 20 A. This is followed by a constant speed drive with a current between 4.6 A and 4.7 A. Therefore, the profile has a substantial dynamics only at the beginning. The second profile shown in Figure 6b is a Worldwide Harmonized Light-Duty Vehicles Test Procedure (WLTP), which includes currents between +3.3 A and 7.2 A. Furthermore, it contains phases, where the battery cell is discharged, charged, and at rest, respectively. Please note that the illustrated currents correspond to a single cell and not to the whole module.
Spectrograms were used to visualize and compare the excitation of the highway profile and the WLTP over time in the frequency space. As already mentioned, the two signals differed significantly in their dynamics, which is also visible in the corresponding frequency analysis. The spectrogram belonging to the highway profile is shown in Figure 6c. Due to its low dynamics, this profile excites the system weakly. Only in the acceleration phase, the corresponding spectrogram shows a good excitation. Afterwards, no frequencies above 0.1 Hz are excited. The spectrogram shown in Figure 6d corresponds to the WLTP, which has more dynamics and, hence, excites higher frequencies. However, in rest phases with a current of 0 A, an excitation is naturally not visible. In Figure 6e,f, the switching strategy is exemplarily applied with D PWM of 80 % and f PWM of 1.06 Hz. This led to an additional excitation at the switching frequency and at its corresponding harmonic waves. Hereby, the excitation decreased with rising harmonic wave. Furthermore, Figure 6f shows that switching at higher currents caused a stronger excitation at the corresponding frequencies than at lower currents. Since the currents were relatively low at the beginning of the WLTP cycle, switching had a small effect here. If the switching frequency was very low, the switched-off time became very high. This can even cut out the excitation completely over a certain period of time.

4. Implementation

4.1. Simulation

In the simulation study, frequencies between 3 mHz and 0.8 Hz with duty cycles of 70 % , 80 % , and 90 % were considered and compared to the passive case. Passive describes an estimation without any switching operation, which corresponds to a conventional battery system without reconfigurability. The current and voltage were modeled with a zero mean Gaussian random noise with the standard deviation of σ I = 10 mA and σ v = 5 mV, respectively, which led to a measurement noise covariance of R = σ v 2 = 2.5 · 10 4 V. The initial state covariance matrix was initialized as a diagonal matrix with
P ^ 0 | 0 = diag 0.0081 10 4 4 · 10 4 5.3 · 10 6 7.7 · 10 8 2.2 · 10 6
such that the standard deviation was approximately 10% of the corresponding true initial state or parameter value. Since the polarization voltage was initially zero, a standard deviation of 10 mV and 20 mV, respectively, was assumed. For all combinations of switching frequencies and duty cycles, 30 Monte Carlo runs were conducted. In each run, the state vector x ^ 0 | 0 was reinitialized randomly such that it had a Gaussian distribution with the true values x 0 as the mean and the covariance P ^ 0 | 0 as suggested in [23]. Furthermore, the current and the voltage noise were random in each run. The process noise was chosen from a previous work [24], where a traceable offline optimization procedure was used to avoid an arbitrary initialization via the trial-and-error principle, leading to the following parametrization:
Q = diag 10 7.8 10 8.9 10 9.2 10 6.8 10 8.8 10 7.7 .
The tuning procedure was based on a multi-objective genetic algorithm, which considers the estimation error and the filter consistency [24]. Please note that the process noise optimization was conducted for a signal without any switching operations.

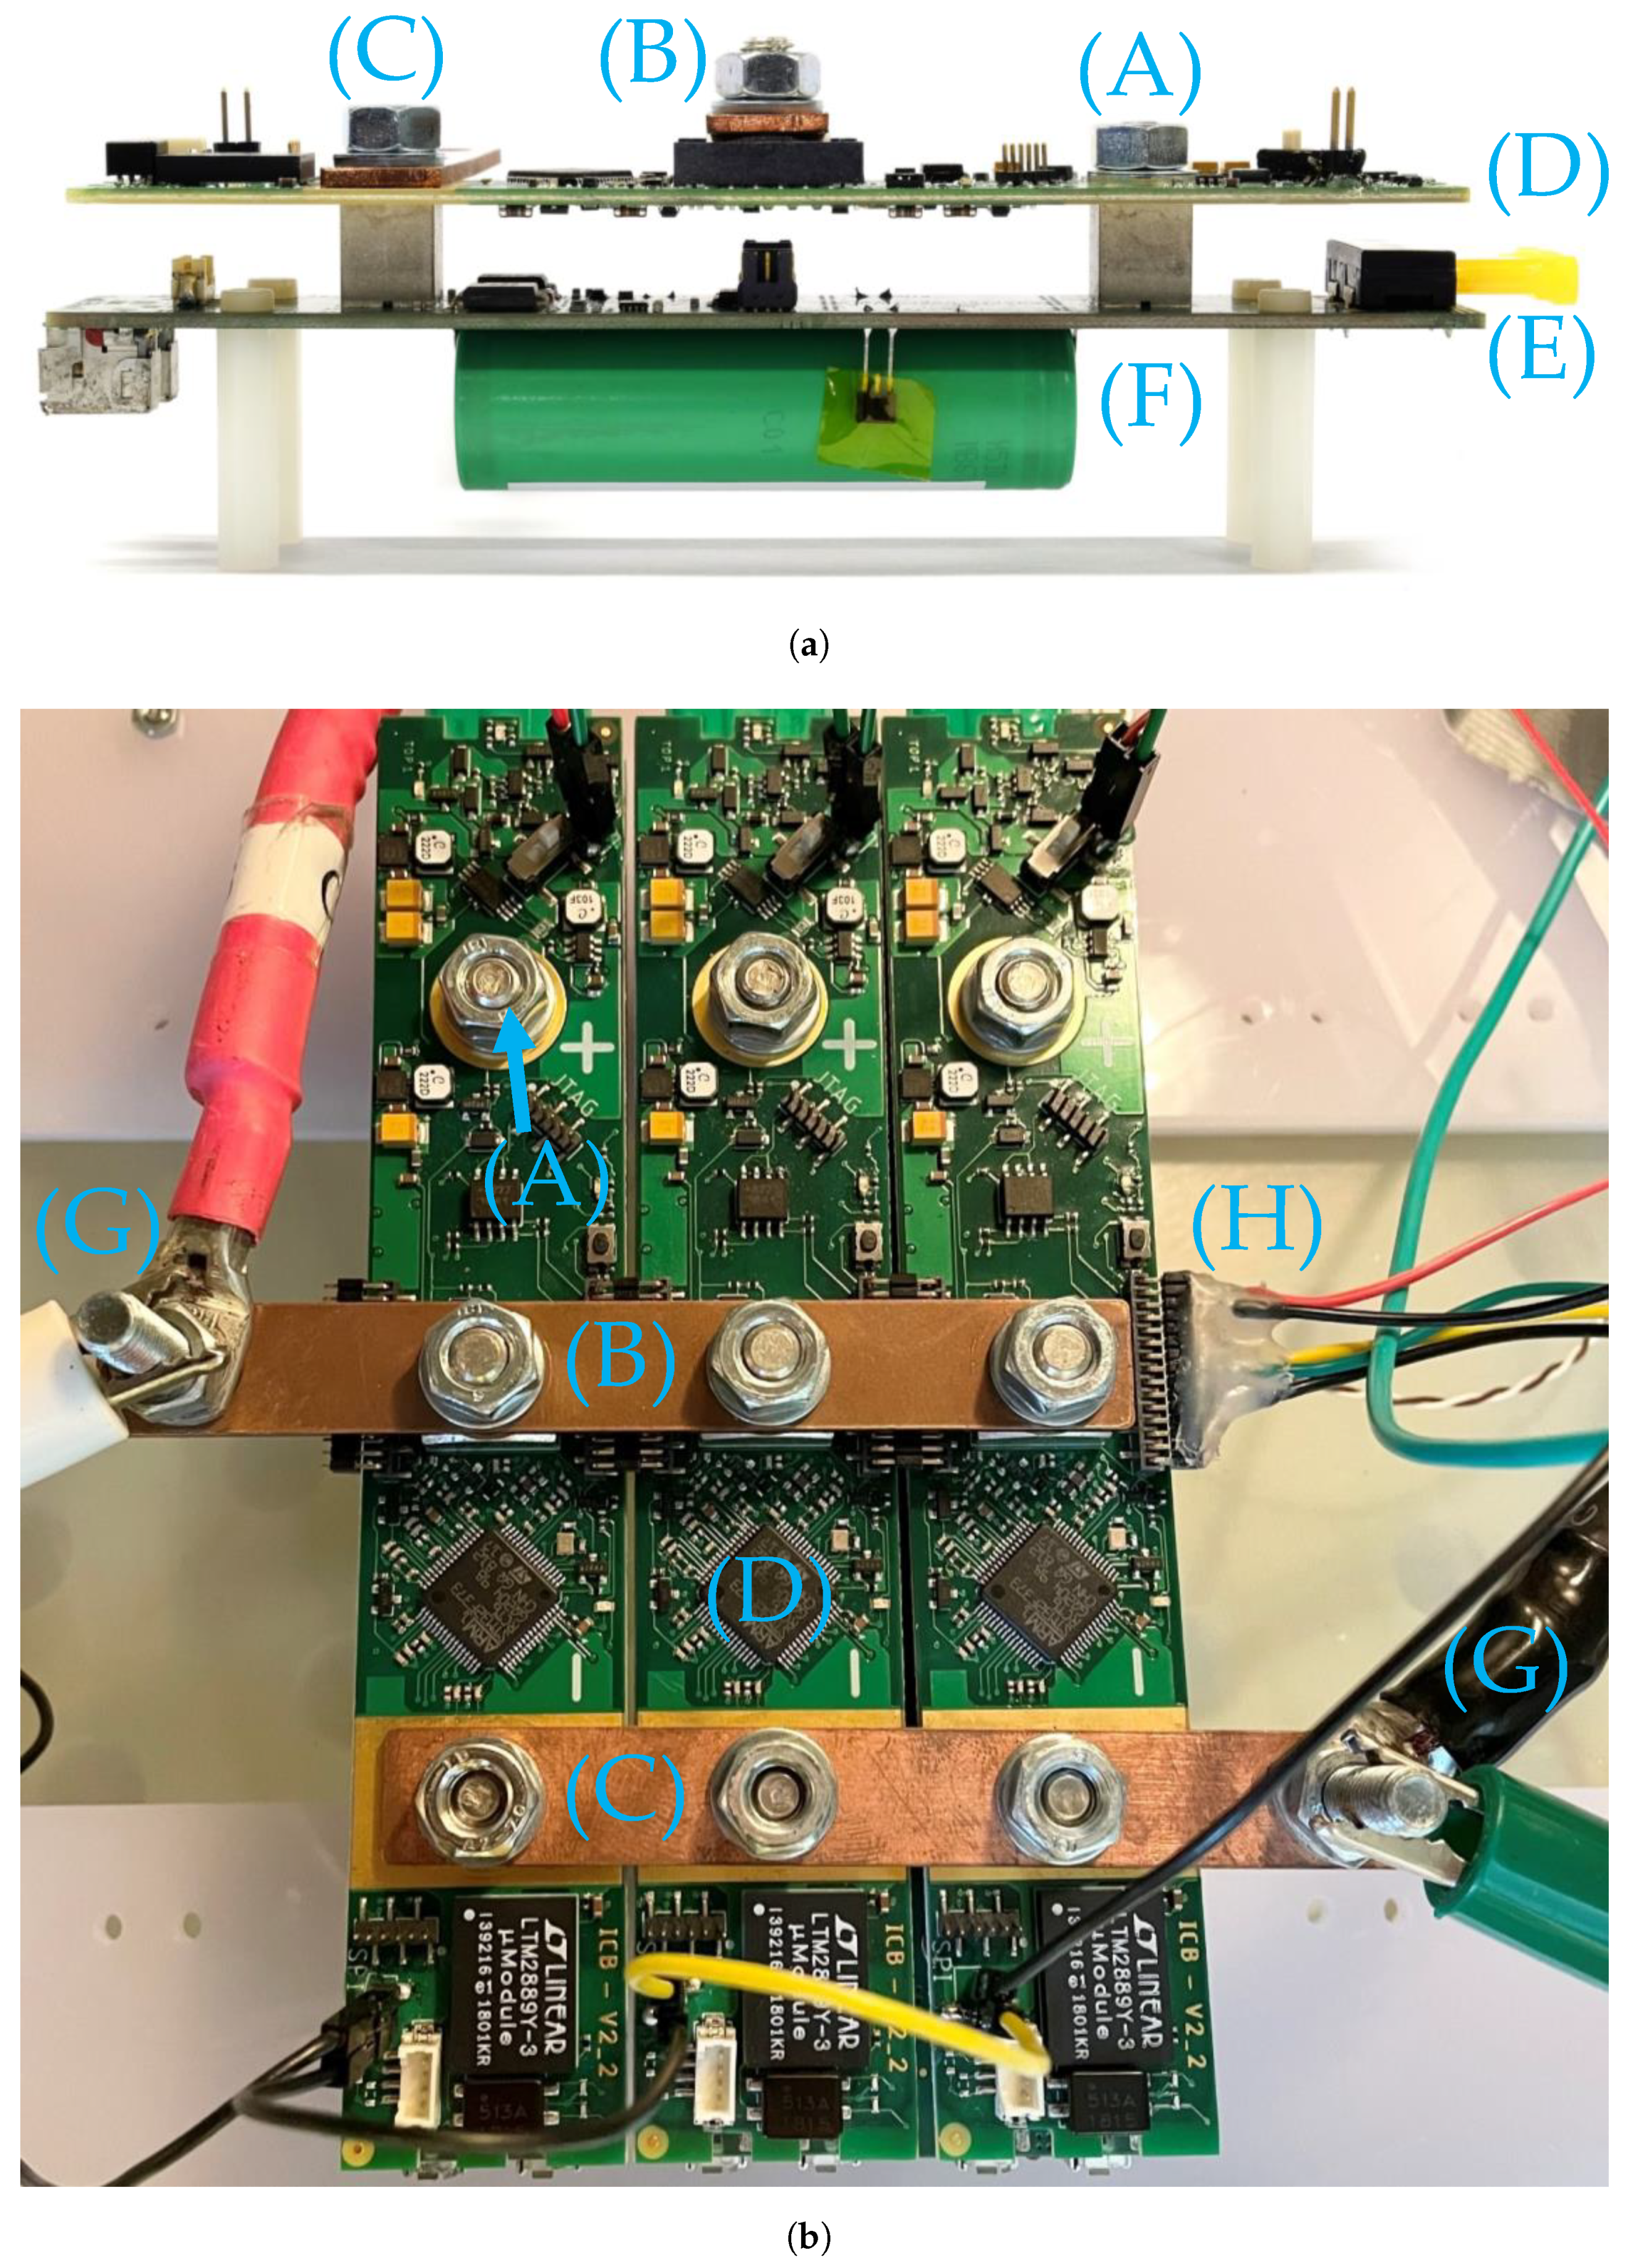
4.2. Experimental Section

To validate the findings experimentally, the lithium-ion cells characterized in Section 2.2 were soldered onto an adapter board, which was fixed to a switching board with a screw connection (see Figure 7a). The switching board had several sensors including two voltage sensors, to measure the cell voltage, as well as the switched output voltage, and a current sensor to measure the cell current. The cell plus pole and the switched plus pole were connected with a MOSFET, which corresponds to the switch S in Figure 2. The parallel connection was realized with the help of copper bus bars. They connected the switchable plus poles and the minus poles of the three cells. A PC communicated via the CAN bus with the switching boards to control the switches and acquire the measured data. The load current was applied to the three parallel cells via an Arbin LBT 5 V/ 60 A battery test bench, which also monitored the module voltage, the module current, and the temperature of the cells to ensure a safe operation. All experiments were conducted within a temperature chamber to keep the ambient temperature constant at 25 ± 2 °C. For both profiles introduced in Section 3, several PWM switching patterns with different frequencies and duty cycles were performed, however, fewer combinations than in the simulation study. The test matrix in Table 2 shows the characteristics of the applied switching patterns for both profiles.
In order to obtain comparable results, each test had a specific structure. At the beginning, the cells were fully charged with CCCV. After a 30 min rest period, they were discharged with 0.2 C to a starting SOC of approximately 90 % . After another 45 min pause, the selected current profile was applied for 1800 s and may be interrupted earlier if the discharge cut-off voltage of 2.5 V was reached.
Based on the measurement data, the state and parameter estimation was performed. Hereby, as in the simulation study, 30 Monte Carlo runs were conducted, and the sensor modulation, as well as the Kalman filter were initialized in the same way with the same values. In each Monte Carlo run, the state vector x ^ 0 | 0 was reinitialized, and the voltage and current noise was random. The process noise for the experimental case was also taken from the literature [24], optimized with a multi-objective optimization procedure based on the genetic algorithm:
Q = diag 10 7.7 10 7.7 10 6.5 10 7.2 10 8.6 10 8.1 .
Please note that, also in the experimental case, the states and parameters were determined through the described model using the measured current. The states and parameters are in reality not measurable.

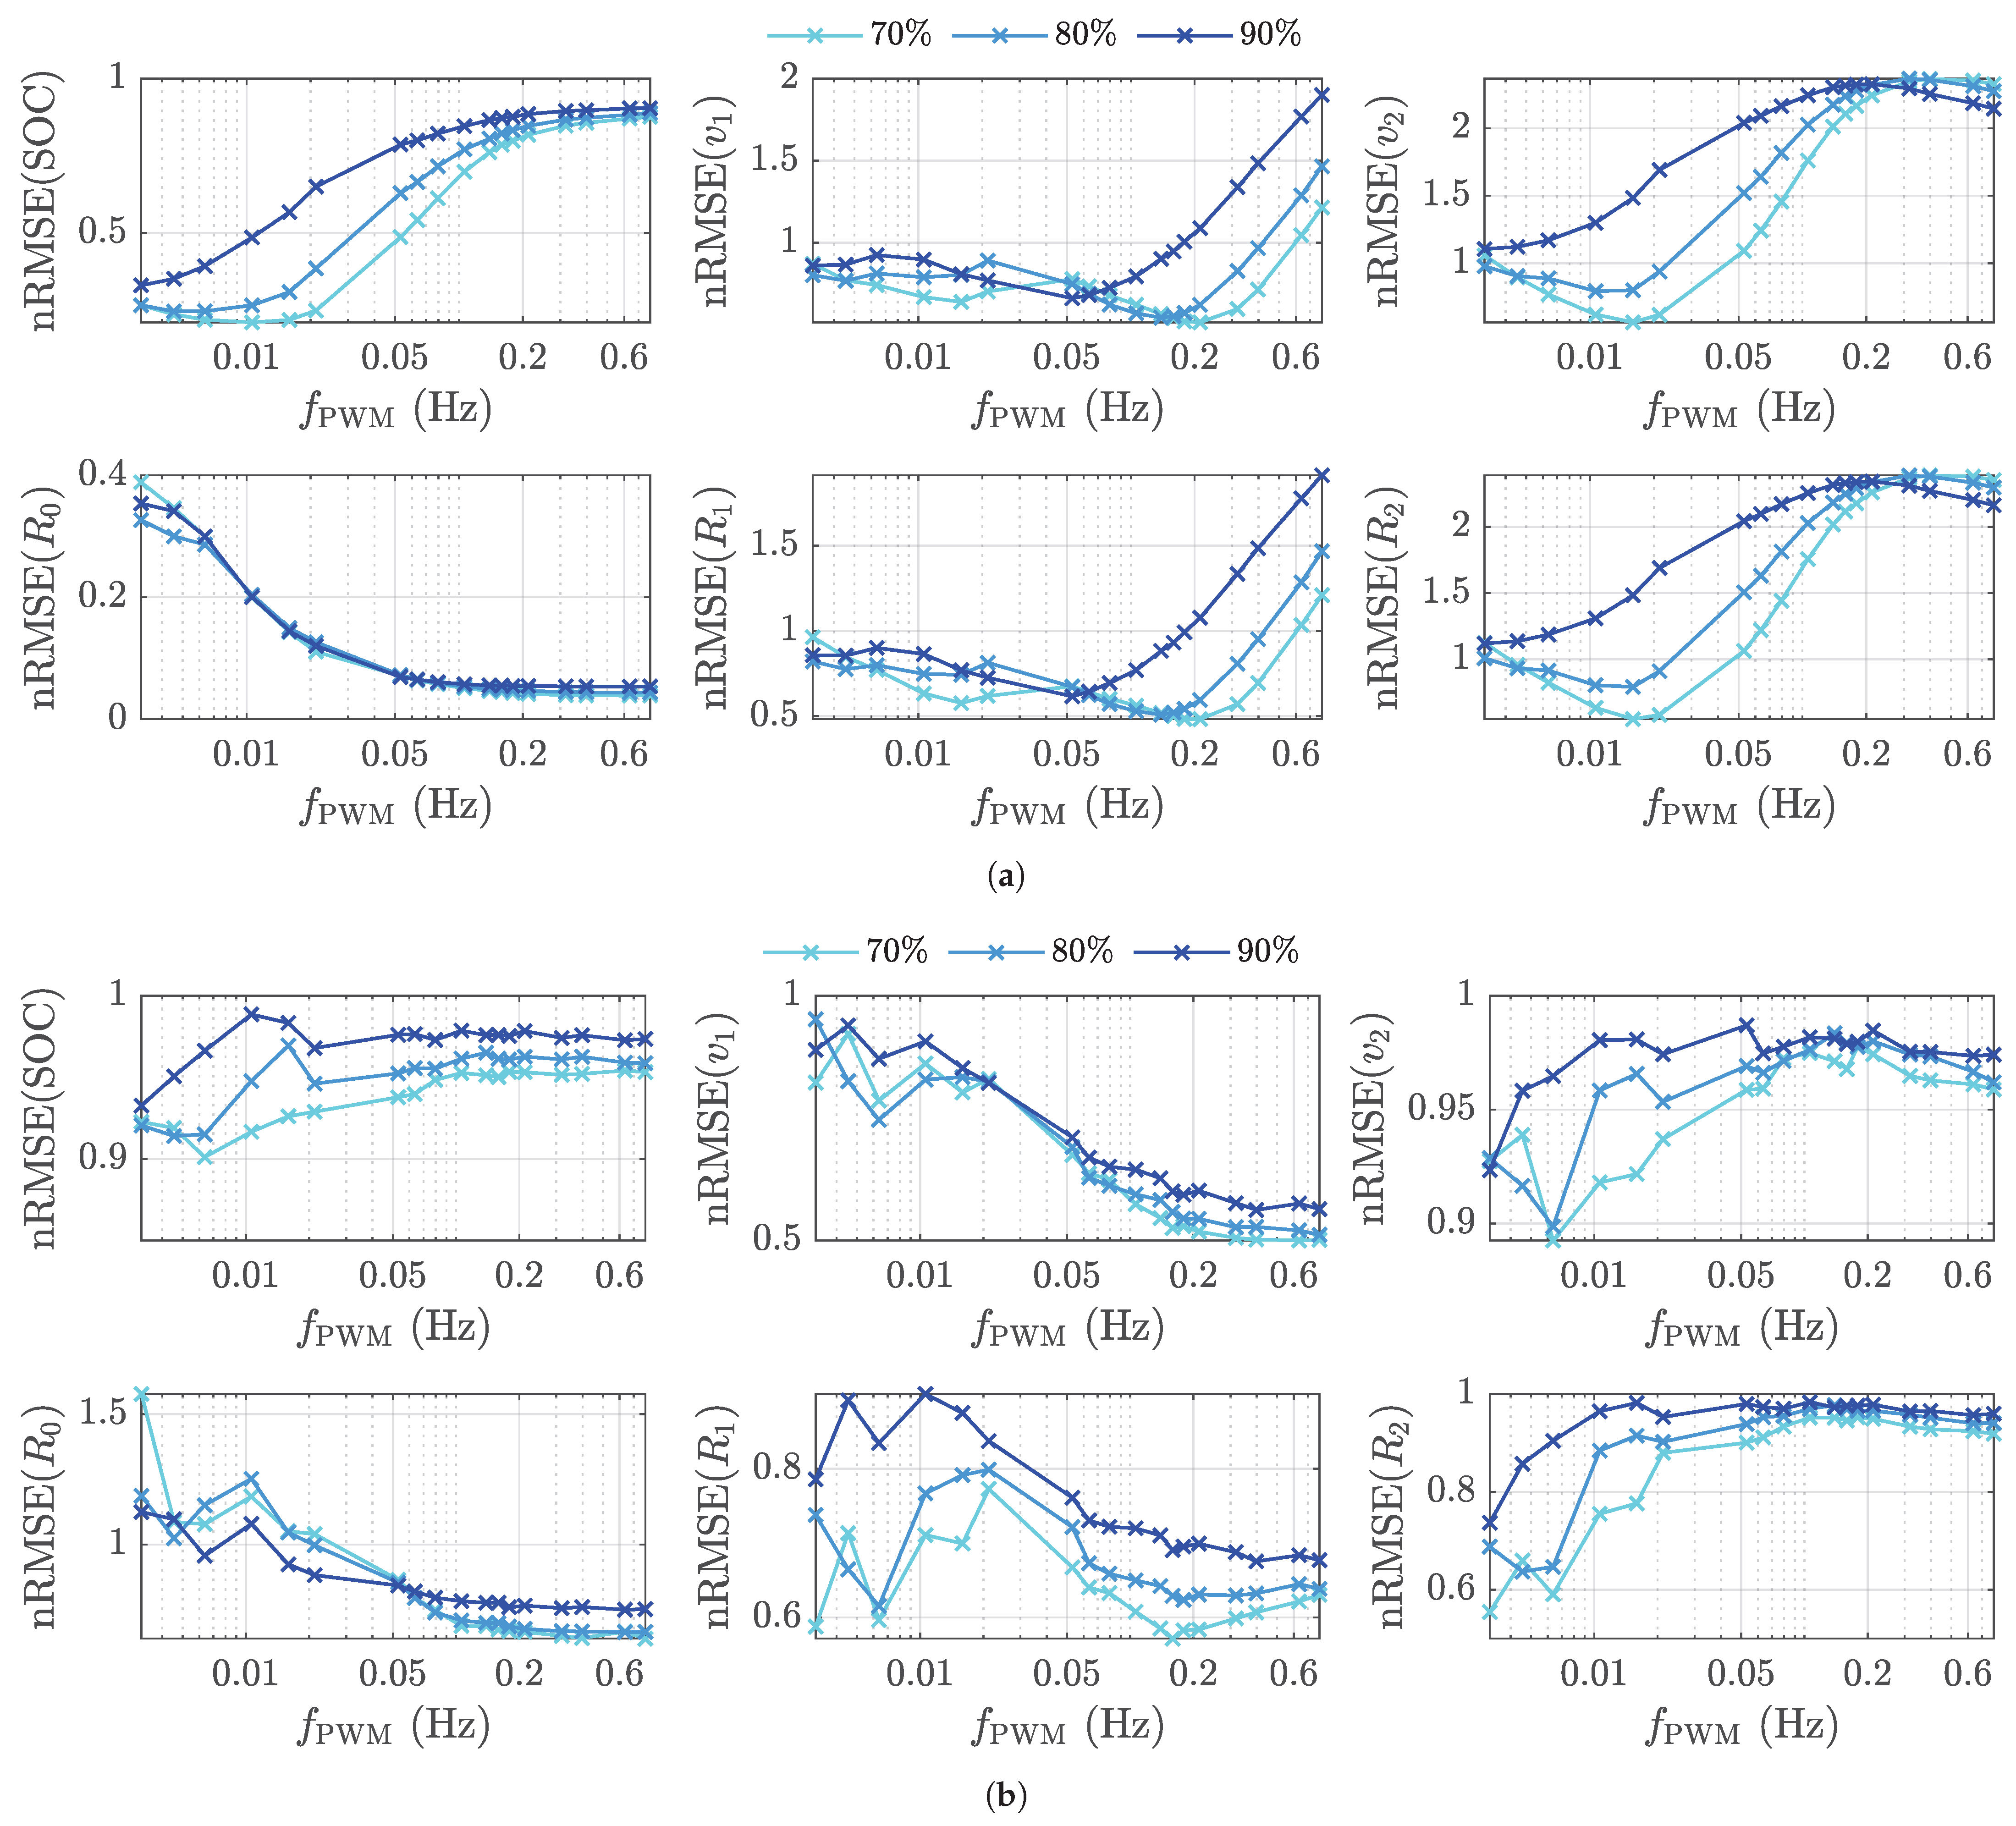
5. Results and Discussion

To evaluate the estimation results for each state and parameter x, the RMSE was calculated according to Equation (13), where K is the total number of time steps k.
RMSE = 1 K k = 1 K ( x ^ k x k ) 2
The RMSE was used because it considers stationary errors, as well as noise to the same extent as an error measure. Afterwards, the average over all Monte Carlo runs and over the three parallel cells was computed. Subsequently, the error was normalized with respect to the case without any switching operations. The resulting normalized RMSE error is denoted in the following as the nRMSE. An nRMSE less than one indicates an improvement due to the switching actions, whereas a value greater than one indicates a deterioration of the estimated result compared to the case without switching operations. Please note that we do not show the time course of the estimation algorithm in this paper. Examples of the estimation algorithm during switching operations can be found in Schneider et al. [13]. Moreover, in our study, the Kalman filter converged in all simulations and experiments.

5.1. Simulation

The simulation results are presented in Figure 8 for all estimated states and parameters for both profiles. The x-axis depicts the switching frequency logarithmically, and the y-axis displays the nRMSE. All states and parameters showed a strong dependency regarding both the frequency and the duty cycle. In the case of the highway profile, the estimation errors of the quantities related to the two RC elements ( v 1 , R 1 , v 2 , R 2 ) lowered with decreasing frequency and rose again for very low frequencies. Minima, at which the error became smallest, were formed depending on the duty cycle. At smaller duty cycles, the corresponding characteristic frequency became higher. The turn-off times for the minima t off according to Equation (9) for the first RC element were similar for all duty cycles, lying between 1.4 s and 1.9 s, and were close to τ 1 . t off for the second RC element was significantly greater and was approximately 18.9 s; however, here, there was no minimum for a duty cycle of 70% visible. Hence, the observed minimums corresponded to the fixed time constants τ 1 and τ 2 . With a switch-off time similar to the respective time constant, the corresponding RC element can provide an optimal step response. For a too high t off , the RC element went into saturation and was not further excited. By contrast, if the switch-off time was too short, the RC element was not sufficiently excited and the polarization voltage could not settle. It is notable that switching at too high frequencies can also lead to a significant deterioration compared to the estimate without switching. The SOC error is, due to (1), in a direct relationship with the error of the polarization voltages and, therefore, exhibited similar behavior. The estimation error of the internal resistance R 0 increased significantly with decreasing frequency. This is explainable by the circumstance that an ohmic resistance became visible via a current jump and the resulting voltage difference. With increasing frequency, the number of these occurring current jumps caused by the switching operations increased. This effect saturated approximately at 0.2 Hz. Furthermore, it can be generally stated that a lower duty cycle improved the estimation results for all states and parameters. A possible explanation is that a PWM signal with a duty cycle close to 50% (here: 70%) excited the harmonics of the base frequency more uniformly than a high or low duty cycle (here: 90%).
In the case of the WLTP, the spread was significantly higher, as low- or high-excitation phases of the original excitation profile were cut out occasionally depending on the instant of time, when the switching action occurred. This effect increased for lower frequencies and lower duty cycles. As for the highway profile, a small duty cycle was advantageous in most cases. The estimation errors of the SOC, v 2 , and R 2 also decreased for lower frequencies, as expected for the second RC element due to its high time constant. The first RC element, on the other hand, behaved exactly the opposite way. At frequencies of 0.05 Hz and higher, the switching operation can further improve the WLTP dynamics and estimation results. However, in the case of low frequencies, the switching action can cut out high-excited phases of the WLTP and, therefore, reduce the excitation of the first RC element. The internal resistance was the only parameter where switching with frequencies lower than 50mHz can lead to a disadvantage compared to the passive case.
Table 3 lists the best nRMSE results for each state and parameter for both profiles under all investigated frequencies and duty cycles. As can be seen, the improvements due to switching for all quantities were usually higher when using the highway profile. This was particularly evident when looking at the SOC and the internal resistance estimation. As mentioned in Section 3, the WLTP is already highly dynamic, and therefore, switching did not increase the excitation as much as when the highway profile was applied.

5.2. Experimental Results

The experimental results for the state and parameter estimation are shown in Figure 9a for the highway profile as the nRMSE. For the SOC and R 0 , a better estimation can be achieved for almost all combinations of f PWM and D PWM . For the quantities of the two RC elements, small frequencies and a high duty cycle led to a worse estimation accuracy compared to the passive case. This was especially the case for the first RC element, where switching led always to poorer results. For SOC and R 0 , great improvements were possible of up to 46 % or 78 % , respectively. In most cases, small frequencies and a duty cycle of 70 % were the favorable choice. In general, the dependencies had a similar trend to the simulated results, except for the internal resistance, since also low frequencies were able to improve the estimation further.
For the WLTP, the experimental results are shown in Figure 9b. The SOC showed neither any significant improvements, nor a high fluctuation and, furthermore, no clear trend. The internal resistance showed a great improvement of up to 49 % . The estimation of polarization voltage and the resistance of the first RC element had similar trends, and the error decreased with the frequency lowering from 0.4 Hz to 0.2 Hz. Further decreasing of the frequency seemed to have only a small effect. These results fit to the simulated highway case, but this was the opposite case of the simulated WLTP results. The estimation for the second RC element did not show any dependency regarding the duty cycle, but decreased also with lower frequencies. However, compared to the passive case, there was almost no improvement achievable.
In Table 4, the best nRMSE values of the experimental are listed. For the SOC, R 0 , v 2 , and R 2 , significantly greater improvements were possible using the highway profile. On the contrary, the switching operation was more beneficial for v 1 and R 1 using the WLTP. In summary, it still can be said that switching had a greater influence on the estimation with the highway profile than with the WLTP, which is consistent with previous results [25]. But this trend was different for the state and parameter estimation. Furthermore, the EKF trusts the individual parameters and states with dependence on the process noise covariance matrix Q . Therefore, re-parameterizing the EKF might lead to different results with other dependencies. This is why the optimal combination of f PWM and D PWM should be designed for the relevant states and parameters at hand and be adjusted when the Q matrix is changed. Since the SOC and the R 0 are usually of high importance, a good estimate should be obtained here in particular.
The simulation and experimental results showed good achievements. However, by lowering the duty cycle, the duration increased, where only two cells were connected to the load. As illustrated in Figure 5b, the cell current increased one and a half times during this period, which might lead to additional heating and aging of the cells. Therefore, the root mean square (RMS) of the cell current is calculated as the measure for the cell heating and as an important aging factor in Table 5, as suggested by [26]. It became obvious that the current RMS for both profiles rose significantly by up to 20 % as the duty cycle decreased. Hence, switching might increase the cell temperature and lead to a higher aging degradation rate. To reduce the current RMS, switching strategies can be applied to limit switching to periods with low currents or low excitation in a frequency domain, e.g., using the Goertzel algorithm [13,25]. Furthermore, in the work of Ngaleu et al. [27], the influence of switching at 50 Hz and 10 kHz on aging was investigated using the same cell type as in this paper. No increased aging was observed here, but the pulsed charging might have a positive effect on the resistance of the solid–electrolyte interphase. In summary, the authors of [27] concluded that the aging of high-power cells is not significantly affected by switching operations.

6. Conclusions

In this paper, the impact of switching operations within a reconfigurable battery system on the joint estimation of lithium-ion cell states and parameters was investigated. For this purpose, simulations and experiments were carried out with a low-excitation highway profile, on the one hand, and with a rather highly excited WLTP signal as the input, on the other. The battery system under investigation contained three parallel cells with switches for decoupling individual cells. The switches were controlled via a PWM signal, whereas in this contribution, the dependency of the estimation results regarding the frequency and duty cycle was investigated. The results showed significant improvements with respect to the estimation accuracy for the highway profile when enhancing the excitation by switching, whereas for the WLTP, the improvements were rather small. The experimental study showed good results, especially for small duty cycles and frequencies compared to the EKF estimation results without switching operations. However, an increase of the estimation error for individual states or parameters must be accepted. Furthermore, switching lead to RMS current values that might accelerate the degradation mechanism, especially for low duty cycles. Therefore, the combination of duty cycle and frequency must consider the trade-off between the importance of the estimation results for the individual states and parameters, on the one hand, and the possible increased aging, on the other hand.

Author Contributions

M.T.: methodology, software, investigation, validation, writing—original draft. D.S.: conceptualization, methodology, investigation, validation, writing—original draft, review and editing. C.E.: supervision, project administration, writing—review and editing. All authors have read and agreed to the published version of the manuscript.

Funding

This work was funded by the AUDI AG within the scope of an ongoing research project. Furthermore, we acknowledge support by the Open Access Publication Fund of Technische Hochschule Ingolstadt.

Data Availability Statement

Not applicable.

Acknowledgments

Special thanks are given to the support by M. Lewerenz for revising this work and M. Hinterberger for valuable discussions. Additionally, we thank C. Hartmann and C. Hanzl for providing the software and developing the hardware components, which were used for the experimental investigation.

Conflicts of Interest

The authors declare no conflict of interest.

Abbreviations

BEVBattery electric vehicle
BMSBattery management system
CCCVConstant current/constant voltage
DSTDynamic stress test
ECMEquivalent circuit model
EKFExtended Kalman filter
HPPCHybrid pulse power characterization
nRMSENormalized root-mean-squared error
OCVOpen-circuit voltage
PRBSPseudo-random binary sequence
PWMPulse-width modulation
RBSReconfigurable battery system
RCResistor–capacitor
RMSRoot mean square
RMSERoot-mean-squared error
SISOSingle-input, single-output
SOCState of charge
SOHState of health
UDDSUrban Dynamometer Driving Schedule
WLTPWorldwide Harmonized Light-Duty Vehicles Test Procedure
Nomenclature
A State-space system matrix
B State-space input matrix
C 1 / 2 Capacity of the RC elements (F)
C State-space output matrix
DState-space feed-through scalar
D P W M Duty cycle of the PWM signal (%)
fNonlinear system function
f P W M Frequency of the PWM signal (Hz)
hNonlinear measurement function
ICell current (A)
I Identity matrix
kTime step
KNumber of time steps
K Kalman gain
P State covariance matrix
q Process noise
Q Process noise covariance matrix
rMeasurement noise
RMeasurement noise covariance
R 0 Internal resistance ( Ω )
R 1 / 2 Resistance of the RC elements ( Ω )
SSwitch
SOCState of charge (%)
t o f f Time the cell is disconnected (s)
uState-space input
vTerminal voltage (V)
v 1 / 2 Voltage of the RC elements (V)
v OCV Open circuit voltage (V)
w State-space parameter vector
x State-space state vector
y State-space measurement
Δ t Step size (s)
η Coulombic efficiency
σ I Standard deviation of the current (A)
σ v Standard deviation of the voltage (V)
τ 1 / 2 Time constant of the RC elements (s)
R Real numbers
E · Expectation
diag { · } Diagonal matrix
· T Transpose
· ^ Estimation

References

  1. Lu, L.; Han, X.; Li, J.; Hua, J.; Ouyang, M. A review on the key issues for lithium-ion battery management in electric vehicles. J. Power Sources 2013, 226, 272–288. [Google Scholar] [CrossRef]
  2. Zhang, J.; Lee, J. A review on prognostics and health monitoring of Li-ion battery. J. Power Sources 2011, 196, 6007–6014. [Google Scholar] [CrossRef]
  3. Berecibar, M.; Gandiaga, I.; Villarreal, I.; Omar, N.; van Mierlo, J.; van den Bossche, P. Critical review of state of health estimation methods of Li-ion batteries for real applications. Renew. Sustain. Energy Rev. 2016, 56, 572–587. [Google Scholar] [CrossRef]
  4. Rivera-Barrera, J.; Muñoz-Galeano, N.; Sarmiento-Maldonado, H. SoC Estimation for Lithium-ion Batteries: Review and Future Challenges. Electronics 2017, 6, 102. [Google Scholar] [CrossRef] [Green Version]
  5. Adaikkappan, M.; Sathiyamoorthy, N. Modeling, state of charge estimation, and charging of lithium–ion battery in electric vehicle: A review. Int. J. Energy Res. 2021, 46, 2141–2165. [Google Scholar] [CrossRef]
  6. Wang, Q.; Kang, J.; Tan, Z.; Luo, M. An online method to simultaneously identify the parameters and estimate states for lithium ion batteries. Electrochim. Acta 2018, 289, 376–388. [Google Scholar] [CrossRef]
  7. Wang, S.L.; Fernandez, C.; Cao, W.; Zou, C.Y.; Yu, C.M.; Li, X.X. An adaptive working state iterative calculation method of the power battery by using the improved Kalman filtering algorithm and considering the relaxation effect. J. Power Sources 2019, 428, 67–75. [Google Scholar] [CrossRef]
  8. Yang, R.; Xiong, R.; He, H.; Mu, H.; Wang, C. A novel method on estimating the degradation and state of charge of lithium-ion batteries used for electrical vehicles. Appl. Energy 2017, 207, 336–345. [Google Scholar] [CrossRef]
  9. Tian, Y.; Lai, R.; Li, X.; Xiang, L.; Tian, J. A combined method for state-of-charge estimation for lithium-ion batteries using a long short-term memory network and an adaptive cubature Kalman filter. Appl. Energy 2020, 265, 114789. [Google Scholar] [CrossRef]
  10. Plett, G.L. Extended Kalman filtering for battery management systems of LiPB-based HEV battery packs: Part 2. Modeling and identification. J. Power Sources 2004, 134, 262–276. [Google Scholar] [CrossRef]
  11. Kim, I.S. The novel state of charge estimation method for lithium battery using sliding mode observer. J. Power Sources 2006, 163, 584–590. [Google Scholar] [CrossRef]
  12. Meng, J.; Boukhnifer, M.; Diallo, D.; Wang, T. A New Cascaded Framework for Lithium-Ion Battery State and Parameter Estimation. Appl. Sci. 2020, 10, 1009. [Google Scholar] [CrossRef] [Green Version]
  13. Schneider, D.; Liebhart, B.; Endisch, C. Active state and parameter estimation as part of intelligent battery systems. J. Energy Storage 2021, 39, 102638. [Google Scholar] [CrossRef]
  14. Nejad, S.; Gladwin, D.T.; Stone, D.A. A hybrid battery parameter identification concept for lithium-ion energy storage applications. In Proceedings of the IECON 2016-42nd Annual Conference of the IEEE Industrial Electronics Society, Florence, Italy, 23–26 October 2016; pp. 1980–1985. [Google Scholar] [CrossRef] [Green Version]
  15. Wei, Z.; Zhao, J.; He, H.; Ding, G.; Cui, H.; Liu, L. Future smart battery and management: Advanced sensing from external to embedded multi-dimensional measurement. J. Power Sources 2021, 489, 229462. [Google Scholar] [CrossRef]
  16. Komsiyska, L.; Buchberger, T.; Diehl, S.; Ehrensberger, M.; Hanzl, C.; Hartmann, C.; Hölzle, M.; Kleiner, J.; Lewerenz, M.; Liebhart, B.; et al. Critical Review of Intelligent Battery Systems: Challenges, Implementation and Potential for Electric Vehicles. Energies 2021, 14, 5989. [Google Scholar] [CrossRef]
  17. Bouchhima, N.; Schnierle, M.; Schulte, S.; Birke, K.P. Active model-based balancing strategy for self-reconfigurable batteries. J. Power Sources 2016, 322, 129–137. [Google Scholar] [CrossRef]
  18. Schmid, M.; Gebauer, E.; Hanzl, C.; Endisch, C. Active Model-Based Fault Diagnosis in Reconfigurable Battery Systems. IEEE Trans. Power Electron. 2021, 36, 2584–2597. [Google Scholar] [CrossRef]
  19. Rodriguez, J.; Lai, J.S.; Peng, F.Z. Multilevel inverters: A survey of topologies, controls, and applications. IEEE Trans. Ind. Electron. 2002, 49, 724–738. [Google Scholar] [CrossRef] [Green Version]
  20. Lain, M.J.; Brandon, J.; Kendrick, E. Design Strategies for High Power vs. High Energy Lithium Ion Cells. Batteries 2019, 5, 64. [Google Scholar] [CrossRef] [Green Version]
  21. Schmid, M.; Vögele, U.; Endisch, C. A novel matrix-vector-based framework for modeling and simulation of electric vehicle battery packs. J. Energy Storage 2020, 32, 101736. [Google Scholar] [CrossRef]
  22. Yang, J.; Xia, B.; Shang, Y.; Huang, W.; Mi, C.C. Adaptive State-of-Charge Estimation Based on a Split Battery Model for Electric Vehicle Applications. IEEE Trans. Veh. Technol. 2017, 66, 10889–10898. [Google Scholar] [CrossRef]
  23. Bar-Shalom, Y.; Li, X.R.; Kirubarajan, T. Estimation with Applications to Tracking and Navigation: Theory Algorithms and Software; John Wiley & Sons, Inc.: New York, NY, USA, 2001. [Google Scholar] [CrossRef]
  24. Theiler, M.; Schneider, D.; Endisch, C. Kalman Filter Tuning Using Multi-Objective Genetic Algorithm for State and Parameter Estimation of Lithium-Ion Cells. Batteries 2022, 8, 104. [Google Scholar] [CrossRef]
  25. Schneider, D.; Liebhart, B.; Endisch, C.; Kennel, R. Enhanced State and Parameter Estimation within Reconfigurable Battery Systems for Electric Vehicles. In Proceedings of the 2022 12th International Conference on Power, Energy and Electrical Engineering (CPEEE), Shiga, Japan, 25–27 February 2022; IEEE: Piscataway, NJ, USA, 2022; pp. 71–77. [Google Scholar] [CrossRef]
  26. Juang, L.W.; Kollmeyer, P.J.; Anders, A.E.; Jahns, T.M.; Lorenz, R.D.; Gao, D. Investigation of the influence of superimposed AC current on lithium-ion battery aging using statistical design of experiments. J. Energy Storage 2017, 11, 93–103. [Google Scholar] [CrossRef]
  27. Ngaleu, G.; Theiler, M.; Straßer, X.; Hanzl, C.; Komsiyska, L.; Endisch, C.; Lewerenz, M. Influence of Switching on the Aging of High Power Lithium-Ion Cells. Batteries 2022, 8, 33. [Google Scholar] [CrossRef]
Figure 1. Illustration of the methodology and reference to the respective sections in which the individual blocks are dealt with.
Batteries 09 00145 g001
Figure 2. ECM of the battery with two RC elements and a switch.
Batteries 09 00145 g002
Figure 3. Illustration of the 1 s and 20 s pulse test used to characterize all resistances in the ECM.
Batteries 09 00145 g003
Figure 4. Cell characterization results for the (a) OCV, (b) R 0 , (c) R 1 , and (d) R 2 over the entire SOC range.
Batteries 09 00145 g004
Figure 5. Illustration of (a) the switching pattern and (b) switching current.
Batteries 09 00145 g005
Figure 6. Illustration of the (a) highway profile, (b) WLTP cycle, the corresponding spectrograms in (c,d), and the spectrogram with a switching frequency of 1.06 Hz and an 80 % duty cycle in (e,f).
Batteries 09 00145 g006
Figure 7. Experimental setup shown from (a) the side and (b) the top. (A) is the cell plus pole, (B) the switchable cell plus pole, (C) the minus pole, (D) the switching board with sensors and switches, (E) the adapter board, and (F) the lithium-ion cell. The cell is soldered on the adapter board. The current is applied via (G) the connection cable to the Arbin test system, and the communication takes place via (H) a CAN bus connection.
Batteries 09 00145 g007
Figure 8. Simulative results for (a) the highway profile and (b) the WLTP, whereas all RMSE values are normalized with respect to the passive case. The results are shown for three different duty cycles ( 70 % , 80 % , and 90 % ) and for frequencies between 0.005 Hz and 0.8 Hz. The x-axis is scaled logarithmically.
Batteries 09 00145 g008
Figure 9. Experimental results for (a) the highway profile and (b) the WLTP, whereas all RMSE values are normalized with respect to the passive case. The results are shown for three different duty cycles ( 70 % , 80 % , and 90 % ) and for frequencies between 0.005 Hz and 0.4 Hz. The x-axis is scaled logarithmically.
Batteries 09 00145 g009
Table 1. Specification of the used lithium-ion cell.
ManufacturerSamsung
TypeINR18650-25R
Format18650
ChemistryNCA/graphite
Charge cut-off voltage 4.2 V
Discharge cut-off voltage 2.5 V
Maximum constant charge current 4 A
Maximum constant discharge current 20 A
Nominal voltage 3.6 V
Nominal capacity @ 0.2 C 2.5 Ah
Energy density216 Wh/kg
Power density1.7 kW/kg
Table 2. Test matrix for the highway profile (×) and the WLTP (∘).
D PWM 70 % 80 % 90 %
f PWM
400 mHz×∘××∘
318 mHz×∘ ×
212 mHz×∘×∘×∘
106 mHz×∘ ×
53 mHz×∘××∘
Table 3. Minimal nRMSE achieved for the WLTP and the highway profile for each estimated state and parameter in the simulation study.
QuantitySOC v 1 v 2 R 0 R 1 R 2
WLTP0.900.500.890.640.570.55
Highway0.210.510.560.040.480.55
Table 4. Minimal nRMSE achieved for the WLTP and the highway profile for each estimated state and parameter in the experimental study.
QuantitySOC v 1 v 2 R 0 R 1 R 2
WLTP0.990.371.130.510.320.98
Highway0.541.170.380.221.100.36
Table 5. Mean current RMS for different duty cycles with a switching frequency of 212 mHz.
D PWM Passive 90 % 80 % 70 %
WLTP 1.859 A 1.989 A 2.114 A 2.237 A
Highway 4.864 A 5.200 A 5.533 A 5.852 A
Disclaimer/Publisher’s Note: The statements, opinions and data contained in all publications are solely those of the individual author(s) and contributor(s) and not of MDPI and/or the editor(s). MDPI and/or the editor(s) disclaim responsibility for any injury to people or property resulting from any ideas, methods, instructions or products referred to in the content.

