Article

Electrochemical Modelling of Na-MCl2 Battery Cells Based on an Expanded Approximation Method

1
Fraunhofer Institute for Ceramic Technologies and Systems IKTS, Lilienthalplatz 1, 38108 Braunschweig, Germany
2
Institute of Materials Science, Technische Universität Dresden, 01069 Dresden, Germany
3
Fraunhofer Project Center for Energy Storage and Systems ZESS, 38108 Braunschweig, Germany
4
Fraunhofer Institute for Surface Engineering and Thin Films, IST, Bienroder Weg 54E, 38108 Braunschweig, Germany
5
Fraunhofer Institute for Ceramic Technologies and Systems IKTS, Winterbergstraße 28, 01277 Dresden, Germany
*
Author to whom correspondence should be addressed.
Batteries 2023, 9(4), 200; https://doi.org/10.3390/batteries9040200
Submission received: 9 January 2023 / Revised: 17 March 2023 / Accepted: 22 March 2023 / Published: 28 March 2023

Abstract

:
Battery models are mathematical systems that aim to simulate real battery cell sufficiently accurately. Finding a comprise between complexity, computational effort and accuracy is thereby key. In particular, modelling sodium–nickel–chloride/iron-chloride cells (Na- N i C l 2 / F e C l 2 ), as a promising alternative for stationary energy storage, bears some challenges. The literature shows a few interesting approaches, but in most of them the second active material ( N i C l 2 or F e C l 2 ) or the entire discharging/charging cycle is not considered. In this work, an electrochemical and thermal model of Na- N i C l 2 / F e C l 2 battery cells is presented. Based on an equivalent circuit approach combined with electrochemical calculations, the hybrid model provides information on the performance of the cell for charging and discharging with a constant current. By dividing the cathode space into segments, internal material and charge flows are predicted, allowing important insights into the internal cell processes. Besides a low calculation effort, the model also allows a flexible adaption of cathode composition and cell design, which makes it a promising tool for the development of single battery cells as well as battery modules and battery systems.

1. Introduction

The significance of modelling battery behaviour is present in different stages of development. Besides being a supporting tool for cell design, models can be used during operation to determine critical battery parameters, such as state of charge (SoC) and state of health (SoH), or even for power output predictions [1,2]. Different approaches, distinguished by their complexity, have already been used to predict electrochemical cell behaviour. A commonly used approach is the “Thevenin circuit model”, a combination of series-connected resistor–capacitor circuits (RC elements) which reproduce the output voltage of the cell during load and relaxation at reduced computational and implementation expense. However, cell parameters must be carefully designed to ensure a precise modelling output. A different and more accurate method is provided by electrochemical modelling approaches using non-linear differential equations to describe the ongoing chemical reactions. The advantage of these methods over the Thevenin circuit model is the level of detail. Besides the output voltage of the cell, internal cell processes can also be simulated. A third approach is “Black box modelling” using machine learning (ML) and artificial intelligence (AI). Here, a wide dataset must be generated and the ML and AI models need to be trained with data. More details and an extensive discussion on the mentioned modelling approaches are given by Tamilselvi et al. [1], Boi et al. [3] and Li et al. [4]. In particular, for application-related modelling and the development of cells in battery structures such as modules or battery systems, less complex modelling with RC elements is preferred. However, a trade-off between a low computational effort and the detail of prediction needs to be found.
In this work, electrochemical and thermal models of sodium–nickel–chloride/iron-chloride (Na- M C l 2 ) battery cells is presented. Sodium–nickel–chloride/iron-chloride battery cells are a promising alternative to lithium-ion cells, in particular for large-scale stationary applications [5,6,7]. Figure 1 shows a scheme of the cell design. The anode, consisting of liquid sodium, is separated from the porous cathode by a solid electrolyte (Na- β " alumina). The cell operates between 250 C and 350 C to establish ion transportation through Na- β " alumina. A secondary molten salt electrolyte (tetrachloroaluminate, N a A l C l 4 ) ensures the ionic conductivity in the porous cathode space. The solid part of the cathode consists of iron chloride and nickel chloride ( F e C l 2 and N i C l 2 ), which serve as active materials, as well as solid N a C l , as a product of the discharging reaction. Additionally, an excess of iron and nickel metals ensures electron transport towards the current collector. The current collector, as well as the entire casing, is made of nickel. For each active material ( N i C l 2 and F e C l 2 ) there is a corresponding reaction. As indicated in Equations (1) and (2), these two reactions exhibit different equilibrium voltage levels ( E O C V , M with M = N i o r F e ), enabling the battery cell to cope with higher current peaks [8,9].
N i C l 2 + 2 N a N i + 2 N a C l
E O C V , N i = 2.58 V
F e C l 2 + 2 N a F e + 2 N a C l
E O C V , F e = 2.35 V
The cell type of Na- M C l 2 batteries stands out, as it contains readily available and eco-friendly substances, especially compared to lithium-ion batteries. The active materials are neither flammable nor explosive. Importantly, there is no occurrence of safety-critical cell states during operation or in case of cell failure. Another advantage of the Na- M C l 2 technology is the high cycle life capability [10], which makes it even more suitable for long-term use cases. Despite these advantages, major gaps between the ongoing research and the industrial relevance and applications still need to be overcome. Here, modelling can be a powerful tool for resource-efficient development. Within the field of Ni- M C l 2 cells, models can help to improve cell performance by optimizing the cathode formulation or dimensioning.
Electrochemical models of Na- M C l 2 cells documented in the literature date back to the 1990s. Table 1 shows a detailed literature overview of mathematical/chemical model approaches. These models were analysed by their operational scenario, used cell chemistry and considered physical processes, e.g., heat formation. Sudoh and Newman [11] developed a mathematical model focusing on the porous cathode using the theory of transport processes inside binary molten salts by Pollard and Newman [12]. The cell model implemented iron chloride as a single active material and no experimental work was performed to validate the numerical outcome. Further developments of this work, such as the one by Eroglu and West [13], take the solubility of F e C l 2 into consideration, which was assumed to be constant by Sudoh and Newman. Another approach based on the work of Sudoh and Newman was performed by Christin [14]. By extending the work to a 2D simulation, Christin also investigated the thermal behaviour of the cell, considering both the active materials N i C l 2 and F e C l 2 . Additionally, he was able to reduce the complexity of Sudoh et al.’s assumptions, while retaining comparability to the experimental data. An even more straightforward approach was presented by Orchard and Weaving [15]. Their equivalent circuit model (EC model) divides the cathode compartment into segments of equal size. By using a combination of Ohm’s law and electrochemical kinetics, the electrical behaviour and material balances for each segment is calculated. The simple procedure and cell division ensures a small number of equations resulting in a short calculation time, while a good agreement with the experimental data was achieved. However, Orchards and Weavings’ work is not intended for modern Na- M C l 2 cells. Besides the consideration of a single active species (Na- F e C l 2 ), the model represents the discharging process but not the entire cycle, including charging. Furthermore, heat generation is not included, which needs to be taken into account for battery system designs. Moreover, a planar cell design is considered. In summary, the work of Orchard and Weaving shows that the combination of EC models and electrochemical mathematical laws can be a powerful tool for the straightforward, model-based development of battery cells. In recent studies, this approach has already been applied successfully in the field of lithium-ion batteries, albeit in a more complex structure [16,17,18].
The aim of this work is to develop a model representing all relevant cell processes with a small calculation effort. In addition to the implementation of the second reactions (Equations (1) and (2)), the model should be capable of representing the charging and discharging of a Na- M C l 2 cell with cylindrical geometry. With the advantages described above, the approximation approach of Orchard and Weaving [15] will serve as a basis for the presented model, while the requirements of a cell working with both active materials will be addressed.

2. Model Development

The following section describes the major steps of the model development and the implementation itself. Table 2 shows a full list of the used symbols.
The reactions in Equations (1) and (2) are balanced for a given equilibrium voltage, also called the open circuit voltage ( E O C V ). The respective E O C V for the nickel and iron reactions can be calculated according to Equation (3). Here, the Gibb’s free energy ( Δ G ) represents the convertible amount of chemical energy into electrical energy.
E O C V = Δ G z F
with
F : Faraday constant
z : numbers of electrons transferred in electrode reaction
While discharging the battery cell, electrons flow across the load, corresponding to the discharge current (I). The amount of electrons is directly proportional to the reaction rate. To overcome reaction and transport resistances, an additional amount of electrical energy is required, which is expressed with the so-called overpotential, η . More precisely, the overpotential is the amount by which the cell voltage (E) deviates from the equilibrium voltage ( E O C V ). Therefore, the overall cell voltage can be written as
E = E O C V η
The overpotential ( η ) can be distinguished into two main parts:
1.
Ohmic drop due to electronic and ionic conducting structures, e.g., separator and current collector.
2.
Electrode losses/electrode overpotential: Combines electrode processes such as transport processes and charge transfer kinetics.
Equation (4) can be rewritten as
E = E O C V I R o h m i c η c η a
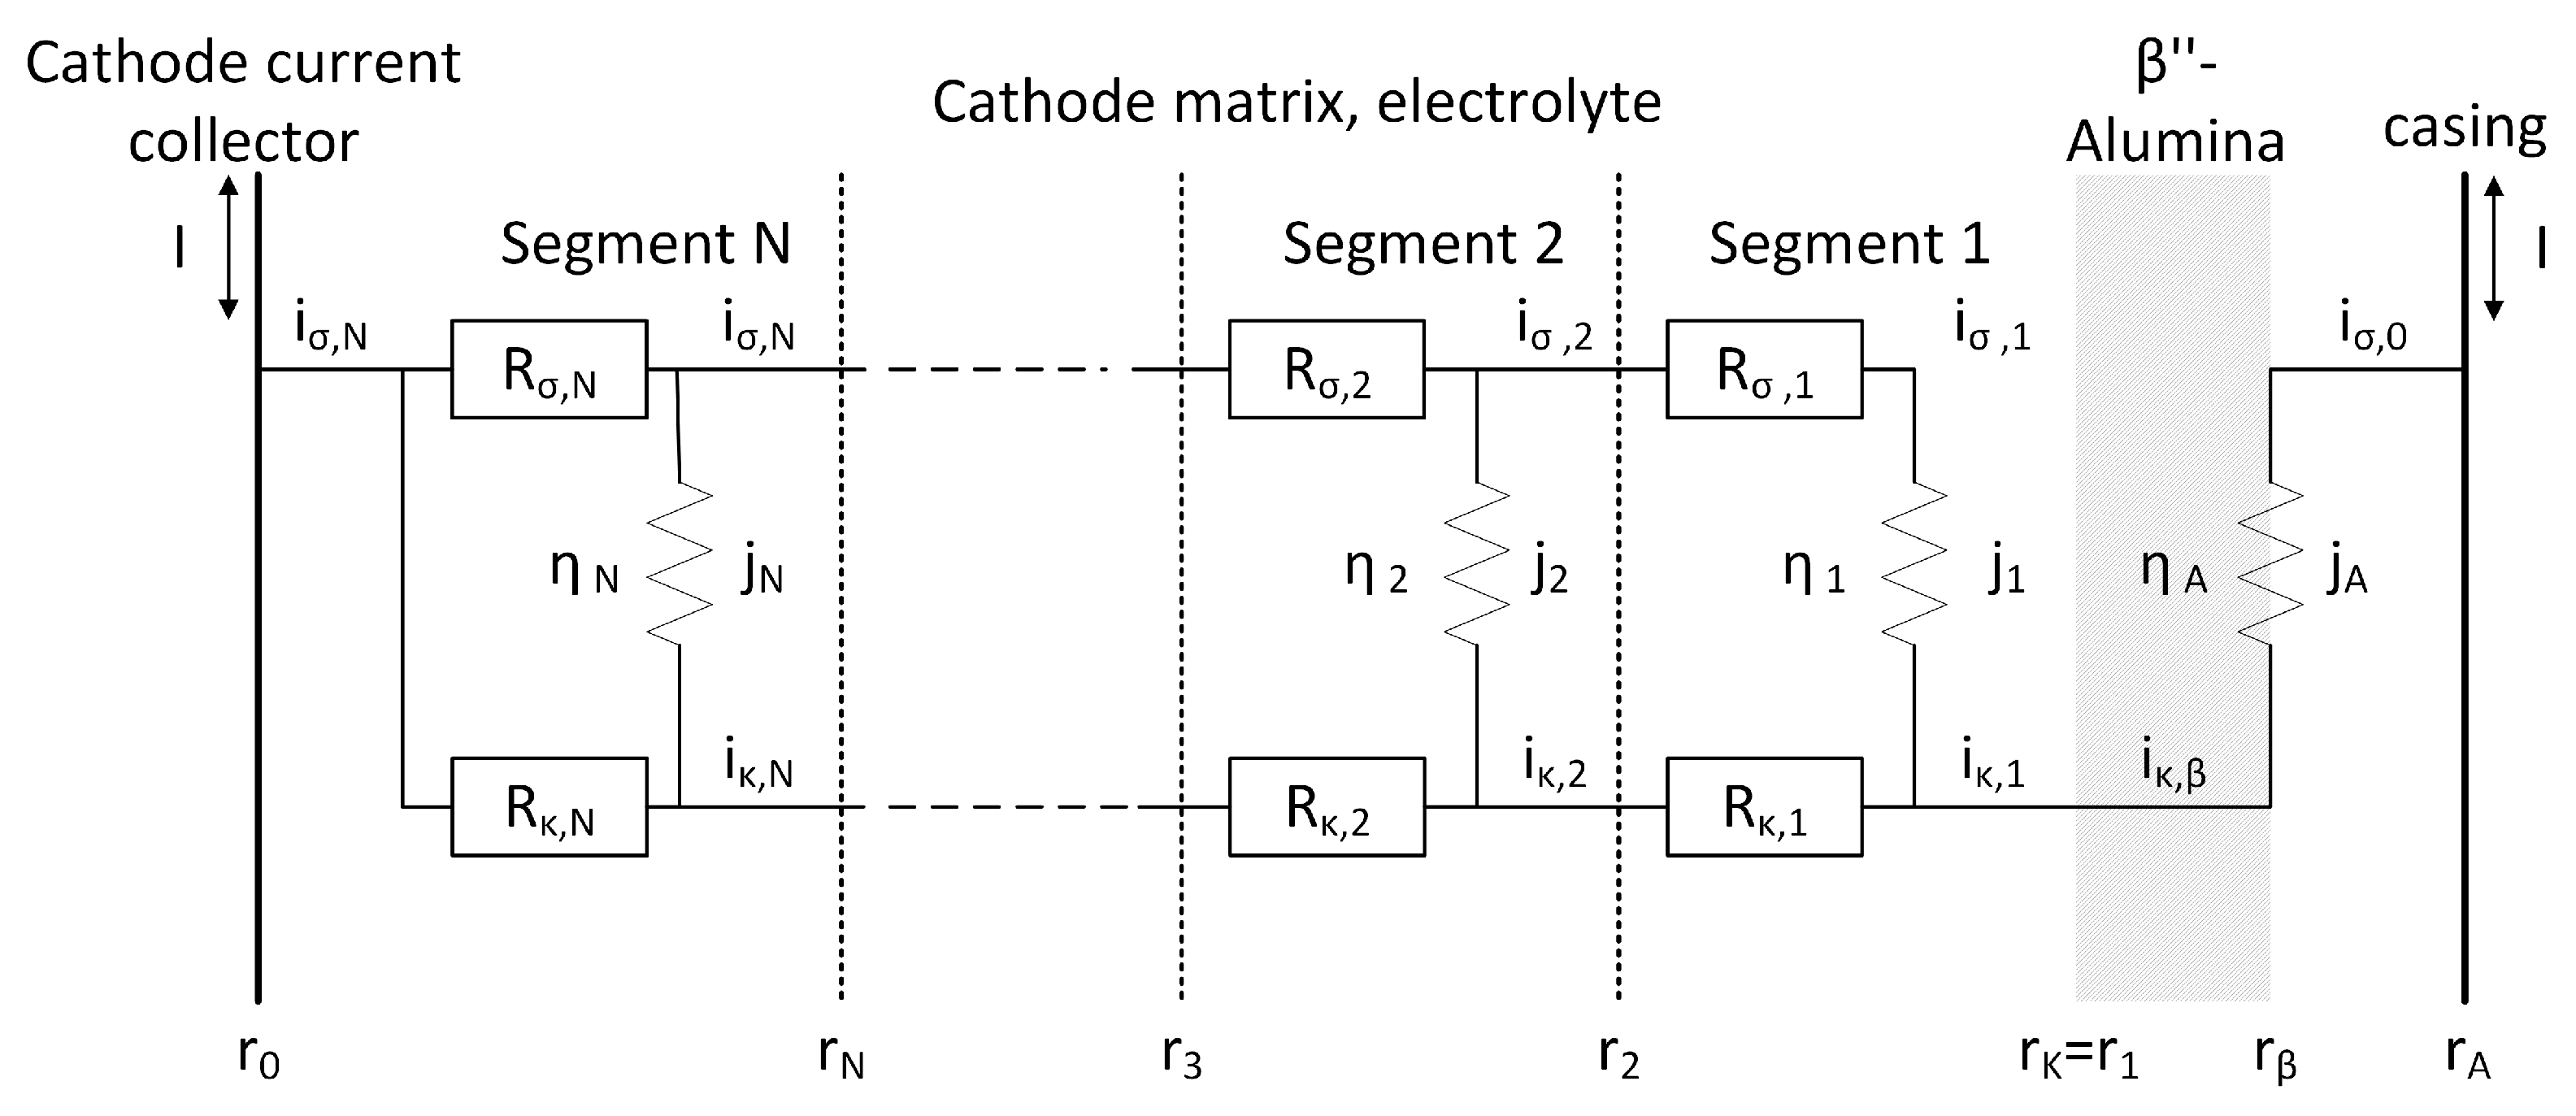
with the resistance of the separator ( R o h m i c ), the overpotential in the cathode space ( η c ) and the overpotential in the anode space ( η a ). The overpotential in the separator can be calculated based on Ohm’s law as well as the corresponding material parameters. However, the dependencies of the overpotential on electrode losses are more complex, in particular regarding the losses in the porous cathode area. That means that Na ions enter through the solid separator into the cathode space. In the case of discharging, the ions are transported by the liquid electrolyte towards the side of the reaction. At the interface of the active material and the electrolyte, the electrochemical charge transfer occurs dependent on the current density (j). In cases where all active material has reacted at the separator interface, the ions need to migrate deeper into the cathode area. Restricted by the porous structure of the cathode, the ion path is not direct (described by the tortuosity ( τ )) and a certain resistance needs to be overcome. Likewise, the electrons flow through the complex metal matrix towards the side of the reaction. To account for this complex interplay of electrochemical reactions and charge transport in the model, the cathodic overpotential ( η c ) is calculated according to Orchard and Weaving [15] based on an equivalent circuit shown in Figure 2.
The cathode space is separated into N segments with equal volume ( v n ) along the cathode radius ( r n ). Each segment is represented by a combination of three electrical components. All three components contribute to the entire cathodic overpotential, η c .
  • j n is the current density due to the charge transfer reaction and the corresponding overpotential, η n , in the cathode segment n (described by the Butler–Volmer equation) [11,13,15,24].
  • R κ , n represents the ionic resistance of the secondary electrolyte in the cathode segment n, leading to an Ohmic potential loss.
  • R σ , n represents the electrical resistance of the nickel and iron matrix in the cathode segment n, leading to an Ohmic potential loss.
Either the discharge or charge processes are divided into j timesteps. For every timestep j, the properties of each segment n are calculated with respect to the segment n 1 and the time step j 1 . Initially, each segment is assumed to have a uniform quantity of active species ( M C l 2 with M = N i or F e ) and N a C l . At the separator–electrode interface, the current flowing into the network is purely ionic, i κ , 1 , and hence must be equal to the electrical current flowing out of the network, i σ , N , as summarized in Equation (6).
i σ , N , j = i κ , 1 , j = n = 1 N j n , j v n , j
Any oxidation (charge) or reduction (discharge) of the active compound includes a charge transfer process, which can be described by the Butler–Volmer equation (Equation (7)), where the contribution of a single segment is given by the current density, j n , j [11,15,25]. This process represents the phase change of ionic current in the electrolyte to electronic current in the metal matrix.
j n , j , M = j 0 , n , j , M [ ( e ( ( 1 α ) z η n , j F R T ) ) ( e ( α z η n , j F R T ) ) ]
with
α : Transfer coefficient
R : Universal gas constant
T : Temperature
In Equation (7), j 0 , n , j , M represents the standard exchange current density. Orchard and Weaving showed that a dependency on the local depth of discharge ( d n , j , M ) must be considered:
j 0 , n , j , M = j 0 ( 1 d n , j , M ) 2 / 3
d n , j , M = 1 v M C l 2 , n , j v M C l 2 , n , 0
Both active compounds can provide current and the resulting two current densities can be summed up for each segment [14].
j n , j = j n , j , N i + j n , j , F e
Based on the two terms on the right side of Equation (10), the model calculates the change in concentration of each species and therefore the respective volume fraction for the next time step.
In addition to the impact of charge transfer, the charge transport also needs to be considered. Here, both the current flow in the electrolyte and in the solid metal matrix phase are described by Ohm’s law [13,14]. However, the effective conductivity is influenced by the porosity ( ϵ n , j ) of the cathodic area. Any change in the depth of discharge (DoD) directly influences the cathode porosity, ϵ n , j , due to a decrease or increase in solid material ( N a C l , M and M C l 2 ). A direct relationship between the porosity and the electrolyte conductivity ( κ n , j ) can be found by using the Bruggeman equation [11,14,15]:
κ n , j = κ ϵ n , j 1 + τ
The impact of the metal matrix porosity on the electron conductivity ( σ e , n ) is described analogously [14]:
σ e , n = σ N i ϵ N i , n 1 + τ + σ F e ϵ F e , n 1 + τ
where the tortuosity factor is represented by τ and the volume fraction of each metal by ϵ M .
Deducing the electrical resistance, R σ , and the ionic conduction resistance, R κ , for each segment n with the length l n and exchange area A n :
R σ , n = l n σ n A n
R κ , n = l n κ n A n
Equations (13) and (14) serve as direct input parameters for the respective resistor element in the EC segment n in Figure 2.
Furthermore, the charge transfer reaction in the anode leads to a drop in cell voltage ( η A ). The anode overpotential is expected to be low due to the high sodium conductivity. Therefore, it is reasonable to use the linearized Butler–Volmer Eequation (Equation (15)) [11,25].
j a = j a , 0 z F η a R T
The simulation itself was set up in MATLAB R2021b and the mathematical model was implemented and expanded as follows:
  • Cylindrical cell geometry with the cathode space divided into 100 segments;
  • F e C l 2 as an additional active compound besides N i C l 2 ;
  • Electron transfer in the metal matrix of the cathode;
  • A constant current charging and discharging cycle;
  • Heat generation.
The general structure of the code is shown in Figure 3 and will be briefly described in the following.
The procedure was initialized by setting the amount of each species homogeneously distributed over the cathode space (see note at the end of this section).
Within the first step, a value for η c is estimated and set in the EC Model as η 1 in the Butler–Volmer equation of segment 1 located at the separator. Running the model will return the respective current transfer values and charge transport losses of all segments. The estimated η c value is valid in cases where the first break condition is reached. Otherwise, a loop process starts to approximate η c until the condition is fulfilled (see Figure 3). This first break condition is derived from Kirchhoff’s current law, which states that the sum of the currents flowing in a node is equal to the sum flowing out of the same node. Applied on the described network, the ionic current flowing into the network ( i κ , β ) must be equal to electronic current flowing out of the network ( i σ , N ) (see Equation (16)). Inaccuracies due to rounding errors are taken into account including a tolerance ( t o l ) into Equation (16).
i κ , β = i σ , N ± t o l
The η c value is optimized in the next step by using the fmincon function provided in MATLAB. Therefore, a second condition is implemented. The second condition states that η c must have a negative or a positive sign for discharging or charging, respectively. Fulfilling both conditions leads to a new η c for the current time step j. At the end of every time step, the cell voltage and the new material balances across the cell are calculated according to Equations (1) and (2).
As described earlier, two species are responsible for current generation during the electrochemical reaction. For discharging, the iron chloride reaction occurs at cell voltages of E E O C V , F e and is thus below E O C V , N i . Therefore, the respective OCVs are used as initial conditions. This derives two cases for the reaction process (example discharging process):
E > E O C V , F e
  • Equilibrium voltage in Equation (5), E O C V = E O C V , N i .
  • In this case, only N i C l 2 is converted, because in this voltage range the iron reduction is thermodynamically not preferred.
  • The electrochemical reaction follows Equation (1).
E E O C V , F e
  • Equilibrium voltage in Equation (5), E O C V = E O C V , F e .
  • In this case, both N i C l 2 and F e C l 2 are converted, because in this voltage range iron reduction is also thermodynamically preferred.
  • The electrochemical reaction follows Equations (1) and (2).
Note: The model allows running (multiple) consecutive charging and discharging sequences. No homogeneous distribution of the materials is necessary as an initial condition. Rather, the (inhomogeneous) material distribution from the previous process can be transferred, as it may result from a termination at different state of charges. For this feature, it is indispensable to be able to model the charging and discharging processes.

Modelling Heat Generation

Na- M C l 2 cells are operated at high temperatures around 300 C, which need to be ensured by an adequate battery thermal management system (BTMS) [26], particularly because temperature has a great impact on cell performance, life time and reliability [27,28]. Temperatures above 155 °C ensure a liquid state of the sodium anode and of the secondary electrolyte. Recently, Buettner et al. showed that higher operation temperatures help increase the ionic conductivity of either the solid or the liquid electrolyte, which decreases the internal cell resistance significantly [29]. Furthermore, the electrochemical reaction is affected by the operation temperature since OCV and j 0 are temperature-dependent variables. However, by using a heat regulation system, the effect of temperature variations during operation can be neglected [14]. Hence, the model is set at isothermal conditions. Nevertheless, in order to ensure such stable temperature conditions, an appropriate dimensioning of the heat exchange system is indispensable. Importantly, heat is not provided exclusively by the BTMS and its connected heater. Heat is mainly generated by the electrochemical reaction itself as well as by internal resistances of the battery cell. Bernadi et al. provided a global energy balance to estimate the overall heat generation by an electrochemical cell [30]. This approach is valid under the assumption of a homogeneous reaction and temperature distribution in the reaction volume. However, similar to the electrochemical reaction, a heat generation front is expected to move through the cell during the charging and discharging processes. Since the electrochemical reaction has the greatest impact on heat generation within the cell, it must be resolved in the cathodic volume.
Here, the liquid electrolyte can be assumed to be constant in composition as the precipitation and dissolution has been found to possess infinitely fast kinetics [14]. Therefore, we also assume no concentration gradients of the secondary electrolyte along the battery dimension and no related heat effects such as heat generation due to mixing. With this, the volumetric heat generation rate q can be estimated by [27,28,31]:
q = n , M j M , n T E O C V , M T + n , M j M , n T η n , M + n Φ 1 , n 2 σ e , n + n Φ 2 , n 2 κ n
Equation (17) represents the heat generation rate of the entire reaction volume by summing up the contributions of the single segments. Here, the first two terms on the right side address the reversible (entropic heat) and the irreversible heat associated with each charge transfer reaction (Equations (1) and (2)). The last two terms represent the Ohmic heat generated by electron and ion transfer in the solid and liquid matrix, respectively, with the potential in the solid phase Φ 1 and the potential in the electrolyte Φ 2 .

3. Results

For the validation of the model, experiments using commercial ML3X cells (FZSoNick, Stabio, Switzerland ) with an estimated capacity of 41 Ah were performed. For this purpose, the cell voltage was measured for constant charge/discharge current investigating a C-rate range of 1/2C to 1/24C with a potentiostat (BioLogic VMP300, Seyssinet-Pariset, France, with three 10 A boosters). Subsequently, the model was used to draw conclusions about the internal mechanisms, such as the charge transport resistances or the material concentration distribution. At this point it is important to mention that the ML3X cell has a coverleaf shape separator, in contrast to the presented model, which is cylindrical for simplicity. All relevant model parameters are summerized in Table 3.

3.1. Cell Voltage for Discharge and Charge Cycle

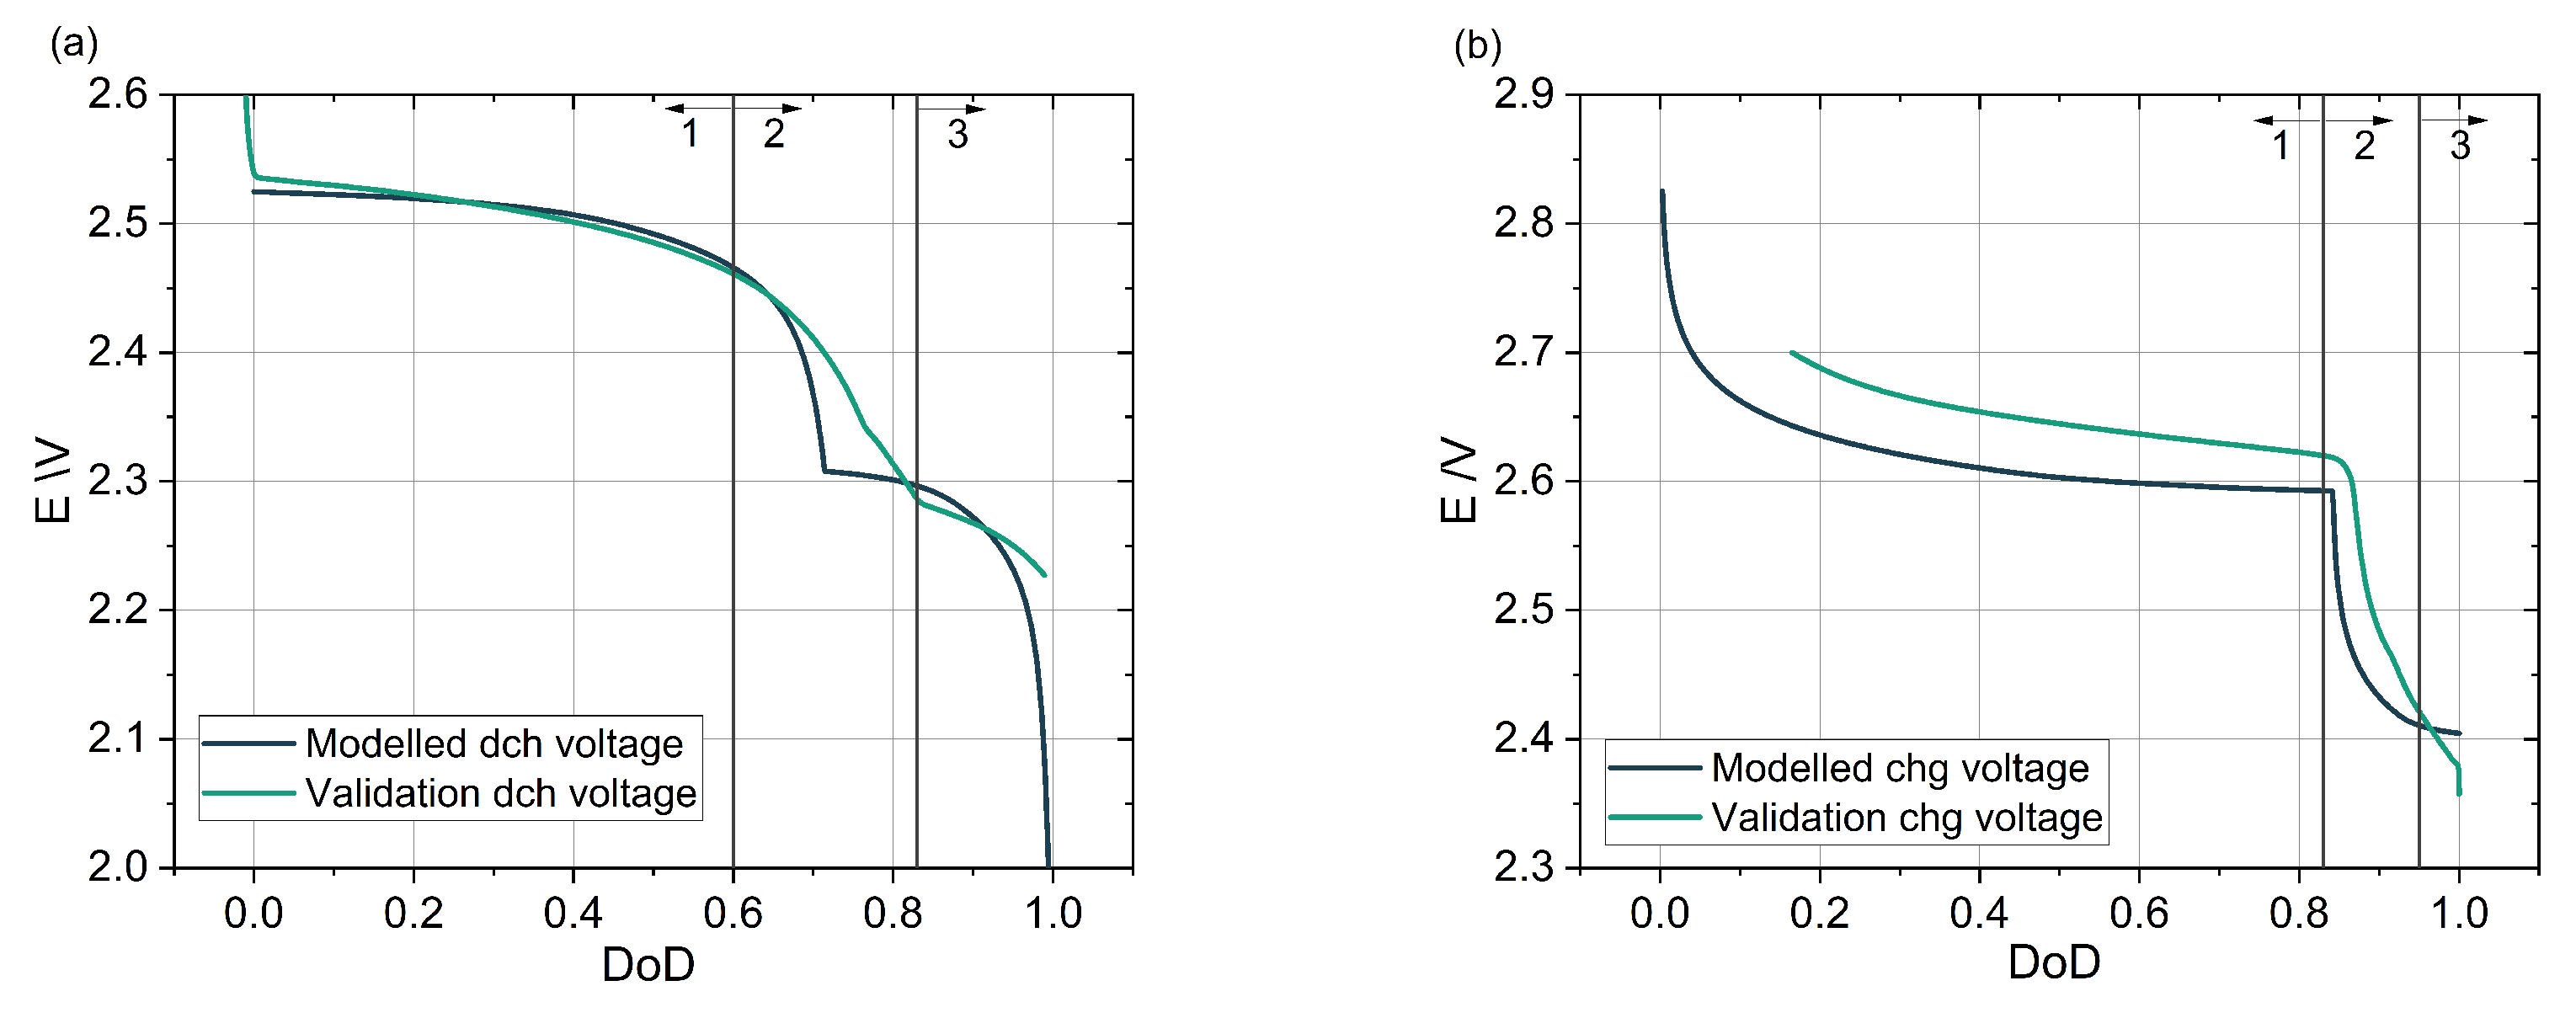
When a current is applied to the cell, the cell voltage changes as a function of current direction, current intensity and the state of charge of the cell. The voltage curve is therefore an important parameter of cell performance. Accordingly, the charge and discharge voltages were simulated and afterwards the model-based predictions were compared with experimental data. Figure 4a shows the voltage curve over the depth of discharge (DoD) for a discharge rate of 1/8C, which corresponds to a discharge current of I = 5.125 A. For small D o D s (<0.6), the modelled curve (black line) shows a flat voltage progression at about 2.52 V, followed by a sharp drop in voltage at D o D = 0.75 to a level of about 2.31 V, leading to a second plateau. The formation of two voltage plateaus can also be observed in the experimental data (green curve). The nickel chloride reaction exhibits a higher equilibrium voltage (Equation (1)) and can therefore be assigned to the first plateau. The equilibrium voltage of the iron reaction is only reached when the cell voltage decreases, so that the iron reaction (Equation (2)) dominates for the second plateau. For the first plateau, the model and experimental curves lay comparatively close to each other. However, at D o D > 0.8 , the second plateau of the experimental curve appears later in comparison to the modelled one. In addition, the experimental curve exhibits a much flatter curve with several voltage steps between 2.3 and 2.4 V at the transition voltage plateau. Recent studies have shown that, besides the direct reduction of M C l 2 to M, intermediate complexes are formed in a voltage window of 2.3–2.4 V [32]. This complex formation is not considered = in the presented model, but may be the reason for the voltage steps in the transition region of the experimental curve. Furthermore, the experimental end-of-discharge voltage lies significantly above the model-based curves. The experimental curve ends at 2.2 V, whereas the model curve has a much steeper voltage drop. This discrepancy can be related to the unknown exact amount of active material and thus the capacity in the commercial cell. A precise matching of the DoD between the experiment and model is therefore not possible.
Figure 4b shows the corresponding charge curve, also for a C-rate of 1/8C. Analogous to the discharge curve, two plateaus can be identified in the model-based voltage curve (black curve). For a fully discharged cell ( D o D = 1.0 ), the voltage has a value of about 2.4 V and rises linearly at first, then jumps to a level of about 2.6 V at D o D = 0.83 , which is followed by another voltage plateau. Finally, the voltage raises again abruptly at the end of the charge cycle. For charging, the first plateau at D o D = 0.85–1.0 can be assigned to the oxidation of iron (Equation (2)), where for voltages above E O C V , N i , the oxidation of nickel starts, leading to a second plateau. In the experimental curve (green curve), the charge cycle was terminated at an end-of-charge voltage of 2.7 V. The experimental curve also shows an offset from the model over the entire charge cycle. This suggests that the overall internal resistance of the real cell is not correctly reflected in the model. Missing details of the commercial cell, such as the exact dimensions, can be explained by one reason. Similar to the discharging experiment, the voltage steps in the transition region between the two plateaus appear most probably due to complex formation [32]. Another reason for the voltage deviation is the separator shape of the model. Compared to the coverleaf separator in the validation cell, a cylindrical-shaped separator is assumed in the model. However, in general, qualitatively similar voltage curves are found for between the experiment and model.

3.2. Impact of C-Rate on the Discharge Voltage

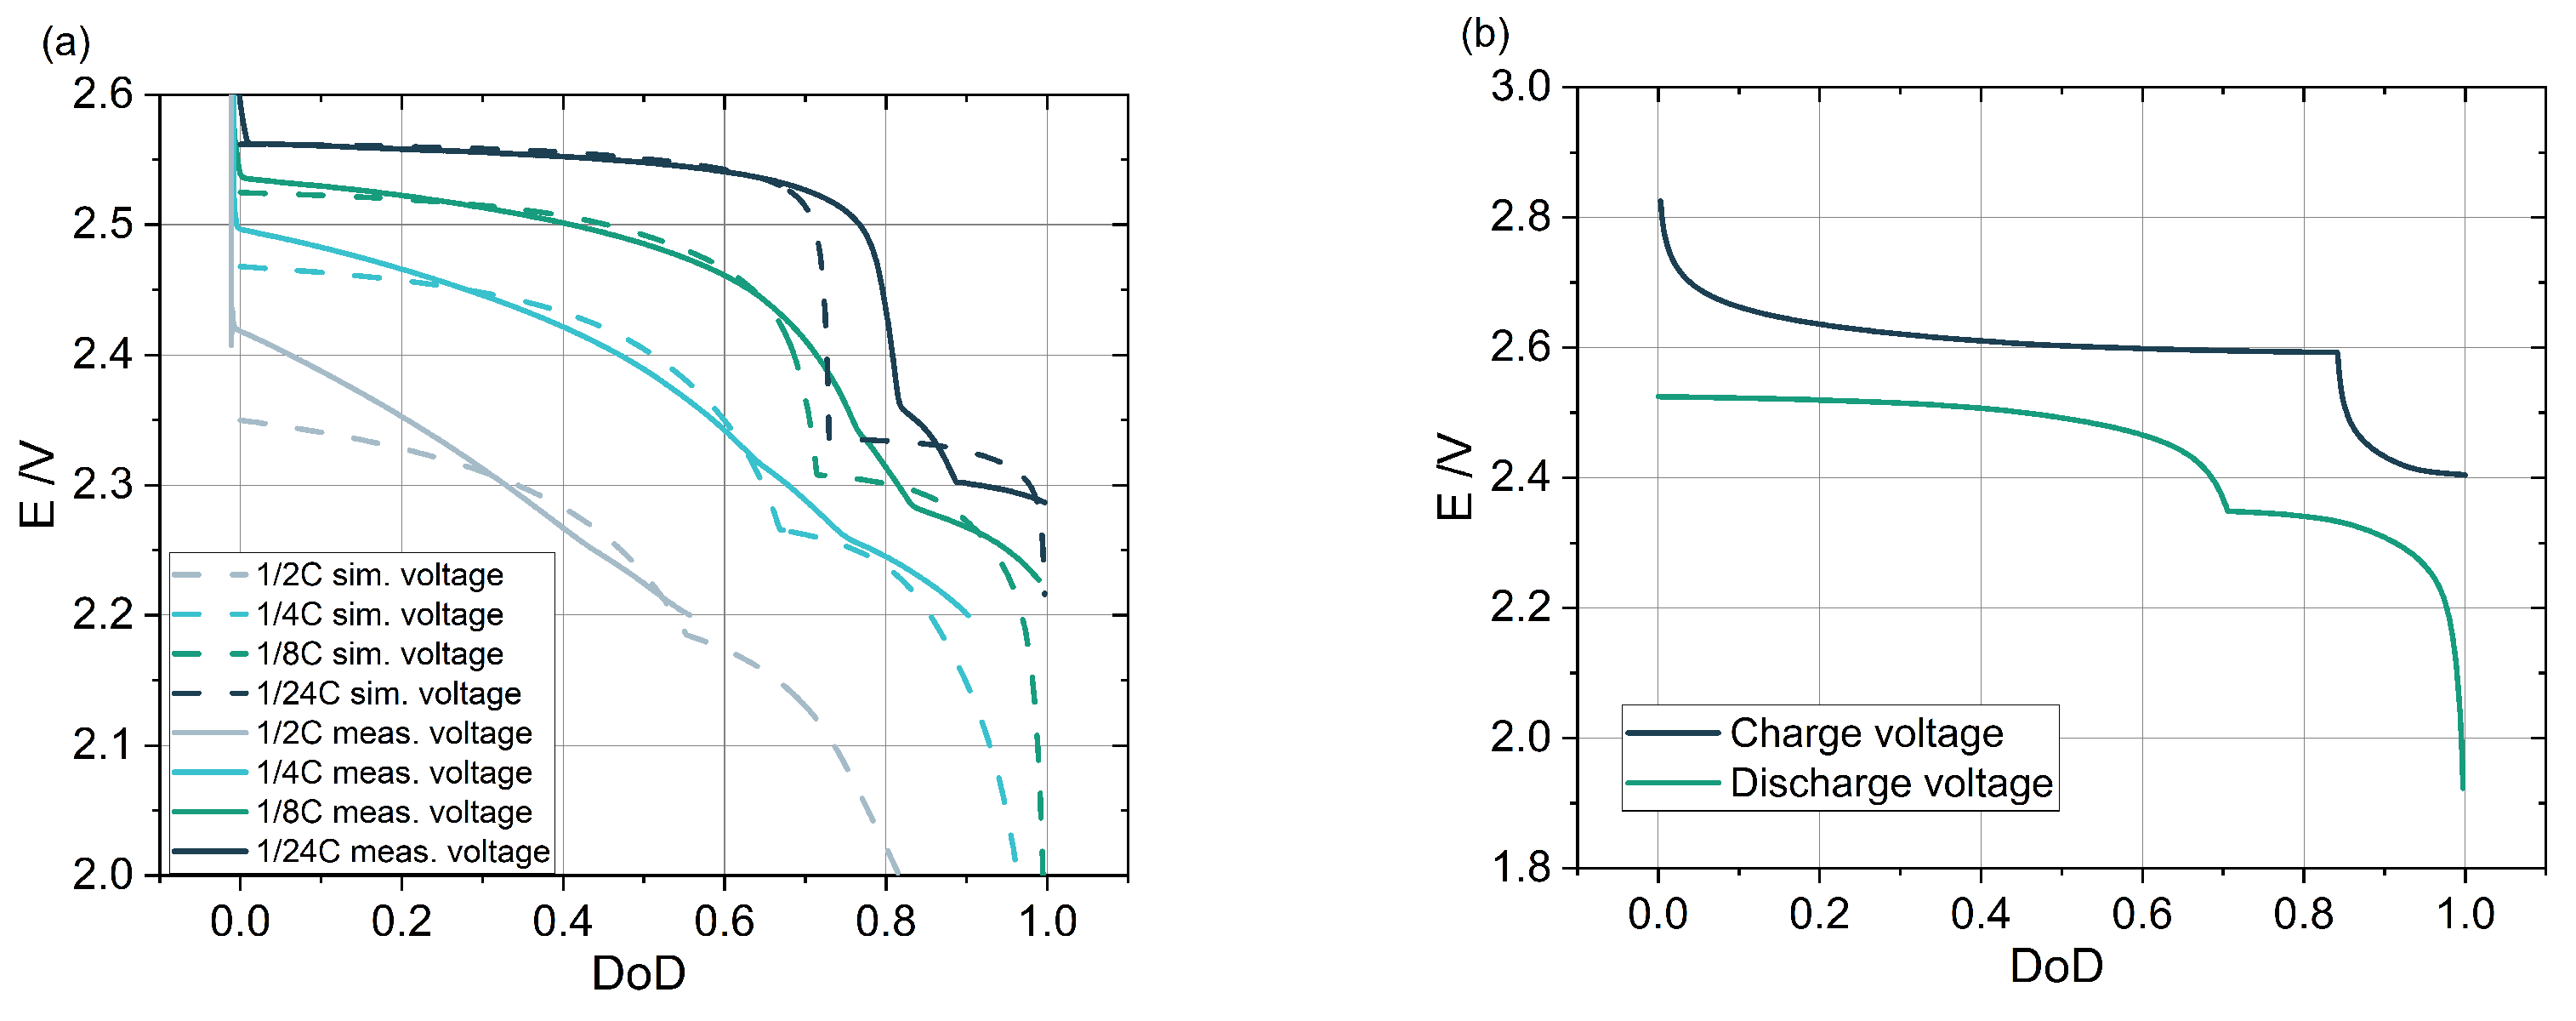
Further discharge cycles were investigated in a C-rate range from 1/24C to 1/2C and subsequently compared with the experimental data. The results are plotted in Figure 5a. In general, the transition between the two voltage plateaus is found to become increasingly blurred for higher C-rates. For 1/2C in particular, there is almost no apparent plateau or transition and the voltage level drops significantly for small DoDs. The experimental data also reflects this. Especially for higher C-rates, there is a discrepancy between the modeled and experimental data for D o D = 0 . In the model, the initial voltage drop is significantly overestimated. Furthermore, the model reproduces the respective transition region over DoD for the different C-rates well, but an overall shift in the transition region to smaller DoD can be observed compared to the experiment. The reason for this shift can be found again in the unknown exact composition of the commercial cell, since the ratio of N i C l 2 to F e C l 2 was estimated for the model initialization. Comparing the model results for different C-rates shows that the model is capable of reflecting the increasing voltage losses for higher C-rates.

3.3. Voltages Losses during Cell Cycling

The voltage drop during discharging can generally be described in terms of the resistances in the cell [29]. As explained at the beginning, these resistances are due firstly to the charge transport (ionic and electronic) and secondly to the charge transfer on the cathode and anode side (Equations (13) and (14)).
Figure 6a shows the ionic resistance in the cathode compartment for a discharge rate of 1/8C. The resistance profiles across DoD for four exemplary segments are plotted in this figure, with segment #20 located closer to the separator and segment #70 located closer to the current collector. For each segment, an increase in resistance is observed as the discharge progresses, which can be related to the change in porosity since the solid fraction increases with the DoD. However, the more dominant factor is the position of the segment in the cathode space. Segments closer to the center of the cathode have a smaller exchange surface area due to the cylindrical shape of the cell. Accordingly, the resistance value changes with the position of the segment (Equations (13) and (14)).
During the discharge process, ions must migrate from the separator to the site of the reaction in the cathode. At the beginning of the discharge process, the site of the reaction is on the inside of the separator (segment #1) and migrates deeper into the cathode space as the discharging continues. The so-called reaction front has already been described in the literature by Rijssenbeek et al. [32] and can also be reproduced by the model presented here. The longer the distance of the ions to the reaction front, the higher the resistance to be overcome. This effect is amplified by the increasing resistance value of segments close to the current collector. Thus, the voltage value slowly decreases at the beginning of the discharging cycle and the N i C l 2 plateau is formed. Due to the longer distance to the reaction front and the increasing resistance of the segments, the voltage drops more and more until it finally reaches the open circuit voltage of F e C l 2 . Here, a second reaction front corresponding to the iron reaction is formed, which again starts at the segment directly facing the separator. Accordingly to this, the voltage losses become small again and the iron plateau is formed.
Due to the Ohmic character of the ionic resistance, a stronger voltage drop is observed for higher C-rates (Figure 5a). With this voltage drop, the end-of-discharge voltage is already reached at smaller DoDs, which is accompanied by a loss in capacity for higher C-rates. This is particularly evident in the voltage curve for 1/2C discharge in Figure 5a.
Besides the ion transport resistance, the released electrons must also overcome a resistance in the metallic network. The electron resistance is plotted across the segments in Figure 6b for 1/8C discharge as an exemplary case. The highest value is found directly at the current collector due to the smallest exchange surface area, which is consistent with the results for ionic resistance. Nevertheless, the overall electron resistance is relatively small in comparison to the resistance due to ion transport. Therefore, the impact of electron transport on the cell voltage is neglected in this model. This finding is also consistent with the results in the literature [14,15]. The electron resistance may become important for different cathode compositions, for much higher current rates or due to changes in the particle morphology, for instance, by ageing effects.

3.4. Hysteresis Effect

Another characteristic of Na- M C l 2 is the hysteresis effect, as shown in Figure 5b. This causes the plateau transition for charging and discharging to occur at different DoDs. For the charging curve, a transition takes place at D o D = 0.75 , whereas for the discharge curve, a D o D = 0.83 is identified. Zinth et al. [33] provided a relationship between complex formation and hysteresis. At the beginning of charging an empty cell ( D o D = 1 ), the iron reaction does not follow Equation (2) but forms a complex with N a C l , as described in Equation (18). The complex formation leads to a rapid increase in the required cell voltage, so that E O C V , N i is already achieved at higher DoDs. This is taken into account in the model by limiting the iron available to 60 % [33] for the charging reaction, until the cell voltage exceeds E O C V , N i . Afterwards, the complex is degenerated and parallel oxidation of nickel and iron occurs, providing the full charging capacity.
8 N a C l + F e N a 6 F e C l 8 + 2 N a

3.5. Material and Volume Distribution

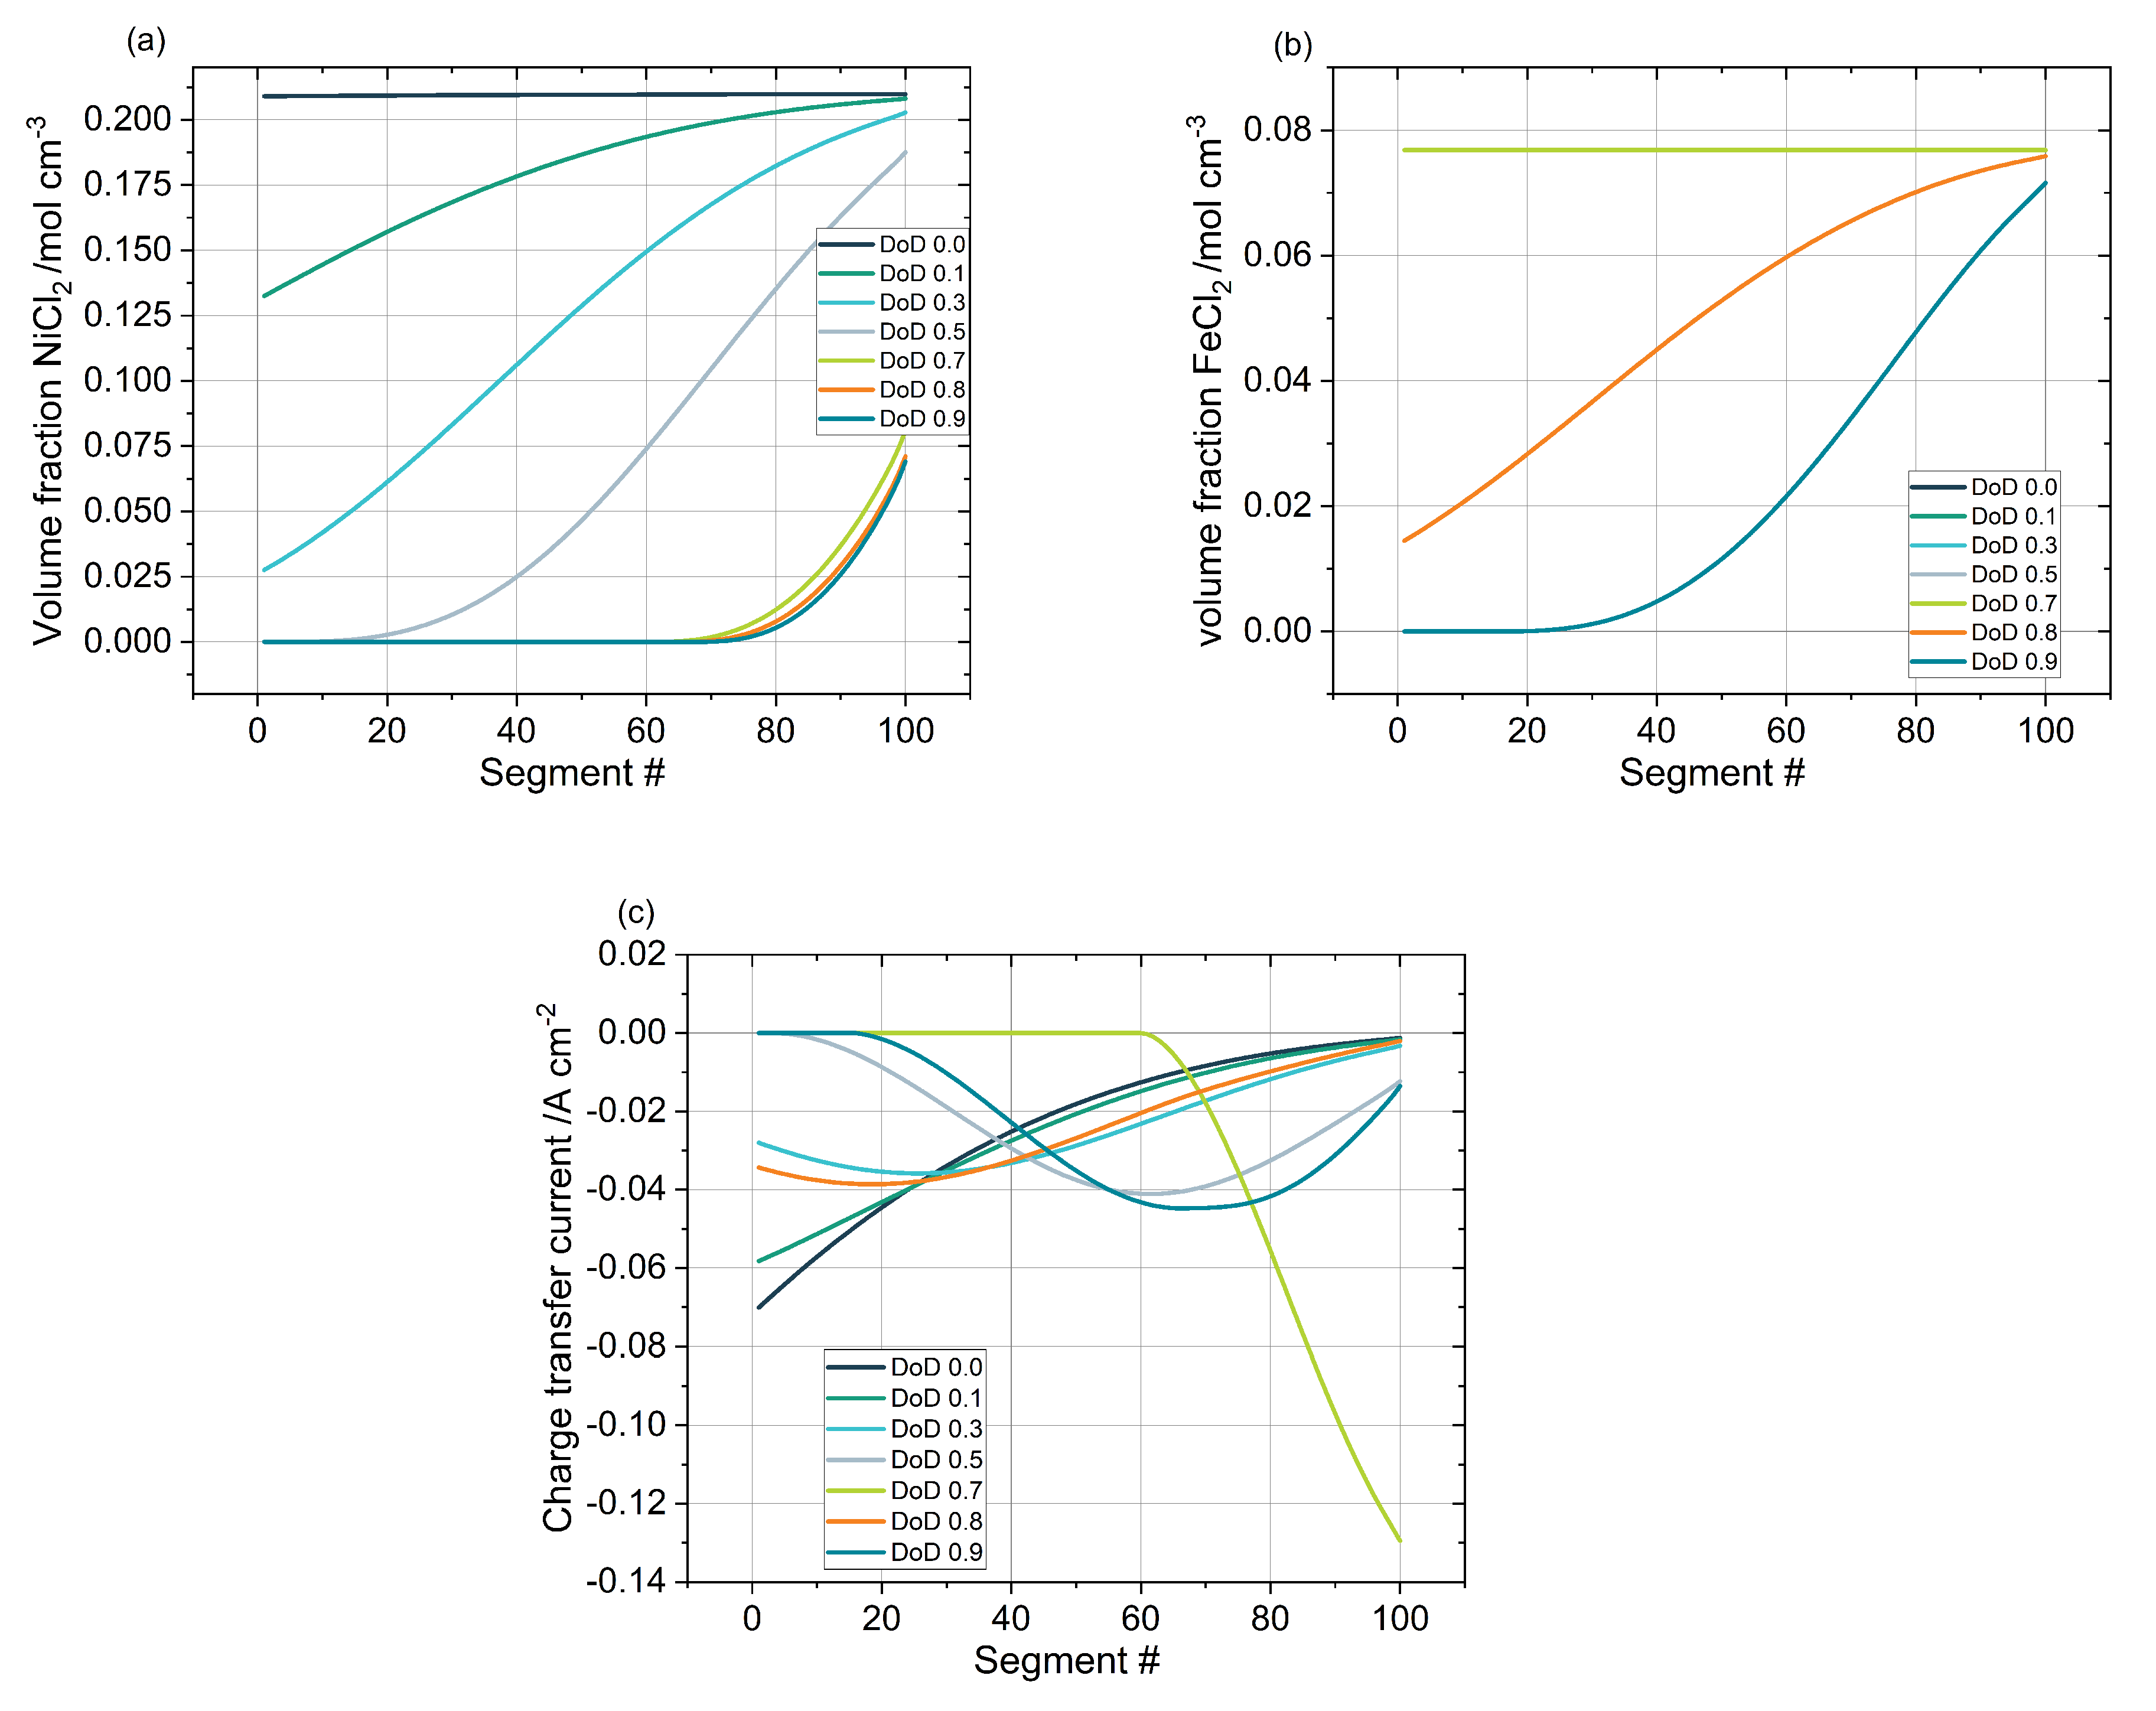
In contrast to the experimental data, the model allows detailed insights into the processes of the cathode space. The model provides predictions of the concentration distributions and the exchange current density over the simulation period. In Figure 7a, the concentration distribution of the active material N i C l 2 across the segments is plotted. The distribution for different DoDs during a discharge cycle with 1/8C is shown. First, the model is initialized with a homogeneous concentration distribution over the entire cathode space ( D o D = 0 ). Afterwards, the reduction of N i C l 2 can be observed beginning from segment #1, which is located at the separator. Even though the largest mass conversion is identified for segments close to the separator, it is evident that segments participate over the entire cathode area. As the active material is depleted in segments near the separator, the reaction contribution of segments deeper in the cathode space increases. Hence, for D o D = 0.5 , N i C l 2 is no longer available in the first segments and accordingly, a reaction front [32,33] appears from segment #20 onwards. Finally, for D o D > 0.7 , N i C l 2 is available exclusively in the segments located close to the current collector and the conversion is reduced to a lower level. At this point, the reaction front has migrated deep into the cathode space, which increases the distance the ions have to travel. As described above, the ionic resistance increases with distance. This leads therefore to a massive drop in cell voltage until finally E O C V , F e is reached. From this point onward, a change in concentration of the second active material, F e C l 2 , can be observed (Figure 7b). First, the initialized, homogeneous distribution of the second active material stays constant for D o D < 0.7 . For D o D > 0.7 and consequently a cell voltage below E O C V , F e , the reduction of F e C l 2 starts from the separator, similar to the N i C l 2 reaction progression. As described by Zinth et al. [33], in addition to the N i C l 2 reaction front near the current collector, a second reaction front forms at the separator, which also migrates towards the current collector. Therewith, the distance of the ions to the second reaction front and thus the ionic resistance are reduced. The related reduction in overpotential leads to the formation of the second voltage plateau in the discharge curve (Figure 4a).
The calculation of the concentration distribution is based on the exchange current density, which is also shown across the segments in Figure 7c. Here, the findings from Figure 7a,b are combined in one plot. One additional point may be highlighted here. At D o D = 0.7 , the exchange current density increases significantly near the current collector. Due to the N i C l 2 depletion, no current is provided by the segments closer to the separator and consequently the voltage losses increase dramatically. In the next step, for DoD = 0.8, the second reaction front related to F e C l 2 reduction appears at the separator. Due to the lower losses, the F e C l 2 reaction at the separator is preferred and the contribution of segments closer to the centre is strongly reduced. This clear shift in the exchange current density distribution corresponds to the change in the plateaus in the voltage curve (Figure 4). It is worth highlighting that in this case, both active compounds provide current at the respective reaction front.
As shown in the theoretical part of the paper, the material composition, porosity and geometry have a significant effect on cell resistance. In cases where the resistances are too high, there is a risk that active material will not be converted, resulting in a loss in capacity. The spatially resolved simulation data allow important conclusions about the effective utilization of the active materials in the cathode space. As an example, Figure 7a shows that at D O D > 0.7 , there is an almost constant concentration of N i C l 2 in the segments near the current collector. In the worst case, this amount of active material remains unreacted until the end of the discharge, causing a capacity loss. By decreasing the ionic resistance, the reaction front for N i C l 2 would migrate deeper into the cathode space and the described effect would shift to higher DoDs and thus ensure more efficient utilization of the active material.

3.6. Heat Generation

The reaction rate and charge transport also affect the heat generated by the cell during discharging. Based on Equation (17), the volumetric heat generation rate, q, has been calculated. The temperature dependency of the open circuit voltage is assumed to be equal for nickel and iron reactions and can be found in the literature as E O C V , M T = 2.16 × 10 4 V / K [28].
Figure 8a shows that the overall heat generated by the cell increases up to a D o D of 0.7 , until it suddenly drops down only to increase again. This fits very well with the two reaction plateaus shown in Figure 4. The slope of the overall heat generation can be related to a change in the path length that ions need to overcome to reach the side of reaction. Therefore, in Figure 8b, the individual heat generation terms from the right side of Equation (17) are plotted. Figure 8b indicates that the reversible part of the reaction heat stays constant over the entire discharging process, which is consistent since the provided discharge current stays constant as well. However, the ionic path length increases with the progress of discharging and therefore the related Ohmic heat also increases. For a discharge rate of 1/8C, Figure 4a shows that at D o D = 0.7 , the terminal voltage reaches the iron OCV. At this time, the reaction front moves back to the separator interface and the ionic path length decreases instantaneously. Due to the shorter ionic path length, the Ohmic heat by ionic transport as well as the irreversible reaction part drop significantly. Therewith, the overall heat generation reflects the transfer point from one reaction plateau to the other by a sudden drop. Additionally, Figure 8b shows that the Ohmic heat due to electron transport in the solid matrix is negligible compared to the other contributors. This is similar to the impact of the electron resistance. Figure 8c gives some interesting insights into the heat generation of a single segment of the cathode (segment position in the middle of the cathode). For D o D > 0.6 , the reaction in the observed segment stops and heat is generated only from the charge transport. At this point, the reversible reaction decreases to zero, indicating that all active material has been used up by the discharging reaction. At the same time, the heat due to ionic transport propagates with a constant value. In this DoD range ( D o D = 0.6–0.7), all ions need to pass the examined segment to reach the side of the reaction. The slope exhibits again a sudden change in the moment the transfer point between OCVs is reached. At D o D = 0.7 , the reaction of the second active material is enabled and consequently the reaction heat increases while the ionic transport impact vanishes.
Table 3. List of model parameters.
SymbolValueAdditional
T 573.15 K
j 0 0.14 A cm 3 [15]
j 0 , A 5 A cm 3 [15]
h K 21 cmEstimated value
r K 1.8 cmEstimated value
d β 0.15 cmEstimated value
σ N i 1 / ( 6.24 · 10 6 ( 1 + 0.0069 · ( T ( 20 + 273.15 ) ) ) ) [34]
σ F e 1 / ( 9.71 · 10 6 ( 1 + 0.0065 · ( T ( 20 + 273.15 ) ) ) ) [34]
κ 0.145 1.827 m B + ( 0.5715 + 6.358 m B ) · 10 3 · T ) [14]
m B 0.5436 1.972 · 10 4 · T + 2.346 · 10 7 · T 2 Molar ratio in the electrolyte [14]
m e t u t i 0.25776 Metal utilization

4. Conclusions

A model for predicting the electrochemical and thermal behaviour of Na- M C l 2 cells based on a hybrid approach was presented. The model uses a resistor network consisting of Ohmic and electrochemical resistances. Based on Orchard and Weaving [15], the cathode compartment is divided into several segments, allowing the spatial resolution of the cell processes during charging and discharging. Compared to previously presented electrochemical modelling approaches, the developed model structure offers the advantages of a reduced complexity and consequently a lower computational effort, while representing the relevant cell parameters.
First, the charge and discharge curves of the model were validated. A good prediction of the typical voltage plateaus were found, although certain discrepancies in the voltage values compared to the experimental data appear. Besides the impact of side reactions, which were not considered in the model, the unknown composition and simplified shape of the commercial validation cell has been identified as one of the reasons for these deviations. Secondly, the model was used to predict the discharge behaviour in a C-rate range of 1/2C to 1/24C as well as the hysteresis effect of the Na- M C l 2 cell. Finally, the progress of the reaction front was monitored over a discharge cycle, in addition to the active material concentration distribution and the exchange current density distribution. Thus, the model represents a development tool for the target-orientated optimization of cell composition as well as the geometry that can be used to characterize cells in advance at reduced cost. It provides the necessary input parameters for module and system development as well as for transferring to future applications in large capacity storage. To cover the full application scenario, a further extension of the model will be necessary with regards to the relaxation processes. In this way, the cell response on current pulses and real load profiles could be determined. Nevertheless, besides model development, this requires additional experimental and analytical work to understand all the relevant electrochemical mechanisms in the cell [35]. Recent investigations have shown that high operation temperatures accelerate Oswald ripping of the cathode particles and therefore promote ageing of the cell [36]. Further study of particle properties and micro-scale processes representing such ageing phenomena would enable the presented model to cover the entire lifetime of Na- M C l 2 cells already in the development stage.

Author Contributions

Conceptualization, N.B., F.P., C.S.G., M.R., L.N. and S.Z.; methodology, N.B., C.S.G. and M.R.; software, N.B., F.P. and C.S.G.; validation, N.B.; formal analysis, N.B. and F.P.; investigation, N.B.; resources, S.Z. and A.M.; data curation, N.B.; writing—original draft preparation, N.B. and F.P.; writing—review and editing, N.B., F.P., M.R., L.N. and S.Z.; visualization, N.B. and F.P.; supervision, S.Z. and A.M.; project administration, S.Z. and A.M.; funding acquisition, S.Z. and A.M. All authors have read and agreed to the published version of the manuscript.

Funding

This research was promoted by the Fraunhofer Project Center for Energy Storage and Systems ZESS and funded by the “Niedersächsische Vorab”, support code 11-76251-99-2/17 (ZN3402).

Data Availability Statement

No new data were created or analyzed in this study. Data sharing is not applicable to this article.

Conflicts of Interest

The authors declare no conflict of interest. The funders had no role in the design of the study; in the collection, analyses, or interpretation of data; in the writing of the manuscript, or in the decision to publish the results.

References

  1. Tamilselvi, S.; Gunasundari, S.; Karuppiah, N.; Razak RK, A.; Madhusudan, S.; Nagarajan, V.M.; Sathish, T.; Shamim, M.Z.M.; Saleel, C.A.; Afzal, A. A Review on Battery Modelling Techniques. Sustainability 2021, 13, 10042. [Google Scholar] [CrossRef]
  2. Rivera-Barrera, J.; Muñoz-Galeano, N.; Sarmiento-Maldonado, H. SoC Estimation for Lithium-ion Batteries: Review and Future Challenges. Electronics 2017, 6, 102. [Google Scholar] [CrossRef] [Green Version]
  3. Boi, M.; Battaglia, D.; Salimbeni, A.; Damiano, A. A Non-Linear Electrical Model for Iron Doped Sodium Metal Halides Batteries. In Proceedings of the 2018 IEEE Energy Conversion Congress and Exposition (ECCE), Piscataway, NJ, USA, 23–27 September 2018; pp. 2039–2046. [Google Scholar] [CrossRef]
  4. Li, Z.; Huang, J.; Liaw, B.Y.; Zhang, J. On state-of-charge determination for lithium-ion batteries. J. Power Sources 2017, 348, 281–301. [Google Scholar] [CrossRef] [Green Version]
  5. Hu, X.; Zou, C.; Zhang, C.; Li, Y. Technological Developments in Batteries: A Survey of Principal Roles, Types, and Management Needs. IEEE Power Energy Mag. 2017, 15, 20–31. [Google Scholar] [CrossRef]
  6. Sudworth, J.L.; Galloway, R.C. Secondary Batteries—High Temperature Systems|Sodium–Nickel Chloride. In Encyclopedia of Electrochemical Power Sources; Garche, J., Ed.; Elsevier: Amsterdam, The Netherlands, 2009; pp. 312–323. [Google Scholar] [CrossRef]
  7. Moseley, P.T.; Rand, D.A. High-Temperature Sodium Batteries for Energy Storage. In Electrochemical Energy Storage for Renewable Sources and Grid Balancing; Moseley, P.T., Garche, J., Eds.; Elsevier: Amsterdam, The Netherlands, 2015; pp. 253–268. [Google Scholar] [CrossRef]
  8. Zhu, R. Characterization of Positive Electrodes in Sodium-Metal Chloride Batteries. Ph.D. Dissertation, Columbia University, New York, NY, USA, 2016. [Google Scholar]
  9. Musio, M.; Damiano, A. A Non-Linear Dynamic Electrical Model of Sodium-Nickel Chloride Batteries. In Proceedings of the 4th International Conference on Renewable Energy Research and Applications, Palermo, Italy, 22–25 November 2015. [Google Scholar]
  10. Hueso, K.B.; Armand, M.; Rojo, T. High temperature sodium batteries: Status, challenges and future trends. Energy Environ. Sci. 2013, 6, 734. [Google Scholar] [CrossRef]
  11. Sudoh, M.; Newman, J. Mathematical Modeling of the Sodium/Iron Chloride Battery. J. Electrochem. Soc. 1990, 137, 876–883. [Google Scholar] [CrossRef]
  12. Pollard, R.; Newman, J. Transport Equations for a Mixture of Two Binary Molten Salts in a Porous Electrode. J. Electrochem. Soc. 1979, 126, 1713. [Google Scholar] [CrossRef]
  13. Eroglu, D.; West, A.C. Modeling of reaction kinetics and transport in the positive porous electrode in a sodium–iron chloride battery. J. Power Sources 2012, 203, 211–221. [Google Scholar] [CrossRef]
  14. Christin, R.; Cugnet, M.; Zanon, N.; Crugnola, G.; Mailley, P. Multi-Physics Modeling of a Na-NiCl2 Commercial Cell. ECS Trans. 2015, 66, 3–15. [Google Scholar] [CrossRef]
  15. Orchard, S.W.; Weaving, J.S. Modelling of the sodium-ferrous chloride electrochemical cell. J. Appl. Electrochem. 1993, 23, 1214–1222. [Google Scholar] [CrossRef]
  16. Von Srbik, M.T.; Marinescu, M.; Martinez-Botas, R.F.; Offer, G.J. A physically meaningful equivalent circuit network model of a lithium-ion battery accounting for local electrochemical and thermal behaviour, variable double layer capacitance and degradation. J. Power Sources 2016, 325, 171–184. [Google Scholar] [CrossRef] [Green Version]
  17. Li, Y.; Vilathgamuwa, M.; Farrell, T.; Choi, S.S.; Tran, N.T.; Teague, J. A physics-based distributed-parameter equivalent circuit model for lithium-ion batteries. Electrochim. Acta 2019, 299, 451–469. [Google Scholar] [CrossRef]
  18. Merla, Y.; Wu, B.; Yufit, V.; Martinez-Botas, R.F.; Offer, G.J. An easy-to-parameterise physics-informed battery model and its application towards lithium-ion battery cell design, diagnosis, and degradation. J. Power Sources 2018, 384, 66–79. [Google Scholar] [CrossRef]
  19. Bloom, I.; Nelson, P.A.; Redey, L.; Orth, S.K.; Hammer, C.L.; Skocypec, R.S.; Dees, D.W.; Hash, M.C.; Vissers, D.R. Design Considerations For The Development Of Advanced Sodium/metal-chloride Cells. In Proceedings of the 25th Intersociety Energy Conversion Engineering Conference, Reno, NV, USA, 1990; pp. 341–347. [Google Scholar] [CrossRef]
  20. Vallance, M.; Hall, D.B. Finite Element Analysis of a Sodium-Metal Halide Electrochemical Cell. Meet. Abstr. 2010, MA2010-01, 267. Available online: https://iopscience.iop.org/article/10.1149/MA2010-01/3/267/pdf (accessed on 14 May 2022). [CrossRef]
  21. Rexed, I.; Behm, M.; Lindbergh, G. Modelling of ZEBRA Batteries Royal Institut of Technology KTH Stockholm, School of Chemical Science and Engineering, Applied Electrochemistry. In Proceedings of the 61th Annual Meeting of the International Society of Electrochgemistry, Nice, France, 26 September–1 October 2010. [Google Scholar]
  22. Zhu, R.; Vallance, M.; Rahimian, S.K.; West, A.C. Galvanostatic Intermittent Titration Study of the Positive Electrode of a Na|Ni(Fe)-Chloride Cell. J. Electrochem. Soc. 2015, 162, A2051–A2057. [Google Scholar] [CrossRef] [Green Version]
  23. Bracco, S.; Delfino, F.; Trucco, A.; Zin, S. Electrical storage systems based on Sodium/Nickel chloride batteries: A mathematical model for the cell electrical parameter evaluation validated on a real smart microgrid application. J. Power Sources 2018, 399, 372–382. [Google Scholar] [CrossRef]
  24. Trasatti, S. Electrokinetics. In Encyclopedia of Electrochemical Power Sources; Newnes: Waltham, MA, USA, 2009; pp. 22–31. [Google Scholar]
  25. Panero, S. Kinetics. In Encyclopedia of Electrochemical Power Sources; Newnes: Waltham, MA, USA, 2009; pp. 14–22. [Google Scholar]
  26. Richter, M.; Dittrich, R.; Zindel, A.; Nousch, L.; Lehmann, M.; Franke, M.; Eißmann, N.; Hutsch, T.; Cerdas, F.; Zellmer, S.; et al. Development and Environmental Assessment of a Phase Change Material Based Thermal Management System for Na/NiCl2 Batteries. Batteries 2022, 8, 197. [Google Scholar] [CrossRef]
  27. Gu, W.B.; Wang, C.Y. Thermal-Electrochemical Modeling of Battery Systems. J. Electrochem. Soc. 2000, 147, 2910. [Google Scholar] [CrossRef]
  28. Christin, R. Modélisation Multiphysique de Cellules Sodium Chlorure de Nickel. Ph.D. Dissertation, L’Université Grenoble Alpes, Grenoble, France, 2015. [Google Scholar]
  29. Büttner, N.; Skadell, K.; Schüßler, B.; Nousch, L.; Richter, M.; Schulz, M.; Michaelis, A. Internal Resistance Analysis of Na/NiCl 2 Cells using Electrochemical Impedance Spectroscopy. J. Electrochem. Soc. 2022, 169, 090506. [Google Scholar] [CrossRef]
  30. Bernardi, D. A General Energy Balance for Battery Systems. J. Electrochem. Soc. 1985, 132, 5. [Google Scholar] [CrossRef] [Green Version]
  31. Srinivasan, V.; Wang, C.Y. Analysis of Electrochemical and Thermal Behavior of Li-Ion Cells. J. Electrochem. Soc. 2003, 150, A98–A106. [Google Scholar] [CrossRef] [Green Version]
  32. Rijssenbeek, J.; Gao, Y.; Zhong, Z.; Croft, M.; Jisrawi, N.; Ignatov, A.; Tsakalakos, T. In situ X-ray diffraction of prototype sodium metal halide cells: Time and space electrochemical profiling. J. Power Sources 2011, 196, 2332–2339. [Google Scholar] [CrossRef]
  33. Zinth, V.; Seidlmayer, S.; Zanon, N.; Crugnola, G.; Schulz, M.; Gilles, R.; Hofmann, M. In Situ Spatially Resolved Neutron Diffraction of a Sodium Metal Halide Battery. J. Electrochem. Soc. 2015, 162, A384–A391. [Google Scholar] [CrossRef]
  34. Neelakanta, P.S. Handbook of Electromagnetic Materials: Monolithic and Composite Versions and Their Applications; CRC Press: Boca Raton, FL, USA, 1995. [Google Scholar]
  35. Newman, J.; Tiedemann, W. Porous-electrode theory with battery applications. AIChE Journal 1975, 21, 25–41. [Google Scholar] [CrossRef] [Green Version]
  36. Li, G.; Lu, X.; Kim, J.Y.; Lemmon, J.P.; Sprenkle, V.L. Cell degradation of a Na–NiCl2 (ZEBRA) battery. J. Mater. Chem. A 2013, 1, 14935. [Google Scholar] [CrossRef]
Figure 1. Reaction scheme during N i C l 2 and F e C l 2 reduction inside the cathode space, RF (reaction front).
Batteries 09 00200 g001
Figure 2. Equivalent circuit representing the segmented cathode space based on Orchard and Weaving [15].
Batteries 09 00200 g002
Figure 3. Activity diagram representing the implemented code.
Batteries 09 00200 g003
Figure 4. Model validation with 1/8C ( I = 5.125 A ): (a) discharge (dch) and (b) charge (chg). Highlighted are three different segments: 1 and can be removed. The following highlights are the same. refers to the voltage plateau according to Equation (1); 2 refers to the transition towards the next plateau; and 3 is related to the voltage plateau according to Equation (2).
Batteries 09 00200 g004
Figure 5. (a) Simulated and measured discharge voltages for four different C-rates over DoD. (b) Modelled charge and discharged voltage for 1/8C showing a hysteresis.
Batteries 09 00200 g005
Figure 6. (a) Resistance due to ion transport over DoD. (b) Electrical resistance in the solid metal matrix over segment number, for D o D = 0.5 . Both graphs have been modelled for discharging with 1 / 8 C .
Batteries 09 00200 g006
Figure 7. (a) Volume fraction distribution of N i C l 2 over the segments 0−100 for different DoDs. (b) Volume fraction distribution of F e C l 2 over the segments 0−100 for different DoDs. (c) Calculated charge transfer current for the corresponding DoDs shown in (a,b).
Batteries 09 00200 g007
Figure 8. Results of the thermal model. (a) Overall heat generation of the reaction volume in one discharging cycle. (b) Contribution of the different heat generation terms. (c) Heat generation in a single segment (#50) over one discharging cycle with 1/8C.
Batteries 09 00200 g008
Table 1. Literature overview of Na- N i C l 2 and Na- F e C l 2 cell modelling.
Features1990 Sudoh et al. [11]1990 Boom et al. [19]1993 Orchard et al. [15]2008 Vallance et al. [20]2010 Rexed et al. [21]2012 Eroglu et al. [13]2015 Christin [14]2016 Zhu et al. [22]2018 Bracco et al. [23]
Operation
mode
DischargeYesYesYesYesYesYesYesYesYes
ChargeYesNoNoNoYesYesNoYesNo
Cell
chemistry
FeYesNoYesYesNoYesYesYesYes
NiNoYesNoNoYesNoYesYesNo
Cell
geometry
PlanarNoNoYesNoNoNoNoNoNo
RadialYesYesNoNoNoYesNoYesYes
CloverleafNoNoNoYesNoNoYesNoNo
ProcessesPorosityYesNoYesYesNoYesYesYesYes
Na + TransportYesYesYesYesYesYesYesYesYes
MCl 2 latticeYesNoNoYesYesYesYesNoNo
Heat formationNoNoNoNoNoNoYesNoNo
Validation NoYesYesYesNoNoYesNoYes
Table 2. List of symbols.
SymbolUnit Description
Δ G JGibbs free energy change
F A s mol 1 Faraday constant
RJ K 1 mol 1 Universal gas constant
TKTemperature
z Number of electrons transferred
E O C V VOpen circuit v t V oltage
EVCell voltage
η VOverpotential
η C VCathode overpotential
η A VAnode overpotential
η n VOverpotential in segment n
IACurrent
i κ , n AIonic current in segment n
i σ , n AElectronic current in segment n
j a , 0 A cm 3 Anodic standard exchange current density
j a A cm 3 Anodic exchange current density
j n , j , M A cm 3 Charge exchange current density of active material M
j n , j A cm 3 Sum of exchange current densities
j 0 A cm 3 Standard exchange current density
j 0 , n , j , M A cm 3 Standard exchange current density of active material M
d n , j , M Local depth of discharge
R O h m i c Ω Separator resistance
R σ , n Ω Ionic resistance
R κ , n Ω Electronic resistance
κ Ω 1 cm 1 Standard conductivity
κ n , j Ω 1 cm 1 Ionic conductivity in segment n at timestep j
σ n , j Ω 1 cm 1 Standard conductivity
σ e , n Ω 1 cm 1 Electronic conductivity in segment n
ϵ n , j Cathode porosity
ϵ M , n Metal matrix porosity
τ Totuosity
α Charge transfer coefficient
l n cmLength of each segment
A n cm 2 Exchange area
qW cm 3 Volumetric heat generation rate
Φ 1 VPotential in solid phase
Φ 2 VPotential in the electrolyte
v M C l , n , j mol cm 3 Molar volume of active material M in segment n at timestep j
Subscripts
j Time step index
n Segment number
N Total number of segments
M Metal indexing ( N i , F e )
Disclaimer/Publisher’s Note: The statements, opinions and data contained in all publications are solely those of the individual author(s) and contributor(s) and not of MDPI and/or the editor(s). MDPI and/or the editor(s) disclaim responsibility for any injury to people or property resulting from any ideas, methods, instructions or products referred to in the content.