Article

Thermal Management of Lithium-Ion Batteries Based on Honeycomb-Structured Liquid Cooling and Phase Change Materials

1
Hubei Research Center for New Energy & Intelligent Connected Vehicle, School of Automotive Engineering, Wuhan University of Technology, Wuhan 430070, China
2
Chongqing Research Institute, Wuhan University of Technology, Chongqing 401135, China
3
School of Mechanical and Automotive Engineering, Shanghai University of Engineering Science, Shanghai 201620, China
4
Shanghai Marine Diesel Engine Research Institute, Shanghai 201108, China
*
Authors to whom correspondence should be addressed.
Batteries 2023, 9(6), 287; https://doi.org/10.3390/batteries9060287
Submission received: 17 April 2023 / Revised: 15 May 2023 / Accepted: 22 May 2023 / Published: 24 May 2023
(This article belongs to the Special Issue Thermal Management System for Lithium-Ion Batteries)

Abstract

:
Batteries with high energy density are packed into compact groups to solve the range anxiety of new-energy vehicles, which brings greater workload and insecurity, risking thermal runaway in harsh conditions. To improve the battery thermal performance under high ambient temperature and discharge rate, a battery thermal management system (BTMS) based on honeycomb-structured liquid cooling and phase change materials (PCM) is innovatively proposed. In this paper, the thermal characteristics of INR18650/25P battery are studied theoretically and experimentally. Moreover, the influence of structure, material and operating parameters are studied based on verifying the simplified BTMS model. The results show that the counterflow, honeycomb structure of six cooling tubes and fins, 12% expanded graphite mass fraction and 25 mm battery spacing give a better battery thermal performance with high group efficiency. The maximum temperature and temperature difference in the battery in the optimal BTMS are 45.71 °C and 4.4 °C at the 40 °C environment/coolant, as against 30.4 °C and 4.97 °C at the 23.6 °C environment/coolant, respectively. Precooling the coolant can further reduce the maximum battery temperature in high temperature environments, and the precooling temperature difference within 5 °C could meet the uniformity requirements. Furthermore, this study can provide guidance for the design and optimization of BTMS under harsh conditions.

1. Introduction

Aside from material compositions, temperature is one of the most important parameters to significantly affect the performance of lithium-ion batteries. Too low a temperature will reduce the diffusion capacity of lithium ions, resulting in the attenuation of performance indicators [1]. Charging at low temperatures even leads to Li plating, which increases the degradation/aging rate [2]. Too high a temperature will cause severe side reactions inside the battery, resulting in the decline of cycle life [3]. High energy density power batteries could be adopted with more compact grouping efficiency, leading to instability and even safety issues in the battery systems, risking thermal runaway at high temperatures [4]. Therefore, it is vital to control the battery temperature within a reasonable range for its safety and high performance.
Generally speaking, the operating temperature range of lithium-ion batteries is between −20 °C and 60 °C [5]. To ensure the optimal performance and safety of batteries, 50 °C is often set as the highest temperature acceptable for battery thermal management systems (BTMSs) [6]. In addition, to prevent the occurrence of internal short circuits, the temperature distribution of BTMSs should be relatively uniform; i.e., the maximum temperature difference inside the battery should not exceed 5 °C [7]. Furthermore, 25 °C to 35 °C has been proved to be the optimal operating temperature range for lithium-ion batteries, resulting in the highest electrochemical efficiency and the lowest aging rate [8]. Other studies also show that when the battery pack works at 30 °C to 40 °C, battery life will be reduced by about 60 days for each degree of increase [9].
To control the maximum temperature and temperature difference in the battery pack, a variety of cooling methods are widely used, such as air cooling, liquid cooling, heat pipe and phase change materials (PCM), etc., whose application in practical engineering could be found in the literature [10]. The design objectives of BTMSs are different for diverse working conditions, and so are the cooling methods. Among them, air cooling is the most traditional and direct heat dissipation method, utilizing airflow to take away the generated heat of batteries. Air cooling is characterized by a simple structure and low cost, but its cooling ability is weak, so it is often used for vehicles with low maximum temperature restriction in practical engineering [11]. Recently, heat pipes have been introduced as a cooling method for power batteries because of their high heat transfer efficiency and long service life. Its liquid working medium absorbs heat at the evaporation end, flows to the condensing section under the drive of pressure difference, and releases the heat. In addition, heat pipes can also realize the circulating cooling process through the action of gravity and capillary force. However, this cooling method has not been widely developed in practical engineering applications [12] due to its high cost. However, BTMSs must have a much stronger active heat dissipation capacity in high ambient temperatures, high discharge rates and cycle conditions to prevent heat accumulation. So, other cooling methods are investigated in detail.
Liquid cooling, one of the most commonly used cooling methods in practical engineering, adopts liquid as the cooling medium to take away the heat of batteries through direct or indirect contact. Compared with air cooling, the cooling medium of liquid cooling has higher density, specific heat capacity and thermal conductivity, which can take away the heat from the surface more quickly and make the battery pack layout more compact. Due to the different shapes of batteries, the structure and arrangement of liquid cooling devices are also diverse. For square batteries, Panchal et al. [13] adopted a water-cooling BTMS and obtained the temperature distribution on the battery surface and the cooling effect of the water-cooling system by comparing and analyzing different boundary conditions at 1C and 3C discharge rates. To improve the cooling effect, Gungor et al. [14] proposed a liquid cooling plate with canopy-shaped micro-flow channels. According to the simulation results, this structure could use the lower mass flow rate coolant to reduce the maximum battery temperature and maintain better temperature uniformity. Wei et al. [15] established a numerical model of square cells with liquid cooling and analyzed factors such as the number of cells between cold plates, the thickness of cold plates, the flow rate of coolant and so on. The results showed that the cooling effect was worse when the number of cells between cold plates increased. Oppositely, the cooling effect was enhanced when the thickness of the liquid cooling plates and the flow rate of the coolant increased within a certain range. For the cylindrical battery pack, a new BTMS based on the classical serpentine liquid cooling channel was proposed in the literature [16], with a good cooling effect and compact structure. Compared with the original structure, the cooling performance was obviously improved under vibration conditions. In addition, liquid cooling tubes are commonly used because they can be well arranged in the gaps between cylindrical cells. In the literature [17], a cooling structure of longitude-arranged liquid cooling pipes surrounded by three curved contact surfaces was proposed. The influences of mass flow rate, inner diameter, height and angle of the contact surface were studied through numerical simulation. The results showed that the optimal structure could control the maximum temperature and temperature difference within a reasonable range at a high discharge rate of 5C. In the literature [18], a cooling structure in which the liquid cooling pipes were placed horizontally between two adjacent rows of batteries was presented. The influences of different structures, different types of coolant and pump power consumption were discussed. It can be concluded that in a certain volume flow range, the structure with fewer copper pipes but a higher flow rate had a better cooling performance.
As a passive cooling method, PCM can absorb a large amount of heat through physical state changes as the battery temperature rises. It not only has a simple structure and no extra energy consumption but also can significantly improve the temperature uniformity of batteries due to the existence of an isothermal heat absorption during the phase change. Wang et al. [19] proposed a BTMS based on pure PCM and conducted detailed studies on thermal conductivity, viscosity, latent heat, the thickness of PCM and the thermal conductivity of cell shells. The results showed that the PCM unit could effectively reduce the maximum temperature and temperature difference in the battery at the end of discharge and can also realize temperature preservation after heat dissipation. Lazrak et al. [20] conducted relevant studies on the cooling effect of a PCM-based BTMS and found that the higher the thermal conductivity of the PCM used, the better the temperature uniformity of batteries, but the influence on the maximum temperature was little. However, when the battery is subjected to harsh conditions such as high temperatures, a single kind of PCM may not be able to adequately cool the battery due to its low thermal conductivity. To solve this issue, carbon-based or metal-based materials are often added to PCM to form composite PCM (CPCM) with high thermal conductivity [21]. He et al. [22] successfully prepared a new type of CPCM by constructing a thermal conduction skeleton of expanded graphite (EG) and copper foam (CF). This structure has a better cooling effect and temperature uniformity than PCM with only EG or CF. Although PCM with metal foam has excellent thermal conductivity, it has a high cost, large weight and complex processing, so the EG with lighter weight, good adsorption and thermal conductivity is more inclined to be used in practical projects. Jiang et al. [23] prepared paraffin (PA) and EG to form CPCM and performed experiments to measure the thermal conductivity and liquid phase PCM leakage of CPCM. The results showed that the addition of EG significantly increases the thermal conductivity of PCM and reduces the battery temperature rise. To improve the heat transfer characteristics of PCM after the addition of high thermal conductivity materials, Mauro et al. [24] utilized mono- and multi-objective optimization methods to obtain the optimal heat transfer effect and pressure drop of the graded metal foam-filled channels. In addition, fins with high thermal conductivity can be used in conjunction with PCM to enhance heat dissipation. In refs. [25,26], heat sinks based on PCM and fins are presented, and the influence of structural and operational parameters, such as PCM thickness, length and thickness of fins, etc., is studied in detail. Furthermore, Bianco et al. [27] proposed finned heat sinks combined with PCM and metal foam to improve the overall thermal conductivity and utilized multi-objective Pareto optimization with genetic algorithms to achieve an optimal trade-off between cost and operation time.
Although the BTMS based on PCM can absorb a significant amount of heat in the first cycle, it may not meet the performance requirement at an ambient temperature higher than the PCM melting temperature or under cyclic conditions. Therefore, hybrid cooling methods that combine PCM with other active cooling methods are often used to improve the overall thermal performance of BTMS. Lebrouhi et al. [28] proposed a BTMS combining horizontal liquid cooling pipes with PCM and analyzed the effects of different cooling methods, cooling pipes’ number, coolant temperature and environmental conditions on the thermal performance of battery packs. The results showed that compared with a BTMS of natural convection and passive PCM, the hybrid cooling method has a better heat dissipation effect. Similarly, Fan et al. [29] combined longitudinal liquid cooling plates and PCM to form a hybrid cooling BTMS and constructed a nonlinear mathematical model among cell spacing, coolant velocity and system thermal performance. The simulation and experimental results showed that the optimal BTMS processed a better thermal performance in different application scenarios, including liquid cooling and heating. Compared with the horizontal cooling pipes and longitudinal cooling plates, the longitudinal cooling pipes can better solve the problem of heat concentration generated at the positive and negative electrodes of batteries. Xin et al. [30] adopted the combination of longitudinal liquid cooling tubes and PCM for the conditions of high temperature and 5C high discharge rate and discussed the influence of PCM thickness, EG mass fraction and coolant operating parameters on the thermal performance of batteries. The results showed that when the EG mass fraction was 12%, the maximum temperature and maximum temperature difference under the optimal BTMS were 45.25 °C and 3.49 °C, respectively. Moreover, Weng et al. [31] proposed a BTMS which embedded liquid cooling tubes in spiral copper tubes to strengthen the heat dissipation of PCM. The experimental results showed that this BTMS had an excellent cooling effect at high temperatures, and the dynamic liquid cooling mode was able to reduce energy consumption. In addition to liquid cooling, air cooling and heat pipe cooling are often combined with PCM, which can also meet the heat dissipation requirements of the battery pack under conventional working conditions [32,33].
According to the review of previous studies, it is found that the active BTMS combined with liquid cooling and PCM has a good cooling effect under harsh conditions of high temperature and high discharge rate. To further optimize the performance of the hybrid cooling method, a new honeycomb-shaped frame is proposed in this paper, formed by the liquid cooling tubes arranged in the battery gaps and the connected fins. Compared with previous studies [34,35], this structure not only improves the thermal performance of the single battery but also enables the extended battery pack to have a good temperature consistency. In addition, the influence of structural parameters, including the number of fins, number of liquid cooling tubes and cell spacing, material parameters such as the mass fraction of EG and operating parameters such as coolant flow direction and temperature on the thermal performance of BTMS based on honeycomb-structured liquid cooling and PCM will be analyzed in detail in this study.

2. Thermal Characteristic Experiments of Lithium-Ion Battery

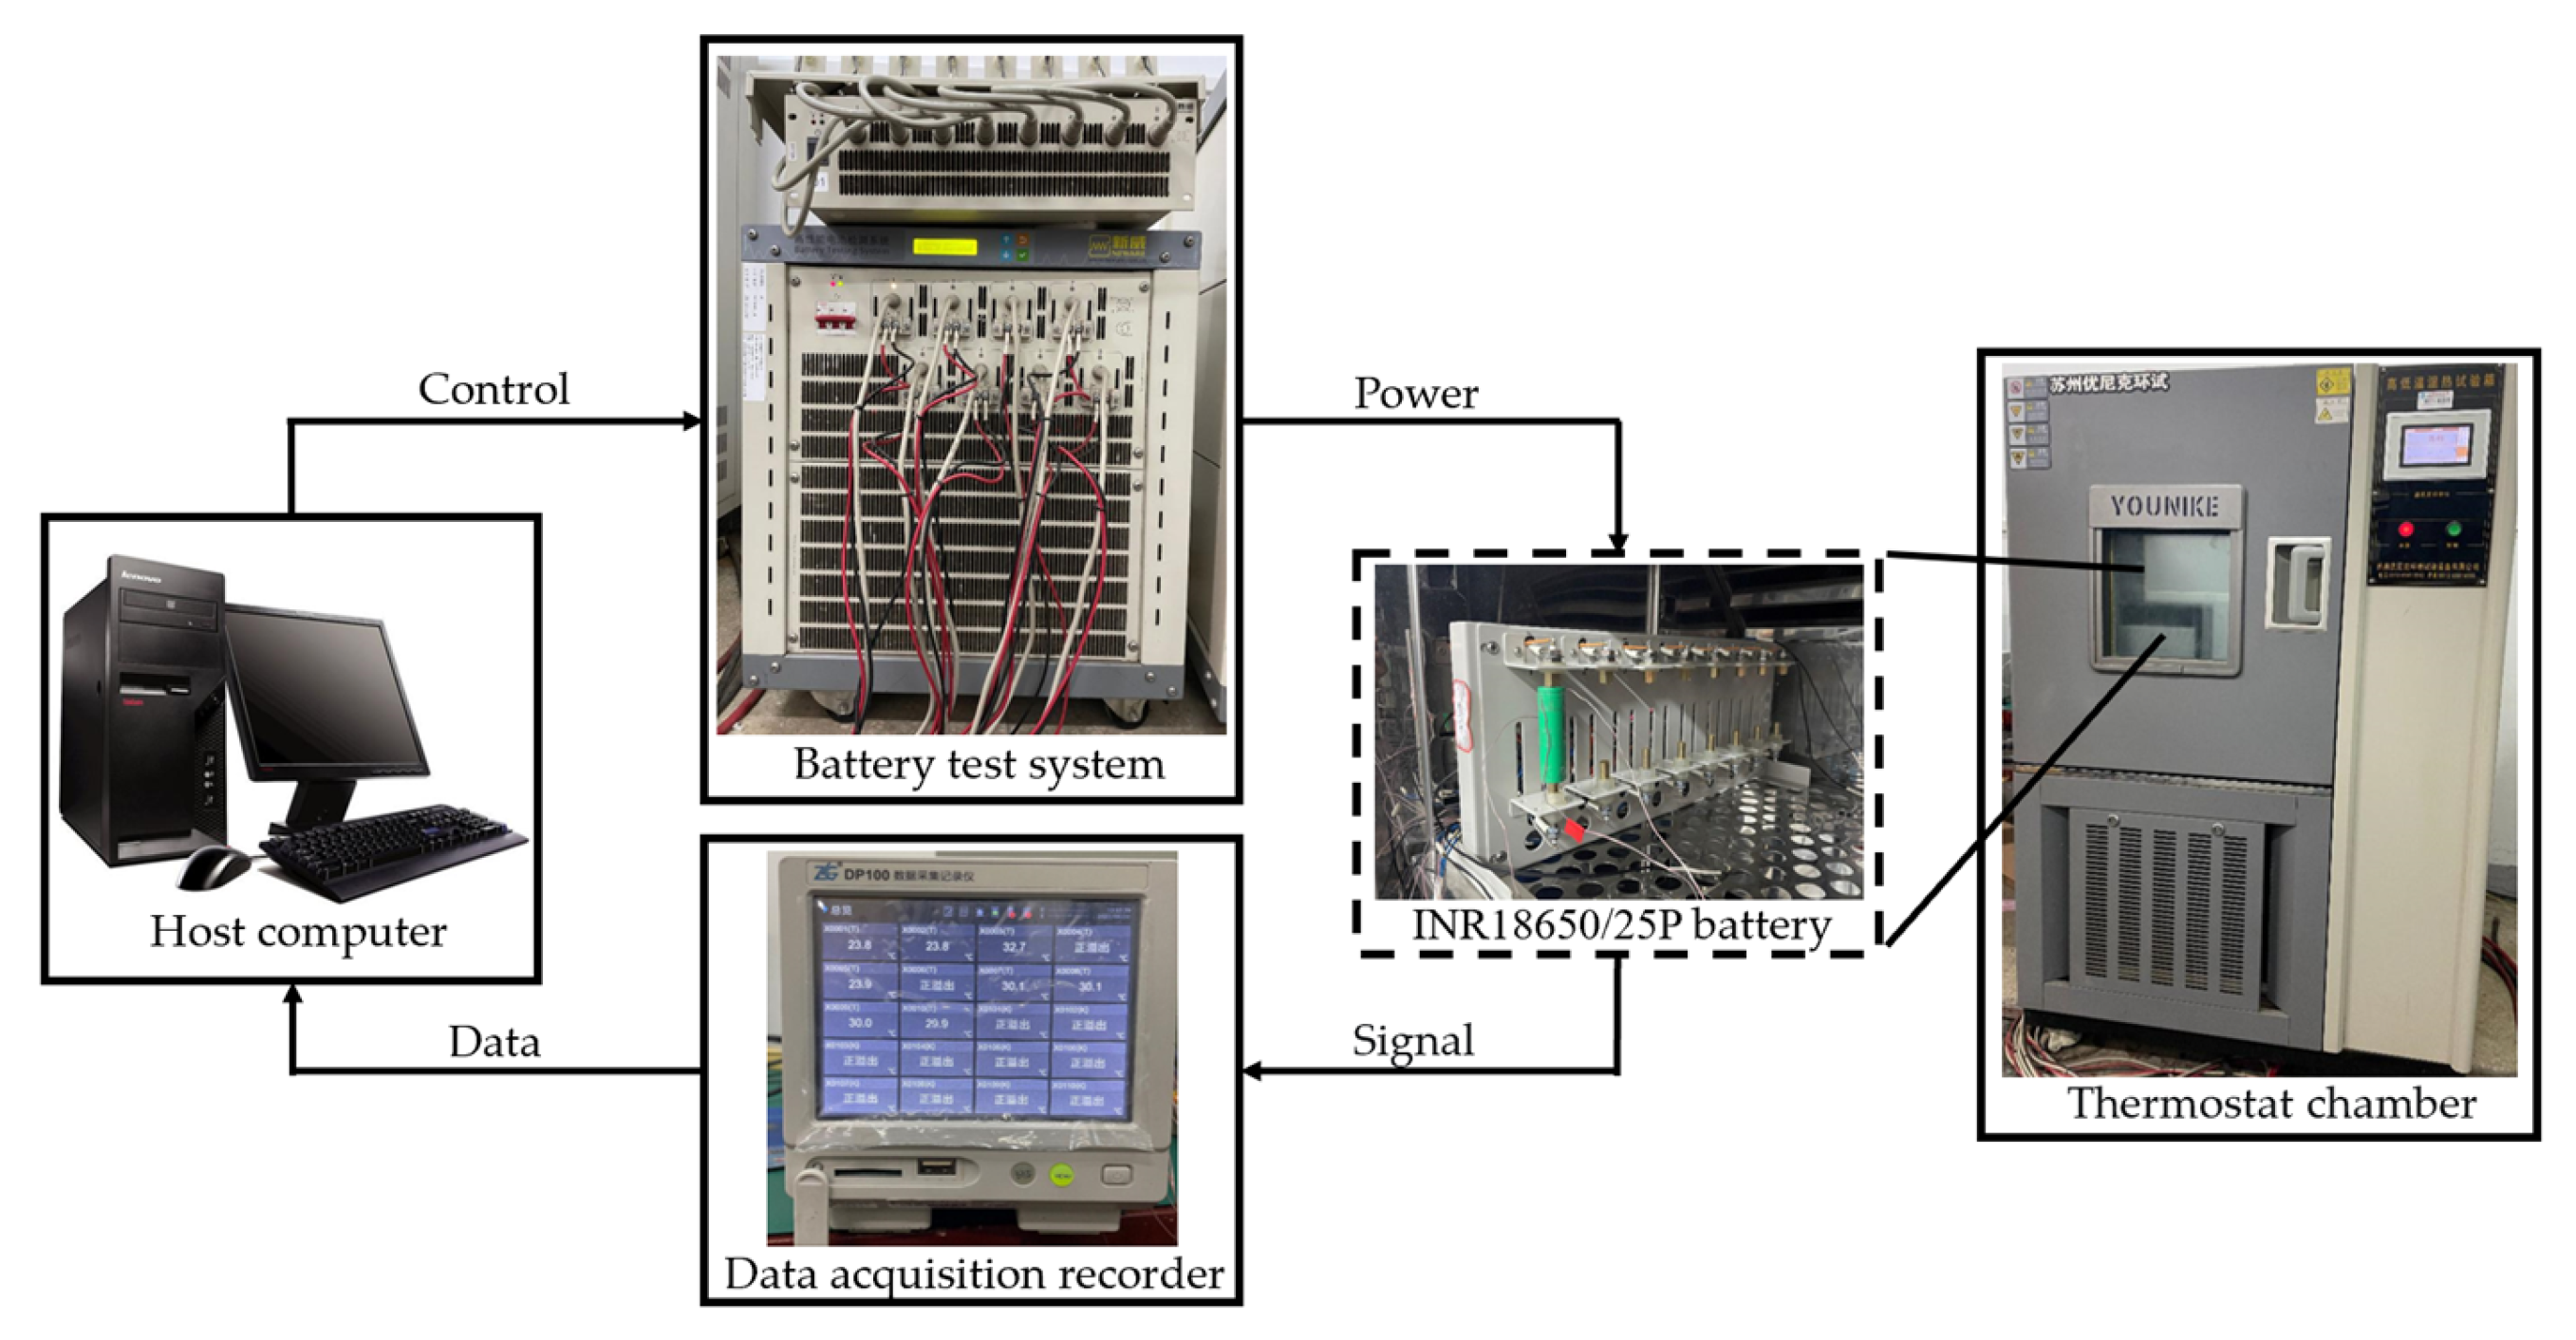
2.1. Experimental Setup

In this experiment, the research object was selected for the INR18650/25P power battery, which can withstand high discharge currents and ambient temperatures. It has a nominal capacity of 2500 mAh in standard charging/discharging mode and can be charged at ambient temperatures ranging from 0 °C to 45 °C and discharged at ambient temperatures ranging from −20 °C to 60 °C. Detailed parameters are shown in Table 1.
As shown in Figure 1, the experimental platform includes a thermostat chamber, a DP100 data acquisition recorder, several T-type thermocouples, a high-performance battery test system (voltage measurement range is 0~5 V and the current measurement range is 0.1~30 A) and a host computer. This test platform has the functions of controlling the ambient temperature, controlling the battery charging and discharging process, obtaining real-time voltage, current and temperature readings, and acquiring data, which can meet the requirements of experiments in this study. Moreover, the accuracies of each equipment in the experimental platform are shown in Table 2.

2.2. Internal Resistance Characteristic Test

Internal resistance is one of the most important indexes to measure the power, life and thermal characteristics of batteries. Due to the complexity of internal and external conditions during the battery utilization, the internal resistance is an unfixed value and changes nonlinearly. So, it is necessary to conduct experimental research for the establishment of a more accurate simulation model. In this paper, hybrid pulse power characterization (HPPC) was used to test the internal resistance of the experimental battery. The test principle is that when the battery is discharged with a pulse current, its voltage will have a step decrease mainly caused by the ohmic resistance. Then, the voltage has a slightly slower drop due to the internal resistance of polarization [36]. The specific experimental steps to measure the internal resistance of lithium-ion batteries at different discharge rates are as follows:
  • The fully discharged battery is placed in a thermostatic chamber with the temperature set at 23.6 °C and then charged completely in a standard charging mode of constant-current and constant-voltage (CCCV). After charging, the battery stands for one hour to keep its temperature consistent with the ambient temperature.
  • Discharge the battery with a pulse current of 1C for 10 s, stop the current and stand for 40 s, and then charge the battery with a pulse current of 0.75C for 10 s; stop the loading current and stand for 40 s again. The change in the open-circuit voltage of the battery is collected and recorded during this process.
  • Discharge the battery at a constant current of 1C until its state of charge (SOC) = 0.9, and stand for one hour to restore the battery temperature to the ambient temperature;
  • Repeat Steps 2 and 3, so that when the SOC of the battery is at 0.1, 0.2, 0.3, 0.4, 0.5, 0.6, 0.7, 0.8, 0.9 and 1, the corresponding voltage abrupt changes can be recorded.
  • Change the discharge current in Step 2 to other discharge rates of 2C, 3C and 5C, and repeat steps 2~4 to measure the total discharge internal resistance under different discharge rates and SOC.
The total internal resistance of the battery under different discharge rates and SOC can be calculated by the voltage changes caused by accepting pulse current in the experiment. The experimental results are shown in Figure 2. On the one hand, it can be concluded that, under the condition of the same ambient temperature and different discharge rates, the corresponding internal resistance of the battery decreases as the discharge rate increases. Because the ionic activity and electrochemical reaction rate of the battery increase with the increase in discharge rate, the ohmic and polarization internal resistance of the battery will decrease. In addition, the relationship between the total discharge internal resistance and SOC at the same ambient temperature and discharge rate can be obtained. When SOC is between 0.1 and 0.3, the internal resistance of the battery evidently decreases with the increase in SOC. When SOC is from 0.3 to 1.0, the internal resistance of the battery is stable. The reason for this phenomenon is that when the battery possesses medium or high capacity, the ohmic resistance takes up a large percent of the battery’s internal resistance and does not noticeably change with the variation in SOC. Furthermore, when the battery is at a low capacity, the ratio of battery polarization resistance increases, which obviously varies with the change in SOC. This HPPC test is carried out under a controlled environmental temperature condition. To obtain more accurate results, the establishment of isothermal conditions (uniform cell surface temperature) in the literature [8,37] can be referred to.

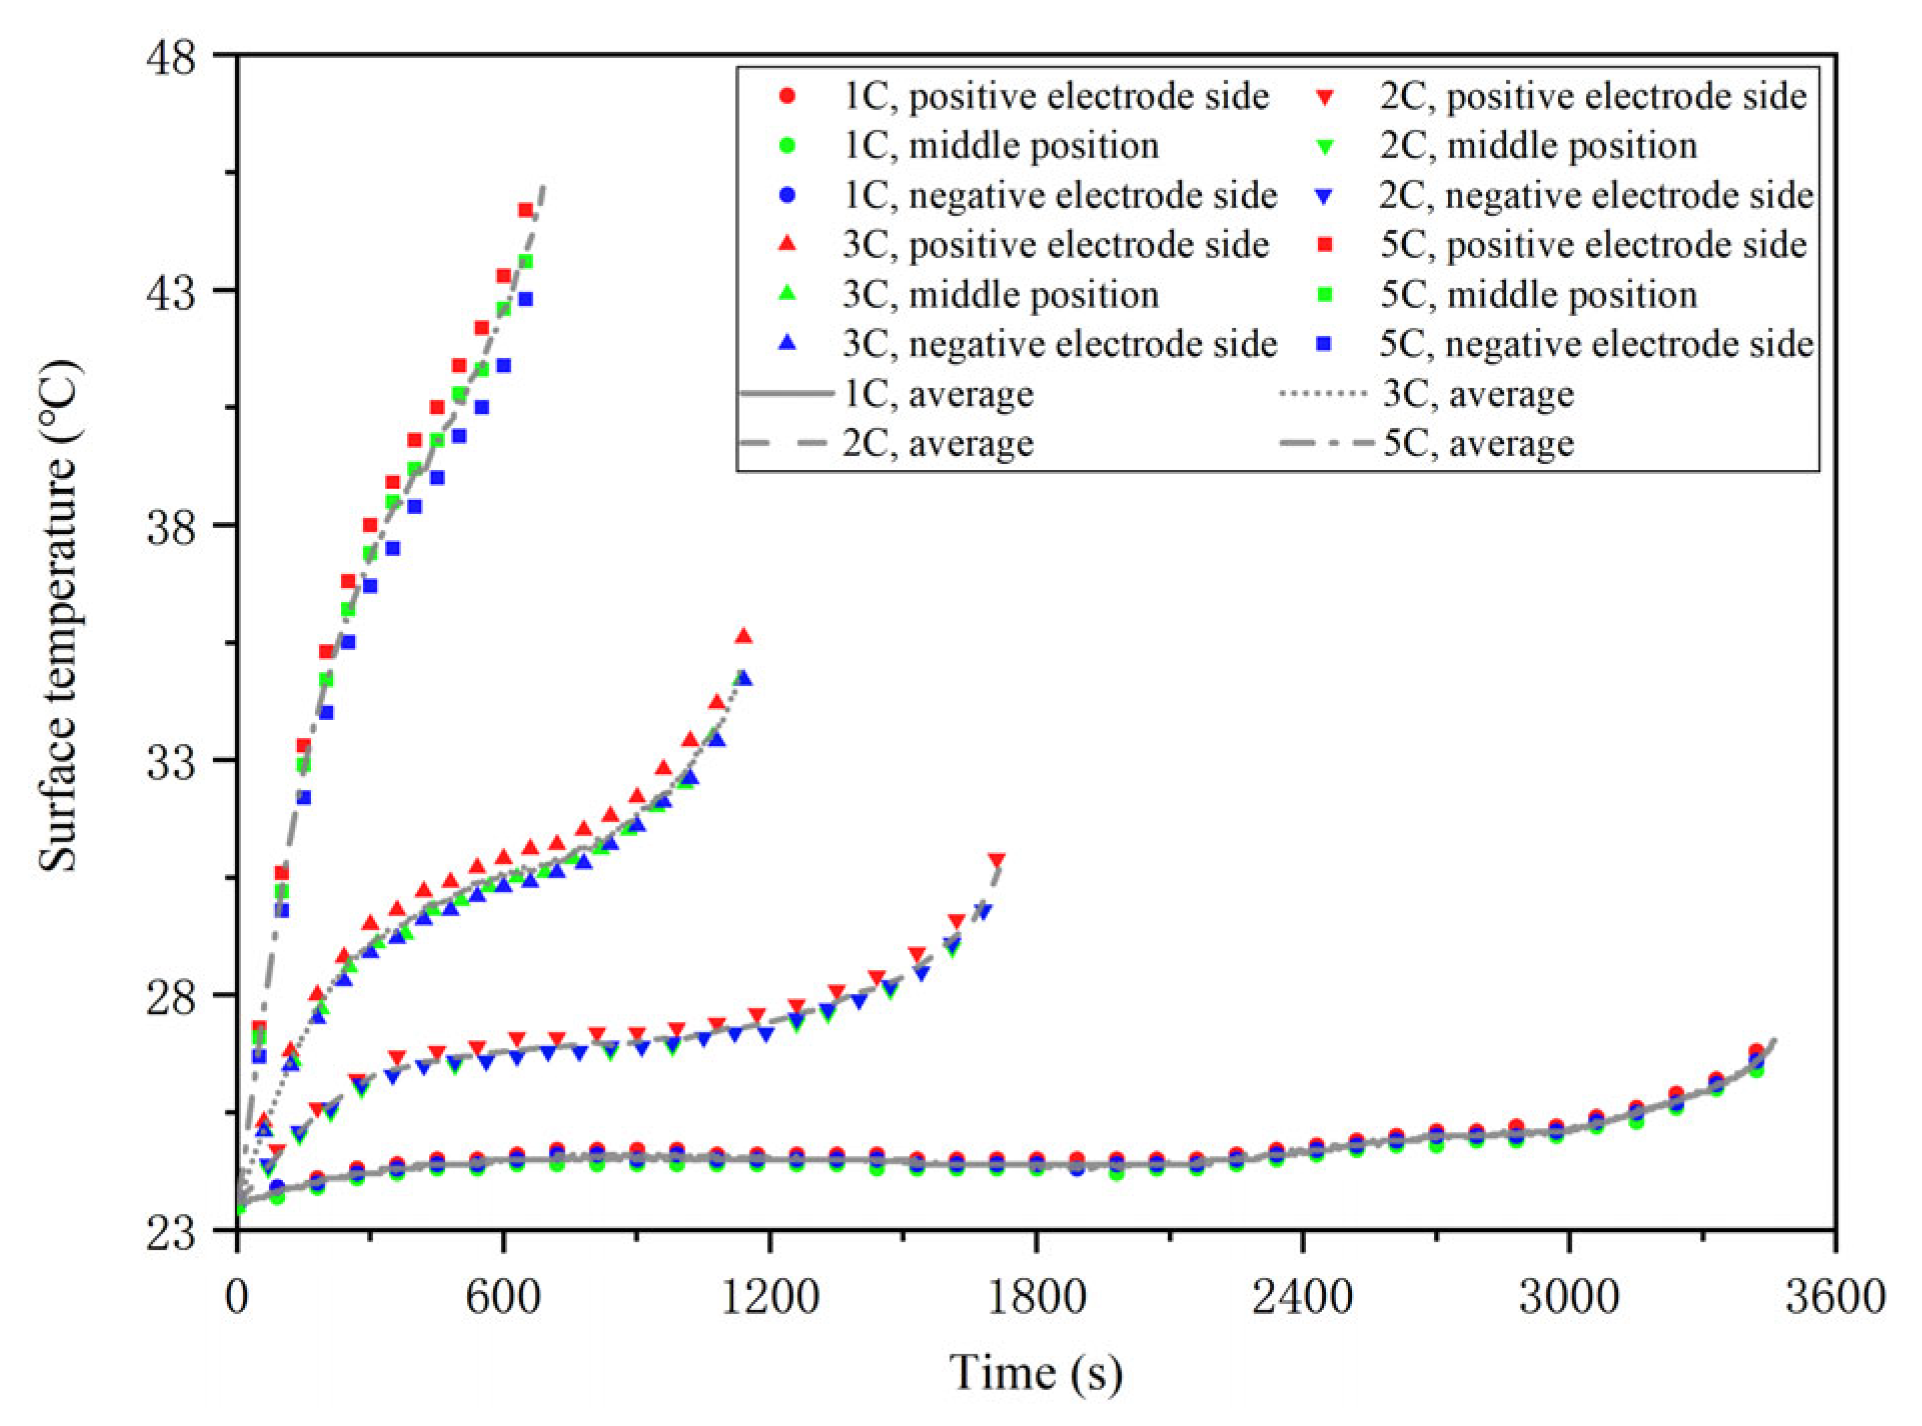
2.3. Temperature Rise Characteristic Test

The temperature rise characteristic test of the battery was carried out to obtain the temperature rise in the experimental battery at different discharge rates. Three thermocouples were placed at the positive, negative and intermediate positions of the battery to prevent accidental error in the process of temperature measurement. In this way, the difference in temperature change at different positions of the battery and the average temperature rise in the battery surface could be obtained and estimated. Using the experimental platform built above, the temperature increment and current and voltage changes in the battery discharging at different rates under the 23.6 °C ambient temperature were measured. The detailed steps are as follows:
  • The fully discharged battery is placed in a thermostatic chamber at 23.6 °C for one hour to make its temperature stable and consistent with the ambient temperature.
  • Charge the battery with a constant current of 1.6C rate until the voltage reaches the charging cut-off voltage of 4.2 V, and then charge with a constant voltage of 4.2 V until the current achieves the charging cut-off current of 0.1 A.
  • Place the fully charged battery in the thermostat for one hour again so that the battery temperature keeps in line with the ambient temperature of 23.6 °C.
  • Discharge the battery at 1C constant current until the voltage reaches the discharge cut-off voltage of 2.5 V. Meanwhile, the temperature change in the battery at each thermocouple is monitored and recorded in real time.
  • Repeat steps 1~4 and adjust the intensity of constant current in step 4 to 1C, 2C, 3C and 5C, respectively, until all experiments are completed.
According to the experimental results, although there are some differences in the temperature values measured by the thermocouples at the three positions, represented in the scatter diagram in Figure 3, the range of variation is small. Therefore, the mean value of the temperature measured by the three thermocouples is used as the experimental result in this paper. The average temperature rise in the battery when discharging at different current rates can be obtained as the line graph shown in Figure 3. It can be found that, under the same ambient temperature, the higher the discharge rate of the battery is, the higher the temperature rise will be because the heat generation of the battery is the square term of the current. When the discharge current rate increases, the heat generation of the battery increases sharply. In addition, it shows that the maximum battery temperature rises rapidly, then gently, and finally rapidly in the discharge process. The cause of this change is as follows. In the early stage of discharge, the heat generation rate of the battery is large, and its temperature is low, so the temperature rise trend is obvious in the early stage. In the middle stage of discharge, the battery temperature has a significant difference from the ambient temperature, so the convective heat transfer between the battery and the environment is strong, which makes the temperature rise trend more gentle. When the discharge enters the late stage, the battery’s internal polarization resistance increases rapidly, increasing the total internal resistance, so the battery temperature rises rapidly again.

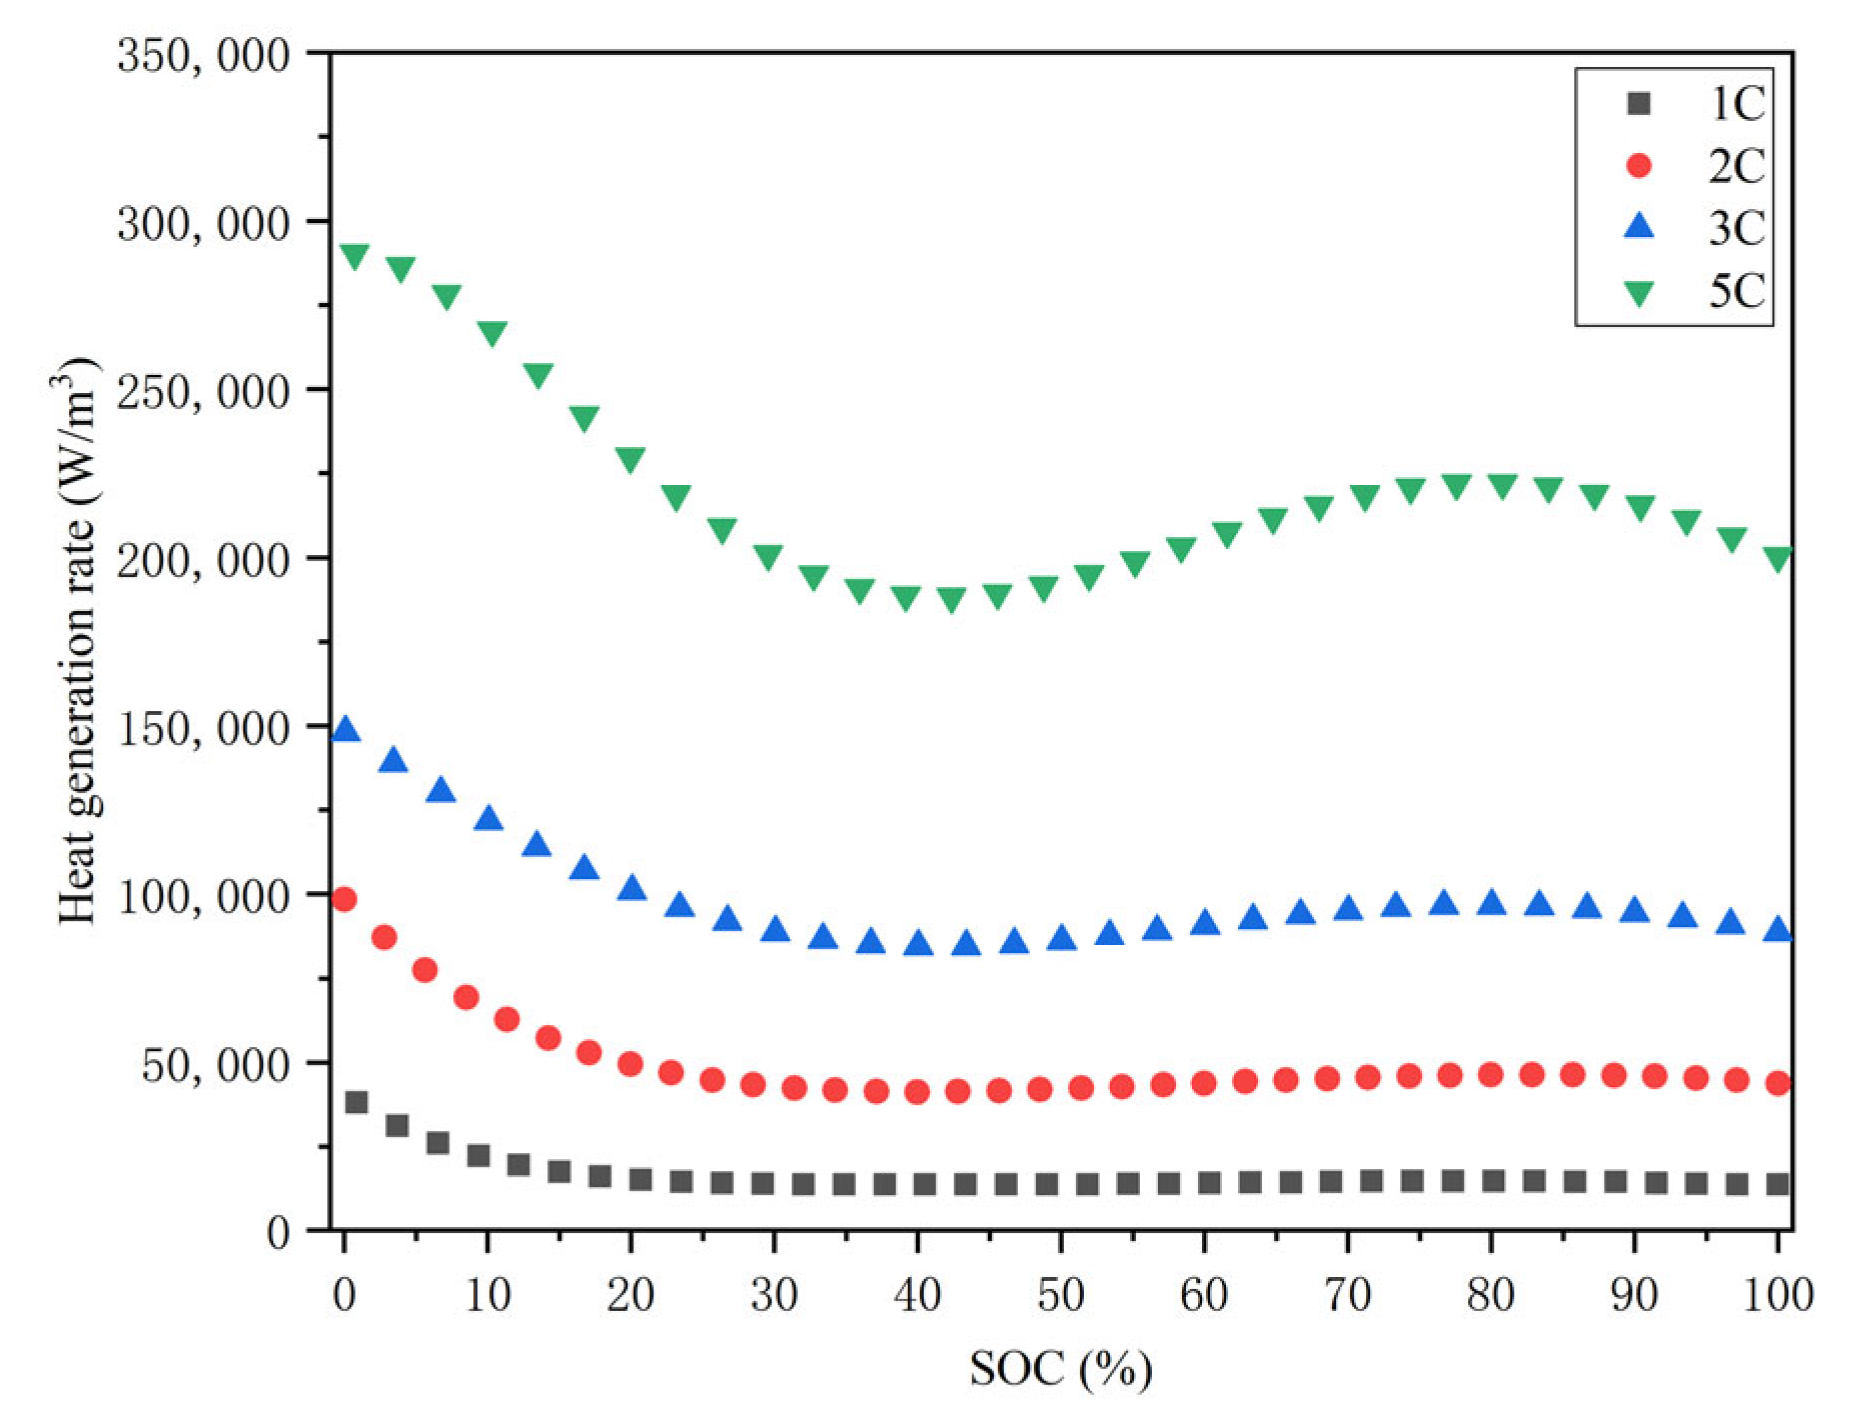
2.4. Heat Generation Rate of Single Battery

The volume heat generation rate of lithium-ion batteries is necessary for the simulation of the thermal behavior of the battery pack. Therefore, the parameters at different discharge rates were obtained through the above experiments in this section. However, the heat generation rate of the battery is affected by many indicators, such as the battery SOC, charging and discharging current rates, etc., and it has a high degree of nonlinearity. Generally, the heat generation model proposed by Bernardi is used to quantitatively describe the heat generation of lithium-ion batteries [38]:
Q v = I V b U ocv U + I V b T d U ocv d T
where  Q v  is the volume heat generation rate of the battery, W/m3 I  is the current flowing through the battery, A;  V b  is the battery volume, m3 U ocv  is the battery open circuit voltage, V;  U  is the battery terminal voltage, V; and  d U ocv / d T  is the temperature entropy coefficient of the battery, which can be approximately regarded as a constant in the working process of the battery.
The relationship between the total internal resistance of the battery and SOC at different discharge rates could be obtained by fitting the previous results of internal resistance characteristic tests. Moreover, the corresponding data of current, terminal voltage, temperature and time at different discharge rates could be obtained from the temperature rise experiment. The battery volume could be calculated from Table 1, and the open-circuit voltage could be obtained by adding the terminal voltage and the voltage caused by the internal resistance. Therefore, the volume heat generation rates of the battery under different discharge rates can be obtained in Figure 4.
The relationship between the battery SOC and discharging time is shown as follows:
SOC = 1 η 0 t I d t Q c × 100 %
where  t  is the full charge/discharge time of the battery, s;  η  is the battery charge/discharge efficiency;  Q c  is the battery’s nominal capacity, mAh; SOC can be defined as the ratio of the current remaining capacity of a battery to its nominal capacity; and 0% and 100% indicate the fully discharged and charged state of the battery.
Combined with Equation (2), the expression and coefficients of the heat generation rate equation can be conversed and obtained by polynomial fitting, as shown in Table 3. Then, the corresponding heat transfer simulation will be completed by COMSOL software, which can carry out multi-physical field coupling simulation.

3. Numerical Model

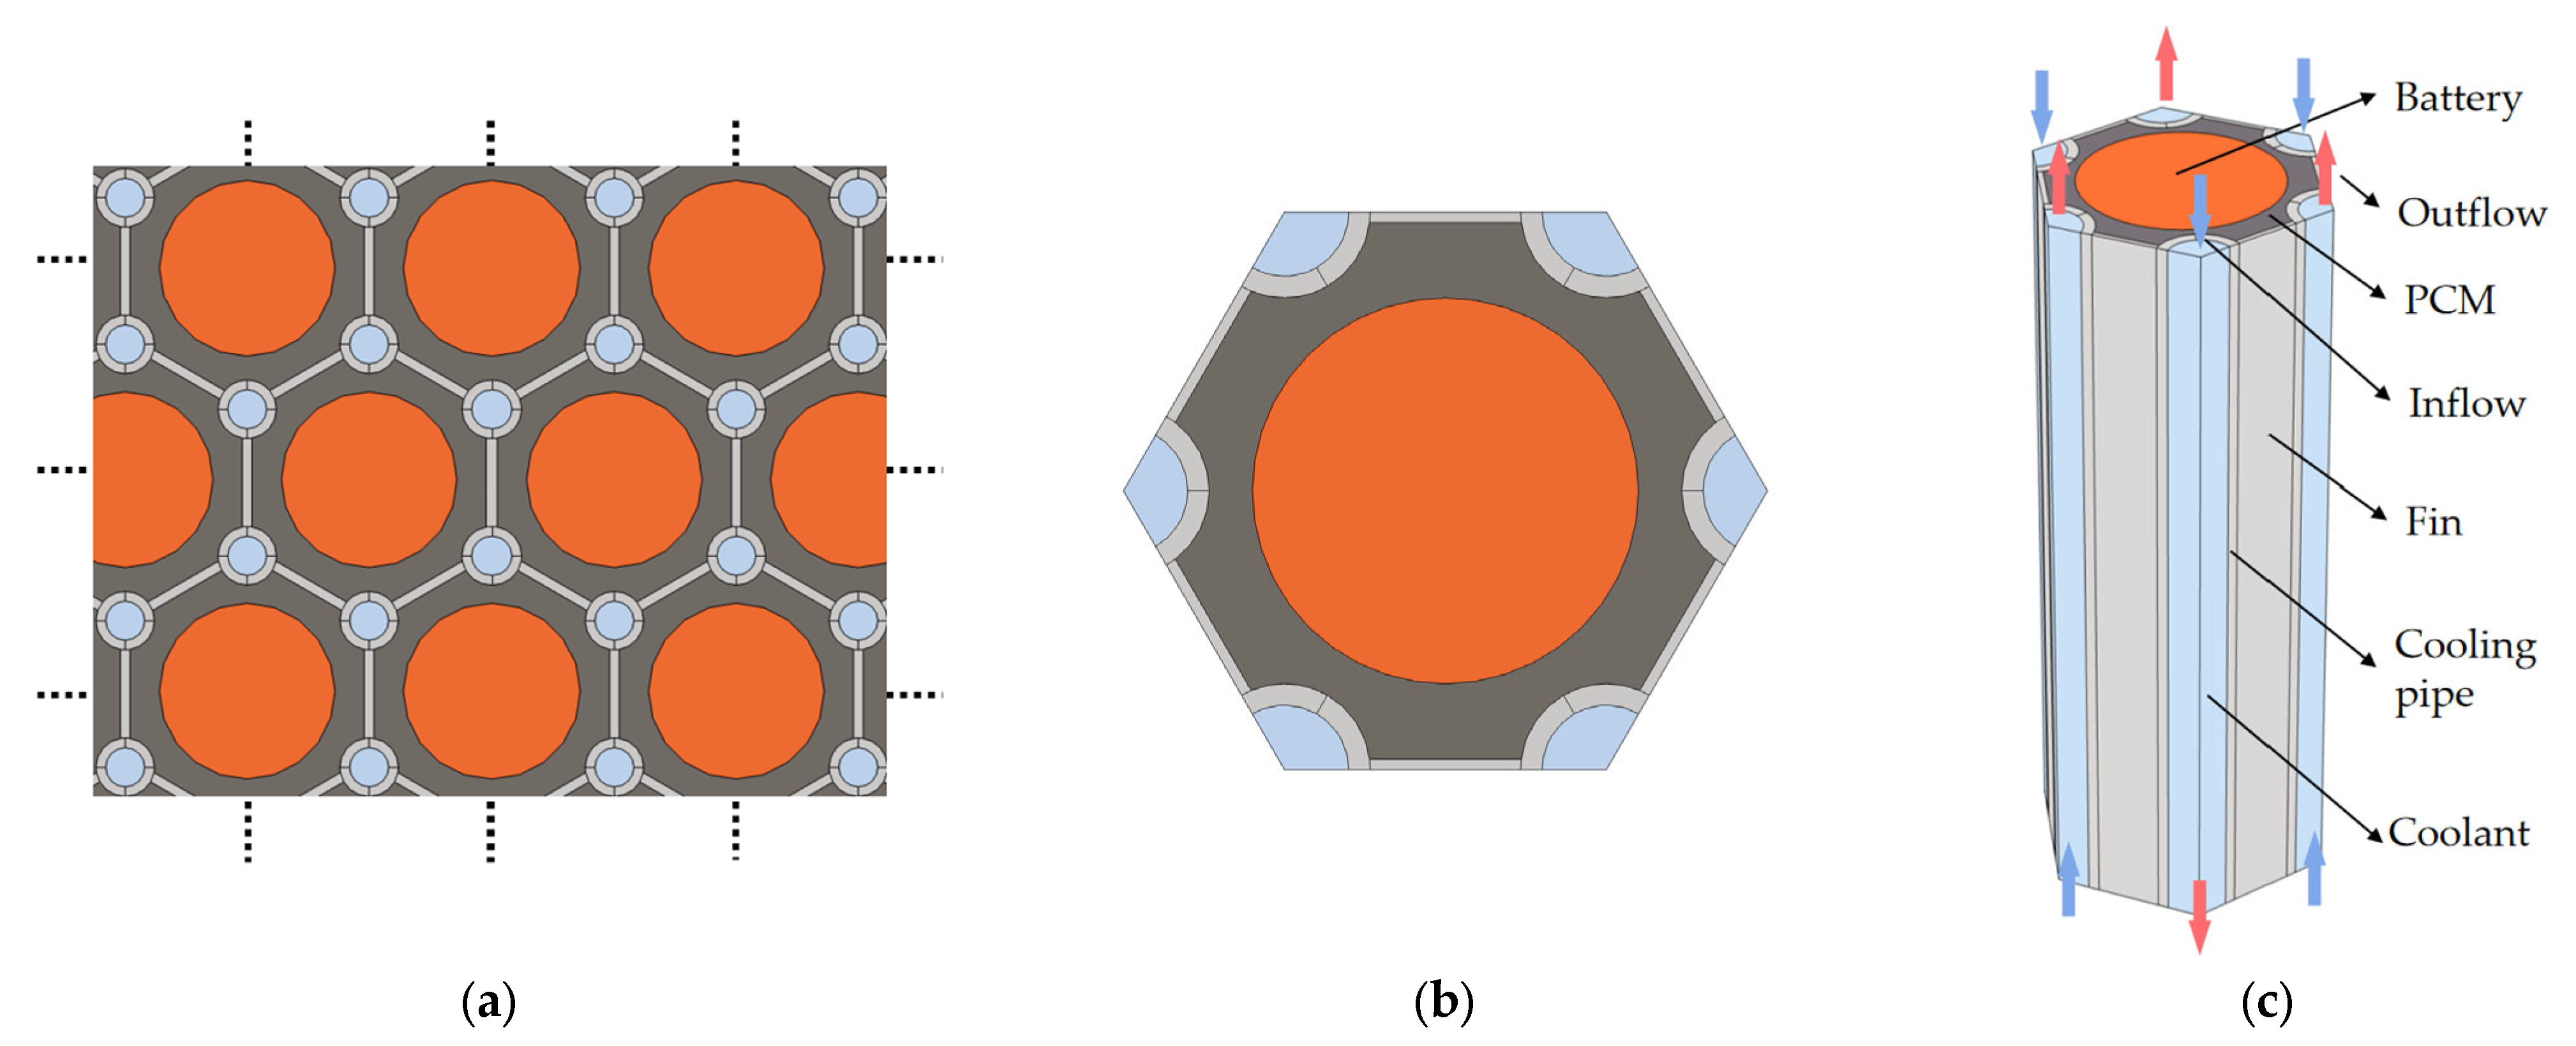
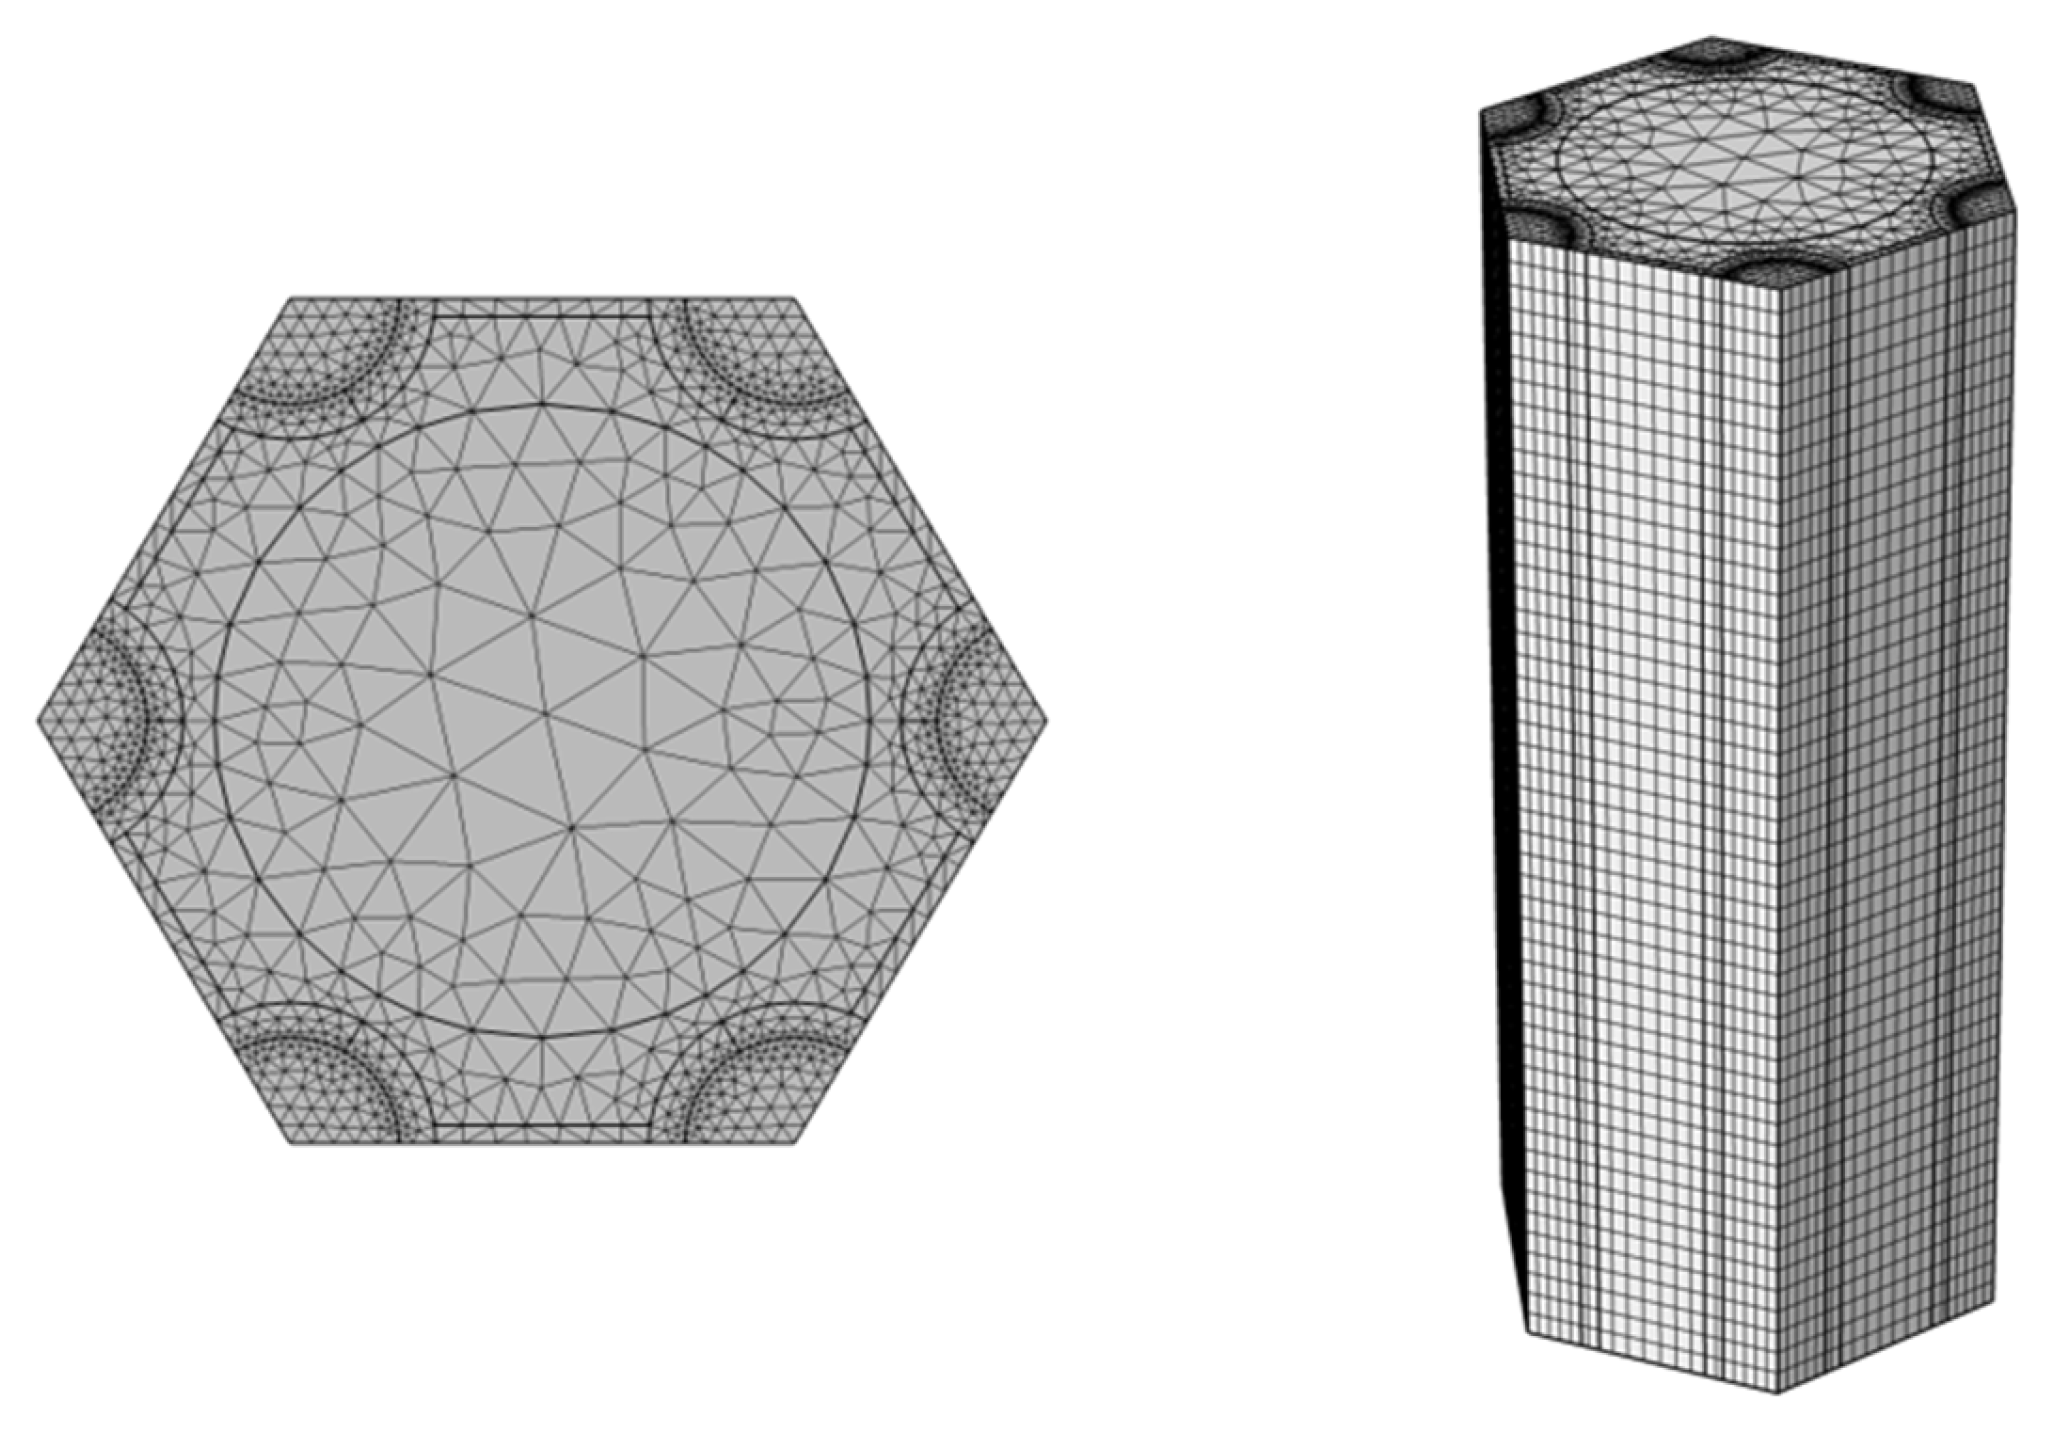
3.1. Geometric Model

To better study the parameters’ influence of liquid cooling and PCM on batteries, the shell of the battery pack is removed, and the geometric model of the honeycomb-structured BTMS is presented in Figure 5a. Due to its strong regularity and repeatability, a simplified heat transfer model representing the thermal performance of the central region of the battery pack can be obtained in Figure 5b. Furthermore, the detailed structure and composition of the simplified model are shown in Figure 5c.
The proposed BTMS model has a compact structure and uniform heat dissipation and can prevent leakage of liquid PCM [39]. To some extent, it can also reduce the harm of battery thermal runaway [40]. The battery is surrounded by PCM, whose outer layer is the proposed honeycomb-shaped structure which consists of liquid cooling tubes (with an inner diameter of 6 mm and an outer diameter of 8 mm) and fins (with a thickness of 1 mm). Moreover, the honeycomb structure is made of aluminum, the coolant used in liquid cooling is water, and the external environment is air. Meanwhile, it is assumed that the material distribution is uniform, the specific heat capacity and thermal conductivity are constant, and the heat generation rate inside the battery and at the pole ear is consistent. The calculation of the equivalent thermal conductivity of the battery can refer to the calculation method of equivalent resistance. The relevant thermal physical property parameters of each part of the BTMS simulation model can be obtained, as shown in Table 4.
The current BTMS module can be fabricated by the following steps. First, the aluminum honeycomb structure can be casted by a dedicated mold. Then, the batteries are installed in each honeycomb unit, and housed in the module casing with the baseplate, side panels and top cover. After that, the composite PCM will be filled in the void space between the batteries and the honeycomb structure.

3.2. Mathematical Model

3.2.1. Lithium-Ion Battery Model

Mathematical models of lithium-ion batteries include heat generation and heat transfer models. The total heat generation of batteries comprises Joule heat, reaction heat, polarization heat and side reaction heat. Among them, Joule heat is generated by the current passing through the inherent and contact resistances of battery parts. Reaction heat refers to the energy change during the occurrence of electrochemical reactions. Polarization heat means the heat generated by the internal polarization resistance of the battery when passing through current. When use conditions are relatively routine, the proportion of side reactions is small, so the corresponding side reaction heat can be ignored [41]. In practical applications, the Bernardi formula is usually used to establish the heat generation model of the battery, as shown in Equation (1).
A certain proportion of the heat generated by lithium-ion batteries will be absorbed by itself, while the other part will be transferred to the environment through three ways of heat transfer, including convection, conduction and radiation. The radiation heat transfer is relatively small and can be ignored, and the convective heat transfer can also be neglected due to the poor fluidity of electrolytes. Therefore, heat conduction is mainly considered. Combining Fourier’s law with the law of energy conservation, the thermal conductivity differential equation can be obtained as follows:
ρ b c p , b T b t = λ b x 0 0 0 λ b y 0 0 0 λ b z T b + Q v
where  ρ b  is the battery equivalent density, kg/m3 c p , b  is the battery specific heat capacity at constant pressure, J/(kg·K);  λ b x λ b y  and  λ b z  are the battery thermal conductivity in spatial coordinate axis, W/(m·K); and  Q v  is the heat generation rate of the battery, W/m3.

3.2.2. Composite Phase Change Material Model

PCM absorbs and stores the heat released by the battery through two-phase conversion. The phase transition process is divided into three stages: (1) when the temperature of PCM is lower than the melting temperature, the absorbed heat will be stored in the form of sensible heat; (2) when the temperature of PCM is higher than the melting temperature, PCM will undergo the phase transition and consume its latent heat; (3) when the latent heat of PCM is exhausted, the phase transition process ends. Due to the high viscosity and the small temperature difference in PCM under the working conditions involved, the natural convection heat transfer term is neglected. The energy balance equation involved is as follows:
ρ PCM c PCM T PCM t = λ PCM T PCM
where  T PCM  is PCM temperature, K;  ρ PCM  is PCM density, kg/m3 c PCM  is the specific heat capacity of PCM, J/(kg·K); and  λ PCM  is the thermal conductivity of PCM, W/(m·K).
Moreover, because the polyphase transformation of PCM is difficult to describe accurately by experiments, the mathematical model of CPCM should be established. The following assumptions are made: (1) The physical properties of each part of CPCM are constant. (2) CPCM is incompressible in the liquid phase and has Newtonian properties. (3) The material inside the CPCM is uniform, and the thermal conductivity in all directions is the same. For the thermal conductivity of CPCM, the Ling model [42] and the Maxwell-Eucke model [23] can be used for calculation. This paper adopted the Ling model, which considered the CPCM density and the EG mass fraction, and its formula is as follows:
λ eff , CPCM = λ EG ρ CPCM ω EG ρ EG
where  λ eff , CPCM  and  λ EG  are the thermal conductivity of composite PCM and EG, respectively, W/(m·K);  ρ CPCM  and  ρ EG  are the densities of composite PCM and EG, respectively, kg/m3; and  ω EG  represents the mass fraction of EG.
In addition, the latent heat of CPCM can be obtained by the mass weighting method, and its calculation formula is as follows:
L CPCM = L PA 1 ω EG
where  L CPCM  and  L PA  are the latent heat of CPCM and paraffin, respectively, kJ/kg.
Moreover, the specific heat capacity of CPCM can be calculated by the formula:
c p , CPCM = c p , PA 1 ω EG + c p , EG ω EG
where  c p , CPCM , c p , PA  and  c p , EG  are the specific heat capacity of CPCM, paraffin and EG, respectively, J/(kg·K).
Based on the experimental studies on the preparation of CPCM and the Ling prediction model in the literature, the thermophysical parameters of a PA/EG-type CPCM with different EG mass fractions used in this study can be obtained in Table 5.

3.2.3. Liquid Cooling Model

In this paper, cooling pipes and water are selected as the structure and coolant of liquid cooling, respectively. According to the calculation, the Reynolds number of each simulation condition is less than 2300, so the laminar flow model is adopted in the simulation. The governing equations related to liquid cooling, including the conservation equations of mass, momentum and energy, are shown as follows:
ρ c t + ρ c u = 0
ρ c u t + ρ c u · u = p + μ u + u Τ
ρ c c p , c T t + ρ c c p , c u T = λ c T
where  ρ c c p , c  and  λ c  represents the density, specific heat capacity and thermal conductivity of coolant, whose units are kg/m3, J/(kg·K) and W/(m·K), respectively;  u p  and  μ  represent the vector velocity, static pressure and dynamic viscosity of coolant, whose units are m/s, Pa and N·s/m2, respectively. The cooling medium of liquid cooling is water, which has incompressibility.

3.3. Boundary Conditions

As for the heat transfer part, the boundary conditions of each side surface of the simplified BTMS model are symmetric because the battery unit is surrounded by the same cooling unit before simplification. The heat transfer modes among batteries, PCM, honeycomb-shaped structure and coolant are heat conduction and convection, and the interface and boundary conditions are as follows:
λ b T b n b = λ PCM T PCM n PCM
λ PCM T PCM n PCM = λ h T h n h
λ h T h n h = h c T h T c
where  λ b λ PCM  and  λ h  are the thermal conductivity of battery, PCM and honeycomb structure, respectively, W/(m·K);  h c  is the convective heat transfer coefficient between the coolant and the wall of liquid cooling tubes, W/(m2·K);  T b T PCM T h  and  T c  are the temperatures of battery, PCM, honeycomb structure and coolant, respectively, K; and  T / n  is the temperature gradient of each material along the normal direction of the outer surface.
As for the boundary conditions of laminar flow, since the coolants in the simplified BTMS model are divided into three parts, symmetrical boundary conditions should be set for the two sides of each fluid region to simulate the flow effect in the whole tube. The result shows that the flow velocity of coolant presents high velocity in the center area and low velocity on the walls along the radial direction, which conforms to the flow rate distribution law caused by the viscous action of liquid flowing in the pipe.

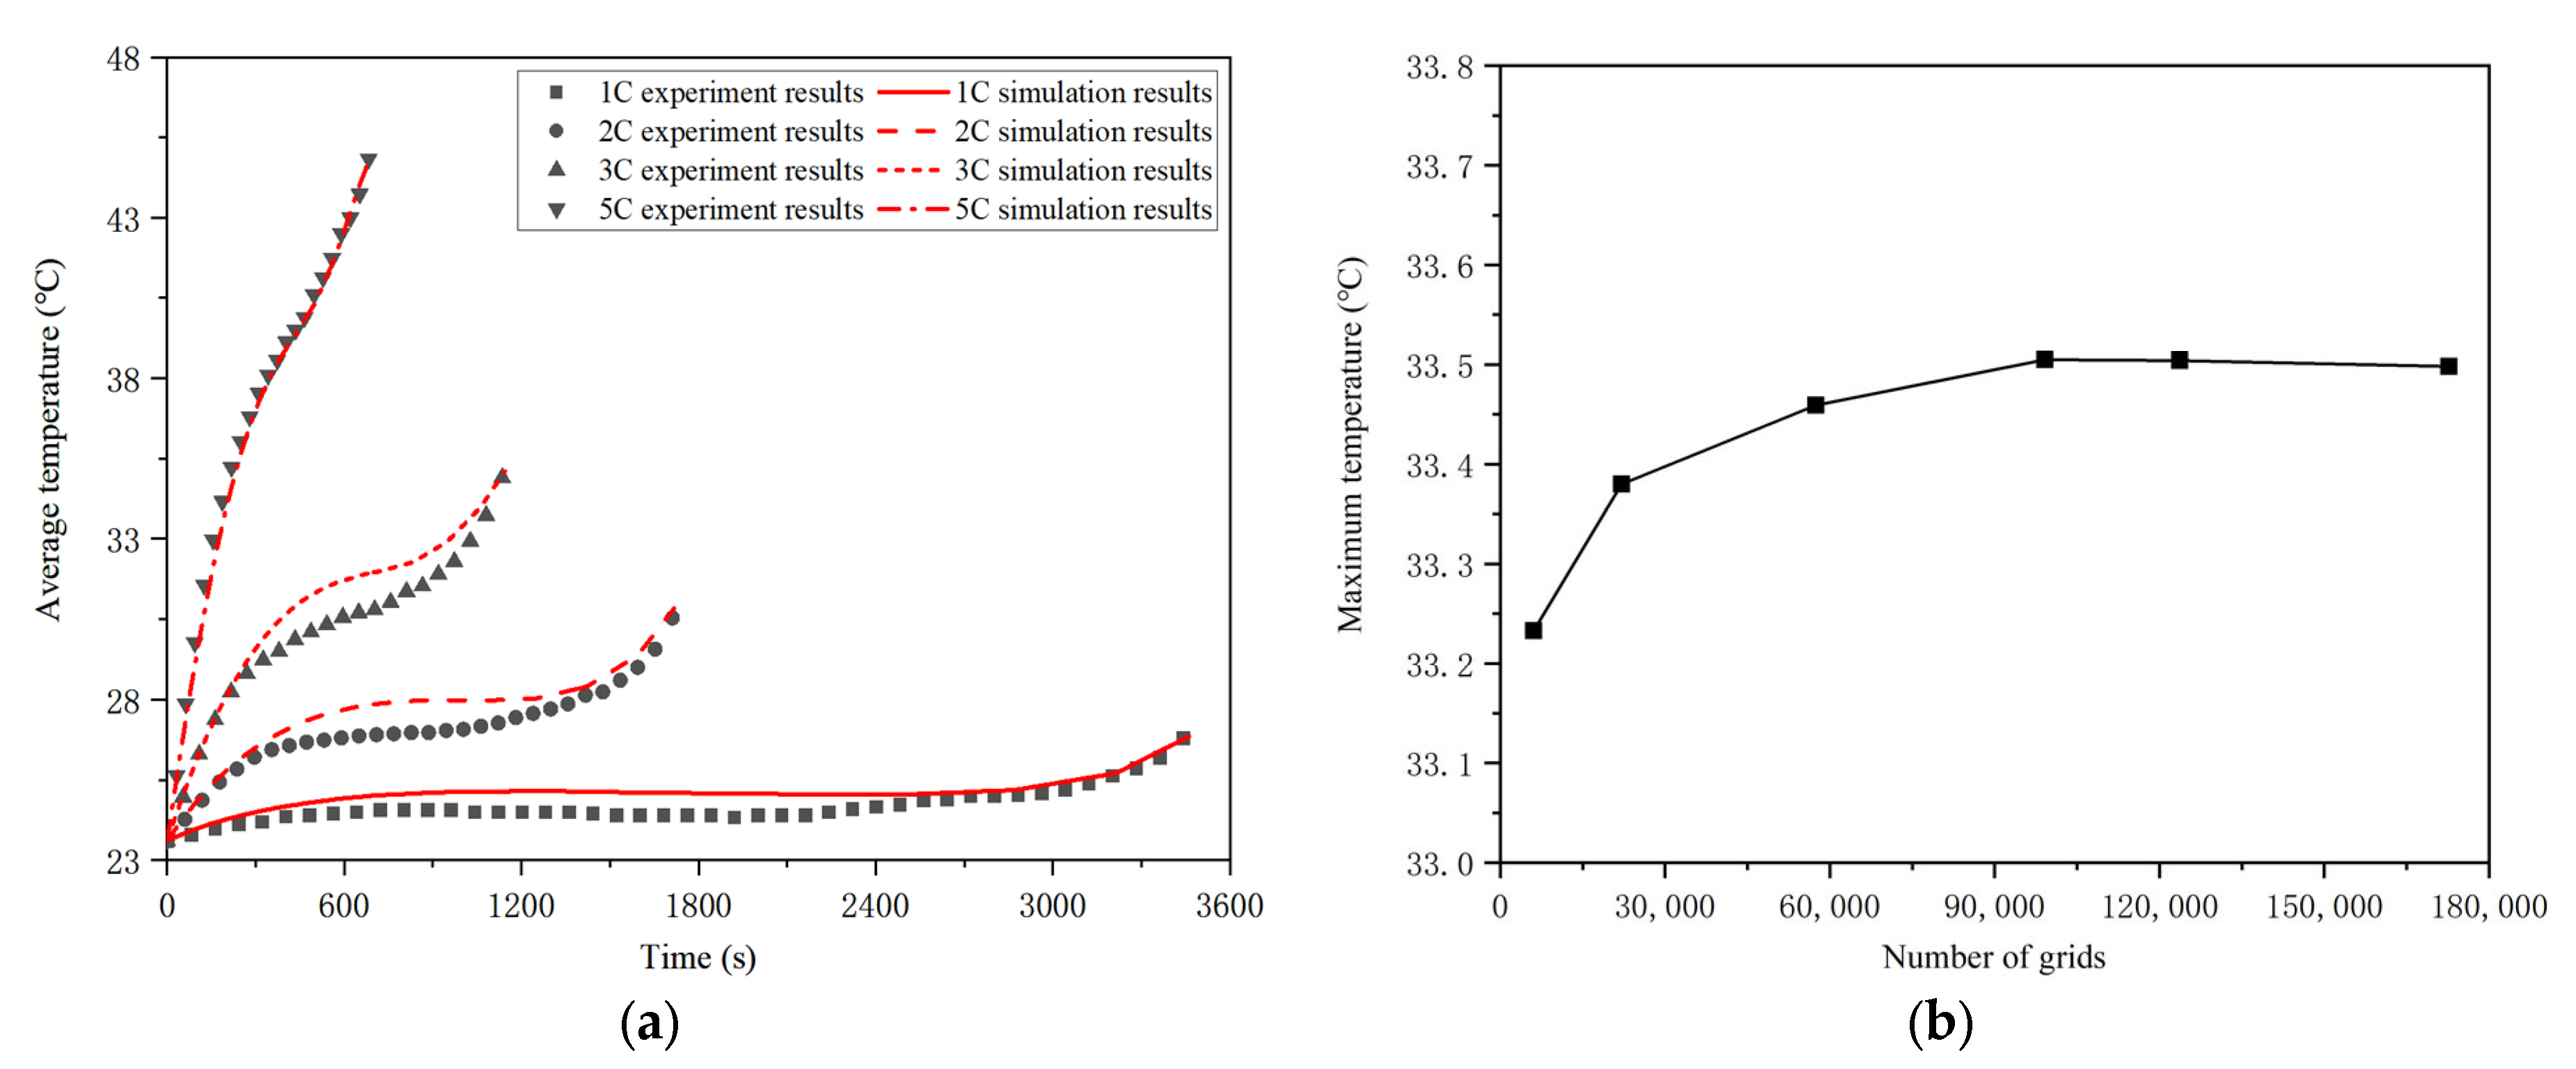
3.4. Model Verification

The simplified BTMS model based on honeycomb-structured liquid cooling and PCM involves complex structures and simulation modules such as solid and fluid heat transfer, laminar flow and fluid-solid coupling. Hence, each region needs to finely mesh to ensure calculation accuracy. The fluid region meshes first, and then the solid regions of the end face are divided, and finally, the whole end face is used as the source plane to carry out the sweep operation. A computational grid model with 99,200 cells is obtained in Figure 6, which is evenly distributed in vertical and horizontal directions.
The simulation model of the single battery is established by COMSOL to predict the heat generation and heat transfer characteristics. To verify this model, the simulations are conducted at 23.6 °C ambient temperature and 1C, 2C, 3C and 5C discharge rates. Moreover, the simulation results are compared with the consequences of temperature rise characteristic tests in Section 3.2, as shown in Figure 7a. It indicates that the maximum relative errors of the simulation model for the battery temperature prediction are around 4% during the universe discharging process, which meets the accuracy requirements. When the discharge rate is 1C, 2C, 3C and 5C, the values of root mean square error (RMSE) between the experimental and simulation results is 0.45, 0.60, 0.75 and 0.38, respectively. In addition, to verify the grid independence of the simplified BTMS model, different grid numbers are also simulated and compared under an ambient/coolant temperature of 23.6 °C, discharge rate of 5C, mass fraction of EG of 12% and coolant flow velocity of 0.1 m/s. The relationship between the number of grids (6060, 22,116, 57,478, 99,200, 123,700, 172,700), and the maximum temperature of the battery is obtained in Figure 7b. When the number of grids increases from 6060 to 99,200, the maximum battery temperature changes noticeably, nearly 0.27 °C. However, when the number of grids increases from 99,200 to 123,700 or 172,700, the maximum battery temperature does not change and stabilizes at 33.5 °C. Therefore, a simulation model with a grid number of 99,200 is chosen to balance the calculation accuracy and time consumption.

4. Results and Discussion

4.1. Effects of the Honeycomb Structure

The simulation and comparative analysis of battery packs with different honeycomb cooling structures (three/six liquid cooling tubes, with or without fins) under diverse environment/coolant temperatures (23.6 °C, 30 °C, 35 °C and 40 °C) are conducted to study the influence of the proposed honeycomb structure on the maximum temperature, maximum temperature difference and temperature distribution of batteries. In addition, the basic simulation conditions were set as 25 mm battery spacing, counterflow coolant, 0.1 m/s flow rate of coolant and a 5C high discharge rate. Battery spacing is the distance between two adjacent battery centers in the honeycomb-structured BTMS, mm.
The maximum temperature and temperature difference in the battery cooled by each honeycomb structure at different ambient temperatures are shown in Figure 8a,b. When the ambient temperature is the same, the maximum temperature and maximum temperature difference in the BTMS with honeycomb fins are significantly better than those without fins, regardless of whether three or six liquid cooling tubes are used. The fin structure can lead to a decrease in the maximum temperature and temperature difference in the battery by as much as 3.3 °C and 2.8 °C at 23.6 °C ambient temperature, respectively, and a decrease of 0.15 °C and 0.2 °C at 40 °C ambient temperature, respectively. Figure 9a,c show the phenomenon of high temperature and temperature differences caused by local heat concentration. To solve this issue, the high thermal conductivity honeycomb fins are directly connected to the liquid cooling pipes, which allows the surrounding area of the battery to be cooled evenly, as shown in Figure 9b,d. In addition, the maximum temperature and temperature difference in the battery corresponding to the six liquid cooling tubes is lower than those of the three tubes, which is caused by increased cooling sources around the battery. Additionally, it can be seen that with the increase in the external temperature, the corresponding maximum temperature of the battery under different structures will increase. In contrast, the maximum temperature difference will decrease. Because PCM plays a leading cooling role at high temperatures and possesses a large melting temperature range, the BTMS has a better temperature uniformity.
According to the above analysis, the honeycomb structure proposed in this paper can significantly improve the maximum temperature and maximum temperature difference in the battery. Moreover, with the decrease in ambient temperature and the enhancement of the liquid cooling effect, the comprehensive cooling effect of the BTMS will be stronger. In the following research, the honeycomb-structured BTMS with good thermal performance will be used as the basis to analyze the influence of other structures, materials and operating parameters on the thermal performance of batteries.

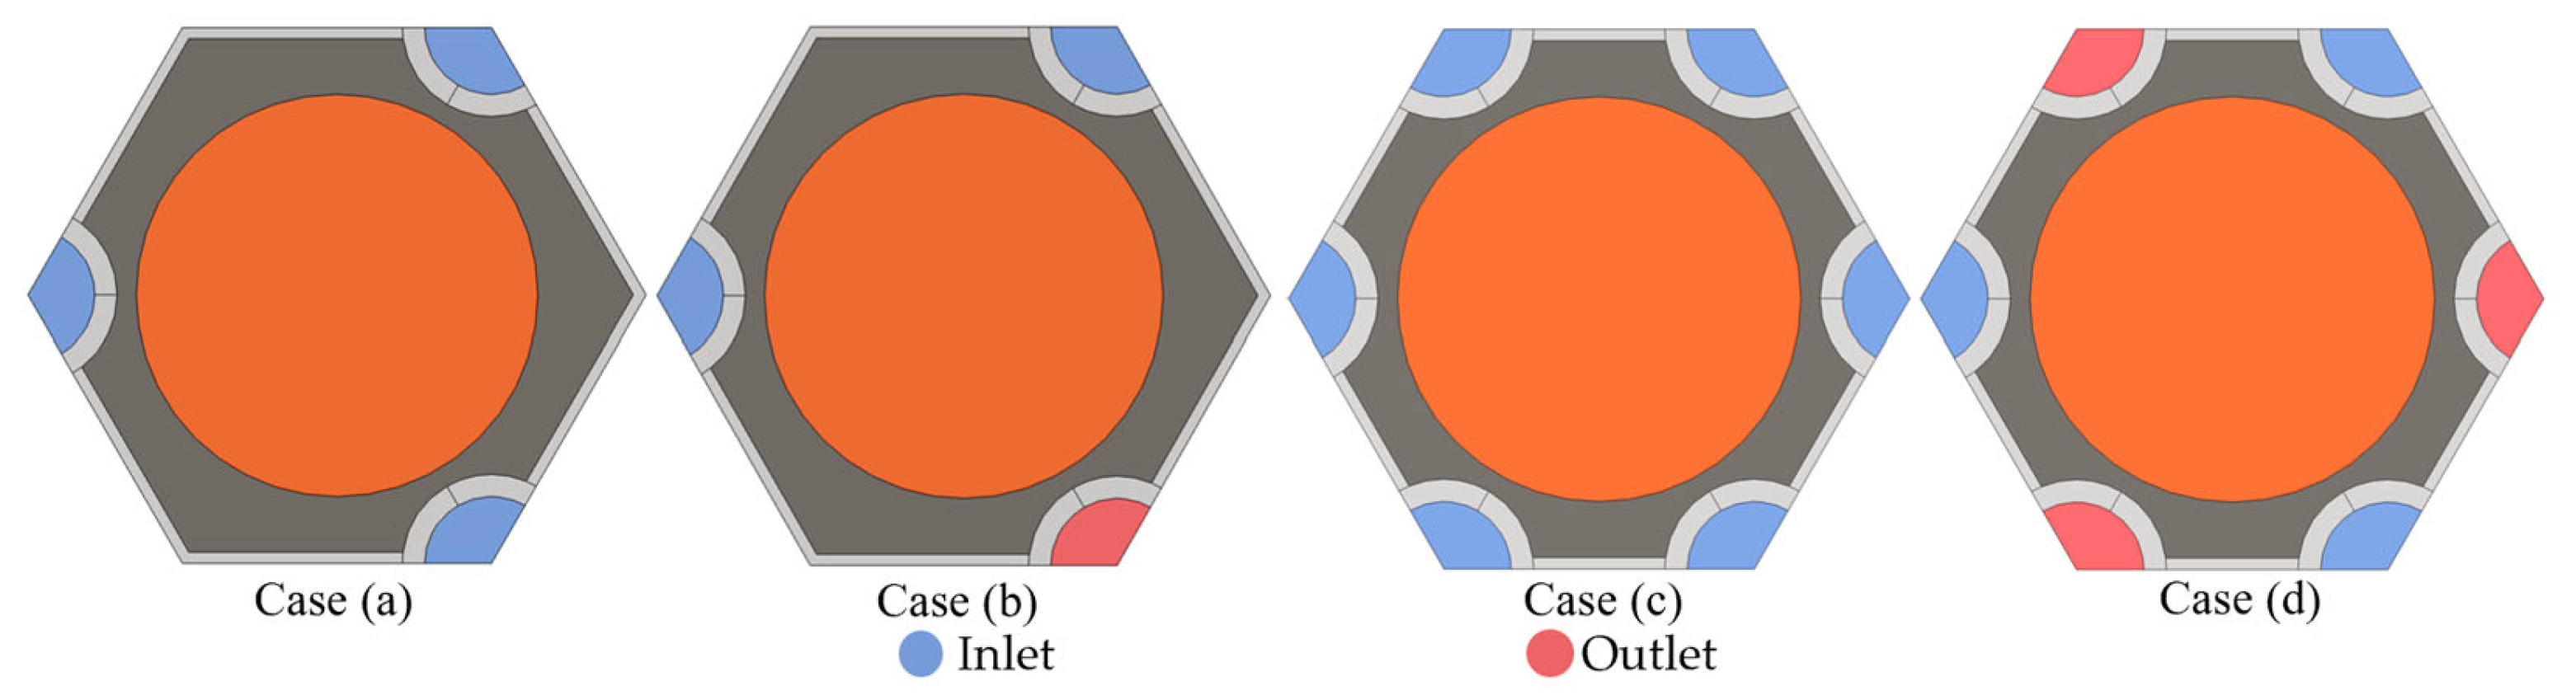
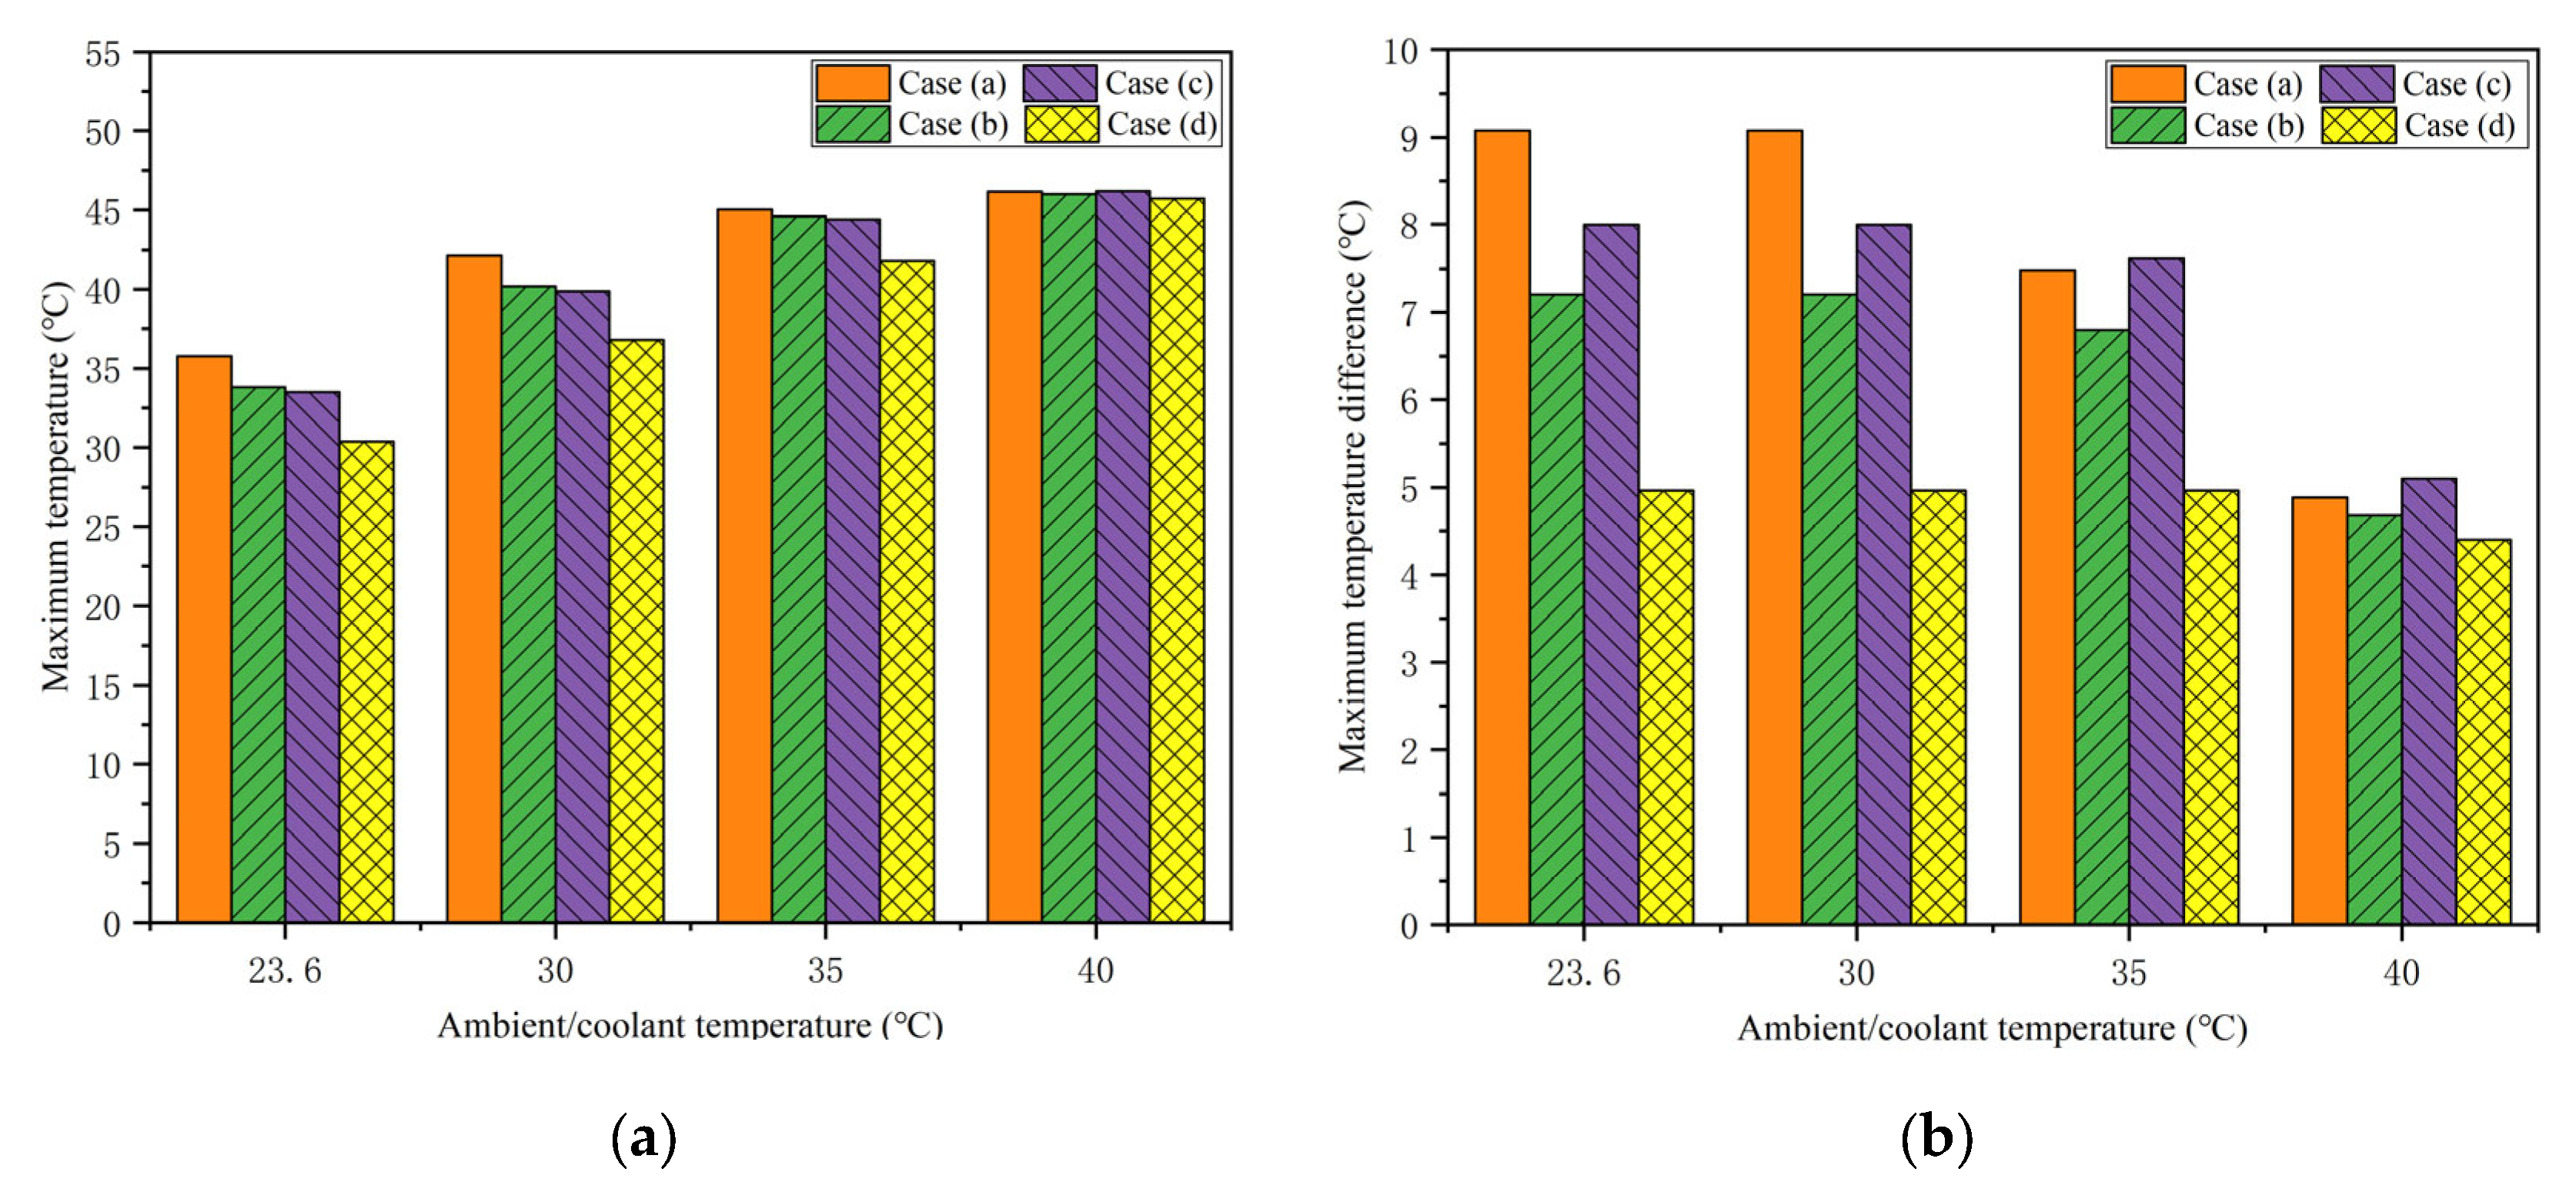
4.2. Effects of the Coolant Flow Directions

The BTMS based on honeycomb-structured liquid cooling and PCM involves the coupling of two cooling modes, and many parameters will affect the cooling effect of this system. In this section, the basic operating parameters, i.e., the flow direction of coolant, will be studied. The simulation conditions were set as the coolant flow rate of 0.1 m/s, the EG mass fraction of 12% and the battery spacing of 25 mm. Then, the cases of different flow directions (six/three cooling tubes with parallel-/counter-flow coolant) at diverse environment/coolant temperatures (23.6 °C, 30 °C, 35 °C and 40 °C) were carried out for the simulation and result analysis. Figure 10 shows the cases of different liquid cooling pipe numbers and flow directions.
The maximum battery temperature and temperature difference in three and six liquid cooling pipes with different coolant flow directions at 23.6 °C, 30 °C, 35 °C and 40 °C are shown in Figure 11. At a constant ambient/liquid cooling temperature, the counter-flow coolant can better limit the maximum temperature and temperature difference in batteries than the parallel flow. The counter flow can result in a decline in maximum temperature and temperature difference in the battery by as much as 3 °C and 3 °C at 23.6 °C ambient temperature, and a decline of 0.45 °C and 0.7 °C at 40 °C ambient temperature, respectively. When the coolant flows in a parallel direction, the coolant flowing through the outlet has absorbed part of the heat, and its cooling effect decreases, resulting in a higher battery maximum temperature at this position. Oppositely, when the coolant flow directions of the adjacent cooling pipes are different, i.e., the liquid cooling outlet and inlet are distributed alternately, there will be less uneven heat accumulation at a particular position. Similarly, the corresponding heat dissipation effect of six cooling tubes is better than that of three cooling tubes at a certain flow direction because the six cooling tubes as cooling sources are more densely and uniformly distributed around the battery. However, in individual cases, at high ambient/coolant temperatures, the highest temperature and temperature difference in the battery unit using six cooling tubes are higher than those using three cooling tubes because six cooling tubes occupy the larger space and decrease the amount of PCM, which absorbs most of the heat generated by the battery at high temperatures.
In summary, it can be concluded that the cooling effect of counterflow coolant is better than that of parallel flow, no matter the performance of the maximum temperature or the temperature difference. This phenomenon is more obvious when the coolant temperature is lower. In addition, when the flow direction is the same, the lower the environment/coolant temperature is, the lower the maximum battery temperature is, and the higher the maximum temperature difference is. Six liquid cooling tubes with counter-flow direction is the best scheme with the highest temperature and temperature difference of 45.71 °C and 4.4 °C, respectively, in the 40 °C environment. Meanwhile, the thermal performance of the battery in this scheme will be furtherly improved and can meet the requirements of uniformity with the decrease in ambient temperature. Therefore, in the subsequent research optimization, the counterflow coolant is taken as a determined condition to continue the discussion about the influence of other parameters.

4.3. Effects of the Mass Fraction of EG

Except for the operating and structural parameters, the change in material parameters also greatly impacts the heat transfer of hybrid cooling BTMS. The proposed structure is mainly filled with CPCM, whose thermal conductivity and latent heat directly affect the thermal performance of the battery pack. Therefore, this section will simulate the cooling effect of BTMS with different EG mass fractions (0, 3%, 6%, 9%, 12%, 20%) at ambient/coolant temperatures of 40 °C and 23.6 °C. In addition, battery spacing (23 mm, 25 mm, 27 mm, 29 mm, 31 mm) is also considered in this section for further analysis because of the strong relationship between battery spacing and EG mass fraction on the thermal performance of battery packs. Other simulation conditions were set: six liquid cooling pipes, counter-flow and a coolant flow rate of 0.1 m/s.
The maximum temperature of the battery in BTMS with different EG mass fractions at environment/coolant temperatures of 40 °C and 23.6 °C are presented in Figure 12. The lower ambient/coolant temperature can reduce the maximum battery temperature at a constant EG mass fraction. In addition, at a constant temperature and battery spacing, the maximum battery temperature will decrease rapidly first and then flatten out with the increase in EG mass fraction. When the EG mass fraction is small, ranging from 0 to 6%, its thermal conductivity is insufficient so that only part of PCM around the battery takes effect. At this time, increasing the EG mass fraction can significantly enhance the role of PCM or liquid cooling, leading to a rapid decline in the maximum battery temperature. Then, when the EG mass fraction increases to 12%, its thermal conductivity is enough to bring most of the heat from the battery, and the PCM at the far end can play a full role. However, when the EG mass fraction rises to 20%, the thermal conductivity of PCM is sufficient, but its latent heat is low, resulting in the decline of the heat dissipation effect under high temperatures. The temperature distribution of BTMS under different EG mass fractions due to the different thermal conductivity of PCM can be obtained in Figure 13.
The results of the maximum temperature difference in batteries in BTMS with different EG mass fractions at ambient/coolant temperatures of 40 °C and 23.6 °C are shown in Figure 14. The maximum temperature difference in the battery at a high temperature of 40 °C is smaller when the EG mass fraction is constant, which is caused by the fact that PCM can melt and play a major role in the dissipation effect at high temperatures. Figure 15 is a supplementary illustration, i.e., as the ambient/coolant temperature decreases, the maximum temperature difference in the battery will rise, which is caused by the increased liquid cooling effect. Moreover, the corresponding maximum temperature difference is stable at a high value until the coolant temperature is low enough. In addition, when the EG mass fraction increases, the maximum temperature difference in the battery rises rapidly at first and then gradually flattens out. The reason for this trend can be explained according to Figure 13. When the EG mass fraction is low, the heat inside the battery cannot be dissipated in time, so its temperature is high, but the temperature gradient is small. With the rise in the EG mass fraction, the thermal conductivity is enhanced so that the phase change is increased, or the liquid cooling effect is obvious, which can reduce the minimum temperature of the battery and lead to the increase in temperature gradient. Until the thermal conductivity is sufficient, the battery heat generation and external heat dissipation are balanced, and the maximum temperature difference in the battery tends to flatten out.
According to the above results, at a constant EG mass fraction, the lower the ambient/coolant temperature is, the smaller the maximum temperature of the battery is, and the larger the maximum temperature difference is. In addition, increasing the mass fraction of EG can decrease the maximum temperature of the battery and increase the maximum temperature difference. Specifically, this phenomenon is quite apparent when the value of EG mass fraction is 0~9% and less obvious between 9 and 12%. However, furtherly increasing the mass fraction of EG to 20% will have little effect on the thermal performance and may cause the increase in maximum temperature. Therefore, on the premise of meeting the maximum temperature difference, a larger EG mass fraction of 12% can be selected to obtain a lower maximum battery temperature.

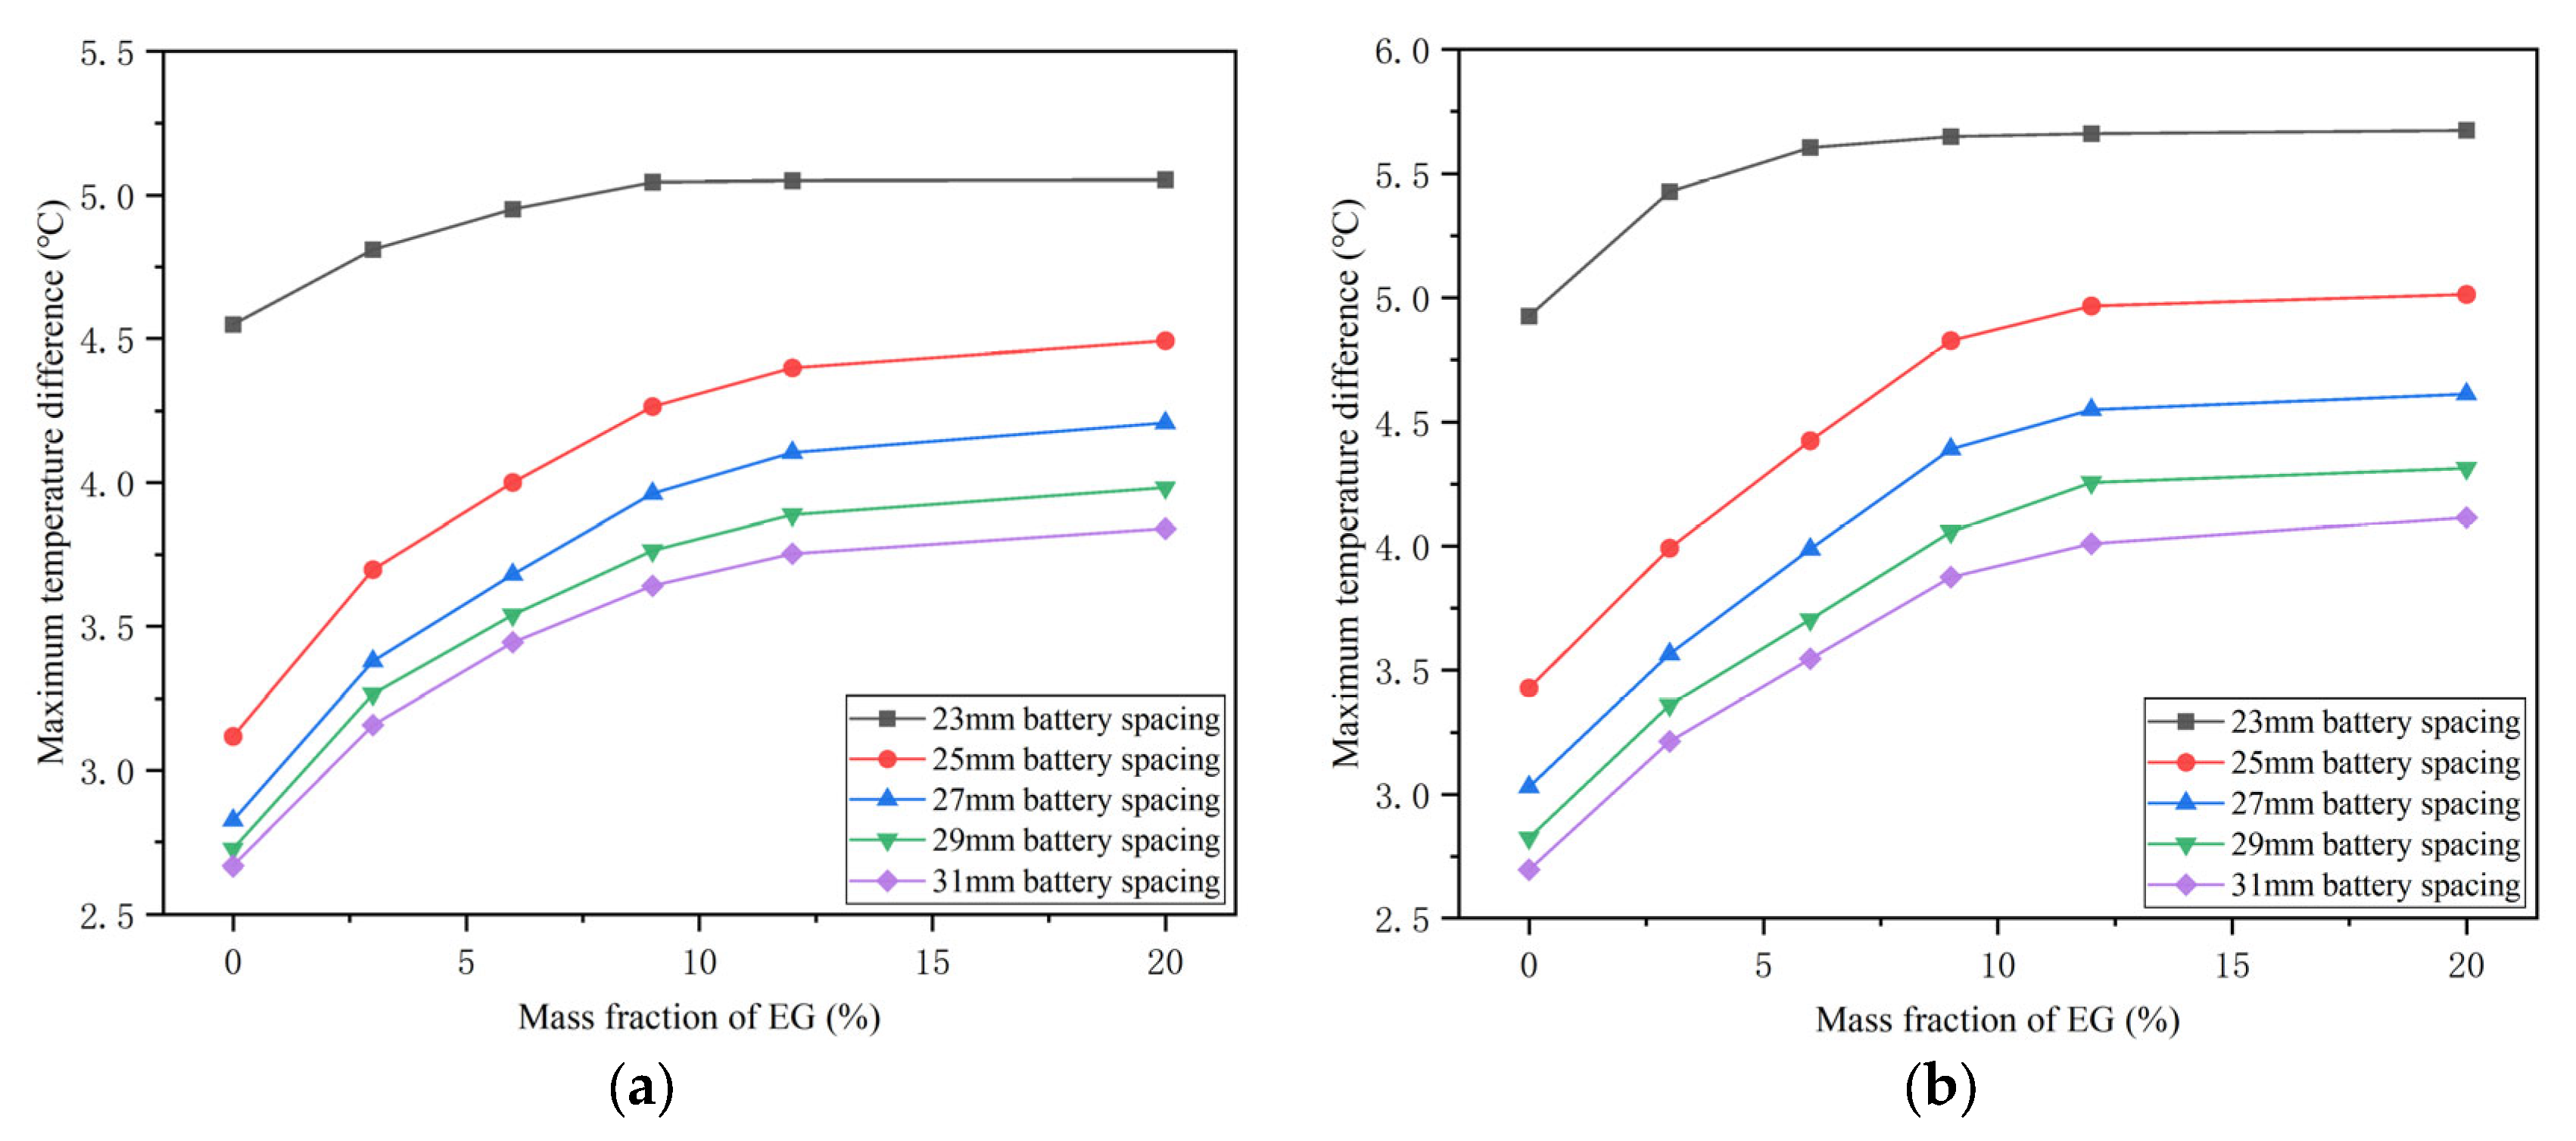
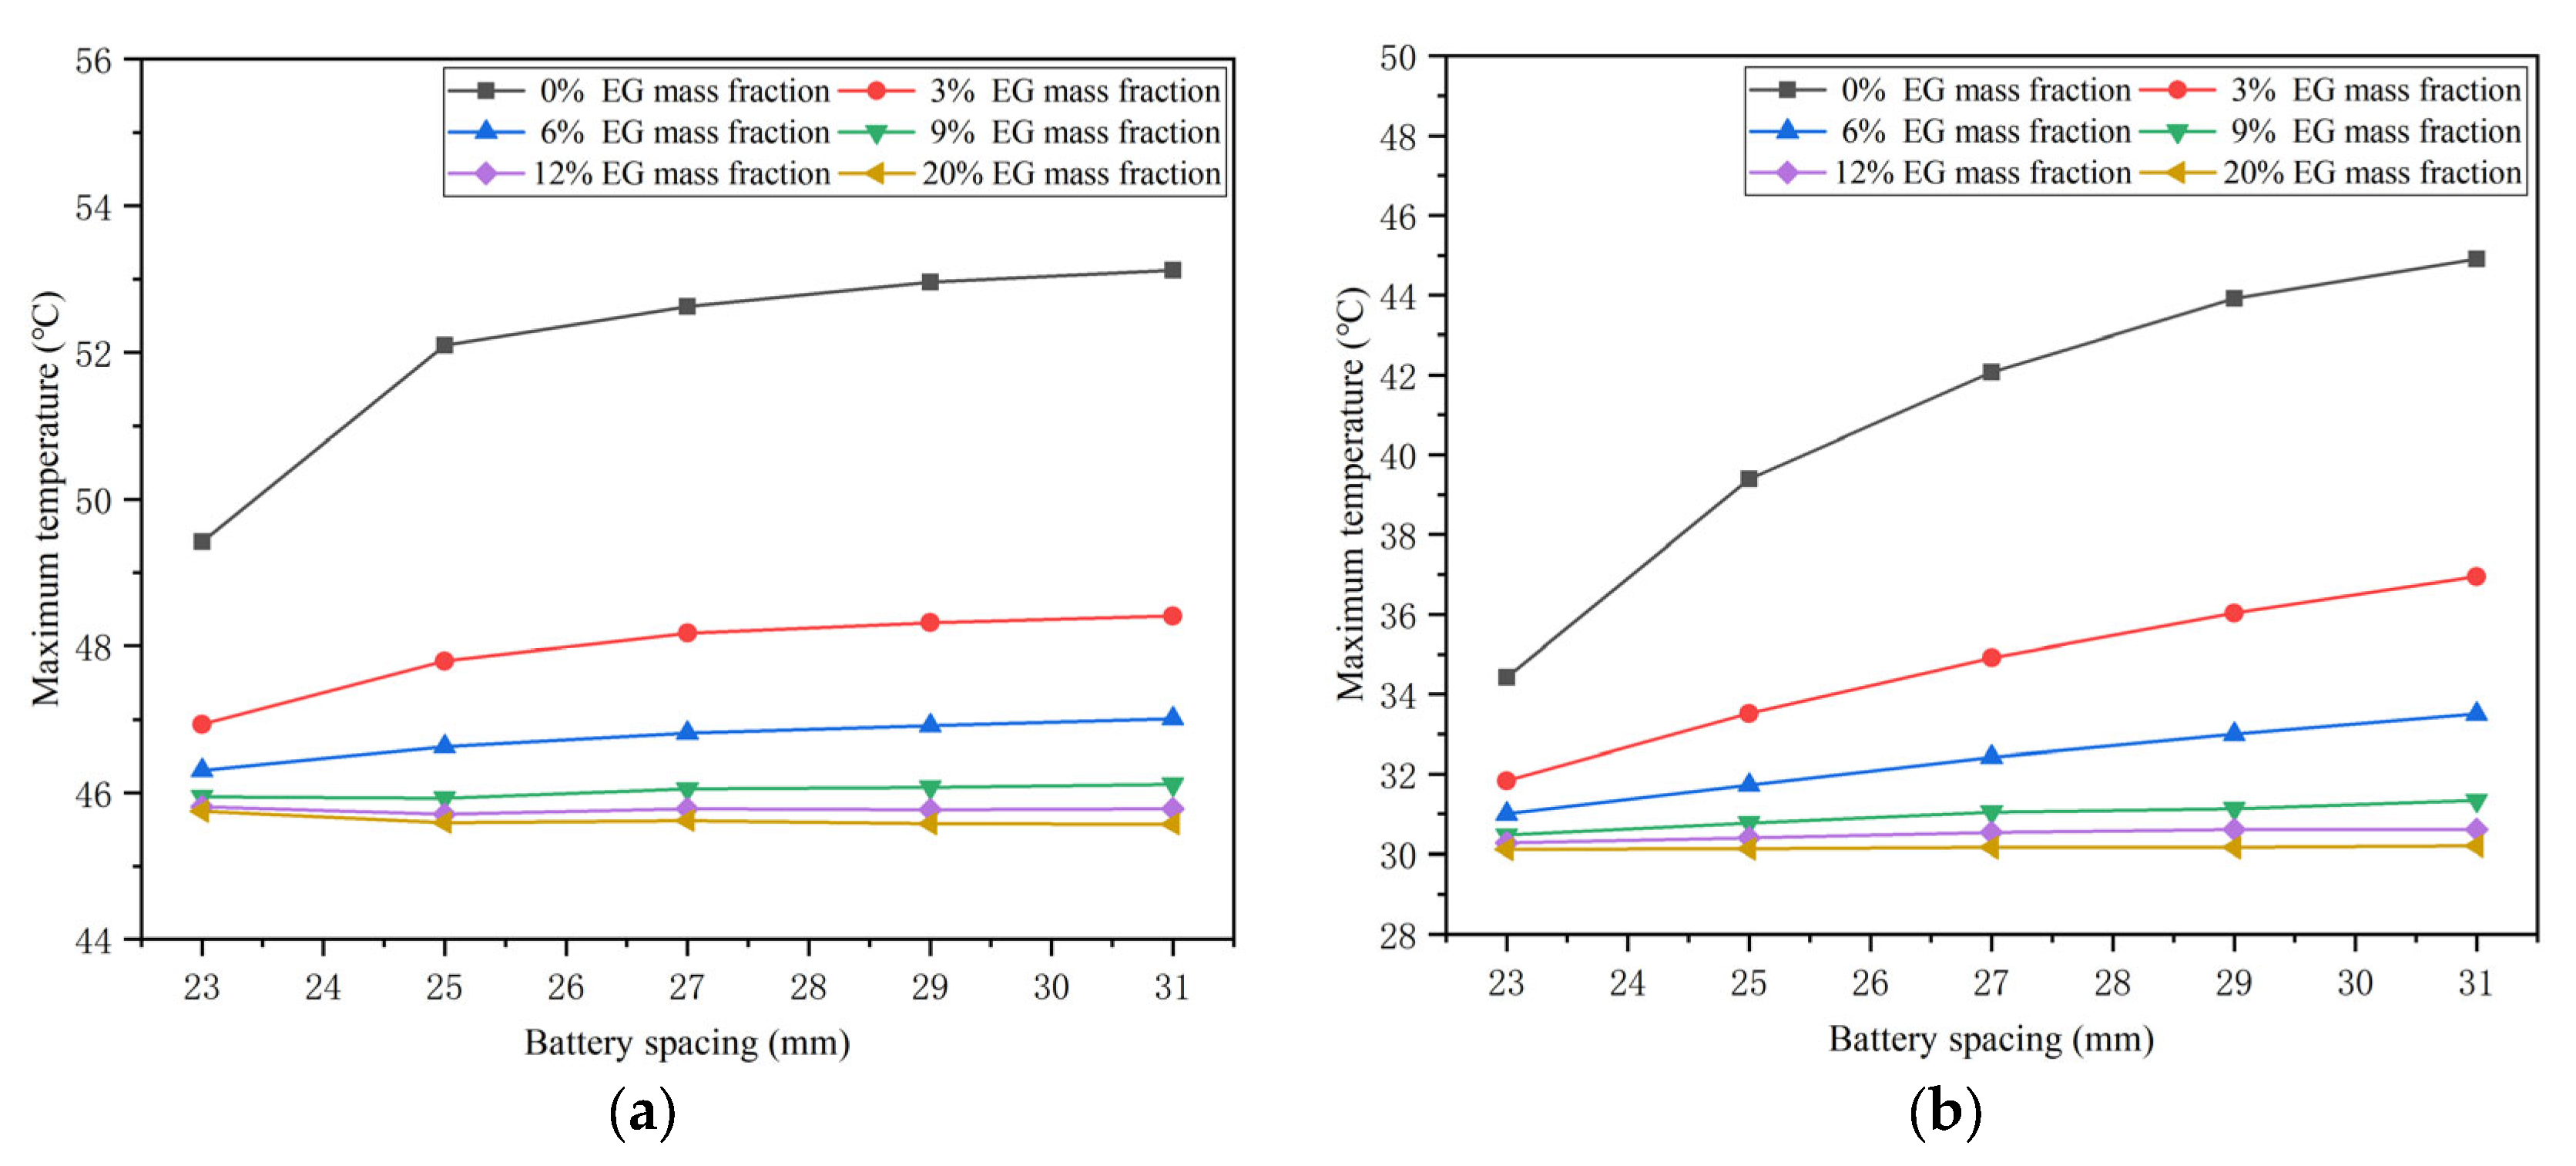
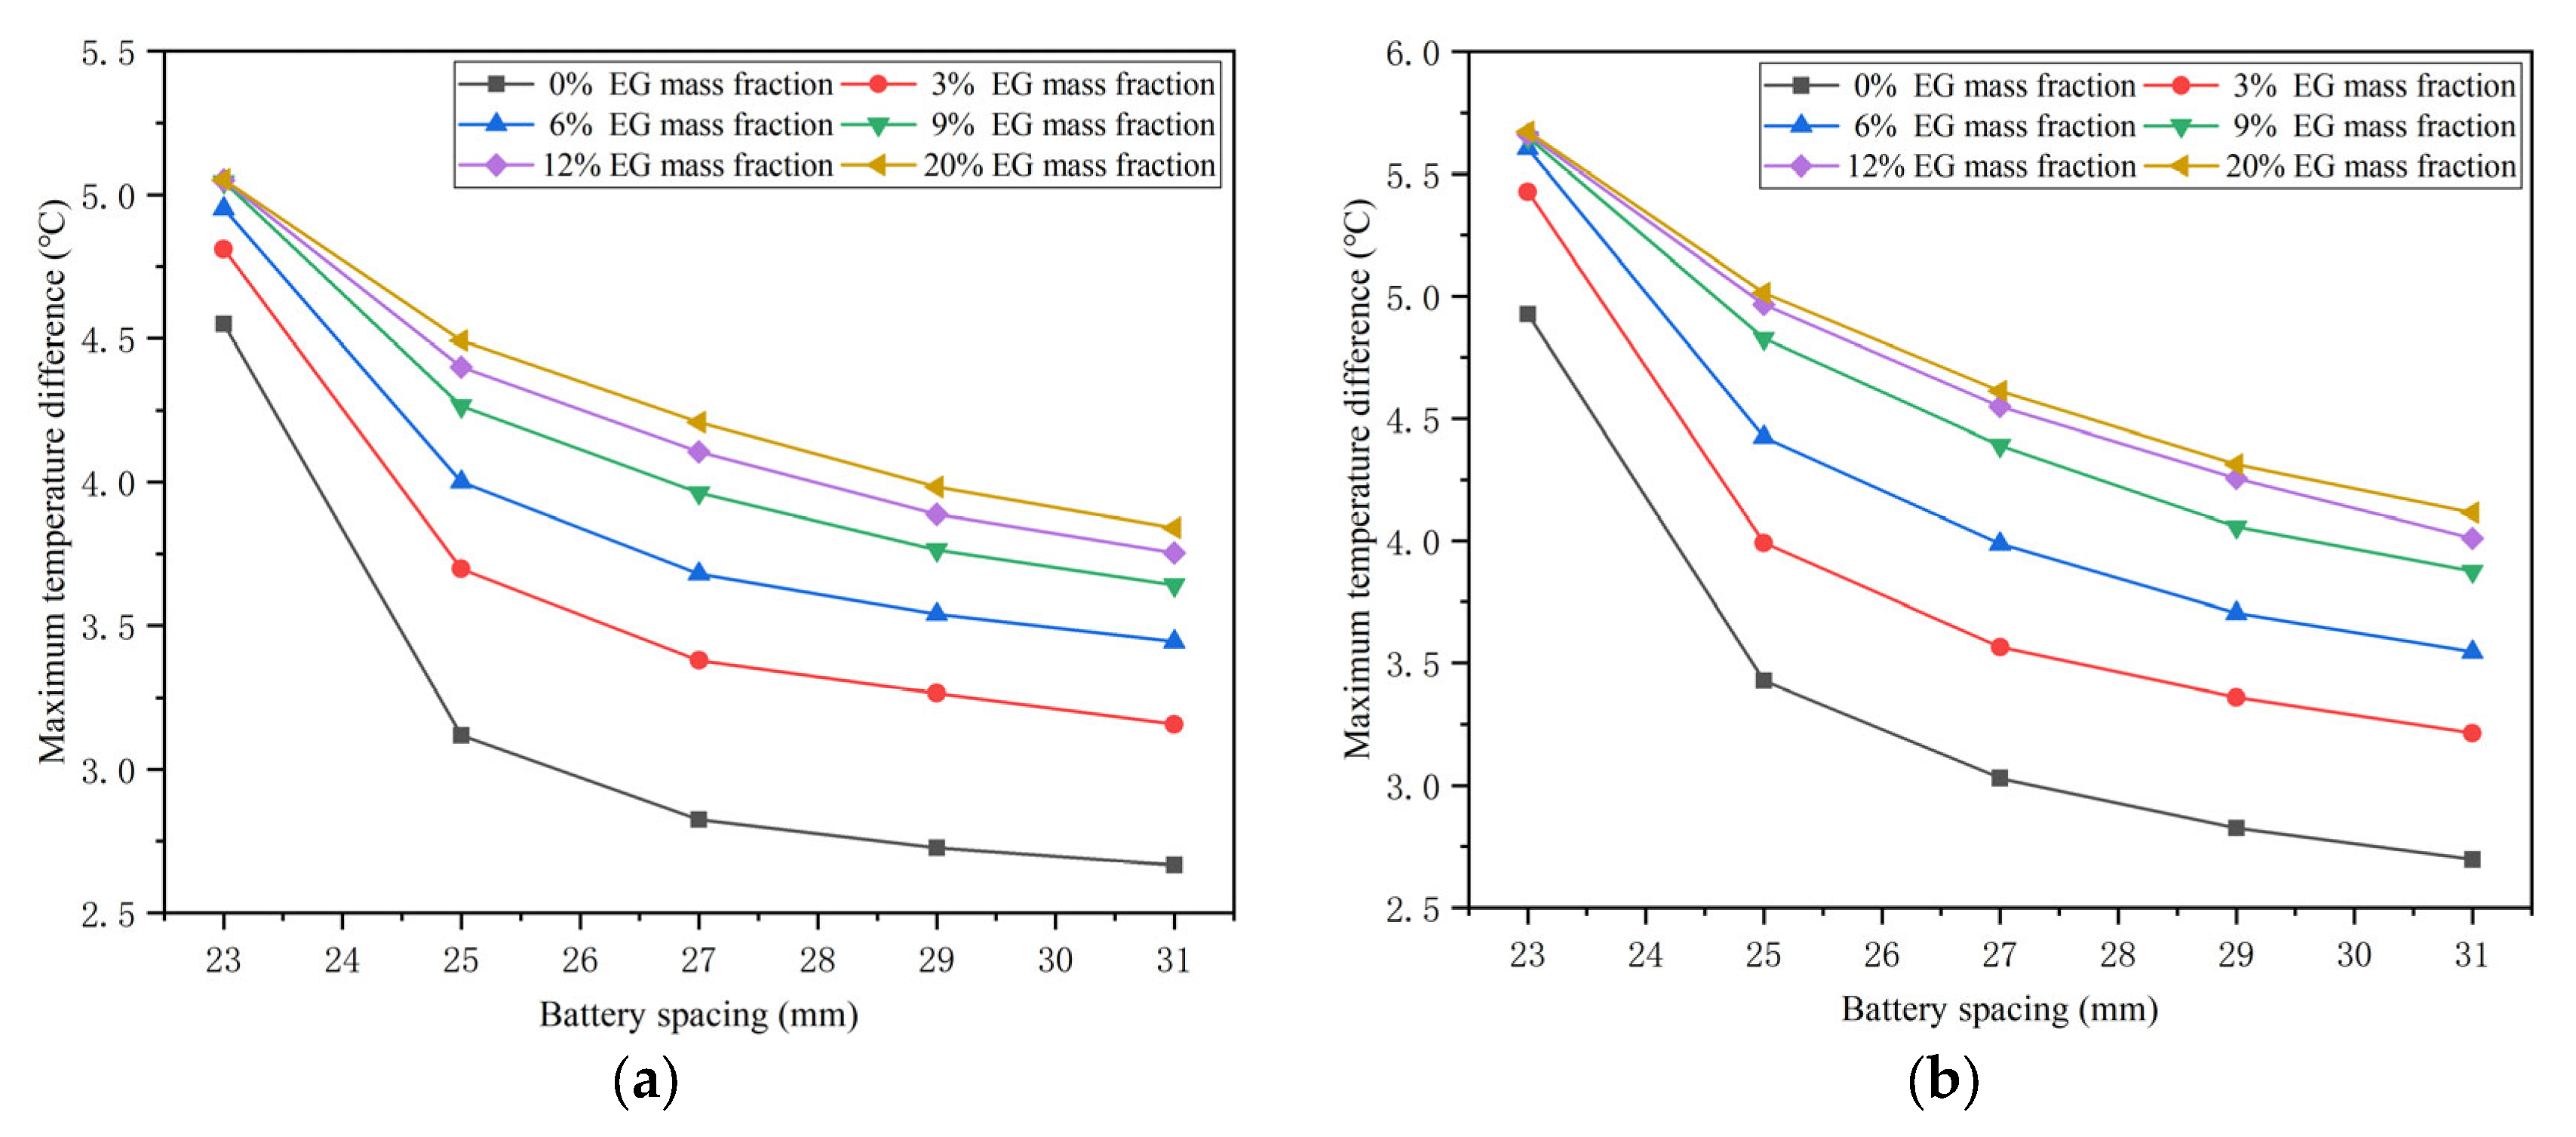
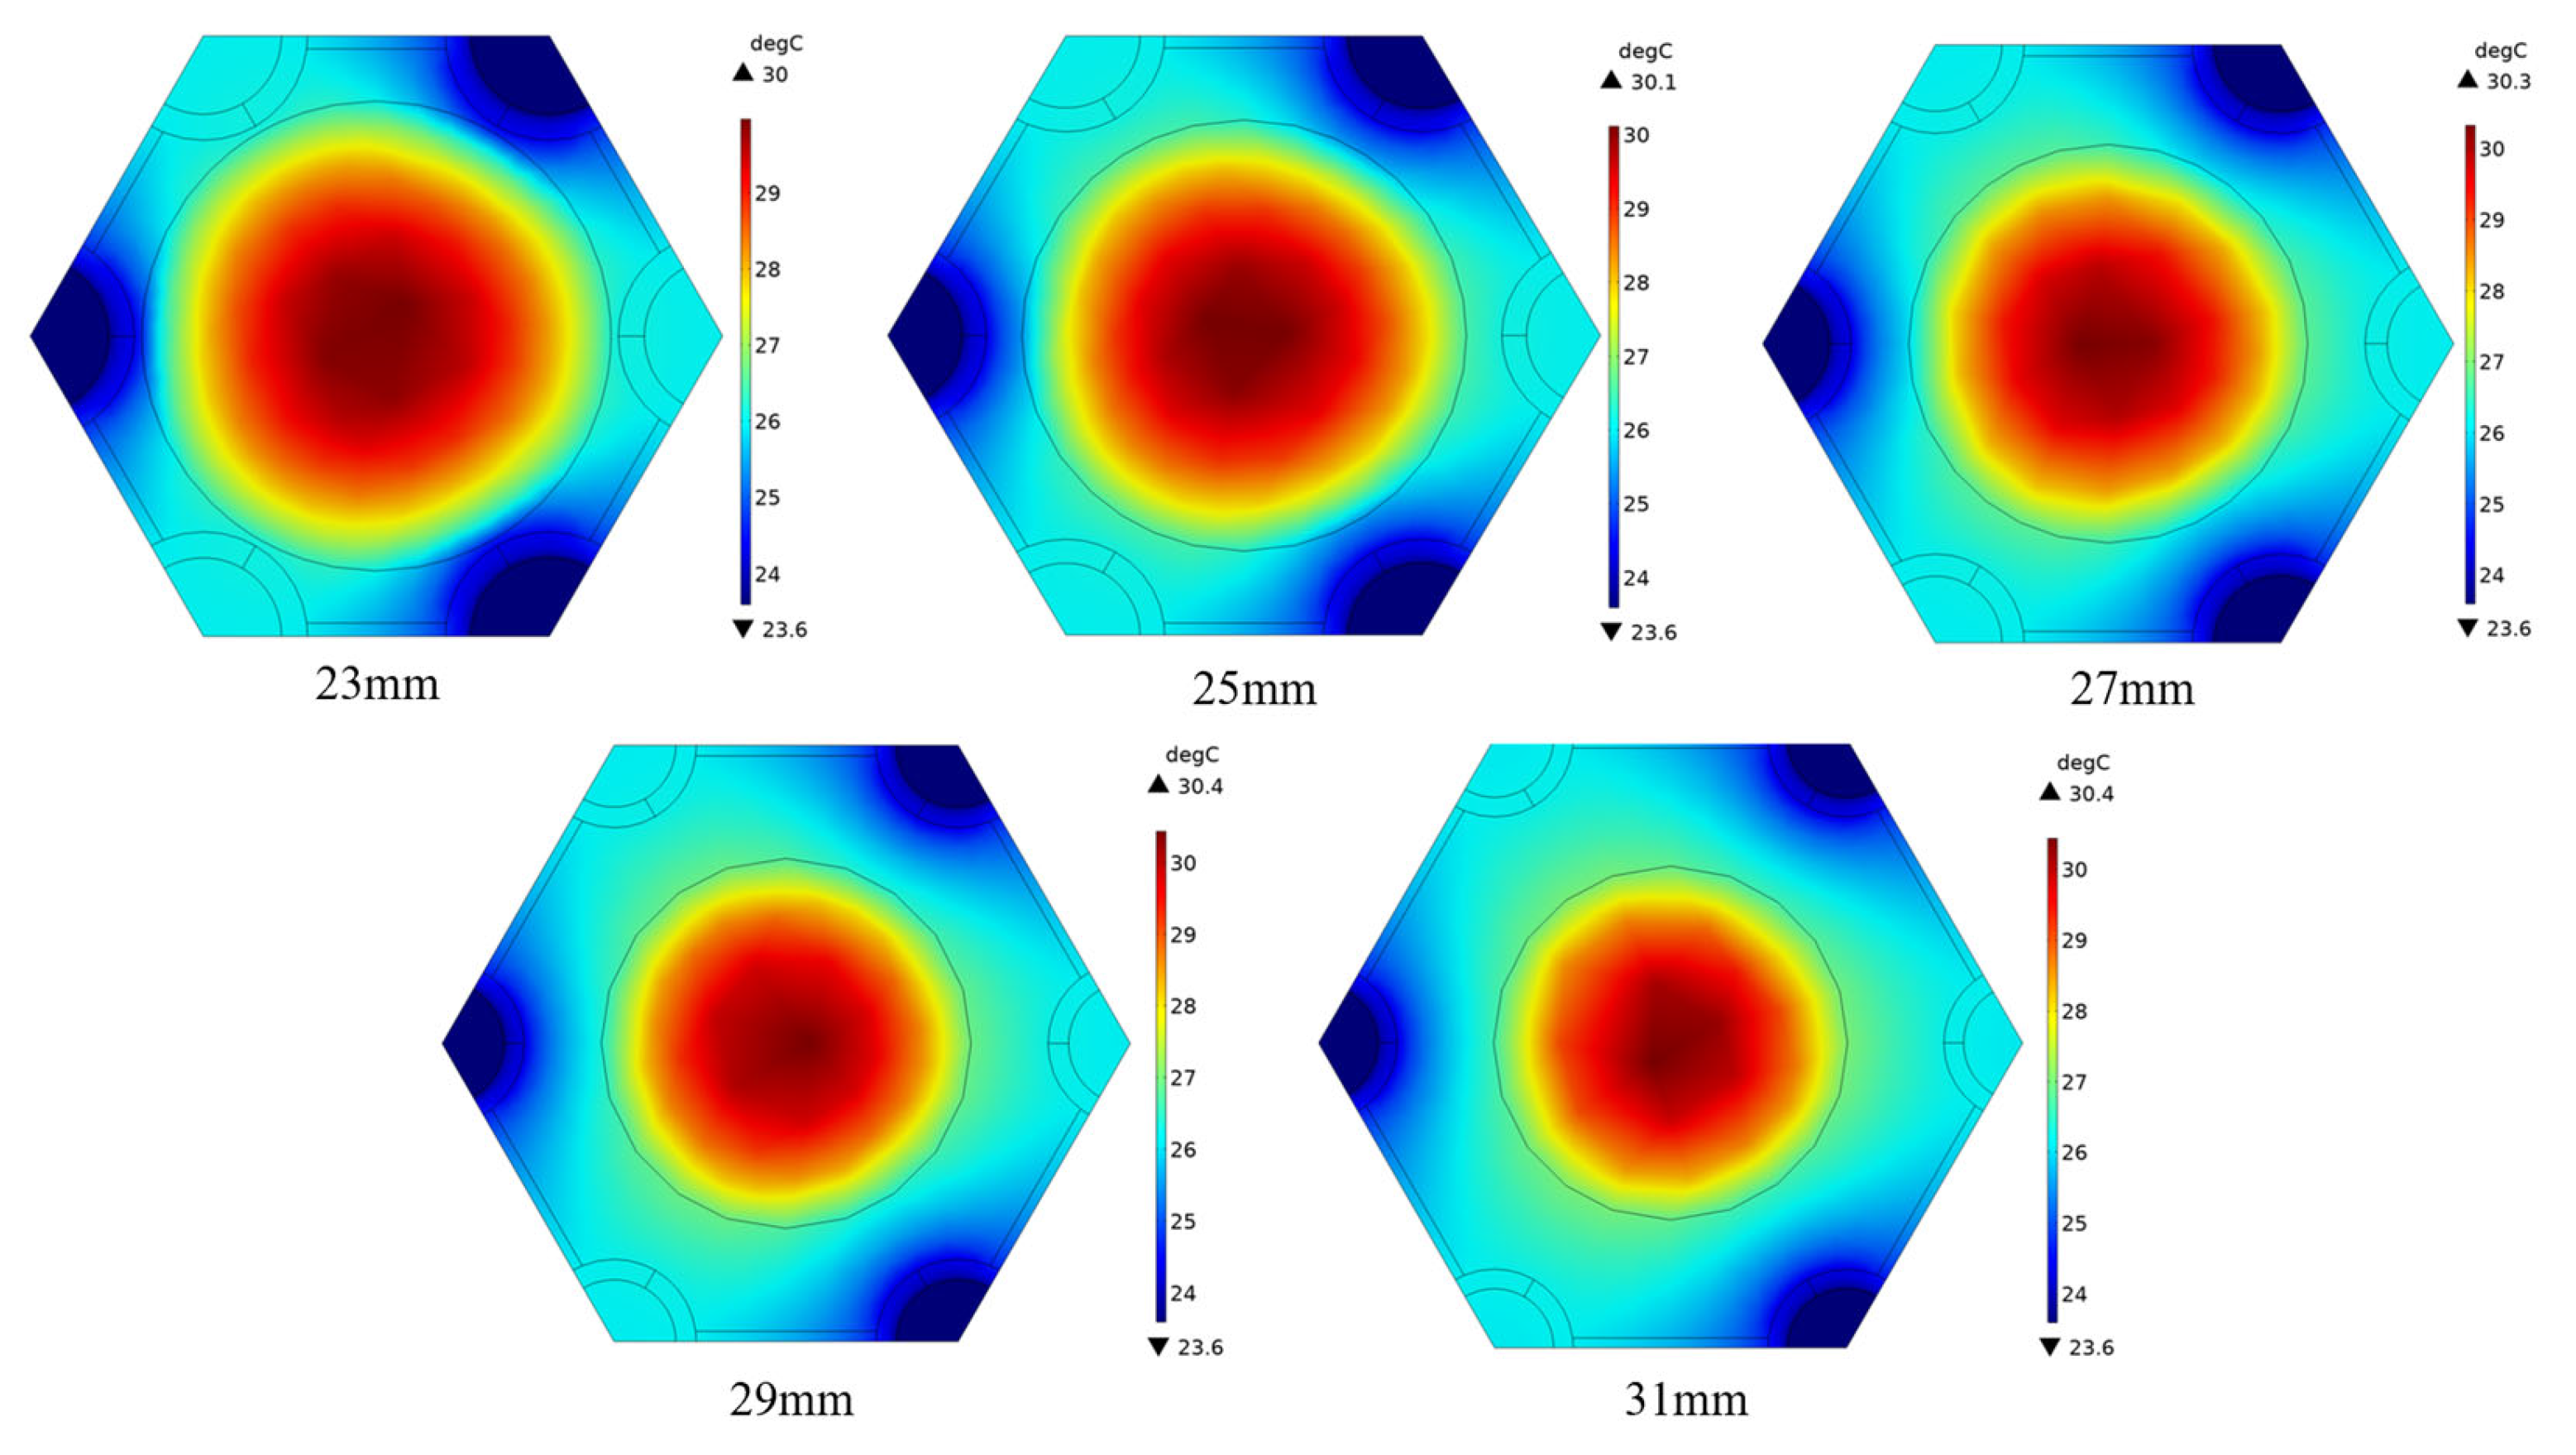
4.4. Effects of the Battery Spacing

The distance between battery cells greatly influences the two cooling methods used in this study. With the increase in the distance, the amount of PCM will increase and it can absorb more heat, while the cooling tubes will be farther away from the battery, resulting in a weak cooling effect. Moreover, the battery spacing also affects the grouping efficiency of battery packs. Therefore, this section provides heat transfer simulation and comparative analysis for BTMS with different battery spacing (23 mm, 25 mm, 27 mm, 29 mm, and 31 mm) at different ambient temperatures. At the same time, the mass fraction of EG was also used as a reference variable to draw a more comprehensive conclusion. The basic conditions were set as follows: six cooling pipes, counter flow and 0.1 m/s flow rate.
The simulation results of the maximum battery temperature in the BTMS with different battery spacing at 40 °C and 23.6 °C ambient/coolant temperatures are shown in Figure 16. It can be seen from the comparison that the maximum battery temperature varies significantly under different ambient/coolant temperatures, i.e., the lower the ambient/coolant temperature is, the lower the maximum battery temperature is. At high temperatures, with the change in cell spacing, the corresponding maximum temperature of the battery varies in a small range. This is because the PCM melts and controls the battery temperature in the small temperature range of the phase change process, and the convective heat transfer between PCM and the coolant is weak in the high temperature environment. However, with the decrease in ambient/coolant temperature, the proportion of phase transition of the PCM decreases, while the cooling effect of low temperature liquid cooling gradually increases. In this situation, the maximum temperature of the battery is greatly affected by the distance between the cooling tubes and the battery. In addition, at a constant ambient/coolant temperature, the influence of different cell spacing on the maximum battery temperature is mainly determined by EG mass fractions. When the EG mass fraction is low, the maximum temperature of the battery increases with the increase in spacing. While the EG mass fraction is high, the corresponding maximum temperature is not affected by the spacing. The reason for this phenomenon is that the thermal conductivity of PCM with various EG mass fractions is different. When the heat conduction is insufficient, the closer the cooling source is, the stronger the heat dissipation is. However, when the heat conduction is enough, the cooling effect is not obviously affected by battery spacing.
The simulation results of the maximum temperature difference in the battery in the BTMS with different battery spacing at 40 °C and 23.6 °C ambient/coolant temperatures are presented in Figure 17. The comparison shows that, at the same battery spacing, the maximum temperature difference in the battery at 40 °C is smaller than that at 23.6 °C. This is because PCM plays a leading role at high temperatures, wherein the cooling effect is more uniform, and liquid cooling plays a leading role at low temperatures, wherein the corresponding temperature uniformity is poor. This phenomenon can be further supplemented by Figure 18a. With the decrease in temperature, the liquid cooling effect is enhanced, and the melting part of PCM decreases, which leads to the gradual increase in the maximum temperature difference in the battery. While the ambient/liquid cooling temperature continues to reduce to a low level, the maximum temperature difference in the battery no longer increases. Moreover, when the battery spacing rises to 25 mm, the maximum temperature difference in the battery decreases to 5 °C below at each external temperature, as shown in Figure 18b. Further increasing the battery spacing will reduce the compactness of the battery pack, so 25 mm spacing is considered the optimal configuration of the BTMS unit with a total volume of 3.5 × 10⁻⁵ m3 and mass of 0.064 kg.
In addition, at a constant ambient/coolant temperature, the maximum temperature difference decreases with the increase in battery spacing. This is because liquid cooling has the characteristics of uneven temperature distribution at specific locations such as coolant inlets. The closer the distance between the cooling tubes and the battery, the more obvious the local low temperature of the battery, resulting in a larger maximum temperature difference. As shown in Figure 19, at the ambient/coolant temperature of 23.6 °C, when the battery spacing is small, some of the low temperature zone caused by liquid cooling is inside the battery, resulting in a lower minimum temperature. Until the spacing increases to 29 mm, the low temperature zone gradually moves away from the battery.
Overall, at the same ambient/liquid cooling temperature, the distance between batteries has a great impact on the maximum temperature difference, i.e., the corresponding maximum temperature difference decreases with the spacing increases. However, the influence of battery spacing on the maximum temperature is determined by the EG mass fraction. At the high EG mass fraction, the maximum temperature is not affected by battery spacing. At the low EG mass fraction, the distance between batteries has a significant effect; i.e., the maximum temperature increases with the increase in the distance. In addition, PCM plays a major role in cooling, with good temperature uniformity at high ambient/coolant temperatures. With the temperature decrease, the effect of liquid cooling gradually becomes stronger, and the maximum temperature difference becomes larger. Furthermore, a higher battery spacing of 25 mm is selected to optimize the maximum temperature difference in batteries to meet the uniformity requirements.

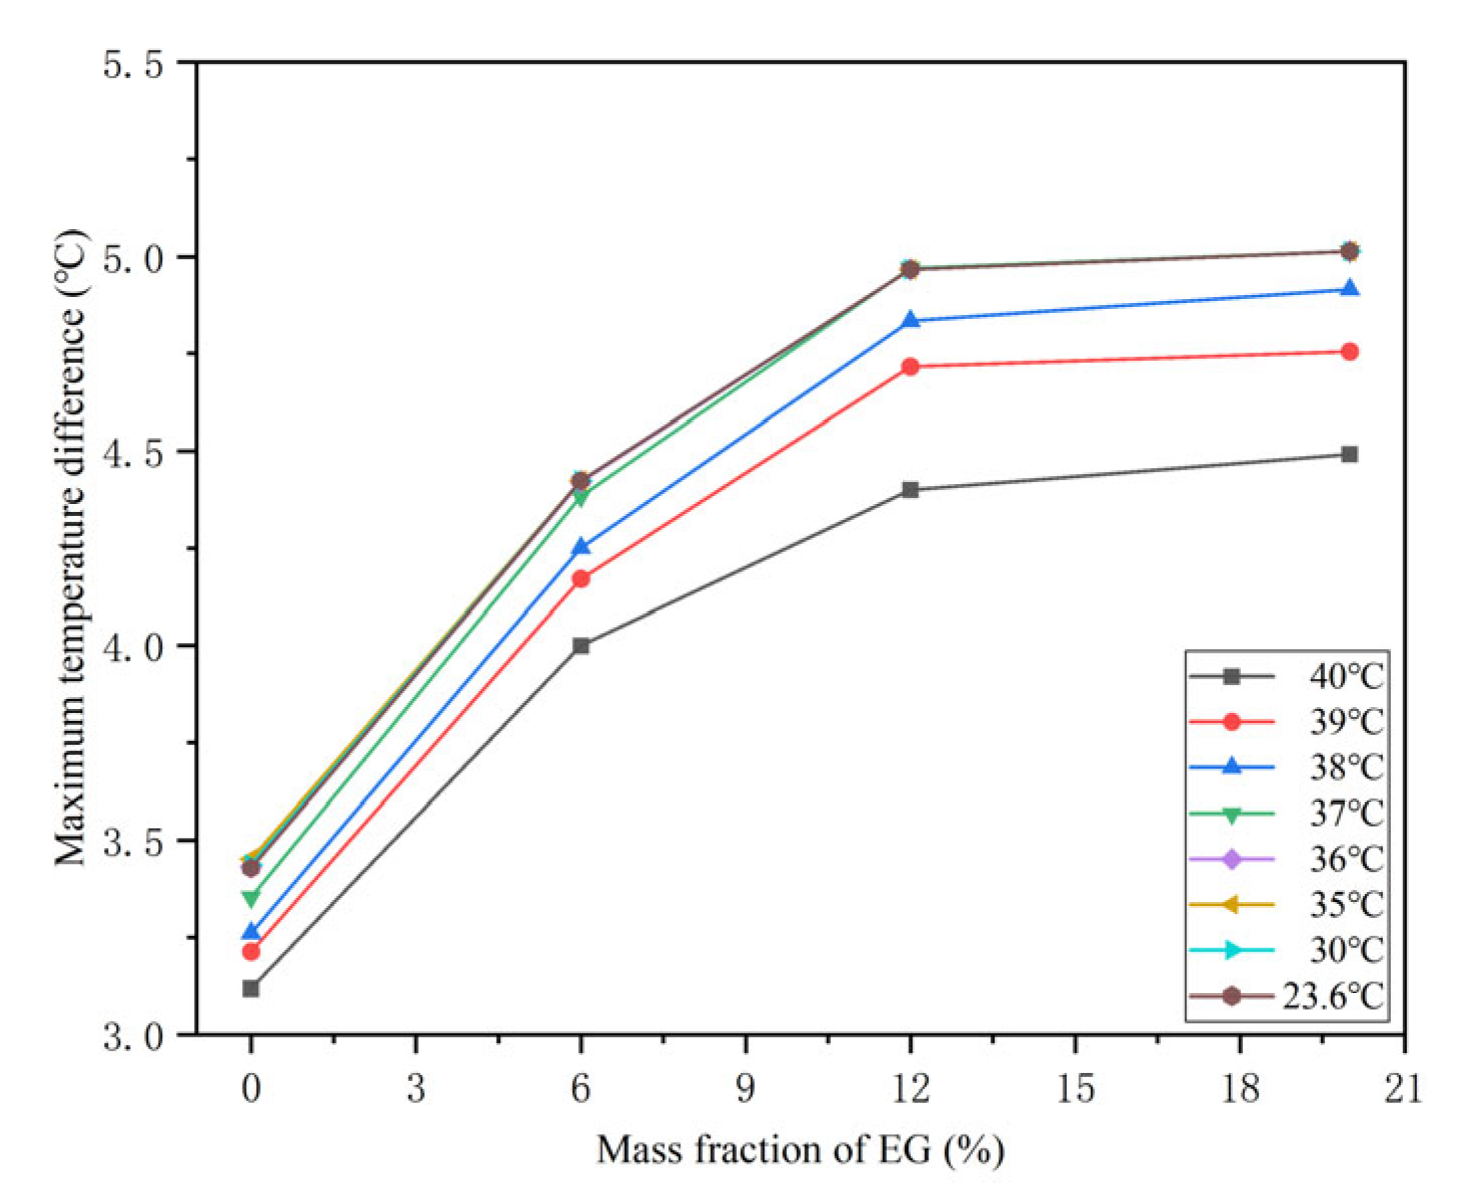
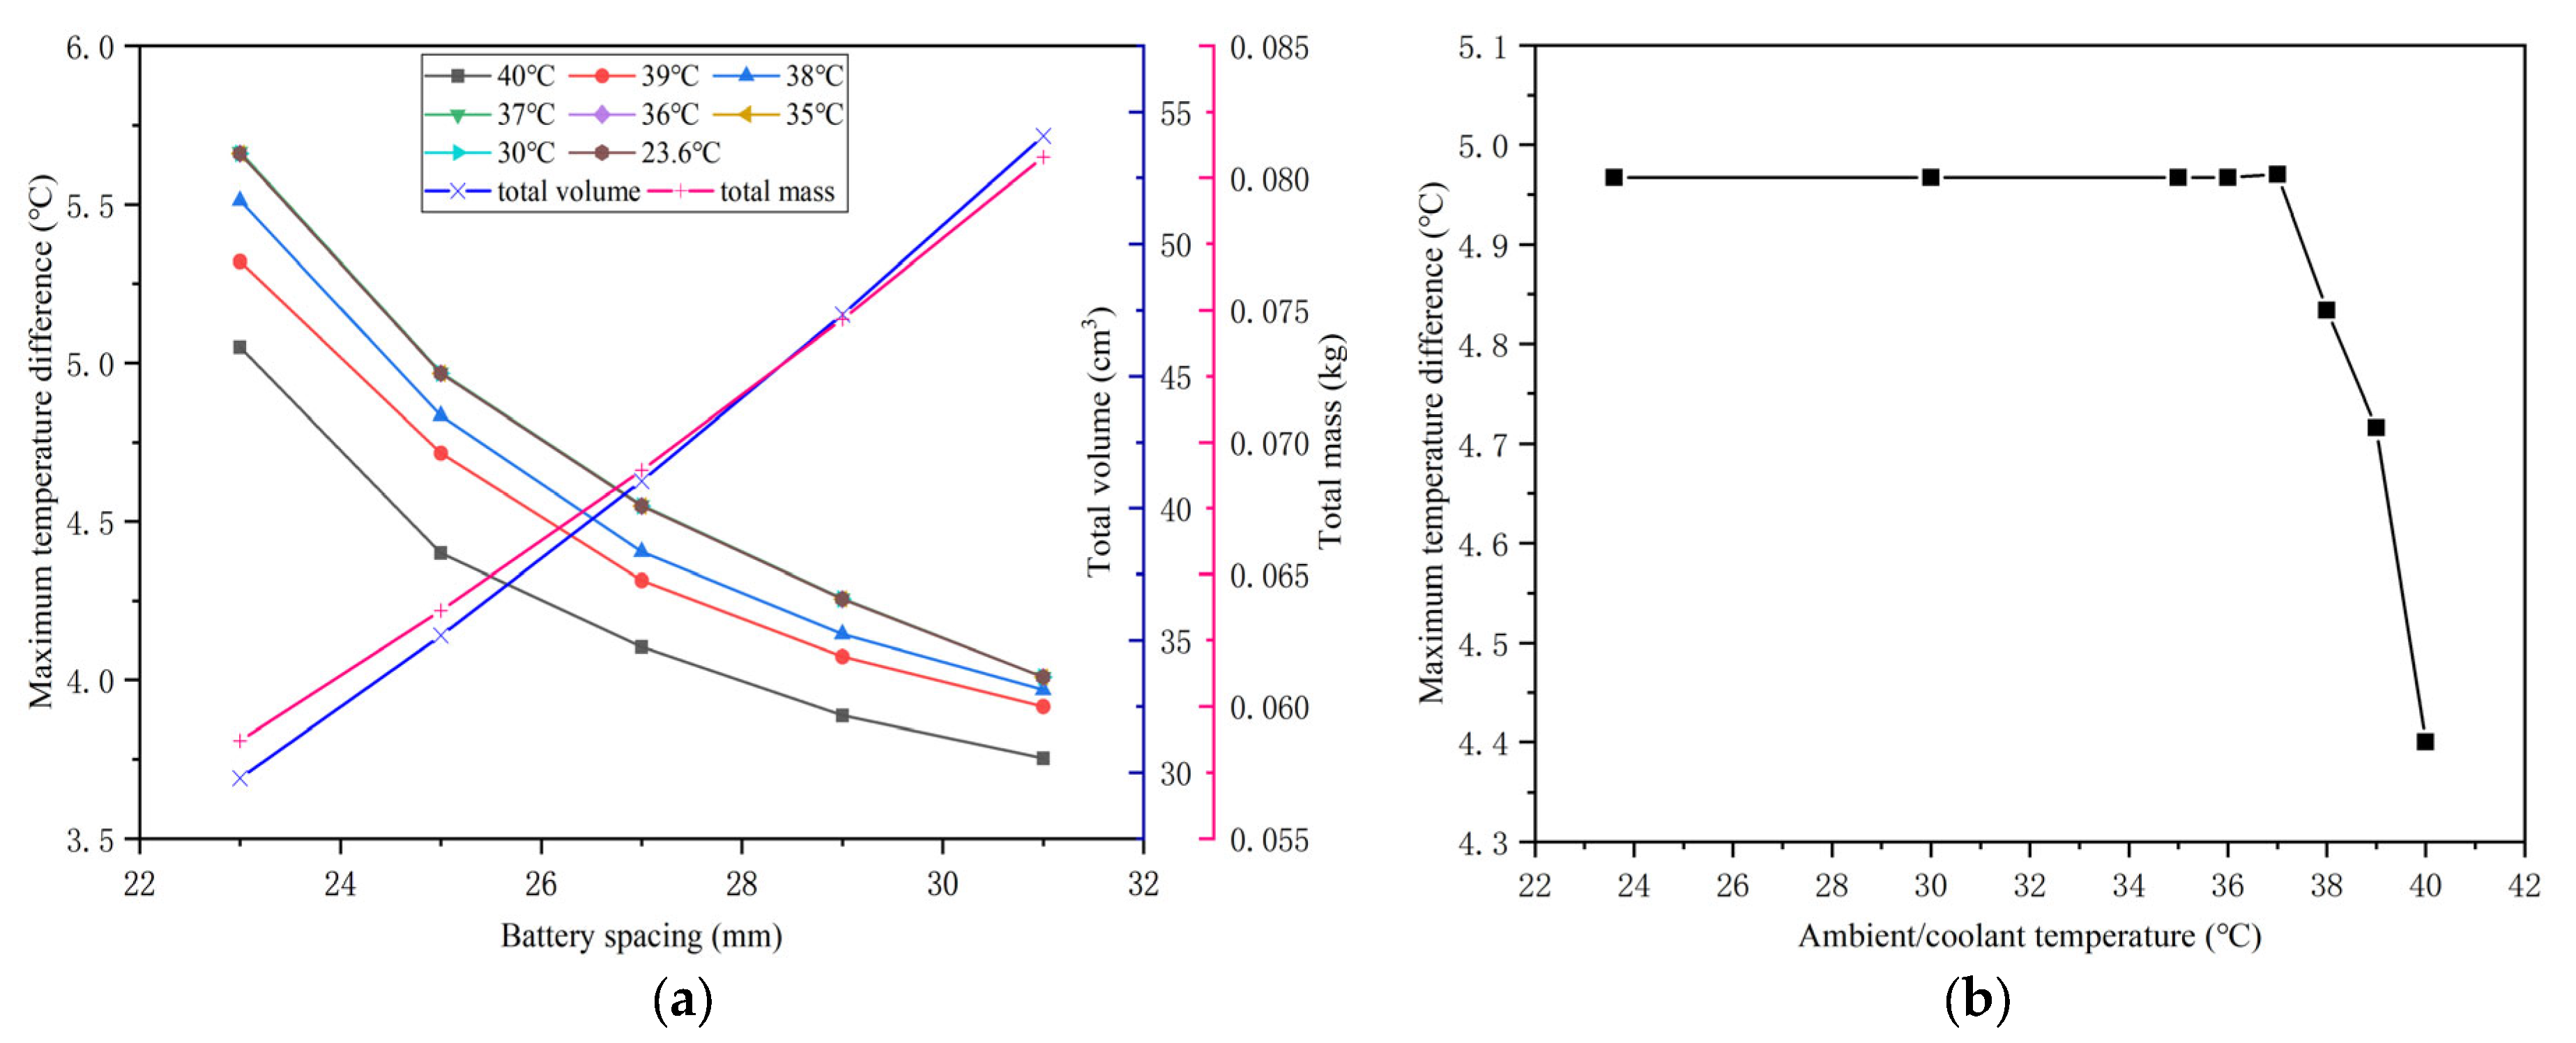
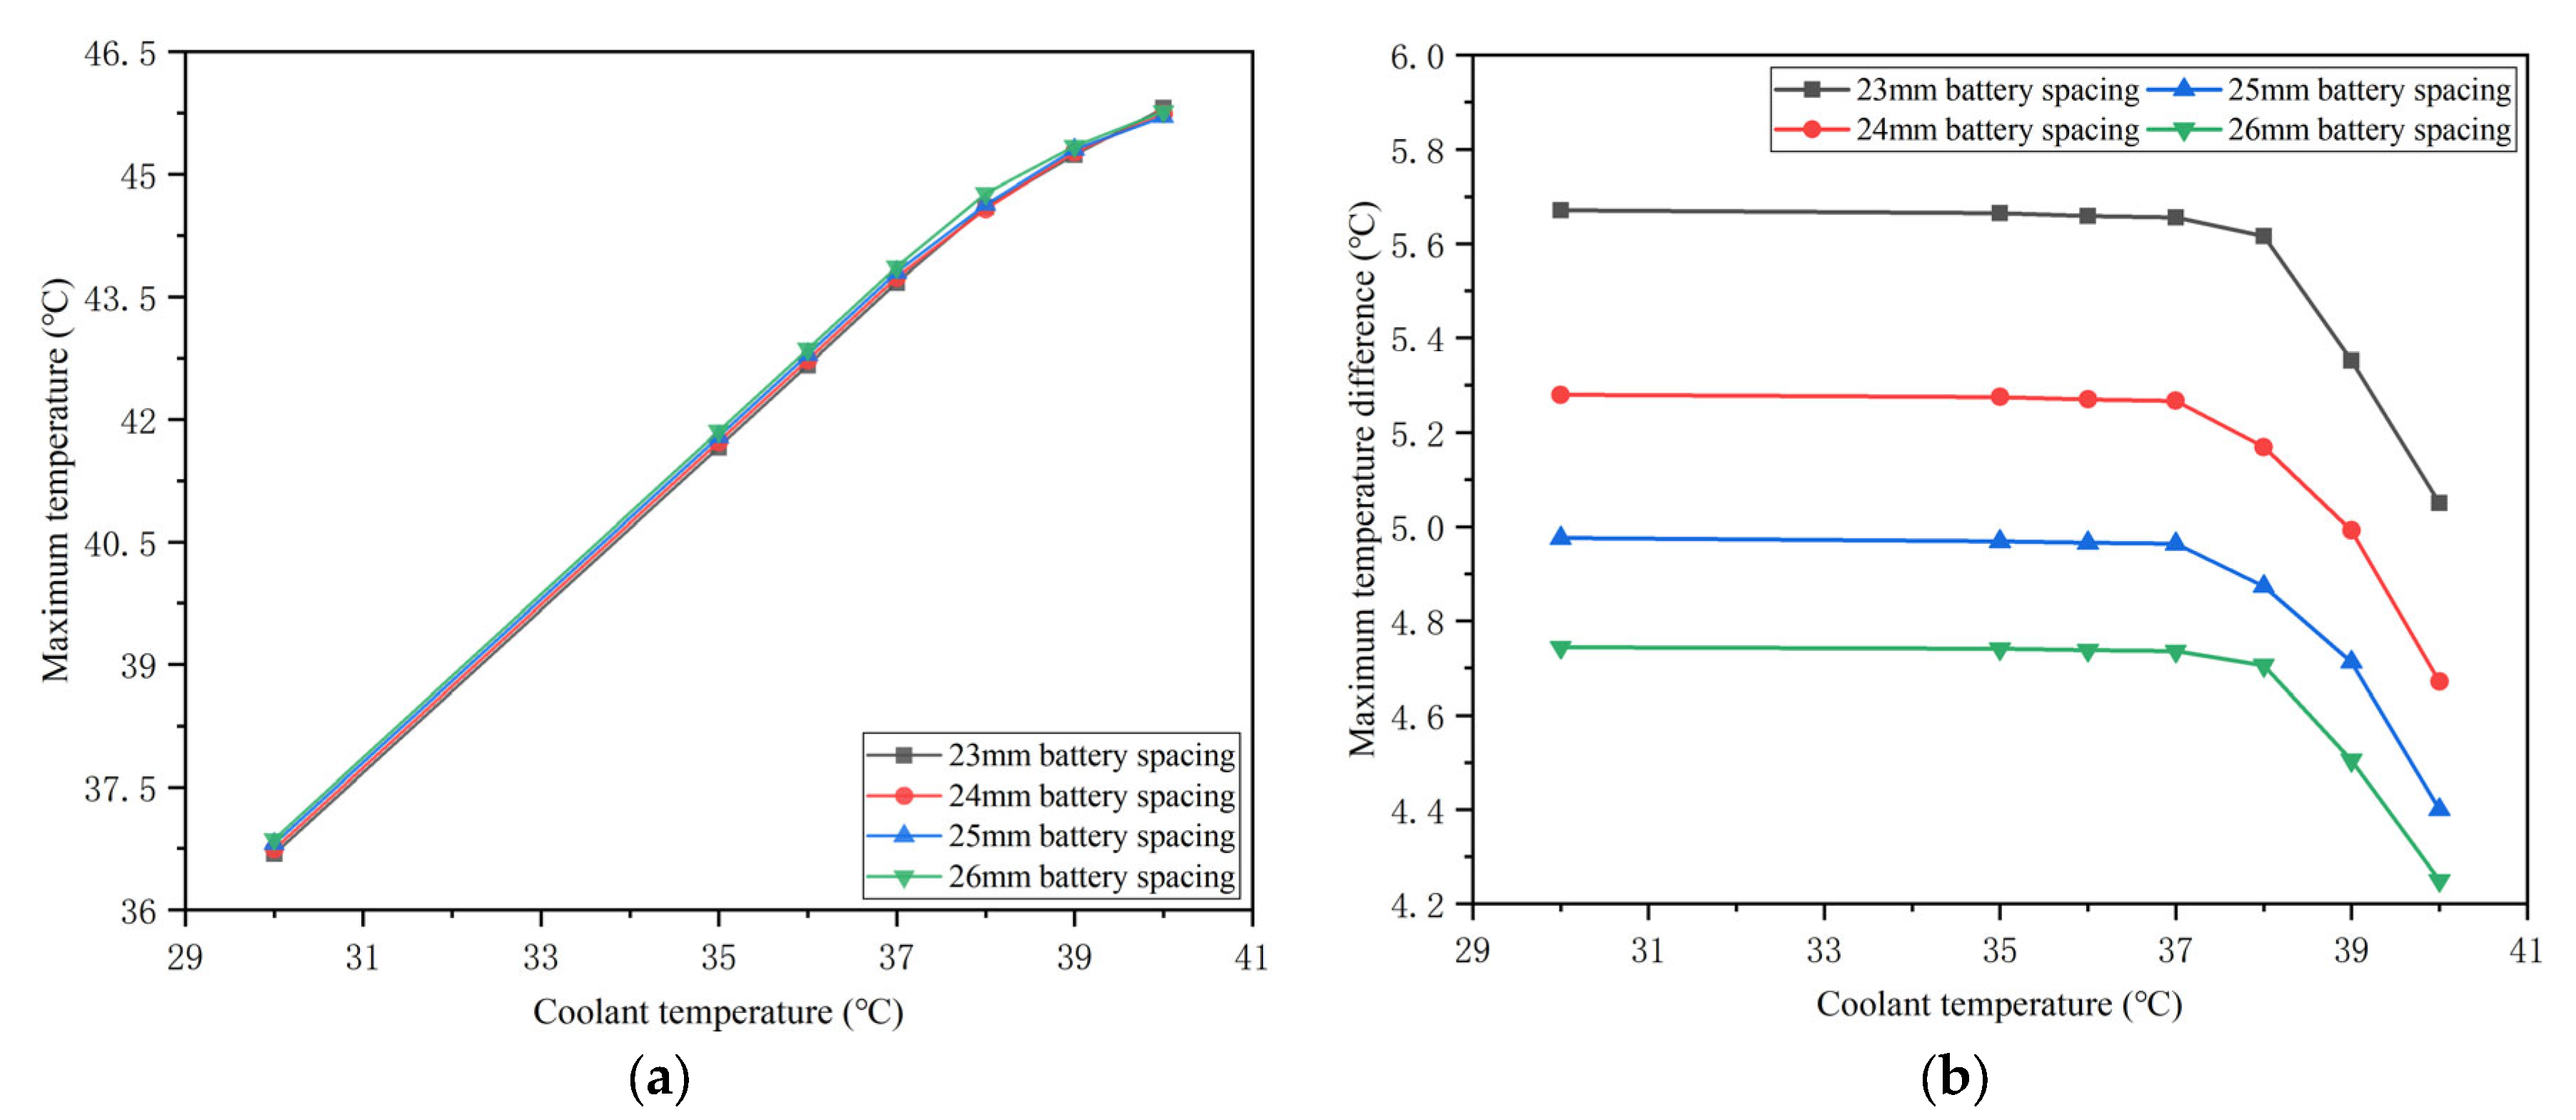
4.5. Effects of the Coolant Temperature

Based on the above discussion, six cooling pipes and counterflow coolant can be used to improve the maximum temperature and temperature difference in the battery. A large EG mass fraction of 12% is adopted to ensure a lower maximum temperature, and a larger battery spacing of 25 mm can reduce the maximum temperature difference to meet the requirements. Furtherly, to improve the cooling capacity of hybrid cooling BTMS in a high temperature environment, the method of precooling the coolant temperature below the ambient temperature is proposed. Therefore, this section will simulate the BTMS using different coolant temperatures (40 °C, 39 °C, 38 °C, 37 °C, 36 °C, 35 °C, 30 °C) under the environment temperature of 40 °C and discuss the maximum temperature and temperature difference in the battery under the conditions of different temperatures and cell spacing (23 mm, 24 mm, 25 mm, 26 mm).
Figure 20 shows the maximum battery temperature and temperature difference with different temperatures of precooled coolant and battery spacing at the 40 °C ambient temperature. It can be concluded that, with the decrease in coolant temperature, the maximum temperature of the battery decreases considerably, and the maximum temperature difference increases first and then remains unchanged at a constant external temperature and the battery spacing. Specifically, when the coolant temperature begins to drop from 40 °C, the corresponding maximum temperature difference in the battery will gradually increase. When the coolant precools to 37 °C, the maximum temperature difference in the battery will keep stable at a certain high value. The reason for the significant drop in maximum battery temperature at a low coolant temperature is that the heat transfer effect is strong due to the large temperature difference between the coolant and battery. In addition, the reasons for the changes in maximum temperature difference are as follows. When the temperature of the coolant is 37~40 °C, PCM and liquid cooling work together, and the control effect of liquid cooling on the battery temperature gradually becomes stronger as the coolant temperature decreases. Until the coolant temperature is low in the range of 30~37 °C, or even lower, PCM does not reach the melting temperature and only conducts heat, and the liquid cooling plays a leading cooling role, so the corresponding maximum temperature difference in the battery maintains no obvious change within a certain range.
At the same time, at a constant coolant temperature, the battery spacing has little effect on the maximum temperature of the battery but has a significant impact on the maximum temperature difference. When the battery spacing is 23 mm, the maximum temperature difference between the battery and coolant temperature exceeds 5 °C, which does not meet the uniformity requirements. Then, increasing the battery spacing to 24 mm, the maximum temperature difference in the battery is slightly improved, but only the 40 °C coolant without precooling can satisfy the requirements. However, until the spacing is increased to 25 mm, the maximum temperature difference in the battery at each coolant temperature is less than 5 °C. Further expanding the spacing will not be conducive to the compactness of the battery pack. Therefore, 25 mm is also used as the optimal battery spacing for the proposed honeycomb-structured BTMS under the condition of precooling.
The maximum temperature and temperature difference curves of the battery discharge process with different coolant temperatures under the selected optimized battery spacing are shown in Figure 21. As for the maximum temperature difference curve of the battery, it increases rapidly at first, and then it remains flat and finally rises. The lower the coolant temperature is, the higher the temperature difference is at the turning point in the early discharge process. When the battery starts to generate heat, a temperature gradient will form from the inside out in the early discharging stage. The lower the coolant temperature, the lower the minimum temperature of the battery surface, resulting in a rapid increase in the maximum temperature difference. Then, in the middle period of discharging, liquid cooling and PCM act the cooling effect, respectively, according to the different coolant temperatures, which not only makes the maximum battery temperature decrease or stable but also results in the temperature difference decreasing and reaching a balance. In the final stage of discharging, the temperature difference expands again due to the increase in the heat generation rate of the battery. It is worth noting that when the temperature difference between the coolant and the environment is more than 5 °C, the maximum temperature difference in the battery exceeds 5 °C in the discharge process. Therefore, when the liquid cooling can control the maximum battery temperature well, precooling the coolant to a too-low temperature is not recommended to avoid the maximum temperature difference in the discharge process not meeting the conditions. In addition, the maximum battery temperature increases rapidly first, and then it changes gently and finally rises sharply, because the PCM does not reach melting temperature and cannot absorb heat in the early discharge stage, and the heat generation rate of the battery increases rapidly in the last period of discharging. However, whether the maximum temperature rises or falls gently in the middle discharge process depends on the difference between the instantaneous heat generation of the battery and the heat dissipation of cooling measures. With the decrease in coolant temperature, the effect of liquid cooling becomes stronger, making the maximum temperature trend change from flat to falling.
Based on the above results, it can be concluded that precooling coolant has an obvious effect on reducing the maximum temperature of the battery. At the ambient temperature of 40 °C, the coolant temperature in the range of 37~40 °C has a significant effect on the maximum temperature difference, while a coolant temperature lower than 37 °C has little effect. In addition, too low a coolant temperature will cause the maximum temperature difference in the battery discharge process to be too high to meet the requirements. Considering the above rules and the structure compactness, the 25 mm battery spacing is selected as the optimal choice of the honeycomb-structured BTMS. The precooling coolant of 40 °C, 39 °C, 38 °C, 37 °C, 36 °C and 35 °C can be selected according to the battery requirements, compared with the corresponding pure PCM-based BTMS, the maximum temperature can be decreased by 0.48 °C, 0.88 °C, 1.55 °C, 2.38 °C, 3.39 °C and 4.39 °C, respectively. Meanwhile, this BTMS can satisfy the requirements of the maximum temperature difference in the battery under all the operating conditions mentioned in this study.

5. Conclusions

To improve the heat dissipation effect of the battery pack at high temperatures and high discharge rates, a battery thermal management system (BTMS) based on honeycomb-structured liquid cooling and phase change materials (PCM) is innovatively proposed in this paper. Moreover, the heat transfer simulations of the simplified model under different structural, material and operation parameters are carried out and analyzed. Through experimental and simulation results, the important findings can be described as follows:
  • The heat source expression of the battery can be obtained by combining the internal resistance and temperature rise experiment results with the Bernardi heat generation equation. According to the experiment results, the higher the discharge rate, the lower the total internal resistance and the higher the temperature rise at the same ambient temperature. In addition, with the decrease in the remaining energy, the total internal resistance of the battery is unchanged at first, and then it increases at the same ambient temperature and discharge rate.
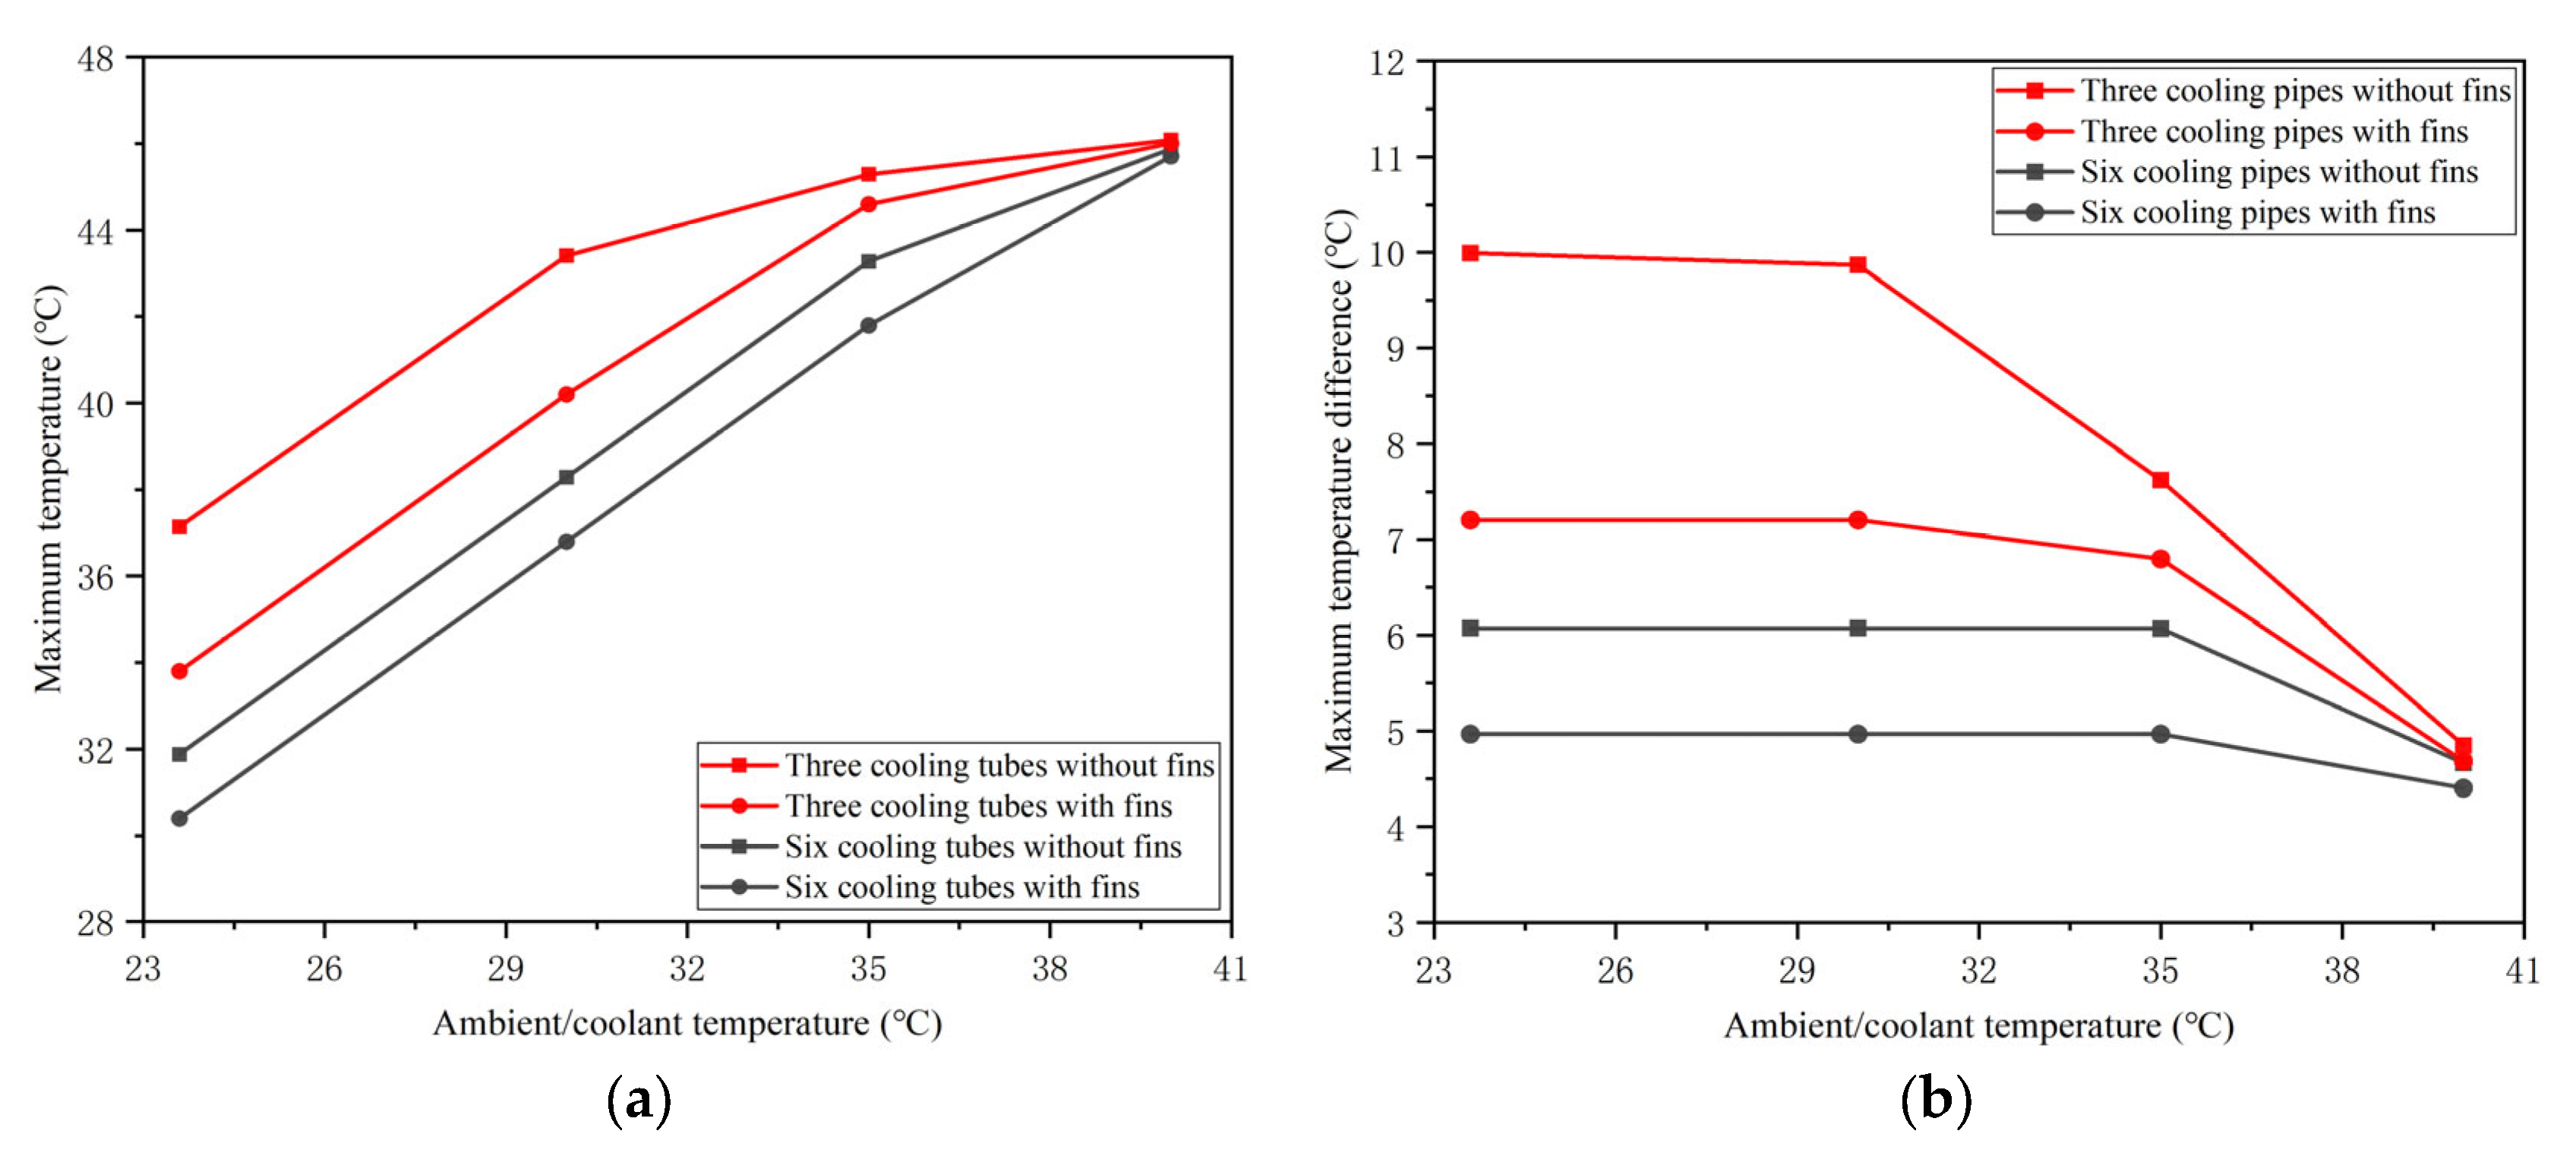
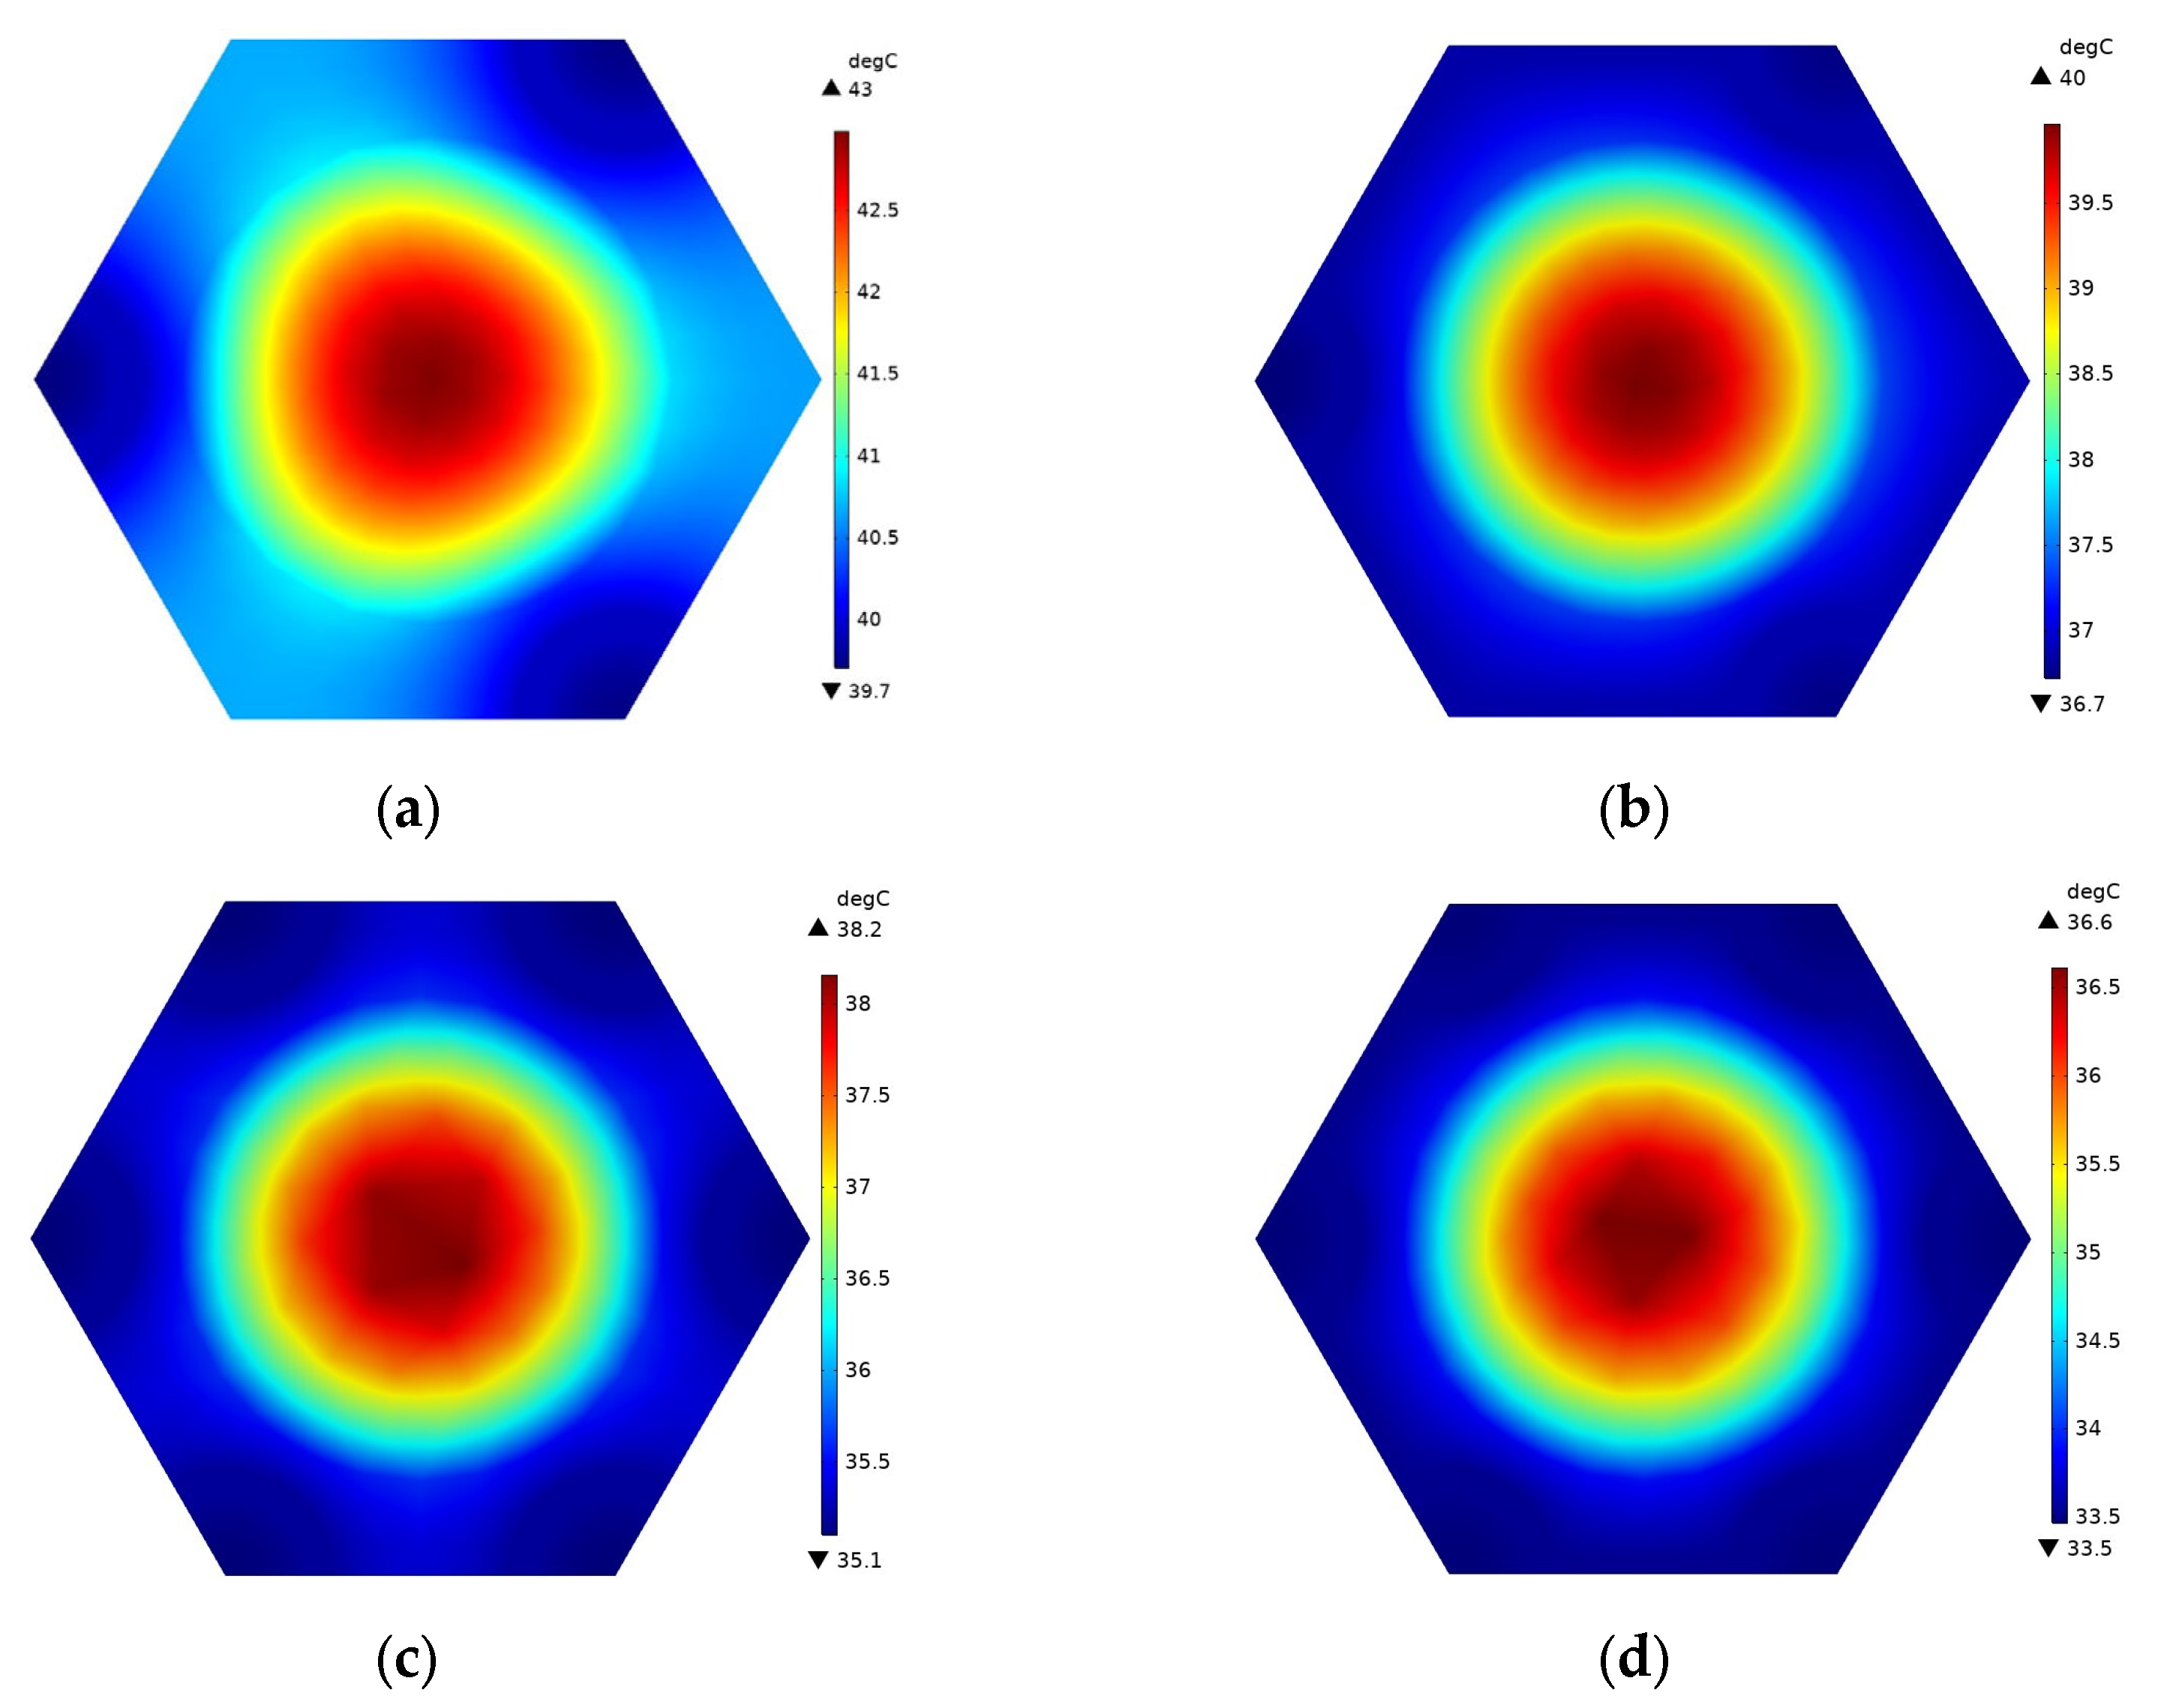
  • The proposed honeycomb structure composed of six cooling tubes and fins using the counter-flow coolant is the optimal basic scheme, which can significantly improve the thermal performance of the battery. In the environment of 40 °C, the maximum temperature and temperature difference in the battery can reach 45.71 °C and 4.4 °C, respectively. Moreover, the maximum battery temperature in this scheme will be further improved and can meet the uniformity requirements by decreasing the ambient temperature.
  • The battery spacing and the mass fraction of expanded graphite (EG) jointly affect the thermal performance of the battery at different temperatures. As the spacing between batteries increases, the corresponding maximum temperature difference in the battery will decrease. However, the effect of battery spacing on the maximum temperature is determined by the mass fraction of EG. At a high EG mass fraction, battery spacing has little impact on the maximum temperature. While the EG mass fraction is low, the maximum temperature increases as the battery spacing rises. In addition, increasing the mass fraction of EG can lower the maximum temperature of the battery and increase the maximum temperature difference.
  • The BTMS based on the honeycomb structure is relatively compact, and PCM plays the leading role of heat absorption at high temperatures, while liquid cooling has a significant effect at low temperatures. Meanwhile, precooling the coolant at high ambient temperatures can not only significantly reduce the battery temperature but also restore the heat storage capacity of PCM. Under the conditions of 40 °C ambient temperature and 5C discharge rate, the maximum battery temperature in the optimal BTMS cooled by 35 °C coolant is 41.79 °C, which is 4.39 °C lower than that of the corresponding pure PCM-based BTMS. Furthermore, when the temperature difference between the coolant and the environment is within 5 °C, the maximum temperature difference during the whole discharge process meets the uniformity requirements.
The proposed BTMS model has a compact structure, uniform heat dissipation, and can prevent the leakage of liquid PCM. To some extent, it can also reduce the harm of thermal runaway of the battery. However, due to the complexity of the structure and cooling measures, high manufacturing costs may be incurred. In addition, the simulation studies of the BTMS under conventional and high temperature and discharge rate conditions are carried out in this paper. To comprehensively consider the thermal performance of the proposed BTMS, more situations such as the actual cycle conditions, thermal runaway and other extreme conditions can be considered. Moreover, generalized optimization and parameter study are presented in this paper. For subsequent work, the response surface model, genetic algorithm and other mathematical models can be used to obtain more accurate optimal parameters.

Author Contributions

Conceptualization, J.X. and T.Y.; methodology, J.Z. and H.Z.; software, T.Y. and Q.X.; validation, S.S. and Q.X.; formal analysis, T.Y. and S.S.; investigation, S.S.; resources, J.X. and J.Z.; data curation, T.Y. and X.Z.; writing—original draft preparation, T.Y. and S.S.; writing—review and editing, J.X., J.Z. and H.Z.; visualization, Q.X.; supervision, X.Z.; project administration, J.Z. and J.X.; funding acquisition, J.X. and H.Z. All authors have read and agreed to the published version of the manuscript.

Funding

This research was funded by the Research Project of Wuhan University of Technology Chongqing Research Institute (YF 2021-08), the Science and Technology Development Foundation of CMVR from China Merchants Testing Certification Vehicle Technology Research Institute Co., Ltd. (20AKC3), the National Natural Science Foundation of China (51876113), the 111 Project of China (B17034), and the Innovative Research Team Development Program of Ministry of Education of China (IRT_17R83).

Data Availability Statement

The data are contained within the article.

Acknowledgments

Thanks should be given to Kodjo Agbossou for his helpful discussions.

Conflicts of Interest

The authors declare no conflict of interest.

References

  1. Landini, S.; Leworthy, J.; O’Donovan, T.S. A Review of Phase Change Materials for the Thermal Management and Isothermalisation of Lithium-Ion Cells. J. Storage Mater. 2019, 25, 100887. [Google Scholar] [CrossRef]
  2. Min, H.; Zhang, Z.; Sun, W.; Min, Z.; Yu, Y.; Wang, B. A thermal management system control strategy for electric vehicles under low-temperature driving conditions considering battery lifetime. Appl. Therm. Eng. 2020, 181, 115944. [Google Scholar] [CrossRef]
  3. Yang, X.; Deng, G.; Cai, Z.; Li, H.; Zeng, J.; Yang, H. Experimental study on novel composite phase change materials with room-temperature flexibility and high-temperature shape stability in a battery thermal management system. Int. J. Heat Mass Transfer 2023, 206, 123953. [Google Scholar] [CrossRef]
  4. Shelkea, A.V.; Buston, J.E.H.; Gill, J.; Howard, D.; Williams, R.C.E.; Read, E.; Abaza, A.; Cooper, B.; Richards, P.; Wen, J.X. Combined numerical and experimental studies of 21,700 lithium-ion battery thermal runaway induced by different thermal abuse. Int. J. Heat Mass Transfer 2022, 194, 123099. [Google Scholar] [CrossRef]
  5. Kang, D.; Lee, P.-Y.; Yoo, K.; Kim, J. Internal thermal network model-based inner temperature distribution of high-power lithium-ion battery packs with different shapes for thermal management. J. Storage Mater. 2020, 27, 101017. [Google Scholar] [CrossRef]
  6. Liu, H.; Wei, Z.; He, W.; Zhao, J. Thermal issues about Li-ion batteries and recent progress in battery thermal management systems: A review. Energy Convers. Manag. 2017, 150, 304–330. [Google Scholar] [CrossRef]
  7. Rao, Z.; Qian, Z.; Kuang, Y.; Li, Y. Thermal performance of liquid cooling based thermal management system for cylindrical lithium-ion battery module with variable contact surface. Appl. Therm. Eng. 2017, 123, 1514–1522. [Google Scholar] [CrossRef]
  8. Landini, S.; O’Donovan, T.S. Experimental investigation of lithium-ion cells ageing under isothermal conditions for optimal lifetime performance. J. Storage Mater. 2022, 48, 103680. [Google Scholar] [CrossRef]
  9. Lisbona, D.; Snee, T. A review of hazards associated with primary lithium and lithium-ion batteries. Process Saf. Environ. Prot. 2011, 89, 434–442. [Google Scholar] [CrossRef]
  10. Wang, Q.; Jiang, B.; Li, B.; Yan, Y. A critical review of thermal management models and solutions of lithium-ion batteries for the development of pure electric vehicles. Renew. Sustain. Energy Rev. 2016, 64, 106–128. [Google Scholar] [CrossRef]
  11. Akinlabi, A.A.H.; Solyali, D. Configuration, design, and optimization of air-cooled battery thermal management system for electric vehicles: A review. Renew. Sustain. Energy Rev. 2020, 125, 109815. [Google Scholar] [CrossRef]
  12. Weragoda, D.M.; Tian, G.; Burkitbayev, A.; Lo, K.-H.; Zhang, T. A comprehensive review on heat pipe based battery thermal management systems. Appl. Therm. Eng. 2023, 224, 120070. [Google Scholar] [CrossRef]
  13. Panchal, S.; Dincer, I.; Agelin-Chaab, M.; Fraser, R.; Fowler, M. Experimental and theoretical investigation of temperature distributions in a prismatic lithium-ion battery. Int. J. Therm. Sci. 2016, 99, 204–212. [Google Scholar] [CrossRef]
  14. Gungor, S.; Cetkin, E.; Lorente, S. Canopy-to-canopy liquid cooling for the thermal management of lithium-ion batteries, a constructal approach. Int. J. Heat Mass Transfer 2022, 182, 121918. [Google Scholar] [CrossRef]
  15. Tong, W.; Somasundaram, K.; Birgersson, E.; Mujumdar, A.S.; Yap, C. Numerical investigation of water cooling for a lithium-ion bipolar battery pack. Int. J. Therm. Sci. 2015, 94, 259–269. [Google Scholar] [CrossRef]
  16. Yin, B.; Zuo, S.; Xu, Y.; Chen, S. Performance of liquid cooling battery thermal management system in vibration environment. J. Storage Mater. 2022, 53, 105232. [Google Scholar] [CrossRef]
  17. Lai, Y.; Wu, W.; Chen, K.; Wang, S.; Xin, C. A compact and lightweight liquid-cooled thermal management solution for cylindrical lithium-ion power battery pack. Int. J. Heat Mass Transfer 2019, 144, 118581. [Google Scholar] [CrossRef]
  18. Liu, Z.; Wang, H.; Yang, C.; Zhao, J. Simulation study of lithium-ion battery thermal management system based on a variable flow velocity method with liquid metal. Appl. Therm. Eng. 2020, 179, 115578. [Google Scholar] [CrossRef]
  19. Wang, Y.; Wang, Z.; Min, H.; Li, H.; Li, Q. Performance investigation of a passive battery thermal management system applied with phase change material. J. Storage Mater. 2021, 35, 102279. [Google Scholar] [CrossRef]
  20. Lazrak, A.; Fourmigué, J.-F.; Robin, J.-F. An innovative practical battery thermal management system based on phase change materials: Numerical and experimental investigations. Appl. Therm. Eng. 2018, 128, 20–32. [Google Scholar] [CrossRef]
  21. Luo, J.; Zou, D.; Wang, Y.; Wang, S.; Huang, L. Battery thermal management systems (BTMs) based on phase change material (PCM): A comprehensive review. Chem. Eng. J 2022, 430, 132741. [Google Scholar] [CrossRef]
  22. He, J.; Yang, X.; Zhang, G. A phase change material with enhanced thermal conductivity and secondary heat dissipation capability by introducing a binary thermal conductive skeleton for battery thermal management. Appl. Therm. Eng. 2019, 148, 984–991. [Google Scholar] [CrossRef]
  23. Jiang, G.; Huang, J.; Fu, Y.; Cao, M.; Liu, M. Thermal optimization of composite phase change material/expanded graphite for Li-ion battery thermal management. Appl. Therm. Eng. 2016, 108, 1119–1125. [Google Scholar] [CrossRef]
  24. Mauro, G.M.; Iasiello, M.; Bianco, N.; Chiu, W.K.S.; Naso, V. Mono- and Multi-Objective CFD Optimization of Graded Foam-Filled Channels. Materials 2022, 15, 968. [Google Scholar] [CrossRef] [PubMed]
  25. Verma, A.; Rakshit, D. Performance analysis of PCM-fin combination for heat abatement of Li-ion battery pack in electric vehicles at high ambient temperature. Therm. Sci. Eng. Prog 2022, 32, 101314. [Google Scholar] [CrossRef]
  26. Arshad, A.; Jabbal, M.; Sardari, P.T.; Bashir, M.A.; Faraji, H.; Yan, Y. Transient simulation of finned heat sinks embedded with PCM for electronics cooling. Therm. Sci. Eng. Prog 2020, 18, 100520. [Google Scholar] [CrossRef]
  27. Bianco, N.; Busiello, S.; Iasiello, M.; Mauro, G.M. Finned heat sinks with phase change materials and metal foams: Pareto optimization to address cost and operation time. Appl. Therm. Eng. 2021, 197, 117436. [Google Scholar] [CrossRef]
  28. Lebrouhi, B.E.; Lamrani, B.; Ouassaid, M.; Abd-Lefdil, M.; Maaroufi, M.; Kousksou, T. Low-cost numerical lumped modelling of lithium-ion battery pack with phase change material and liquid cooling thermal management system. J. Storage Mater. 2022, 54, 105293. [Google Scholar] [CrossRef]
  29. Fan, Y.; Wang, Z.; Xiong, X.; Zhu, J.; Gao, Q.; Wang, H.; Wu, H. Novel concept design of low energy hybrid battery thermal management system using PCM and multistage Tesla valve liquid cooling. Appl. Therm. Eng. 2023, 220, 119680. [Google Scholar] [CrossRef]
  30. Xin, Q.; Xiao, J.; Yang, T.; Zhang, H.; Long, X. Thermal management of lithium-ion batteries under high ambient temperature and rapid discharging using composite PCM and liquid cooling. Appl. Therm. Eng. 2022, 210, 118230. [Google Scholar] [CrossRef]
  31. Weng, J.; Xiao, C.; Yang, X.; Ouyang, D.; Chen, M.; Zhang, G.; Lee Waiming, E.; Kit Yuen, R.K.; Wang, J. An energy-saving battery thermal management strategy coupling tubular phase-change-material with dynamic liquid cooling under different ambient temperatures. Renew. Energ. 2022, 195, 918–930. [Google Scholar] [CrossRef]
  32. Peng, P.; Wang, Y.; Jiang, F. Numerical study of PCM thermal behavior of a novel PCM-heat pipe combined system for Li-ion battery thermal management. Appl. Therm. Eng. 2022, 209, 118293. [Google Scholar] [CrossRef]
  33. Qi, X.; Sajadi, S.M.; Mahmoud, M.Z.; Li, Z.; Shamseldin, M.A.; Aybar, H.Ş. Study of circular, horizontal and vertical elliptical enclosures filled with phase change material in thermal management of lithium-ion batteries in an air-cooled system. J. Storage Mater. 2022, 53, 105041. [Google Scholar] [CrossRef]
  34. Yang, W.; Zhou, F.; Liu, Y.; Xu, S.; Chen, X. Thermal performance of honeycomb-like battery thermal management system with bionic liquid mini-channel and phase change materials for cylindrical lithium-ion battery. Appl. Therm. Eng. 2021, 188, 116649. [Google Scholar] [CrossRef]
  35. Zhao, D.; Lei, Z.; An, C. Research on battery thermal management system based on liquid cooling plate with honeycomb-like flow channel. Appl. Therm. Eng. 2023, 218, 119324. [Google Scholar] [CrossRef]
  36. Wang, S.; Fernandez, C.; Yu, C.; Fan, Y.; Cao, W.; Stroe, D.-I. A novel charged state prediction method of the lithium ion battery packs based on the composite equivalent modeling and improved splice Kalman filtering algorithm. J. Power Sources 2020, 471, 228450. [Google Scholar] [CrossRef]
  37. Landini, S.; O’Donovan, T.S. Novel experimental approach for the characterisation of Lithium-Ion cells performance in isothermal conditions. Energy 2021, 214, 118965. [Google Scholar] [CrossRef]
  38. Newman, J.; Bernardi, D.; Pawlikowski, E. A General Energy-Balance for Battery Systems. J. Electrochem. Soc. 1985, 132, 5. [Google Scholar]
  39. Liu, F.; Wang, J.; Liu, Y.; Wang, F.; Yang, N.; Liu, X.; Liu, H.; Li, W.; Liu, H.; Huang, B. Performance analysis of phase change material in battery thermal management with biomimetic honeycomb fin. Appl. Therm. Eng. 2021, 196, 117296. [Google Scholar] [CrossRef]
  40. Weng, J.; He, Y.; Ouyang, D.; Yang, X.; Chen, M.; Cui, S.; Zhang, G.; Yuen, R.K.K.; Wang, J. Honeycomb-inspired design of a thermal management module and its mitigation effect on thermal runaway propagation. Appl. Therm. Eng. 2021, 195, 117147. [Google Scholar] [CrossRef]
  41. Lu, J. The Research and Simulation Analysis of Heat Dissipation with Liquid Cooling for the Power Battery Pack of Pure Electric Vehicles. Master’ Thesis, University of Electronic Science and Technology of China, Chengdu, China, 2018. [Google Scholar]
  42. Ling, Z.; Chen, J.; Xu, T.; Fang, X.; Gao, X.; Zhang, Z. Thermal conductivity of an organic phase change material/expanded graphite composite across the phase change temperature range and a novel thermal conductivity model. Energy Convers. Manag. 2015, 102, 202–208. [Google Scholar] [CrossRef]
Figure 1. Experimental platform for internal resistance and temperature rise tests.
Batteries 09 00287 g001
Figure 2. Relationship between discharge internal resistance and SOC of battery at different rates.
Batteries 09 00287 g002
Figure 3. Surface temperature at different thermocouple locations and average temperature of battery during the discharge process at 1C, 2C, 3C and 5C.
Batteries 09 00287 g003
Figure 4. Volume heat generation rate of the battery with different SOC at 1C, 2C, 3C and 5C.
Batteries 09 00287 g004
Figure 5. BTMS model based on the honeycomb structure: (a) battery pack, (b) simplified model and (c) schematic components.
Batteries 09 00287 g005
Figure 6. Grid model of the simplified BTMS based on the honeycomb structure.
Batteries 09 00287 g006
Figure 7. Verification of single battery simulation model for the average surface temperature (a) and grid independence of simplified BTMS based on the honeycomb structure (b).
Batteries 09 00287 g007
Figure 8. Maximum temperature (a) and temperature difference (b) of battery at different ambient/coolant temperatures and honeycomb cooling structures.
Batteries 09 00287 g008
Figure 9. Temperature distribution at 1/2 height of battery packs with different honeycomb structures at the ambient temperature of 30 °C: (a) three cooling tubes without fins, (b) three cooling tubes with fins, (c) six cooling tubes without fins and (d) six liquid cooling tubes with fins.
Batteries 09 00287 g009
Figure 10. Different coolant flow directions at the end face of the BTMS model: Case (a): three tubes with parallel flow coolant; Case (b): three tubes with counter-flow coolant; Case (c): six tubes with parallel flow coolant; and Case (d): six tubes with counter-flow coolant.
Batteries 09 00287 g010
Figure 11. Maximum temperature (a) and maximum temperature difference (b) of battery under different ambient/coolant temperatures, cooling pipe numbers and flow directions.
Batteries 09 00287 g011
Figure 12. Maximum temperature of the battery in BTMS with different EG mass fractions and cell spacing at (a) 40 °C and (b) 23.6 °C ambient/coolant temperatures.
Batteries 09 00287 g012
Figure 13. Temperature distribution at the upper-end surface of BTMS at 40 °C ambient/coolant temperature, 24 mm battery spacing and different EG mass fractions.
Batteries 09 00287 g013
Figure 14. Maximum temperature difference in battery in BTMS with different EG mass fractions and cell spacing at (a) 40 °C and (b) 23.6 °C ambient/coolant temperatures.
Batteries 09 00287 g014
Figure 15. Maximum temperature difference in battery in 25 mm battery spacing BTMS with different EG mass fractions at various ambient/coolant temperatures.
Batteries 09 00287 g015
Figure 16. Maximum temperature of the battery in BTMS with different battery spacing and EG mass fractions at (a) 40 °C and (b) 23.6 °C ambient/coolant temperatures.
Batteries 09 00287 g016
Figure 17. Maximum temperature difference in battery in BTMS with different cell spacing and EG mass fractions at (a) 40 °C and (b) 23.6 °C ambient/coolant temperatures.
Batteries 09 00287 g017
Figure 18. Maximum temperature difference in battery and total volume/mass of BTMS unit with 12% EG mass fraction at various ambient/coolant temperatures, (a) different spacing and (b) optimal battery spacing of 25 mm.
Batteries 09 00287 g018
Figure 19. Temperature distribution at the upper-end surface of BTMS at 23.6 °C ambient/coolant temperature, 12% EG mass fraction and different battery spacing.
Batteries 09 00287 g019
Figure 20. Maximum temperature (a) and maximum temperature difference (b) of battery under the ambient temperature of 40 °C, different coolant temperatures and battery spacing.
Batteries 09 00287 g020
Figure 21. Maximum temperature (a) and maximum temperature difference (b) of battery during discharging process under 40 °C ambient temperature, 25 mm battery spacing and different coolant temperatures.
Batteries 09 00287 g021
Table 1. Relevant parameters of INR18650/25P cylindrical battery.
Key IndicatorsData
Nominal capacity2500 mAh
Nominal voltage3.6 V
Standard charging mode1.25 A constant current charge to 4.20 V, constant voltage charge to 100 mA
Charge/Discharge cut-off voltage4.2 V/2.5 V
Maximum charge/discharge current4 A/30 A
Battery height65.00 ± 0.15 mm
Battery diameter18.35 ± 0.10 mm
Battery weight48 g
Table 2. Test accuracy of experimental instruments.
Experimental InstrumentsAccuracy
Thermostat chamber0.5%
Data acquisition recorder0.05%
T-type thermocouples1%
Battery test system0.2%
Table 3. Expression and coefficients of volume heat generation rate of battery at different discharge rates.
Discharge
Rate
  Q v = k 0 + k 1 t + k 2 t 2 + k 3 t 3 + k 4 t 4 + k 5 t 5 + k 6 t 6
  k 0   k 1   k 2   k 3   k 4   k 5   k 6
1C13,752.01−0.4910.0117−2.047 × 10−51.403 × 10−8−4.368 × 10−125.202 × 10⁻¹⁶
2C43,722.6520.752−0.04963.731 × 10−5−1.376 × 10⁻⁸−2.123 × 10−125.01 × 10⁻¹⁵
3C88,659.7760.361−0.0496−3.859 × 10−45.395 × 10−7−5.914 × 10⁻¹¹−7.776 × 10⁻¹⁴
5C200,078.4280.647−0.5359−3.14 × 10−33.359 × 10−61.409 × 10⁻⁸−1.651 × 10⁻¹¹
Table 4. Physical property parameters of each part of the proposed BTMS.
MaterialsDensitySpecific Heat
Capacity
Thermal
Conductivity
Dynamic
Viscosity
kg/m3J/(kg·K)W/(m·K)Pa·s
Battery2755.91129.95Radial 1.6-
Axial 27
Aluminum2719871238-
Water99841800.5991.01 × 10−3
Table 5. Thermophysical PA/EG-type CPCM with different EG mass fractions [23].
CPCMSpecific Heat
Capacity
Thermal
Conductivity
Latent
Heat
Melting
Temperature
Density
J/(kg·K)W/(m·K)kJ/kgKkg/m3
PA/0 wt%EG20000.2275314–317800
PA/3 wt%EG19630.58266.8314–317825
PA/6 wt%EG19261.23258.5314–317832
PA/9 wt%EG18893.15250.3314–317845
PA/12 wt%EG18525.74242314–317897
PA/20 wt%EG175410.6220314–317913
Disclaimer/Publisher’s Note: The statements, opinions and data contained in all publications are solely those of the individual author(s) and contributor(s) and not of MDPI and/or the editor(s). MDPI and/or the editor(s) disclaim responsibility for any injury to people or property resulting from any ideas, methods, instructions or products referred to in the content.

