Article

Simulating the Electrochemical-Thermal Behavior of a Prismatic Lithium-Ion Battery on the Market under Various Discharge Cycles

1
CNR—STEMS, Institute of Science and Technology for Sustainable Energy and Mobility of the National Research Council of Italy, 44124 Ferrara, Italy
2
CNR—STEMS, Institute of Science and Technology for Sustainable Energy and Mobility of the National Research Council of Italy, 80125 Napoli, Italy
*
Author to whom correspondence should be addressed.
Batteries 2023, 9(8), 397; https://doi.org/10.3390/batteries9080397
Submission received: 19 May 2023 / Revised: 11 July 2023 / Accepted: 26 July 2023 / Published: 30 July 2023
(This article belongs to the Section Battery Modelling, Simulation, Management and Application)

Abstract

:
In this paper, a computational fluid dynamics (CFD) model to predict the transient temperature distributions of a prismatic lithium-ion polymer battery (LiPo) cooled by natural convection at various discharge cycles is developed. The thermal behavior of a lithium-ion (Li-ion) battery cell is important for its safety, performance and degradation, and it requires both measurement and modeling. However, most existing thermal models for Li-ion battery cells only account for steady-state temperature fields, while the exercise of a Li-ion battery cell is usually transitory. The Newman’s pseudo-2D approach was used to perform an electrochemical CFD analysis. This approach treats the porous electrode as a collection of equal-sized, isotropic, homogeneous spherical particles. This simplifies the electrode microstructure and assumes a smooth and uniform lithium insertion/extraction in the electrode. The model has been validated through variable discharge rate experimental tests in a controlled chamber. Additionally, infrared images of the battery cell during discharging are taken and the experimental numerical gradient temperature was compared. We have validated the CFD simulations by comparing the temperature, state of charge and voltage curves with experimental data. The model predictions match the experimental data very well. The difficulty in CFD battery simulations with an electrochemical approach lies in the setting of many physical parameters that are difficult to find. In this work, the parameters’ characteristics of the simulated battery are assumed and validated; these can be useful for modeling batteries of the same type. Consequently, the model developed in this work can be applied to predict the temperature distribution of the LiPo prismatic battery and can be used by the battery designers and by the designers of all systems that include batteries.

1. Introduction

A historical overview of lithium batteries is provided by [1]. In the article he discusses the evolution of lithium batteries and their applications over time. The issues and challenges facing rechargeable lithium batteries are discussed by [2]. They highlight the importance of developing new materials and technologies to improve the performance and safety of these batteries. The challenges of developing better batteries and the importance of finding sustainable ways to provide power for modern lifestyles are described by [3]. They also highlight the need for new materials and technologies to improve battery performance and safety. Lithium batteries are common nowadays. The main steps that led to the success and industrial production in a relatively short time have been described by [
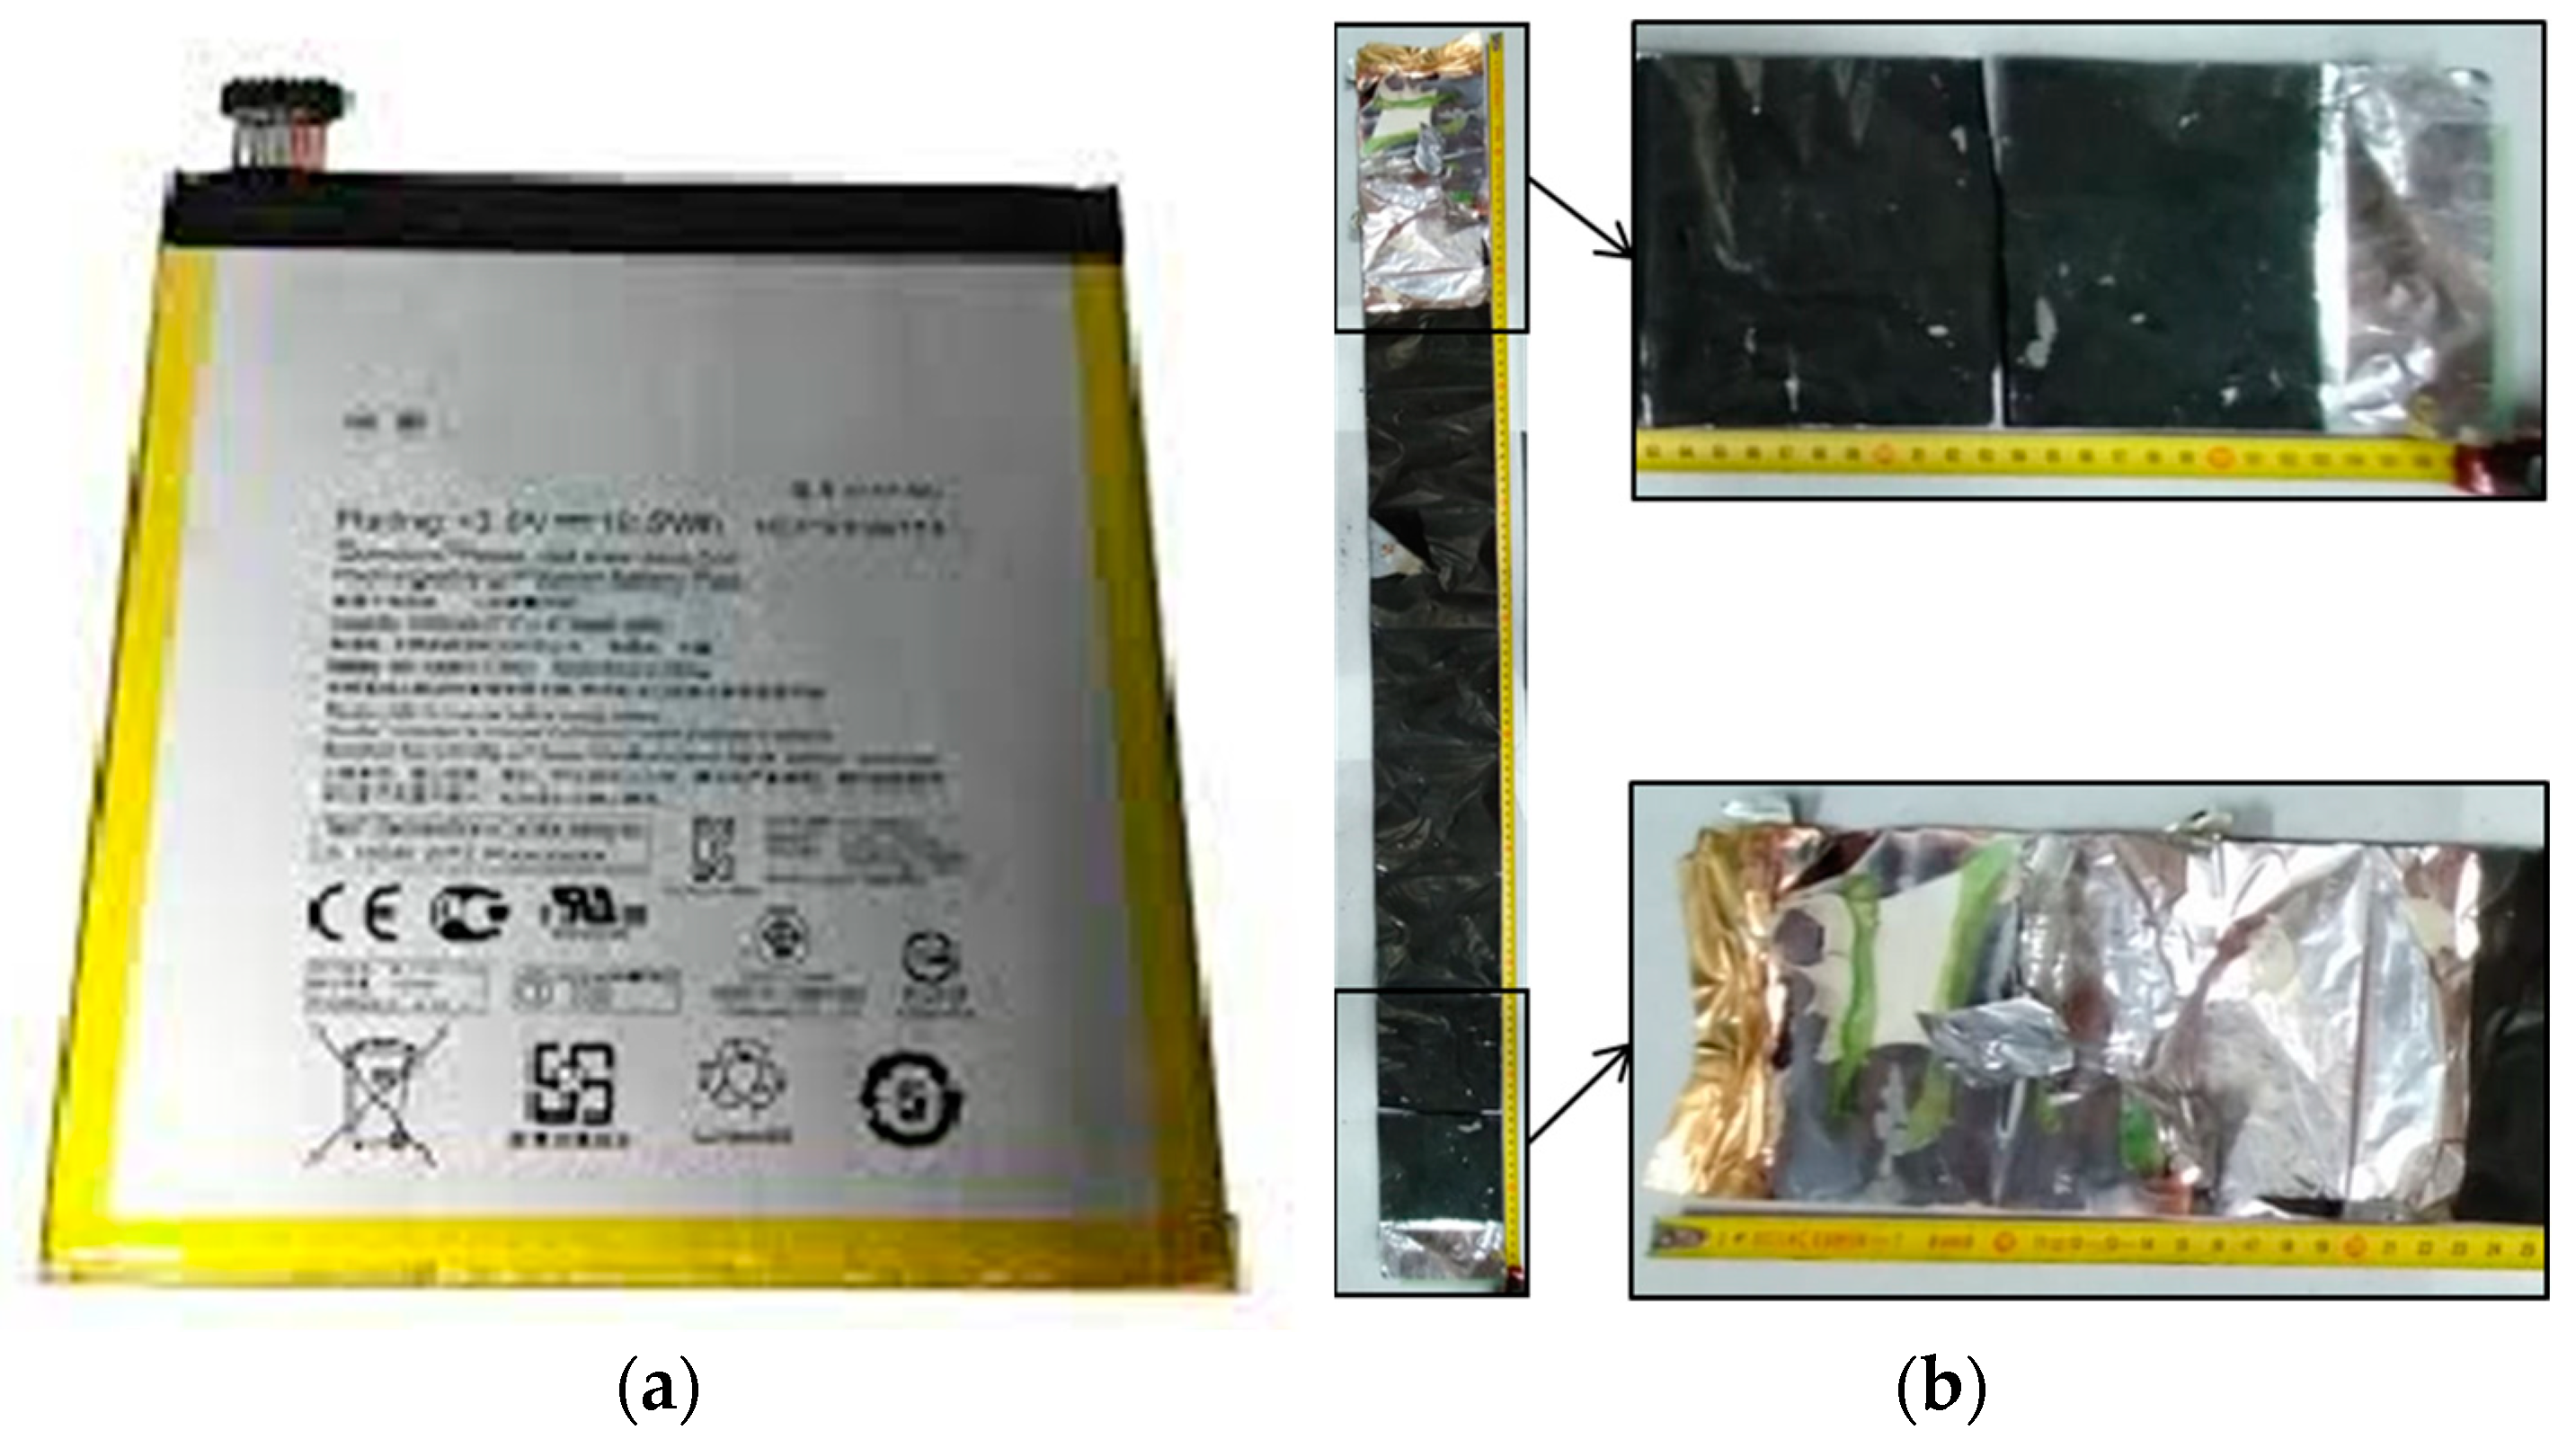
4]. Lithium batteries are marketed in a wide range of shapes and sizes. They mainly come in configurations: cylindrical, button, pouch and prismatic. The battery used in this study is a LiPo and falls into the single prismatic cell type. The long-term durability and safety features of Li-ion batteries are major limitations for their performance [5]. Li-ion batteries typically operate within the temperature range of 0–40 °C. Excessive or uneven heat generation in the cells can cause cell degradation and cell breakdown. Cell degradation results in a significant reduction in open circuit voltage and electric capacity, while cell failure can result in thermal runaway or even a fire hazard [6].
Therefore, in the Li-ion battery design process, the thermal management has to be carefully considered to ensure that the operating temperature of the batteries stays within a narrow optimal range [7].
To achieve this goal, simulation can be used, which allows you to predict system performance as an alternative to experimental tests, which in addition to a high cost, may have some limitations: in some cases, it may be difficult to calculate physical quantities, such as temperature in the heart of the component.
There are different types of simulation models for batteries, the main categories are analytical models, equivalent circuit models (ECM) and electrochemical models [8]. Analytical models are the simplest and fastest, but also the least accurate. They use mathematical equations to describe the battery behavior [9]. ECM are based on electrical components that mimic the battery dynamics, such as resistors, capacitors and voltage sources. They can capture the nonlinear effects of temperature, state of charge (SOC) and state of health on the battery performance. They are intended for dynamic and long-run simulation studies [10]. Electrochemical models describe the physical and chemical processes that occur inside the battery, such as diffusion, reaction and transport. They are the most accurate and detailed, but also the most complex and computationally intensive. They are suitable for battery design and analysis at the molecular level [8]. Several studies have examined the thermal behavior of Li-ion batteries using various methods and models. For example, a 3-D CFD model was developed by [11] to analyze the natural convection effects on the batteries. A Li-ion battery module was investigated both experimentally and computationally by [12] for its thermal management. A mathematical model and infrared images were used by [13] to estimate the transient temperature distributions of a large-sized 20Ah-LiFePO4 prismatic battery at various discharge rates. A similar approach was used by [14] to study the transient temperature and voltage distributions of 18650 cylindrical Li-ion battery at different C-rates with an air-cooling method. Later, they developed a numerical model using commercial code. Two cooling methods for Li-ion battery cells used in electric vehicles are compared by [15]: immersion cooling and cold-plate based cooling for different discharge rates and for different coolant flow rates by performing 3D CFD simulations using an experimentally validated numerical methodology. A combination of CFD simulations and optical measurements was employed by [16] to explore the distribution of the vanadium electrolyte and an alternative fluid substitute in a carbon felt electrode in three dimensions. They obtained qualitatively consistent results. Different cell arrangement structures and various air-cooling strategies were evaluated by [7] for their effects on the thermal performance of a battery module. They used a 3D CFD method and a lumped model of a single cell in the simulation. [17] Furthermore, a calibration of the model was performed based on the experimental tests to obtain more accurate results. A study on the thermal characteristics of Li-ion batteries is described by [18]. The authors created a 3D electrochemical-thermal-flow coupling model. Through the analysis of simulation results, they explored the thermal characteristics of Li-ion batteries for electric vehicles. The thermal characterization of a commercially available Li-ion battery is discussed by [19]. The study measures the heat generation of the battery at different operating conditions and charge and discharge rates. The study found some important parameters that have a significant influence on total generated heat. The heat generation during charging and discharging of a battery and how it affects temperature behaviors is discussed by [20]. The study shows that enthalpy heating and heat of mixing, generally neglected, should be included to accurately and completely describe the heat generation. An electrochemical-thermal model including these additional terms is experimentally validated against calorimetric measurements. An electrochemical-thermal model for a commercial Li-ion battery to simulate the distribution of electrochemical and thermal variables 3D through the electrode layers in the pouch cell is presented by [21]. The model is validated against experimental voltage and temperature distribution data. A physics-based electrochemical model for the study of Li-ion batteries is presented by [22]. The article discusses two challenges to apply Newman’s models in the electrochemical-thermal coupled battery simulation. A 3D thermal modeling of a single Li-ion battery cell and a 50 V Li-ion battery pack composed of 14 prismatic batteries using an ECM for subscale electrochemical modeling was developed by [23]. The study aimed to predict the thermal behavior of the battery pack under fast discharging and abusive conditions. A 3D electrochemical-thermal coupled model was developed by [24] for a 30 Ah ternary cathode Li-ion battery. The model was used to study the internal electrochemical processes and thermal characteristics and results were compared with experimental data showing a good agreement. An insight into the discharge behavior of Li-ion batteries based on investigations conducted by researchers was given by [25]. The Dual-Potential Multi-Scale Multi-Domain (MSMD) Battery Model was used to analyze the discharge behavior of Li-ion batteries. The development of 3D-FEA models to simulate the electro-thermal behavior of Li-ion battery cells with various geometries is described by [26]. They focus on the thermal behavior of Li-ion battery cells with different geometries, electrical loads and cooling conditions. Modeling results and performance prediction for a Li-ion battery are presented and compared to experimental data for several different experimental cell configurations on both charge and discharge by [27] and different system designs are explored using the mathematical model. A model for the galvanostatic charge and discharge of a lithium cell with a lithium anode, solid polymer separator and insertion cathode is described by [17]. The model uses concentrated solution theory and is general enough to include a wide range of polymeric separator materials, lithium salts and composite insertion cathodes. The insertion of lithium into the active cathode material is simulated using superposition, greatly simplifying numerical calculations. A study that investigates the nail penetration process in a large-format Li-ion cell using a 3D multiscale electrochemical-thermal coupled model is described by [28]. The study reveals strong coupling of the cell thermal response and electrochemical behavior, which is influenced substantially by key parameters. A 3D electrochemical-thermal coupled model is used by [29] to scrutinize the internal short circuit process in a large-format Li-ion cell and a parametric study was carried out.
In this paper, a numerical and experimental validation of a prismatic Li-ion battery is carried out using the Newman’s pseudo-2D approach also called Newman’s approach in commercial code. To date, studies on CFD modeling of Li-ion batteries are few and only a part of these have been developed with an electrochemical approach. This approach can accurately capture Li-ion migration in the cell. The electrochemical models require many parameters to be set which are different according to the type of cell. These parameters are difficult to find in the literature and depend on the type of battery and on the materials used for the cells. Through this work they are highlighted and experimentally validated so that they can be used for the simulation and optimization of other batteries.

2. Test Case and Experimental Analysis

2.1. Battery

An LMP battery is used and shown in Figure 1. The positive current collector is made of aluminum, while the negative is made of copper. The cathode material is LiMn2O4 while the anode is LiC6 (graphite). The battery has a capacity of 4890 mAh, a discharge nominal voltage of 3.8 V and a rated power of 18.5 Wh. With a mass of 75 g, the specific capacity is 65.2 mAh/g, while the dimensions are 100 × 110 × 3 mm3, proving a heat exchange area of 22,000 mm2. A total of 11 sheets of material with a length of 1030 mm and an overall thickness of about 0.27 mm are folded on themselves 11 times to compose the internal structure of the prismatic cells. A schematization of the internal configuration is taken from the literature and shown in Figure 2 [30]. Meanwhile, Figure 3 reports a scheme of the experimental apparatus. Infrared imaging provides the bidimensional temperature distribution on the battery surface. This methodology is also able to detect small temperature variations caused by the low current values used in this analysis. A test box with black painted walls is realized on purpose to avoid the incidence of ambient radiations on the battery. The battery supports are made of plastic to behave as an adiabatic material to prevent undesired heat loss. Moreover, a high emissivity material covers the side of the battery inspected by the camera to avoid ambient reflections and to increase the measurements’ accuracy. Ambient conditions are monitored and regulated at dry-bulb temperature and relative humidity.

2.2. Measurements Procedures

Discharge tests are run applying different current ratings and profiles. The current rate of 1 C, corresponding to 4.89 A for this battery, is the value that would completely discharge it in 1 h. Values of 0.5 C, 1 C and 2 C are set for the constant discharge tests. Moreover, a variable current profile that reproduces the homologation drive cycle Worldwide Light duty Test Cycle (WLTC) is considered. Given a 37 kW electric vehicle, a battery pack with 20 cells connected in parallel and 100 in series is considered. Dividing the WLTC load to the 20 parallel cells results in a peak value of 2.8 A per cell, that is about 0.5 C. More test specifications are reported in Table 1. The voltage and the current signals measured and provided by the bidirectional power supply are monitored and recorded by home-made software in the Labview environment. The infrared camera is placed in front of the battery and detects the thermal radiation through a frontal opening in the test box. The camera resolution is 320 × 256 pixels and the optical range is from 3.0 to 5.5 µm. Whereas the 50 mm lens lowers the range to 3–5 µm. The images are taken with an acquisition frequency of 0.1 Hz and an exposure time of 260 µs. This time grants good recording quality, preventing the images’ saturation. The distance between the camera and the battery is 1 m. The calibration of the infrared camera is performed regularly by the supplier. The uncertainty of the infrared camera is measured by noise-equivalent temperature difference (NETD). For the cell and the absolute temperature of the case under examination, NETD = 0.1. In addition, a thermocouple, K-type, is stuck on the battery surface to compare the temperature data. The thermocouple sensitivity is 0.5 °C. Further details on the testing procedure are described in [31,32].

2.3. Image Elaboration for Temperature Detection

Image processing of the infrared data is performed to extract the temperature of the battery surface and of the background, which is used as an ambient temperature indicator. First, the emissivity of the material and the ambient temperature are set in the raw image to compensate for temperature offsets. Then, the temperature distribution is estimated. As reported in the high-contrast picture of Figure 3, the temperature distribution is quite homogeneous. The temperature difference is only 0.3 °C, from the bottom-left corner of the battery (current collectors) to the top-right one. In percentage, this is 1.3% of the average battery temperature, and then a constant temperature can be assumed across the surface. Finally, the average temperature is evaluated within each region of interest (ROI) by summing up the values of all the pixels and then dividing by the total number of pixels.

3. CFD Model

The simulation of the internal electrochemistry of Li-ion batteries is a challenge because the physics to be simulated develops on different scales. Indeed, the temperature distribution is the goal of the thermal analysis and affects the battery length scale. The Li-ion transport is governed by the physics in the anode-separator-cathode sandwich layers (the electrode pair length scale). Li-ion transport in an active material occurs at the atomic length scale. The thermal and electrical fields of the battery are solved in the CFD domain at various scales using differential equations highlighted in the following section. This approach, called MSMD, offers a relatively high computational speed (a simulation generally requires time in the order of minutes) and results in relatively high accuracy [14,33].
The developed MSMD model is based on a Newman’s pseudo-2D approach. This approach combines the two-dimensional physics-based electrochemical models with the charge conservation and heat diffusion equations across the battery domain to determine the temperature distributions.

3.1. Governing Equations

The governing equations of the model are: the conservation of lithium in solid and electrolyte phases, the conservation of charge in solid and electrolyte phases, the Butler-Volmer equation and the potential and energy equations. The Li-ion transport phenomena in the porous electrode and electrolyte can be explained by the charge and mass conservation laws. Charge conservation determines phase potentials, while mass conservation determines the phase concentrations. The conservation equations relevant to electrolyte and solid phases are given as:
Lithium conservation in the solid phase:
c s t D s r 2 r r 2 c s r = 0
Lithium conservation in the electrolyte phase:
ε e c e t = x D e e f f c e x + a s 1 t + 0 F j i n t + j s i d e
Charge conservation in the solid phase:
x σ e f f φ s x a s j i n t + j s i d e = 0
Charge conservation in the electrolyte phase:
x k e f f φ e x + x k d e f f ln c e x + a s j i n t + j s i d e = 0
The Lithium conservation diffusion equation must be solved at every discretized spatial location in the electrode zone. The Lithium conservation equation is solved in the r-dimension of the spherical particles—the pseudo second dimension. That is why the model is often referred to as the Newman’s P2D model in the literature [34].
The Butler-Volmer equation is used to couple the charge and species governing equations.
j i n t = i 0 exp α a F R T η exp α c F R T η
The reference temperature  T r e f is set at 298 K.
Potential equations:
· σ + φ + = j E C h j s h o r t · σ φ = j E C h j s h o r t
Energy equation:
ρ C p T t · k T = σ + φ + 2 + σ φ 2 + q E C h ˙ + q s h o r t ˙ + q a b u s e ˙
By default, the entropic heating term is ignored in the calculation but you can include it. In practice, the Newman’s P2D model is solved on the electrode scale [34].
For more information about the Newman’s P2D Model, see [17,34].
For modeling and simulating, the same parameters reported in [13] are used. Some of these are the result of the calibration process carried out on our battery and will be better described later; others depend on its intrinsic characteristics.

3.2. Computational Domain

The folding of the battery layers under study is ignored in the geometry of the model which is drawn as a single solid body with dimensions equal to the external dimensions of the battery case. In addition, in order to simulate the battery, it was necessary to draw the external poles (tab), which are two other solid bodies. So, the geometry of the battery is made up of three joined bodies: the outer case and the positive and negative poles (called tabs) that come out of the case (Figure 4).
The battery case and inside it have been defined as the active zone, instead the tabs were defined as the passive zone.
The top surfaces of the connectors have been selected as contacts.

3.3. Mesh Used

The geometry was meshed with a Cartesian grid (Figure 5). This was possible because the battery has a simple geometry. This type of mesh has a higher computational efficiency than nonstructured meshes. The meshes of the coupled bodies have been created to conform. For this type of problem, it is recommended to use uniform meshes.
The generated mesh is cartesian, conform and uniform and consists of 3.2 million hexahedral elements and 13.3 million nodes. The mesh has 18 elements in the thickness, 400 in the width and 440 in the height of the cell, and 10 elements in the thickness, 20 in the width and 40 in the height of the tabs.

3.4. Boundary Conditions

Figure 1 shows the battery under study, the internal structure is made up of 11 sheets of material with a length of 1030 mm, with an overall thickness of about 0.27 mm, folded on themselves 11 times to make them fit within the overall dimensions of the battery case.
These 11 sheets of different materials consist in order of a polypropylene separator, lithium permanganate, aluminum cathode, lithium permanganate, polypropylene separator, graphite, copper and graphite anode, all immersed in a liquid electrolyte.
Nevertheless, according to the Newman’s P2D Model, the battery is internally formed by a positive electrode, a negative electrode, a separator between the electrodes and an electrolyte. The battery body is considered active material excluding the tabs.
The materials set in the simulation code (Table 2) were aluminum for the cathode current collector, copper for the anode current collector, LiMn2O4 for the anode, graphite for the cathode and plastic film for the separator as those defined by [35,36].
It is assumed that the plastic material of the separator is polyethylene because it is one of the most common according to [37].
To define the thicknesses of the various materials, reference is made to [38], who modeled a pouch battery of the same type.
The density of the material defined for the cell was obtained as the ratio between mass and volume obtaining a value of 2272 kg/m3. The specific heat value of 1174 J/kg °C was obtained as an average between the extremes of the range indicated by [39] for the Li-ion batteries.
As ref. [11] explained in detail, the predicted temperature values are not affected much by the choice of a λ value and using different thermal conductivity values in axial and radial directions does not make a noticeable difference in the results. Therefore, we choose the λ value of 3 W/mK, a common value in the literature, as the nominal value for the simulations performed in this study.
To obtain the σ value for the cell material, a volume weighted average of the electrical conductivity values of the materials composing it was carried out.
The σ values of each single material of which the cell is composed are shown in Table 3 and with the exception of the separator taken with reference to [40], the others have been taken with reference to [41].
The result obtained is an σ value of 8.46 × 10⁶ S/m.
Copper is the material for the positive and negative tabs.
A temperature of 300 K was set on the external surfaces of the case.
The minimum stop voltage ( V m i n ) was set to 1.0 V, the maximum stop voltage ( V m a x ) was set to 4.3 V, the reference temperature ( T r e f ) was set to 300 K and the convective heat transfer coefficient ( h t ), calculated from the experimental tests, was set to 26  W K m 2 .
The time-step size was chosen at 0.5 s.
At each time-step, the equations are solved with 15 iterations, which is needed to achieve convergence. Four discharge cycles at different rates and trends were simulated and tested experimentally as shown in Table 4:
Cycle 1 consist in a constant discharge of the battery at 0.5 C-rate;
Cycle 2 consist in a constant discharge of the battery at 1 C-rate;
Cycle 3 consist in a constant discharge at 2 C-rate only within the interval between the corresponding instants of time at 5 and 625 s inclusive, from zero to 4 s and from 626 to 690 a zero discharge was imposed.
Cycle 4 is a WLTC cycle.
The convergence criterion selected compatibly with the type of problem and was set to achieve residual values relating to the equations of the energy and conservation at least in the order of 10−4 ÷ 10−5.
A generic simulation the calculation times are in the order of 1 day for the CFD model using a computer with Intel Xeon processor CPU E5-1620 3.60 GHz and 16 Gb of RAM.
Table 4. Types of simulated discharge cycles.
Discharge TypeCycleTime
0.5 C-rateCycle 1690 s
1 C-rateCycle 2690 s
2 C-rateCycle 3690 s
WLTCCycle 41850 s

4. Numerical Calibration

Since the battery case and inside it are considered an active zone in the model independent of the effective structure, but the internal resistance cannot be explicitly set, a calibration of the model was necessary. Nine simulations were carried out varying the conductivity parameters, as shown in Table 5, to get closer to the results obtained experimentally. To carry out the comparison, the discharge cycle at 2 C-rate was considered and the voltage was monitored (Figure 6). The parameters that lead to the result closest to the experimental results are those of the “Run 9” and are reasonable for the characteristics of the battery studied. They were then used as a setting for all the simulated cases.

5. Results and Validation

The results are shown in terms of V,  T ¯ s u r f and SoC.
V is calculated as the difference between the cathodic and anode voltage averaged over the volume. Calculated from:
· σ φ + S = 0
where  φ is the electric potential,  σ is the electric conductivity in a solid zone or ionic conductivity in a fluid zone and S is the source term.
T ¯ s u r f is calculated as the integral divided by the total face area:
T ¯ s u r f = f A f T s u r f f f A f
SoC is calculated as:
S o C = 1 V o l 3600 Q n o m 0 t j d t
where Vol denotes the active zone’s volume of a single battery,  Q n o m is the battery total electric capacity in Ampere hours and j is the current flux.
While the qualitative results are reported in terms of temperature contour, total heat source contour and current vector plot.
The numerical experimental comparison of battery voltage at different discharge cycles is show in Figure 7.
The battery has an initial voltage of 4.2 V over the different cycles. The discrepancy between the VCFD and the Vexp is almost always within the 2% error bar (orange color). In Cycle 1, the difference between the experimental and the simulated one is constant and of about 0.1 V. In Cycle 2, the difference vanishes towards the end of the cycle. In Cycle 3 the difference is almost zero at the beginning and tends to increase towards the end of the cycle. In Cycle 4, the difference decreases as time increases.
Figure 8 shows the numerical experimental comparison of the SOC results at the different discharge cycles. The battery has an initial SOC of 1 under the different cycles.
Figure 9 compares the numerical experimental results of the averaged surface temperature  T ¯ s u r f at the different discharge rates and cycles. The battery has a  T ¯ 0 of 300 K under the different cycles.
Figure 10 compares the temperature contour at the battery surface for the WLTC cycle with IR image and simulation by the numerical model.
We can see that, both with the simulation and with the IR image, the temperature and the magnitude of the gradient are very close. We also observed that the gradient has the same trend, with the highest temperature in the middle compared to the ends of the main surfaces of the battery.
As shown in Figure 9, the  T ¯ s u r f increases by 1 K, 5 K, 12 K and 2 K above  T ¯ 0 for the first, second, third and fourth cycles described, respectively. We can also see that the  T ¯ s u r f rises more quickly at a higher discharge rate. The internal heat generation may cause the change of temperature profile with discharge time. The temperature difference between what was measured experimentally and what was obtained from the model is very limited. The numerical experimental comparison of  T ¯ s u r f is about 1%. A discrepancy is observed only in Cycle 3; this was expected since the pseudo-2D (P2D) model assumes that the porous electrode consists of equal-sized, isotropic, homogeneous spherical particles [42]. This homogeneous description of electrode microstructure results in smooth, uniform intercalation or de-intercalation of lithium inside the electrode and this works well for low to moderate rates of discharge or charge [43]. However, this is not what real Li-ion electrodes look like. They have a very complex and uneven structure [44]. The P2D model cannot account for phenomena that depend on the electrode’s inhomogeneous structure, such as performance drop at high rates [45]. Furthermore, this could be due to the discharge C-rate chosen for this case, which is very high compared to the usual operating conditions of the battery used.
It was also observed that the highest temperature distribution was found in the middle as compared to the tabs (positive and negative electrode) and at the end of the battery’s principal surface along the height of the battery (Figure 11). At the last simulated time-step  T max surf , Cycle 1 is 0.3 K, Cycle 2 is 1.4 K, Cycle 3 is 6 K and Cycle 4 is 0.1 K. At the last simulated time-step,  T m a x , with respect to the initial instant in Cycle 1 is 1.2 K, in Cycle 2 it is 4.6 K, in Cycle 3 it is 19 K and in Cycle 4 it is 1.6 K (Table 6).
The heat source was also found to be strongest near the tabs (positive and negative electrode) (Figure 12). The electrochemical reaction heat is calculated as:
q E C h = j E C h U V T d U d T
where U and V are model parameter functions of the battery depth of discharge, T is the temperature.
From the comparison between Cycle 1, Cycle 2 and Cycle 3, it can be observed that as the intensity of the discharge increases, the heat generated increases. This is due to an increase in heat due to more intense chemical reactions and an increase in heat generated by the Joule effect.
The current magnitude was also highest near the tabs (positive and negative electrode) (Figure 13). The apparent current density is calculated as:
j = Y ϕ c ϕ a U
where  ϕ c ϕ a is the difference between the cathode and anode side electric potentials at the separator interface and Y is the inverse of the slope of the voltage–current curve of the battery cell.
From the comparison between Cycle 1, Cycle 2 and Cycle 3, it can be observed that as the intensity of the discharge increases, the current magnitude increases.

6. Conclusions

Li-ion batteries are becoming increasingly widespread in various applications, from electric vehicles to portable devices. Models such as the one developed in this paper are a valuable tool for predicting the behavior of batteries under different operating conditions and scenarios. They can help in the design of new shapes or cooling systems, highlight potential issues, assist in the improvement of energy storage capacity, test alternative materials, and evaluate the heat generated by the batteries. This paper has presented a 3D CFD model able to simulate a 4.89 Ah-Li-ion prismatic battery with an electrochemical approach. While the equivalent circuit model (ECM) needs to know the electrical behavior of the battery, the electrochemical models simulate the battery behavior from the physical parameters of the cell. The difficulty with this approach is that many parameters must be set, some of which are difficult to estimate. The advantage is that the model is completely predictive of the battery behavior. Thanks to the development of these models, it is possible to predict the performance of the battery without the need to create prototypes or the use of test benches which involve higher costs and longer times.
Computational models also make it possible to improve the design of battery packs and to evaluate temperature distribution and heat generation to size any cooling systems under different conditions of use.
An IR camera was used in this work to take IR images at different discharge rates, and temperature nonuniformity was seen visually. The computational model has been compared with experimental tests for different battery discharge cycles showing that the numerical and all physical parameters of the cell setting are correct, and to obtain more accurate results, a calibration of the model was performed on the basis of experimental tests.
The results of the simulations are calculated in terms of the voltage curves, the SOC and the averaged and maximum surface temperature generated from the battery during the discharge at different C-Rates (constant and variable). Other results also show the temperature gradient, heat flow and current flow.
The following points can be concluded from this study: (i) the surface temperature of the battery rises with the increase in the C-rates,  T ¯ s u r f increases by 1 K, 5 K, 12 K, respectively, for the discharge at 0.5, 1, 2 C-rates and  T m a x with respect to the initial instant increases by 1.2 K, 4.6 K, 19 K, respectively; (ii) the center of the cell has the highest temperature, at the last simulated time-step its temperature is higher than 0.3 K, 1.4 K, 6 K, 0.1 K compared to the colder areas of the cell at the last simulated time-step, respectively, for Cycle 1, Cycle 2, Cycle 3 and Cycle 4. The temperature nonuniformity shows the nonuniformity heat generation on a surface of the battery and nonuniformity heat dissipation.
It is important to note that the greatest discrepancies between model’s and experimental results were observed at higher discharge C-rates. This suggests that the model may not accurately represent the battery’s behavior at higher C-rates and it is affected by an “out-of-design” use of the battery, which is a current limitation.
In the literature, there are only a few works that simulate the Li-ion battery with an experimentally validated 3D electrochemical CFD approach. Nowadays, for the increase in electrified systems, it is crucial to have accurate and valid simulation models of the batteries available. Models such as the one studied in this work may be more useful to battery manufacturers and this work adds knowledge to the literature in this field.
One potential area for future research is the introduction of X-ray diffraction analysis of the cell materials. This technique could provide valuable insights into the crystal structure and composition of the materials, allowing for more accurate characterization and improved model accuracy. Another area for future development is the improvement of the model’s ability to represent behavior at higher C-rates. This could involve refining the model’s parameters or incorporating more detailed models of heat generation and transfer, or incorporating additional electrochemical reactions or additional physical phenomena to better capture the battery’s behavior under these conditions to better represent the battery’s behavior.

Author Contributions

Conceptualization, C.F. and L.S.; methodology, C.F.; software, L.M.; validation, L.M., L.S. and C.F.; formal analysis, L.M.; investigation, L.S.; resources, L.S.; data curation, L.S.; writing—original draft preparation, L.M.; writing—review and editing, L.M.; supervision, C.F.; funding acquisition, C.F. All authors have read and agreed to the published version of the manuscript.

Funding

This research received no external funding.

Data Availability Statement

The data presented in this study are available on request from the corresponding author. The data are not publicly available due to technical reason.

Conflicts of Interest

The authors declare no conflict of interest.

Nomenclature

VariableSymbol
Active material pore-wall current flux due to lithium intercalation reaction and due to side reactions j i n t j s i d e
Activation energy that controls the temperature sensitivity of  D s and the reaction rate constant E d E r
Average surface temperature   T ¯ s u r f
Charge transfer coefficient at anode and at cathode α a α c
Diffusion coefficient of Li in solid   D s
Diffusion coefficient of Li+ in the electrolyte phase   D e
Effective electric conductivity   σ e f f
Effective electric conductivities for the positive and negative electrodes j E C h j s h o r t
Electrical conductivity   σ
Electrolyte activity coefficient   f ±
Electrolyte and solid phase concentrations c e c s
Electrolyte ionic conductivity and diffusional conductivity k k D e f f
Faraday constant   F
Heat generation due to the thermal runaway reactions under the thermal abuse condition.   q a b u s e ˙
Initial temperature   T 0
Maximum temperature difference   T m a x
Maximum temperature difference on the surface   T max surf
Measured voltage   V e x p
Overpotential   η
Phase potentials φ + φ
Reference reaction rate constant   k m , r e f
Reference solid diffusion coefficient   D s , r e f
Simulated voltage   V C F D
Solid/electrolyte interfacial area per unit volume   α s
State of chargeSoC
Surface temperature   T s u r f
Thermal conductivity   λ
Transference number of lithium ion   t + 0
Universal gas constant   R
Voltage   V
Volume fraction of the electrolyte phase in electrode   ε e
Volume fraction of active material in electrode   ε s
Volume fraction of the filler material in electrode   ε f

References

  1. Scrosati, B. History of lithium batteries. J. Solid State Electrochem. 2011, 15, 1623–1630. [Google Scholar] [CrossRef]
  2. Tarascon, J.M.; Armand, M. Issues and challenges facing rechargeable lithium batteries. Nature 2001, 414, 359–367. [Google Scholar] [CrossRef]
  3. Armand, M.; Tarascon, J.M. Building better batteries. Nature 2008, 451, 652–657. [Google Scholar] [CrossRef] [PubMed]
  4. Reddy, M.V.; Mauger, A.; Julien, C.M.; Paolella, A.; Zaghib, K. Brief History of Early Lithium-Battery Development. Materials 2020, 13, 1884. [Google Scholar] [CrossRef] [PubMed] [Green Version]
  5. Joachin, H.; Kaunb, T.; Zaghib, K.; Prakash, J. Electrochemical and Thermal studies of LiFePO4 cathode in lithiumion cells. J. Electrochem. Soc. 2008, 6, 11–16. [Google Scholar] [CrossRef]
  6. Pistoia, G. Electric and Hybrid Vehicles, 1st ed.; Elsevier: Oxford, UK, 2010. [Google Scholar]
  7. Wang, T.; Tseng, K.J.; Zhao, J.; Wei, Z. Thermal investigation of lithium-ion battery module with different cell arrangement structures and forced air-cooling strategies. Appl. Energy 2014, 134, 229–238. [Google Scholar] [CrossRef]
  8. Tomasov, M.; Kajanova, M.; Bracinik, P.; Motyka, D. Overview of Battery Models for Sustainable Power and Transport Applications. Transp. Res. Procedia 2019, 40, 548–555. [Google Scholar] [CrossRef]
  9. Qin, D.; Li, J.; Wang, T.; Zhang, D. Modeling and Simulating a Battery for an Electric Vehicle Based on Modelica. Automot. Innov. 2019, 2, 169–177. [Google Scholar] [CrossRef] [Green Version]
  10. Hanifah, R.A.; Toha, S.F.; Ahmad, S. Electric Vehicle Battery Modelling and Performance Comparison in Relation to Range Anxiety. Procedia Comput. Sci. 2015, 76, 250–256. [Google Scholar] [CrossRef] [Green Version]
  11. Gümüssu, E.; Ekici, Ö.; Köksal, M. 3-D CFD modeling and experimental testing of thermal behavior of a Li-Ion battery. Appl. Therm. Eng. 2017, 120, 484–495. [Google Scholar] [CrossRef]
  12. He, F.; Li, X.; Ma, L. Combined experimental and numerical study of thermal management of battery module consisting of multiple Li-ion cells. Int. J. Heat Mass Transf. 2014, 72, 622–629. [Google Scholar] [CrossRef]
  13. Panchal, S.; Dincer, I.; Agelin-Chaab, M.; Fraser, R.; Fowler, M. Transient electrochemical heat transfer modeling and experimental validation of a large sized LiFePO4/graphite battery. Int. J. Heat Mass Transf. 2017, 109, 1239–1251. [Google Scholar] [CrossRef]
  14. Panchal, S.; Mathew, M.; Fraser, R.; Fowler, M. Electrochemical thermal modeling and experimental measurements of 18650 cylindrical lithium-ion battery during discharge cycle for an EV. Appl. Therm. Eng. 2018, 135, 123–132. [Google Scholar] [CrossRef]
  15. Dubey, P.; Pulugundla, G.; Srouji, A.K. Direct Comparison of Immersion and Cold-Plate Based Cooling for Automotive Li-Ion Battery Modules. Energies 2021, 14, 1259. [Google Scholar] [CrossRef]
  16. Prumbohm, E.; Wehinger, G.D. Exploring Flow Characteristics in Vanadium Redox-Flow Batteries: Optical Measurements and CFD Simulations. Chem. Ing. Tec. 2019, 91, 900–906. [Google Scholar] [CrossRef]
  17. Doyle, M.; Fuller, T.F.; Newman, J. Modeling of Galvanostatic Charge and Discharge of the Lithium/Polymer/Insertion Cell. J. Electrochem. Soc. 1993, 140, 1526–1533. [Google Scholar] [CrossRef]
  18. Liu, G.; Zhang, L. Research on the Thermal Characteristics of an18650 Lithium-Ion Battery Based on an Electrochemical–Thermal Flow Coupling Model. World Electr. Veh. J. 2021, 12, 250. [Google Scholar] [CrossRef]
  19. Madani, S.S.; Schaltz, E.; Kær, S.K. Thermal Characterizations of a Lithium Titanate Oxide-Based Lithium-Ion Battery Focused on Random and Periodic Charge-Discharge Pulses. Appl. Syst. Innov. 2021, 4, 24. [Google Scholar] [CrossRef]
  20. Xiao, M.; Choe, S.-Y. Theoretical and experimental analysis of heat generations of a pouch type LiMn2O4/carbon high power Li-polymer battery. J. Power Sourc. 2013, 241, 46e5. [Google Scholar] [CrossRef]
  21. Mastali, M.; Foreman, E.; Modjtahedi, A.; Samadani, E.; Amirfazli, A.; Farhad, S.; Fraser, R.A.; Fowler, M. Electrochemical-thermal modeling and experimental validation of commercial graphite/LiFePO4 pouch lithium-ion batteries. Int. J. Therm. Sci. 2018, 129, 218–230. [Google Scholar] [CrossRef]
  22. Li, G.; Li, S. Physics-Based CFD Simulation of Lithium-ion Battery under the FUDS Driving Cycle. ECS Trans. 2015, 64, 1. [Google Scholar] [CrossRef]
  23. Li, Y.; Zhou, Z.; Wu, W.-T. Three-dimensional thermal modeling of Li-ion battery cell and 50 V Li-ion battery pack cooled by mini-channel cold plate. Appl. Therm. Eng. 2019, 147, 829–840. [Google Scholar] [CrossRef]
  24. Li, H.; Saini, A.; Liu, C.; Yang, J.; Wangb, Y.; Yang, T.; Pan, C.; Chen, L.; Jiang, H. Electrochemical and thermal characteristics of prismatic lithium-ion battery based on a three-dimensional electrochemical-thermal coupled model. J. Energy Storage 2021, 42, 102976. [Google Scholar] [CrossRef]
  25. Madani, S.S.; Swierczynski, M.J.; Kær, S.K. The Discharge Behavior of Lithium-Ion Batteries Using the Dual-Potential Multi-Scale Multi Dimensional (MSMD) Battery Model. In Proceedings of the 2017 Twelfth International Conference on Ecological Vehicles and Renewable Energies (EVER), Monte Carlo, Monaco, 11–13 April 2017; pp. 1–14. [Google Scholar] [CrossRef]
  26. Yeow, K.; Teng, H.; Thelliez, M.; Tan, E. 3D Thermal Analysis of Li-ion Battery Cells with Various Geometries and Cooling. In Proceedings of the SIMULIA Community Conference, Providence, RI, USA, 15–17 May 2012. [Google Scholar]
  27. Doyle, M.; Newman, J.; Gozdz, A.S.; Schmutz, C.N.; Tarascon, J. Comparison of modeling predictions with experimental data from plastic lithium ion cells. J. Electrochem. Soc. 1996, 143, 1890–1903. [Google Scholar] [CrossRef]
  28. Zhao, W.; Luo, G.; Wang, C.-Y. Modeling Nail Penetration Process in Large-Format Li-Ion Cells. J. Electrochem. Soc. 2015, 162, A207–A217. [Google Scholar] [CrossRef]
  29. Zhao, W.; Luo, G.; Wang, C.-Y. Modeling Internal Shorting Process in Large-Format Li-Ion Cells. J. Electrochem. Soc. 2015, 162, A1352. [Google Scholar] [CrossRef] [Green Version]
  30. Mekonnen, Y.; Sundararajan, A.; Sarwat, A.I. A Review of Cathode and Anode Materials for Lithium-Ion Batteries. In Proceedings of the SoutheastCon 2016, Norfolk, VA, USA, 30 March–3 April 2016. [Google Scholar] [CrossRef]
  31. Sequino, L.; Vaglieco, B.M. Potential of infrared temperature measurements for the online estimation of the state-of-charge of a Li-polymer battery. J. Energy Storage 2021, 44, 103532. [Google Scholar] [CrossRef]
  32. Sequino, L.; Vaglieco, B.M. Infrared Diagnostics of a Li-Polymer Battery for the Estimation of the Surface Temperature Distribution and the Heat Transfer Parameters; SAE Technical Paper; SAE International: Warrendale, PA, USA, 2020. [Google Scholar] [CrossRef]
  33. Kim, G.-H.; Smith, K.; Lee, K.-J.; Santhanagopalan, S.; Pesaran, A. Multi-Domain Modeling of Lithium-Ion Batteries Encompassing Multi-Physics in Varied Length Scales. J. Electrochem. Soc. 2011, 158, A955–A969. [Google Scholar] [CrossRef]
  34. Ansys Inc. Fluent Theory Guide; Ansys Inc.: Canonsburg, PA, USA, 2022. [Google Scholar]
  35. Krsmanovic, D. Development of a Properly Forecast Tool for Flexible Compositions of Li-ion Batteries, Including Raw Material Availability and Price Forming. Master’s Thesis, Uppsala Universitet, Uppsala, Sweden, 2019. [Google Scholar]
  36. Kwon, K.H.; Shin, C.B.; Kang, T.H.; Kim, C. A two-dimensional modeling of a lithium-polymer battery. J. Power Sources 2006, 163, 151–157. [Google Scholar] [CrossRef]
  37. Lagadec, M.F.; Zahn, R.; Wood, V. Characterization and performance evaluation of lithium-ion battery separators. Nat. Energy 2019, 4, 16–25. [Google Scholar] [CrossRef] [Green Version]
  38. Esmaeili, J.; Jannesari, H. Modeling the heat of mixing of LiMn2O4 pouch type battery. In Proceedings of the 4th Iranian Conference on Renewable Energy and Distributed Generation, Mashhad, Iran, 2–3 April 2016. [Google Scholar] [CrossRef]
  39. Sheng, L.; Su, L.; Zhang, H.; Fang, Y.; Xu, H.; Ye, W. An improved calorimetric method for characterizations of the specific heat and the heat generation rate in a prismatic lithium ion battery cell. Energy Convers. Manag. 2019, 180, 724–732. [Google Scholar] [CrossRef]
  40. Krupa, I.; Novák, I.; Chodák, I. Electrically and thermally conductive polyethylene/graphite composites and their mechanical properties. Synth. Met. 2004, 145, 245–252. [Google Scholar] [CrossRef]
  41. Park, M.; Zhang, X.; Chung, M.; Less, G.B.; Sastry, A.M. A review of conduction phenomena in Li-ion batteries. J. Power Sources 2010, 195, 7904–7929. [Google Scholar] [CrossRef]
  42. Doyle, M.; Newman, J. The use of mathematical modeling in the design of lithium/polymer battery systems. Electrochim. Acta 1995, 40, 2191–2196. [Google Scholar] [CrossRef]
  43. Chabot, V.; Farhad, S.; Chen, Z.; Fung, A.S.; Yu, A.; Hamdullahpur, F. Effect of electrode physical and chemical properties on lithium-ion battery performance. Int. J. Energy Resour. 2013, 37, 1723–1736. [Google Scholar] [CrossRef]
  44. Shearing, P.R.; Howard, L.E.; Jørgensen, P.S.; Brandon, N.P.; Harris, S.J. Characterization of the 3-dimensional microstructure of a graphite negative electrode from a Li-ion battery. Electrochem. Commun. 2010, 12, 374–377. [Google Scholar] [CrossRef]
  45. Gupta, A.; Seo, J.H.; Zhang, X.; Du, W.; Sastry, A.M.; Shyy, W. Effective transport properties of LiMn2O4 electrode via particle-scale modeling. J. Electrochem. Soc. 2011, 158, A487–A497. [Google Scholar] [CrossRef] [Green Version]
Figure 1. Battery under study: (a) assembled, (b) disassembled.
Batteries 09 00397 g001
Figure 2. Schematization of a prismatic battery [30].
Batteries 09 00397 g002
Figure 3. Scheme of the experimental setup. The infrared camera, the battery in the test box, the bidirectional power supply, and a sample image of the battery in the infrared band are reported.
Batteries 09 00397 g003
Figure 4. Computational Domain.
Batteries 09 00397 g004
Figure 5. Simulated mesh of the battery cell.
Batteries 09 00397 g005
Figure 6. Time–Voltage Graph for model calibration.
Batteries 09 00397 g006
Figure 7. Time–Voltage graph.
Batteries 09 00397 g007
Figure 8. Time–SOC curves.
Batteries 09 00397 g008aBatteries 09 00397 g008b
Figure 9. Time–Average surface temperature graph.
Batteries 09 00397 g009
Figure 10. Numerical-experimental comparison of Temperature Contour at 3200 time-step (1600 s) in a discharge WLTC cycle.
Batteries 09 00397 g010
Figure 11. Temperature Contours (ac) at 1200 time-step (600 s); (d) at 2400 time-step (1200 s).
Batteries 09 00397 g011
Figure 12. Total heat source Contours (ac) at 1200 time-step (600 s); (d) at 3200 time-step (1600 s).
Batteries 09 00397 g012
Figure 13. Current Vector (ac) at 1200 time-step (600 s); (d) at 3200 time-step (1600 s).
Batteries 09 00397 g013aBatteries 09 00397 g013b
Table 1. Test plan specifications (initial SOC = 100%).
CycleInitial VoltageFinal VoltageCurrent Rating/ProfileDischarge Time
14.2 V3.8 V0.5 C/Constant690 s
24.2 V3.4 V1 C/Constant690 s
34.2 V2.7 V2 C/Step690 s
44.2 V4.1 VPeak value 0.5 C/WLTC1850 s
Table 2. Characteristics of the battery layers.
ElementMaterialThicknessElectric Conductibility
[m][S/m]
SeparatorPolyethylene25.4 × 10−64.7 × 10⁻¹⁴
AnodeLiMn2O436.4 × 10−61.0 × 10⁻⁴
Cathode current collectorAluminium25.0 × 10−63.4 × 10⁷
Anode current collectorCopper25.0 × 10−65.8 × 10⁷
CathodeGraphite50.0 × 10−61.5 × 10⁵
Table 3. Parameters used in the simulation.
ParameterNotationValueUnit
Thickness of current collectorslc25μm
Conductivity for +ve electrodeσ+0.05S/m
Ionic conductivity for electrolyte materialσe0.02S/m
Conductivity for −ve electrodeσ1S/m
Nominal capacity of cellC4.89Ah
Table 5. Parameters used for calibration.
RunIonic Conductivity for Electrolyte Material [S/m]Conductivity for +ve Electrode [S/m]Conductivity for −ve Electrode [S/m]
Run 10.13.8100
Run 20.053.8100
Run 30.02250
Run 40.02120
Run 50.020.510
Run 60.020.255
Run 70.020.122
Run 80.020.081.5
Run 90.020.051
Table 6. Temperature differences for the discharge cycles.
Cycle   T max surf   T max
Cycle 10.3 K1.2 K
Cycle 21.4 K4.6 K
Cycle 36.0 K19.0 K
Cycle 40.1 K1.6 K
Disclaimer/Publisher’s Note: The statements, opinions and data contained in all publications are solely those of the individual author(s) and contributor(s) and not of MDPI and/or the editor(s). MDPI and/or the editor(s) disclaim responsibility for any injury to people or property resulting from any ideas, methods, instructions or products referred to in the content.

