Article

Rapid Estimation of Battery Storage Capacity through Multiple Linear Regression

Department of Automotive Engineering, Kookmin University, Seoul 02707, Republic of Korea
*
Author to whom correspondence should be addressed.
Batteries 2023, 9(8), 424; https://doi.org/10.3390/batteries9080424
Submission received: 17 April 2023 / Revised: 16 July 2023 / Accepted: 8 August 2023 / Published: 12 August 2023
(This article belongs to the Section Battery Modelling, Simulation, Management and Application)

Abstract

:
Due to global warming issues, the rapid growth of electric vehicle sales is fully expected to result in a dramatic increase in returned batteries after the first use. Naturally, industries have shown great interest in establishing business models for retired battery reuse and recycling. However, they still have many challenges, such as high costs from the logistics of returned batteries and evaluating returned battery quality. One of the most important characteristics of a returned battery is the battery storage capacity. Conventionally, the battery’s energy capacity is measured through the low current full charging and discharging process. While this traditional measurement procedure gives a reliable estimate of battery storage capacity, the time required for a reliable estimate is unacceptably long to support profitable business models. In this paper, we propose a new algorithm to estimate battery storage capacity that can dramatically reduce the time for estimation through the partial discharging process. To demonstrate the applicability of the proposed algorithm, cylindrical and prismatic cells were used in the experiments. Initially, five indicators were selected from the voltage response curves that can identify battery storage capacity. Then, the five indicators were applied to principal component analysis (PCA) to extract dominant factors. The extracted factors were applied to a multiple linear regression model to produce a reliable estimation of battery storage capacity.

Graphical Abstract

1. Introduction

As the number of electric vehicles sharply increases every year around the world, it is fully expected that the number of retired batteries from electric vehicles that have reached the end of life (EOL) will surge [1]. Since retired batteries are quite harmful to the environment and extremely fire hazardous, they must be properly disposed of. Nonetheless, it is not easy to handle the batteries from electric vehicles since they are packaged in bulky and heavy protective cases and are usually installed deep inside the vehicle for further protection. While the dire need for the proper disposal of retired batteries exists, it certainly requires a serious amount of resources, including heavy tools and safety-enhanced facilities. Therefore, it is quite hard to find economic incentives to serve the need for appropriate battery disposal processes. Recently, as the demands for raw materials of lithium-ion batteries such as lithium, cobalt, and manganese are sharply increasing along with the expansion of the electric vehicle market around the world and as the amount of materials is limited, the competition to secure raw materials from these batteries has become more intense. With this development of strong competition to secure the raw materials, finally, the economic advantages of recycling returned batteries start to become attractive. Initially, the focus has been on complete recycling, which extracts precious raw materials from the batteries. This process requires dismantling the batteries literally down to powder level before recouping the selected raw materials. While battery recycling seems attractive at first, further consideration of carbon production from the recycling process itself brings up another alternative idea, namely battery reuse, which indeed repurposes battery usage after evaluating the battery’s health state, especially battery storage capacity. Battery reuse can definitely minimize carbon production compared to battery recycling, and on top of that, if performed properly, it can shorten the time to bring the retired battery back into action with appropriate repurposing, such as energy storage systems and more. With all these backgrounds, retired battery reuse and recycling ideas are gaining great attention in terms of sustainable resource management and further carbon neutrality [2].
One of the most important steps in deciding whether to follow the recycling process or to go through the reuse process is the reliable assessment of battery storage capacity. If the battery storage capacity has decreased too much, then the battery should be recycled, and if not, the battery should be reused for appropriate applications. Conventionally, battery storage capacity can be measured through low current full charging and discharging processes. While this traditional measurement procedure gives a reliable estimate of battery storage capacity, the time required for the reliable estimate is unacceptably long to support profitable business models. Therefore, techniques for dependable and rapid evaluation of battery storage capacity have been at the core of recent battery research activities [2,3]. Typically, in the field of electric vehicle applications, when the battery storage capacity decreases down to 80% or less of its initial capacity, it is determined to have reached the end of life or service for that specific purpose as the reduced capacity directly means reduced driving range and indirectly implies limited power output due to the increased internal resistance of the battery [4]. However, these batteries certainly have considerable storage capacity. They can be utilized in other applications, such as household or industrial energy storage systems or personal mobility, where the requirements for energy storage capacity are relatively soft [5]. Although the retired battery reuse industries have advantages in terms of environmental contribution and carbon neutralization, it is still critical to secure price competitiveness compared to new batteries. Therefore, it is extremely important to minimize the time to assess battery storage capacity and the costs involved in the process [6]. With all these backgrounds, a methodology for rapid evaluation of battery storage capacity is presented in this paper.

1.1. A Brief Review of Battery Storage Capacity Evaluation Methods

Various methods for the assessment of battery performance exist, and they can determine the reusability of the battery by examining different aspects of battery performance characteristics. As mentioned earlier, one of the most important performance characteristics is battery storage capacity, and it can be measured quite reliably through a conventional measurement technique. This method relies on the current integration, i.e., coulomb counting during the slow discharging process from the fully charged state down to the voltage cutoff state, in other words, the fully discharged state. The battery under test is charged and discharged at a slow speed, typically at a 0.1 C rate, to help the stable operation of the evaluation process. Although it has the disadvantage of long measurement time resulting in high operating costs in terms of time, it has excellent accuracy and high reliability since it directly measures the battery storage capacity through current integration during the stable discharge process [7].
In an effort to reduce the time required for conventional battery capacity measurement, a partial discharge method was studied utilizing the relationship between the state of charge (SOC) and the open circuit voltage (OCV). Firstly, a stabilized OCV at state 1 is measured (OCV1), and the SOC at the corresponding state (SOC1) is looked up through the SOC–OCV relationship typically provided by the cell manufacturer or prepared by direct preparation experiments. Secondly, a set amount of energy, denoted by ΔQ, is discharged during the set time period. After the completion of energy discharge (ΔQ), a reasonable amount of relaxation time is spent to obtain a stable OCV at state 2 (OCV2). Thirdly, based on the measured OCV2, the SOC at the corresponding state (SOC2) is again looked up through the SOC–OCV relationship. By equating the difference of SOC1 and SOC2 with ΔQ using the definition of SOC, which is the current amount of energy stored in the battery (typically denoted by Q) divided by the battery storage capacity (typically denoted by Qmax) and a little bit of algebra, the battery capacity can be estimated faster than the conventional technique [8]. It certainly has the advantage of faster measurement of battery storage capacity compared to the full discharge method. However, it still requires a certain amount of time to obtain reliable OCV values in two different states.
Another method for evaluating battery storage capacity is to utilize an improved Kalman filter algorithm with a hybrid pulse power characterization (HPPC) test. This test provides battery storage capacity according to a power level through resistance and power measurement in each section by applying a pulse current to a battery [9]. Both methods generally have the advantage of shorter estimation time than the conventional measurement technique. Yet, there is a disadvantage: the accuracy of capacity estimation often depends on the quality of SOC estimation during the processes.

1.2. Organization of Paper

The rest of this paper is structured as follows. In Section 2, experimental setups for the battery data collection are explained. In addition, descriptions for the correlation analysis between the features extracted from the partial discharge experiments and the corresponding capacity measurements are provided. They are followed by a description of the multiple linear regression model using two principal components selected through principal component analysis. In Section 3, the results of the estimated battery storage capacity of cylindrical and prismatic cells are presented along with the actual measured corresponding battery storage capacity. Finally, in Section 4, a discussion about the strengths and limitations of the proposed method with concluding remarks is provided.

2. Experimental Setups and Methodologies

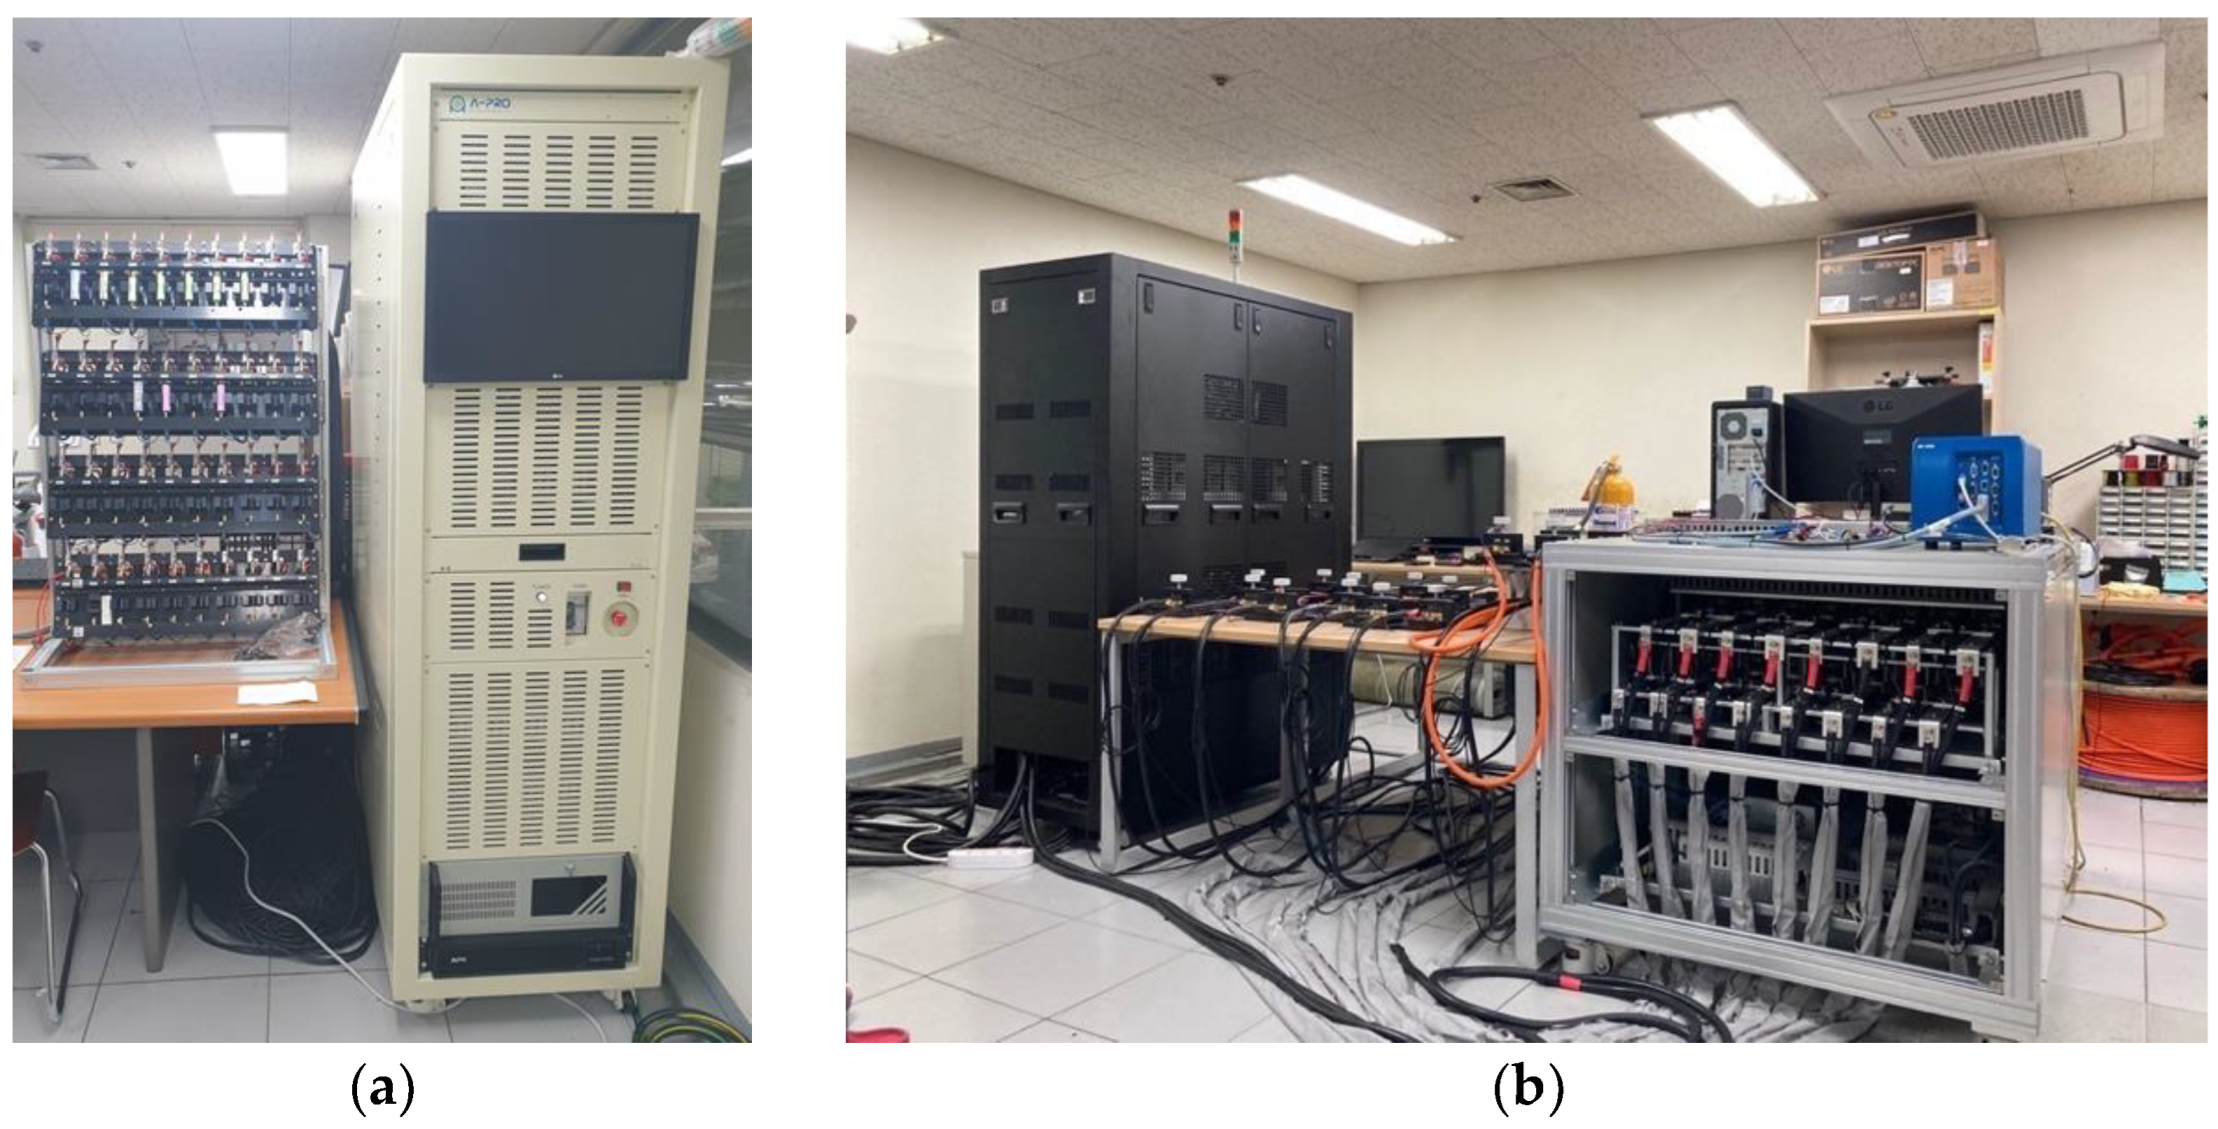
2.1. Description of Experimental Setup and Battery Cell Data

In this work, two cylindrical 4.0 Ah and two prismatic 94 Ah battery cells of lithium nickel cobalt manganese (NCM) oxide cathode series were tested with two different battery charge/discharge cyclers located in the same lab, as shown in Figure 1.
The battery cells under investigation were tested and aged under the following conditions. Firstly, all battery cells were given a one-hour relaxation time to stabilize after the standard charging process. After that, a partial discharge of six minutes corresponding to ten percent of SOC was performed, and a one-hour relaxation period was given again. This process was repeated down to zero percent of SOC. Secondly, the standard charging process was performed. After that, all battery cells were discharged with a constant current (CC) of 0.1 C from the fully charged state down to the fully discharged state for the measurement of battery storage capacity. Thirdly, for accelerated battery degradation or aging, the charge–discharge aging protocol of battery cells was repeated with a current rate of 2 C, along with the depth of discharge (DOD) set at 100%. The ambient temperature was maintained at 25 ± 1 °C. Note that all the experiments were conducted by setting the upper limit and lower limit voltages according to the datasheet provided by the manufacturers. In addition, the frequency of data acquisition for voltages and currents was set at 10 Hz. Each dataset was named C1 for cylindrical cell #1, C2 for cylindrical cell #2, P1 for prismatic cell #1, and P2 for prismatic cell #2, respectively.

2.1.1. Definition of State of Charge (SOC)

The battery SOC is defined in this paper as shown in Equation (1). The SOC is defined as the ratio of the remaining capacity and the maximum allowable capacity at a certain time [10]. In Equation (1), Q r represents the remaining capacity, Q M and I t stand for the maximum capacity of the battery and the measured current during the charge or discharge process, respectively.
S O C = Q r Q M × 100 % = Q M I t d t Q M × 100 %

2.1.2. Definition of State of Health (SOH)

While the battery SOH can be a combination of many factors, including storage capacity, internal resistance of alternate current (AC) and direct current (DC), and more, in this paper, the battery SOH is defined as shown in Equation (2) for the current study. The ratio between the maximum capacity at a certain time and the maximum capacity at the start of life is Q n o m . Generally speaking, especially in the automotive industries, when the battery SOH starts to fall below 80%, which means that the battery storage capacity falls below 80% of the battery storage capacity at the start of life, that battery is declared to be out of service. In the current study, both cylindrical cells were aged below 80% of SOH. However, prismatic cells were aged down to around 84%, where the experiments had to stop due to battery swelling that could have caused accidents if continued.
S O H = Q M Q n o m × 100 %

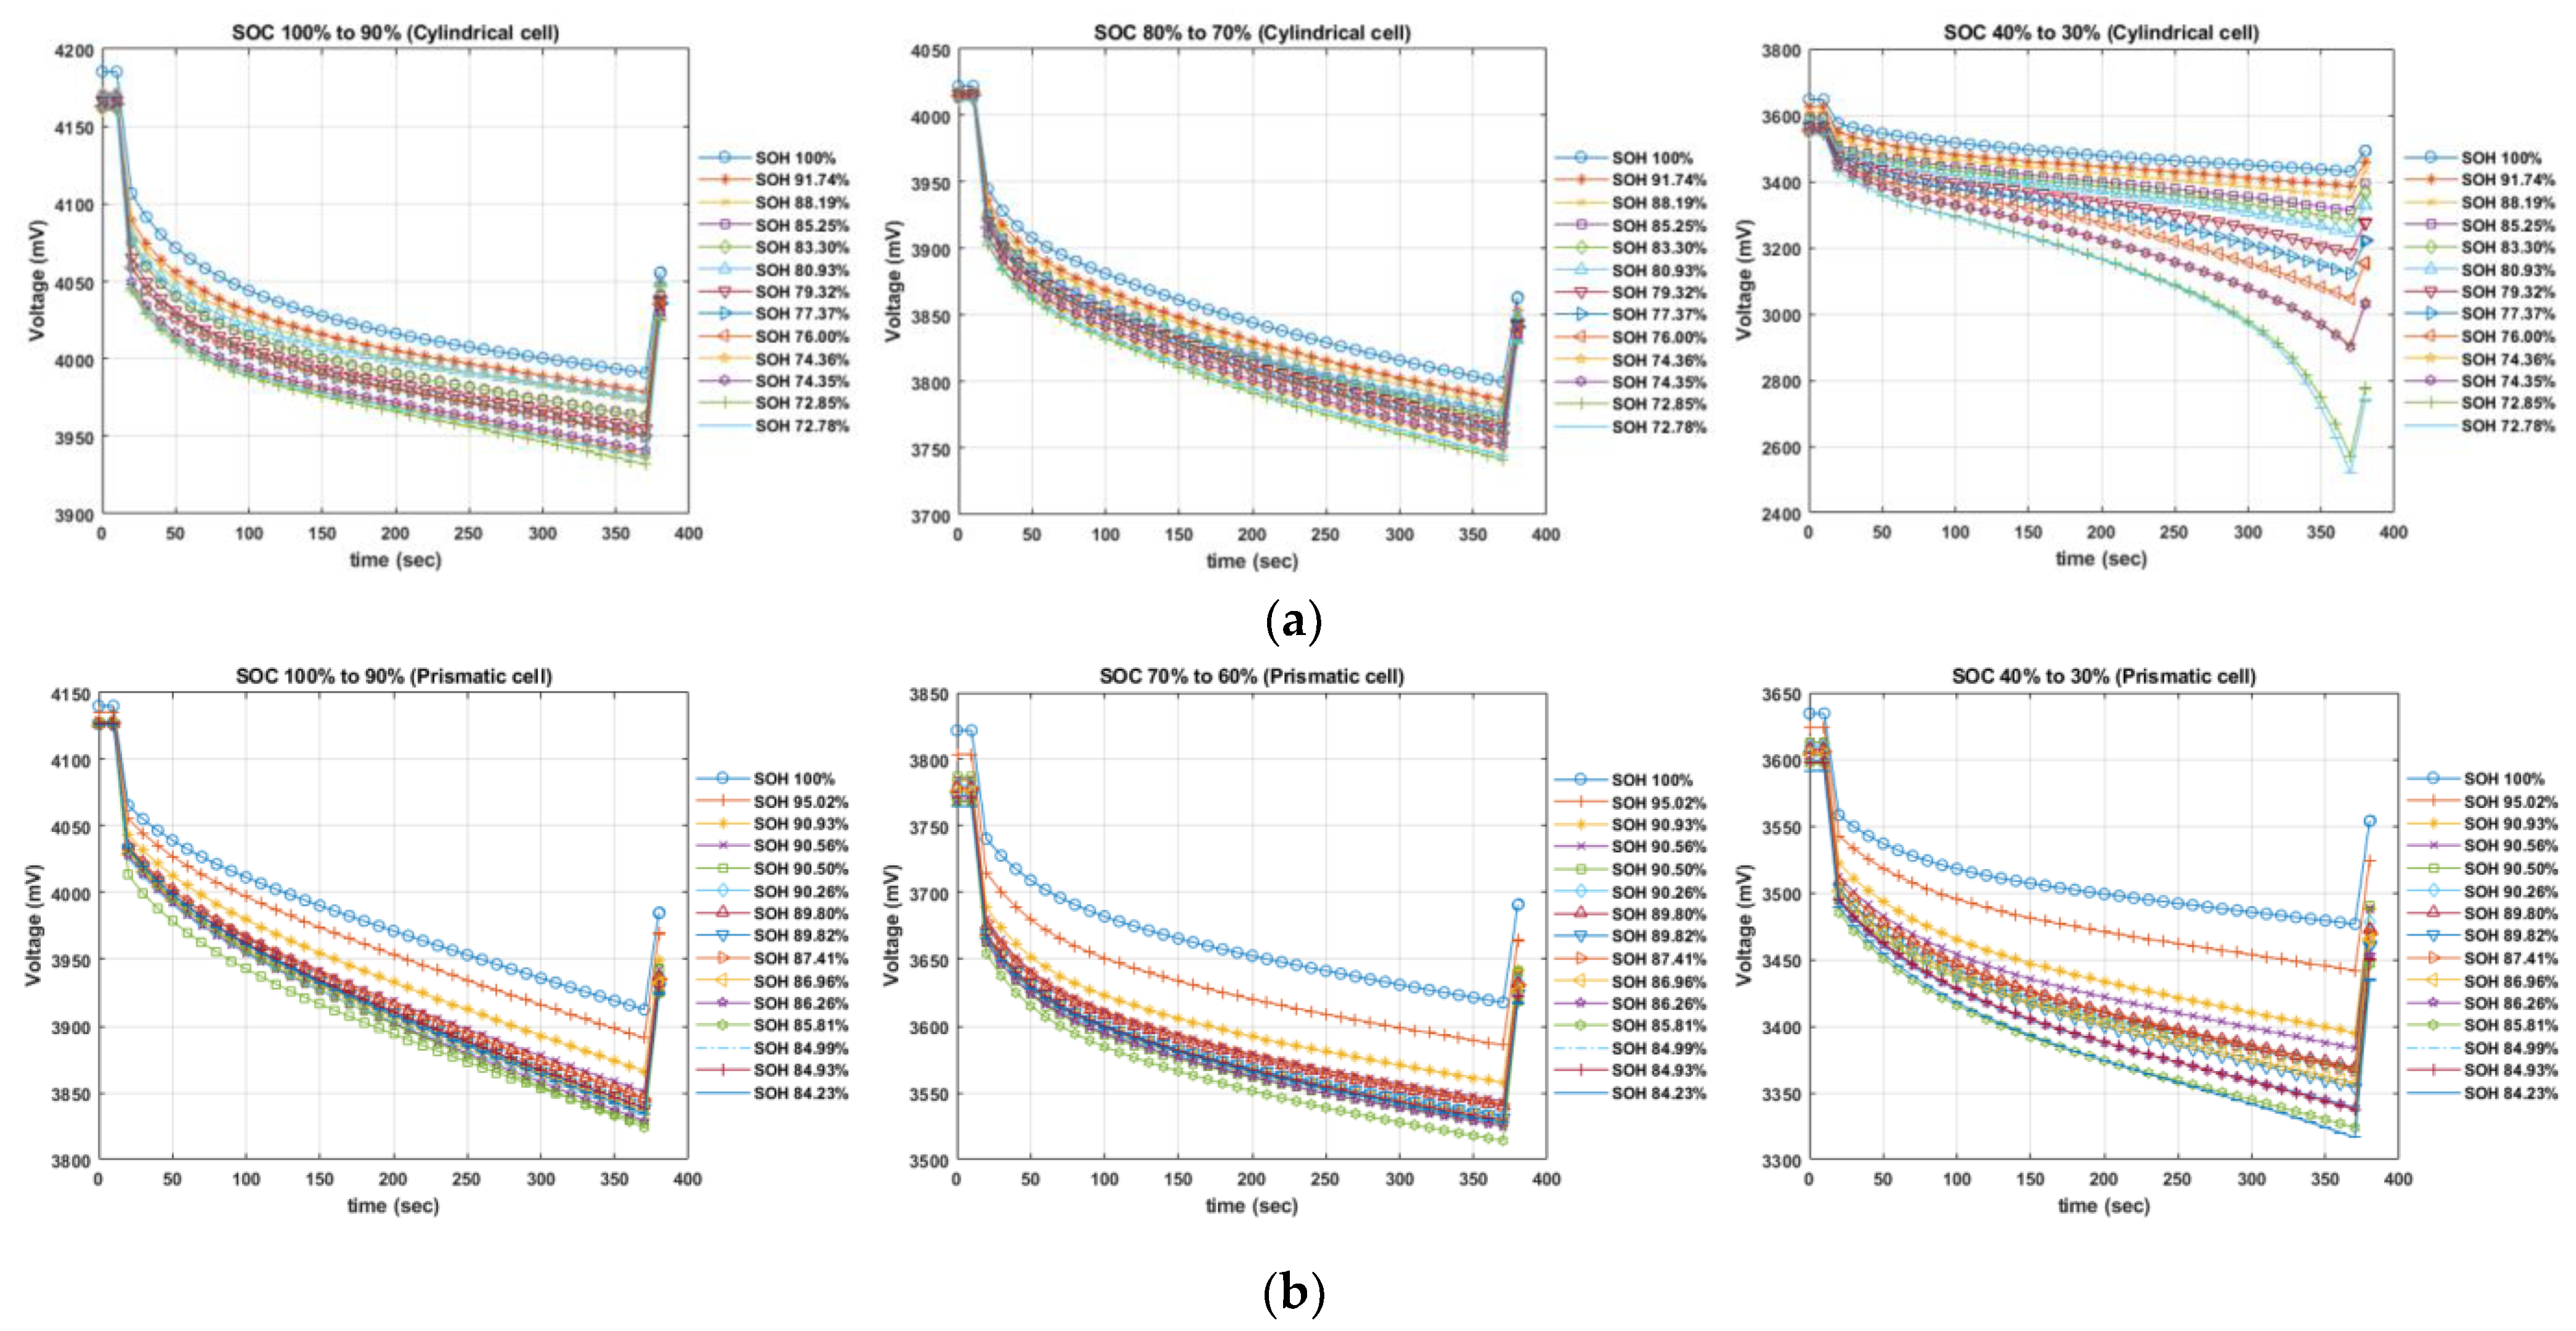
2.2. Transient Response Analysis (TRA) of Voltage

In order to estimate the SOH, it is important to identify features that might reflect and quantify battery storage capacity as battery capacity degrades. On top of that, the features that will be used to quantify battery capacity fade, have to be selected with values that can be easily obtained during battery operation, such as voltage, current, and temperature [7,8]. In this section, a description of the feature extraction used in the current research is provided. In order to quantify battery storage capacity after some battery degradation, a transient response of the voltage curve was used from a partial discharge experiment. As illustrated in Figure 2, t0 is right at the start of discharging with a known current, t1 is at the rapid voltage drop right after the start of discharging, t2 is at the end of discharging, and finally, t3 is right after the end of discharging.
As illustrated in Figure 3, the transient responses of voltage curves display the different voltage levels and curves for each SOH and each SOC. When the battery is near the start of life (near 100% of SOH), the voltage curves are positioned at high voltage ranges, and as the battery degrades or ages (less than 100% of SOH), the voltage curves are located at lower voltage ranges, respectively, according to SOH levels. These phenomena can be explained as follows. With the use of batteries over many cycles, it is well known that the internal resistance of the battery increases gradually, together with the decrease in battery storage capacity. With increased internal resistance, the voltage drop increases during discharge at the same current level [11,12,13]. In Figure 3, it is easy to see that the falloffs of transient responses of the voltage curve from the initial transient response of the voltage curve increase, respectively, as the SOH of the battery weakens due to aging over many cycles of charge and discharge. This voltage falloff can also be observed at other SOC levels. In the current study, transient responses to voltage curves were analyzed at various SOC levels from 100% down to 30% of SOC.

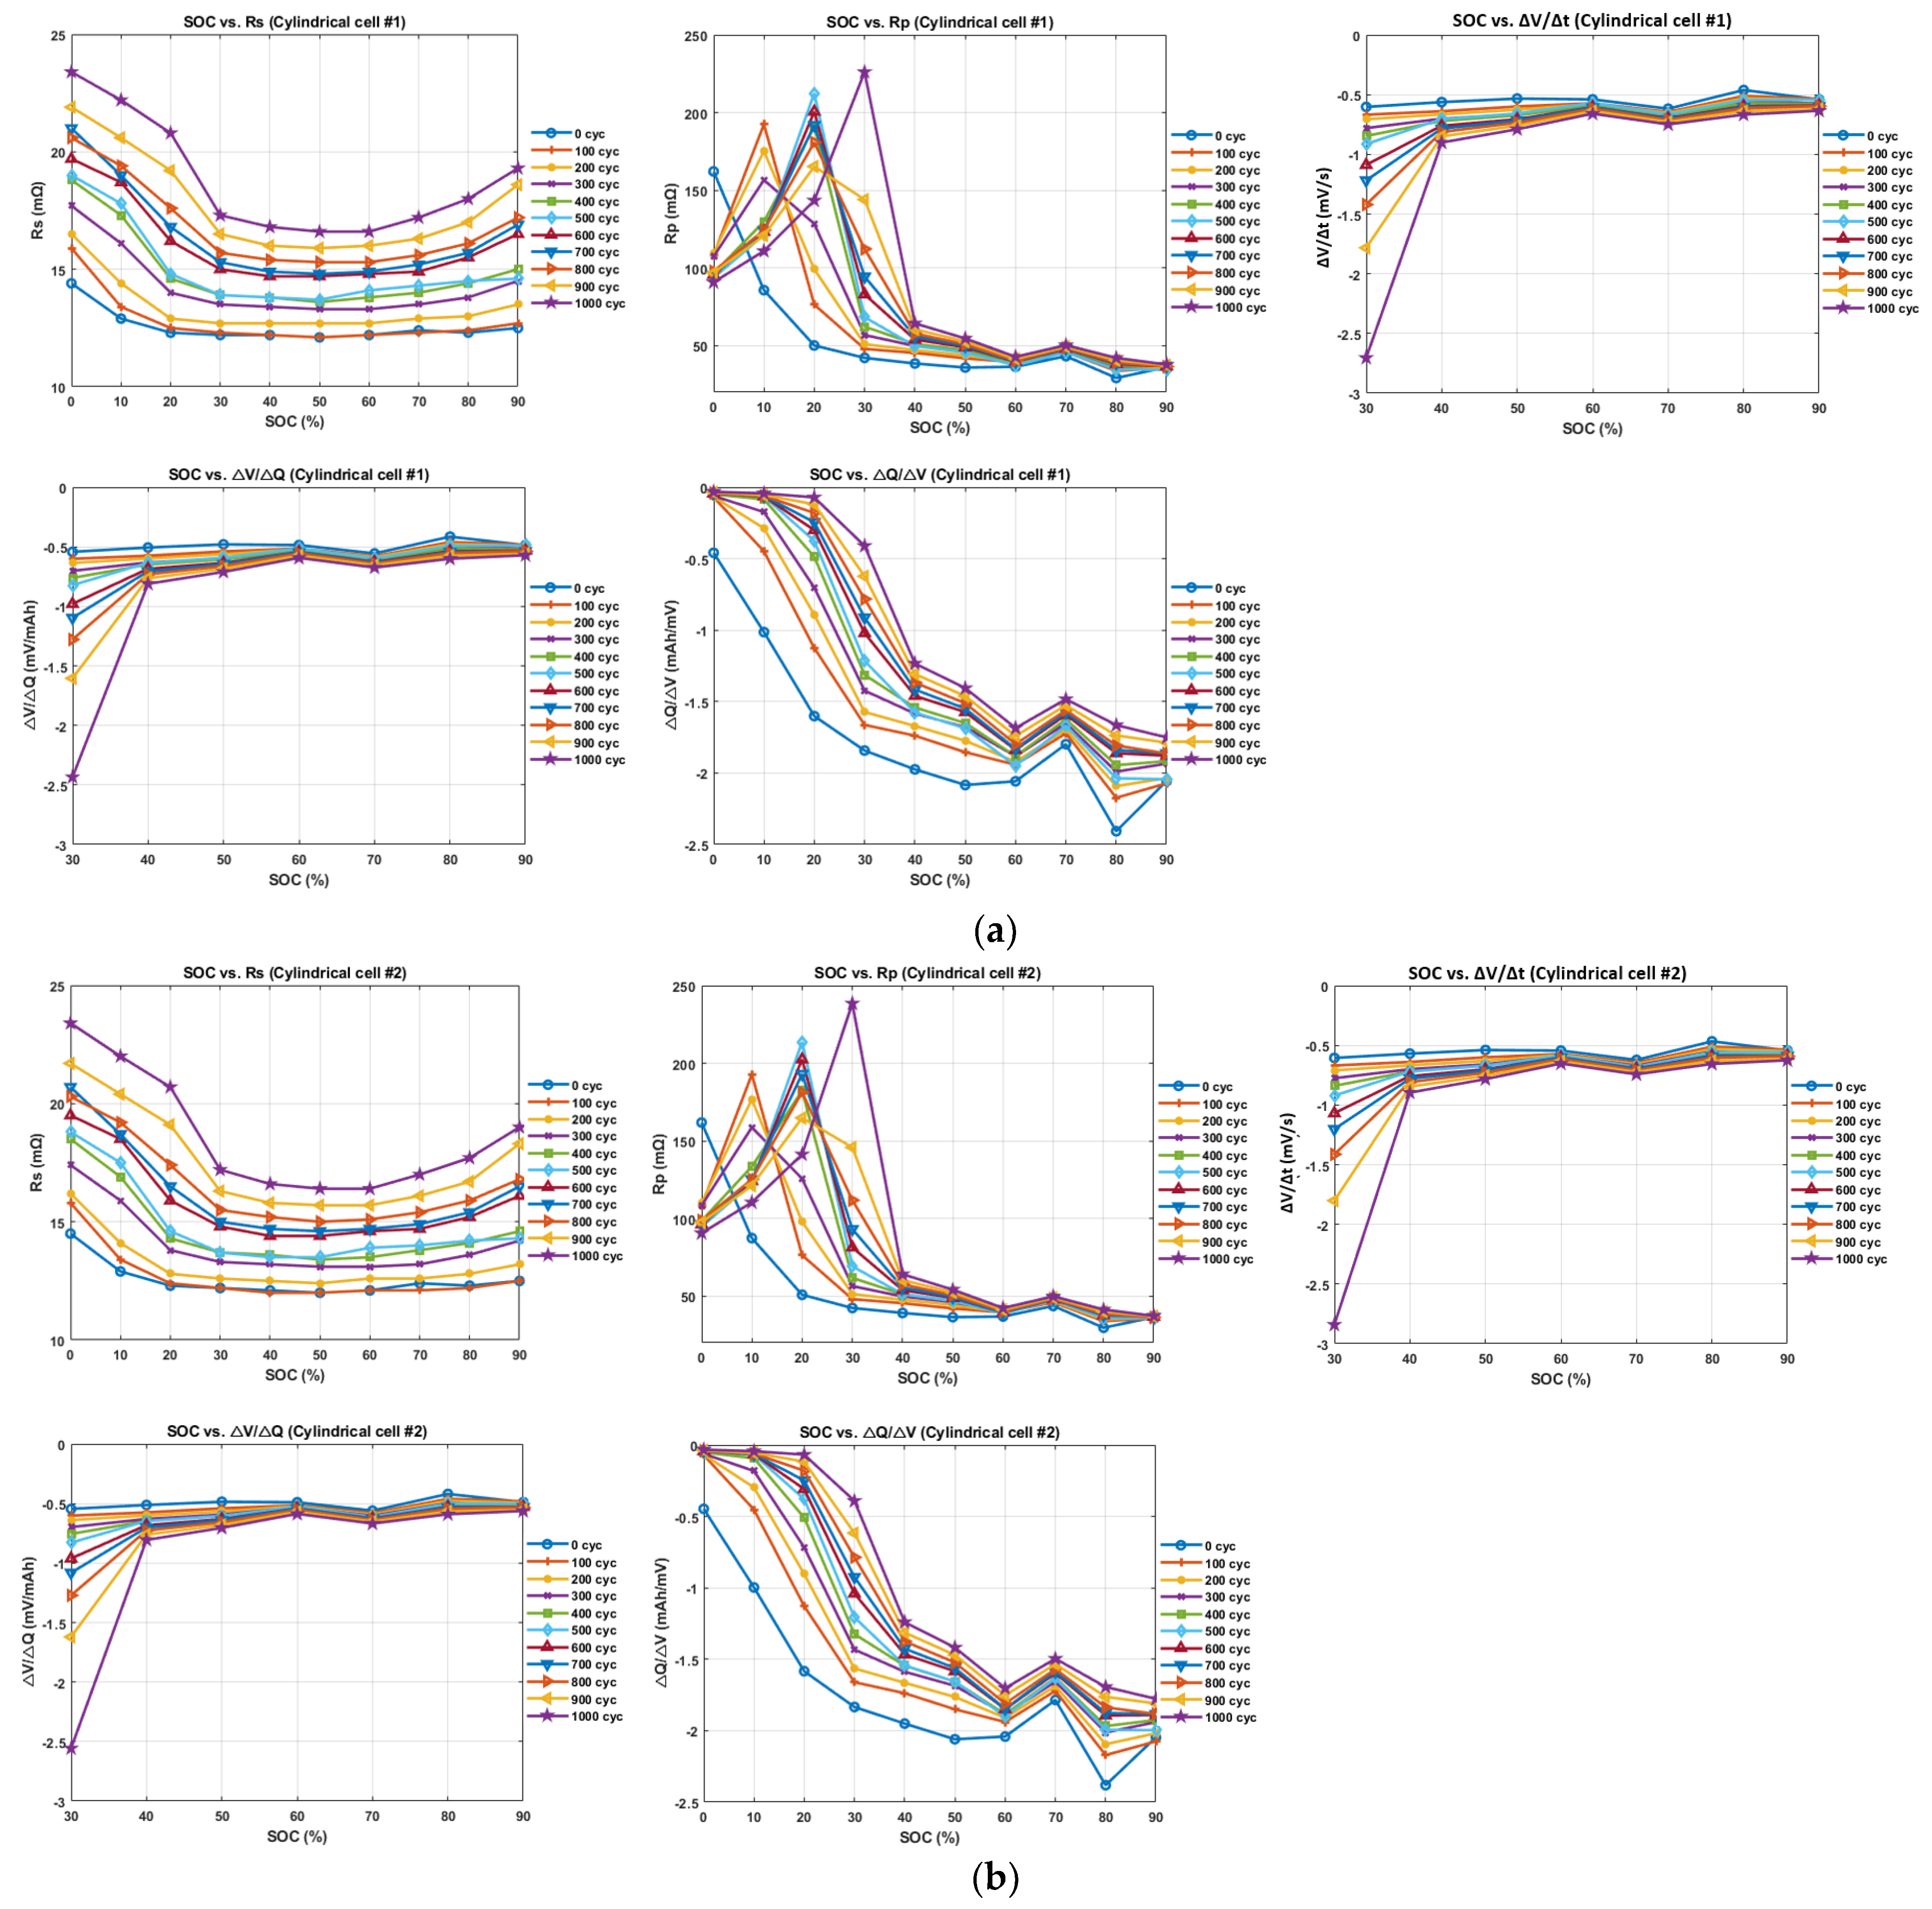
2.3. Feature Extraction and Correlation Analysis

2.3.1. Feature Extraction Based on Transient Response of Voltage Curve

In the automotive industry, battery capacity and DC internal resistance are regarded as representative features for quantifying battery degradation, as those estimates are the basis for driving distance and power output, respectively. However, if microscale changes are considered, lithium-ion batteries undergo various aging phenomena in their electrochemical characteristics as they are used over a long time, so in order to quantify battery state, it seems important to consider many parameters as indicators [14]. Based on the understanding of electrochemical processes, five indicating parameters were initially selected from the transient response of the voltage curve for the estimation of battery storage capacity in the current research. These indicators are readily measurable or obtainable through simple algebra while representing increasing or decreasing features as the batteries degrade, as displayed in Figure 3. Furthermore, these indicating parameters were selected to capture the commonly accepted characteristics of an equivalent circuit model of battery electrochemistry. Following the variable naming conventions shown in Figure 2, the internal resistance R s was calculated through Ohm’s law using the certain voltage drop at the start of partial discharging. Another resistance R p was calculated using a voltage after the certain initial drop and the voltage at the end of partial discharging. Due to global warming issues, the rapid growth of electric vehicle sales is fully expected to result in a dramatic increase in returned batteries after the first use. The overall voltage gradient during partial discharging, V t , denoted as M , was calculated in order to estimate the battery aging effect. Another parameter for the aging effect, V Q was selected, which represents the voltage drop over the integrated amount of current during the partial discharging process. Finally, Q V was considered to explain the decrease in discharging capacity over the voltage drops during the partial discharging process. All the extracted features are shown in Equations (3) to (7), and the representative values of indicating features are illustrated in Figure 4.
R s = V t 0 V t 1 I t                   [ ]
R p = V t 1 V t 2 I T                 [ ]
M = V t = V t 0 V t 2 360                 m V s
V Q = V t 0 V t 2 Q                 m V m A h
Q V = Q V t 0 V t 2                 m A h m V

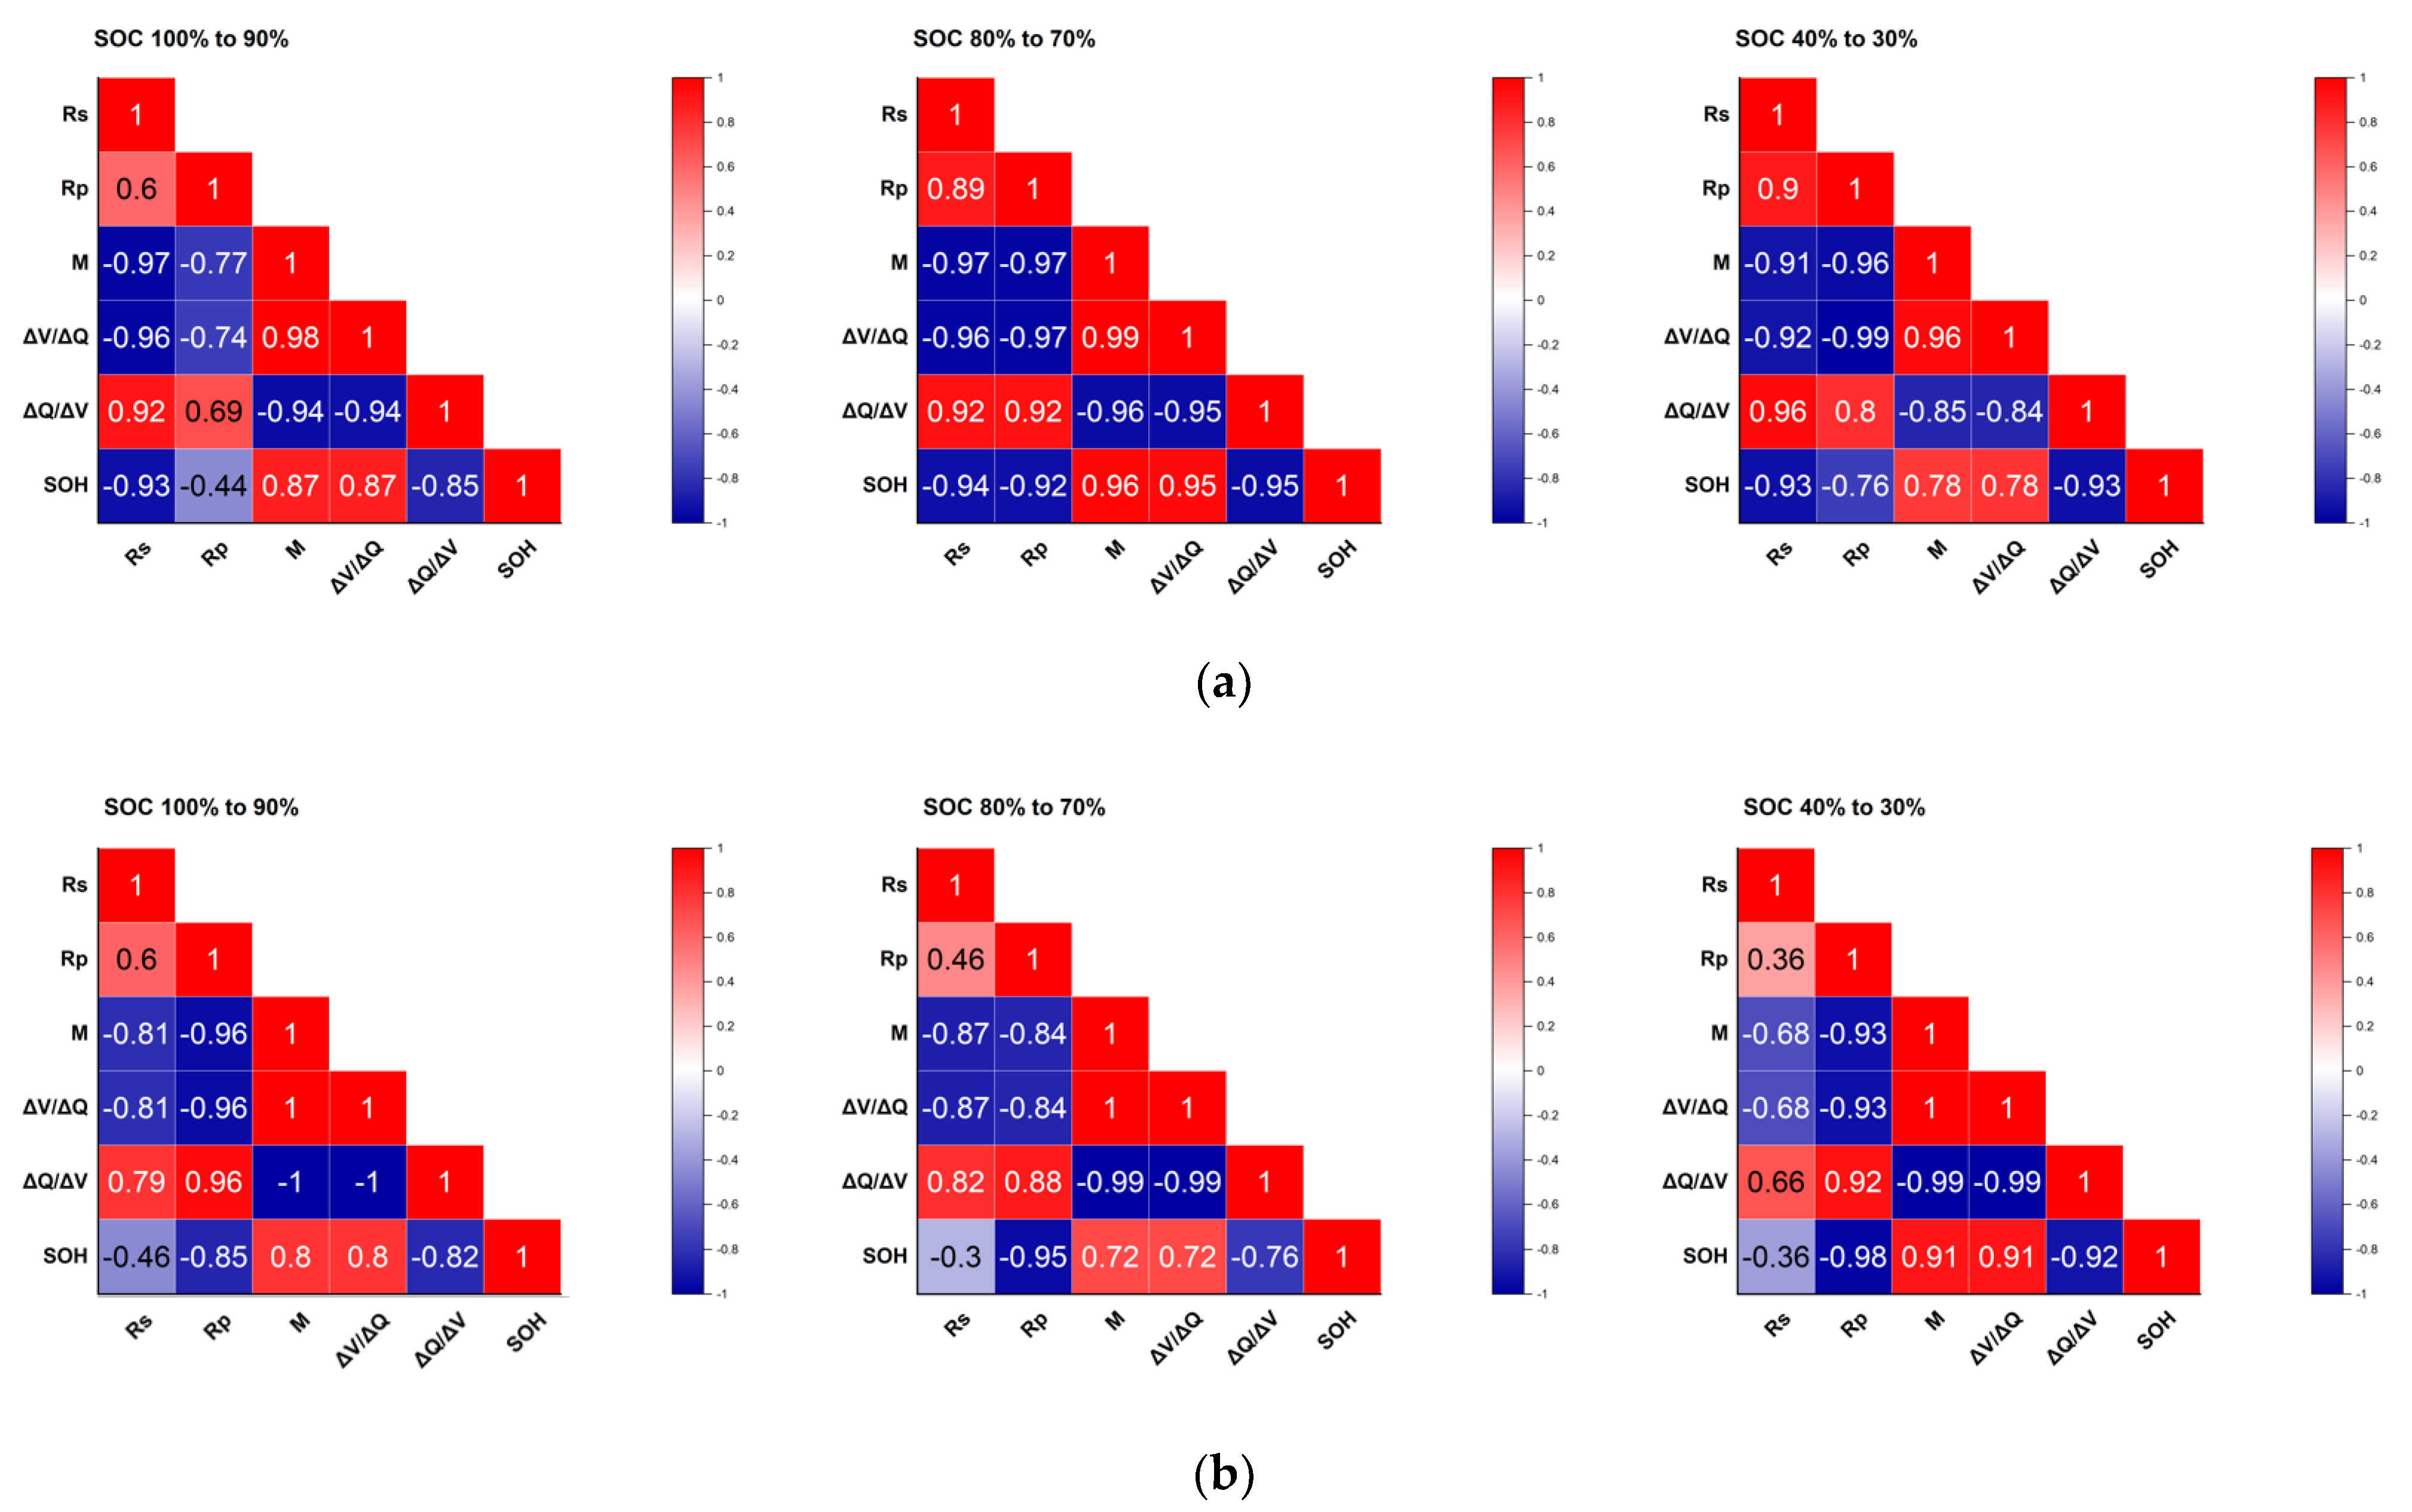
2.3.2. Correlation Analysis

While the features for estimation of battery capacity were selected based on careful observations of the transient responses of the voltage curves, it was still important to verify that the selected features are assessable indicators of battery capacity fades. The correlation between features and discharge capacity was analyzed systematically through Equation (8), indicating the Pearson correlation coefficient. The correlation coefficient, ρ , represents the degree of the linear relationship between two variables as a value between −1 and 1 where C O V ( X , Y ) is a covariance of X and Y , σ X is a standard deviation of X , and σ Y is a standard deviation of Y [15]. When ρ is positive, it means a positive linear correlation; in the opposite case, it means a negative linear correlation.
ρ X ; Y = C O V ( X , Y ) σ X σ Y               1 ρ 1
The correlation coefficients of cylindrical and prismatic cells are shown in Figure 5. As anticipated, while the five selected features displayed various coefficients spreading from −1 or 1, most were near −1 or 1, indicating somewhat reliable correlations. Based on the results of correlation analysis, five selected features were regarded as efficient indicators that could reasonably provide quantitative estimates of battery capacity fades. However, it should be noted that the correlation coefficients do not explain the casual relationships, so it is necessary to be careful in its interpretation [16].

2.4. Feature Reduction

When applying a regression model to the estimation of battery capacity as the battery degrades, it is important to consider various input features to determine the accurate state information of the battery. However, considering too many input features can sometimes lead to unexpected overfitting issues. Furthermore, in the regression analysis, estimated results could become too sensitive due to multicollinearity that occurs when input features have high correlations among each other. In order to alleviate these concerns, principal component analysis (PCA) was employed in the current study. With this analysis, initially selected input features were linearly transformed to come up with a reduced number of newly constructed input features based on PCA results. By utilizing PCA, more stable results from the regression model were expected while considering all of the initially selected input features based on understanding the electrochemistry of the battery reactions [16]. For example, the n th dimensions with the m th dataset can be formulated as in Equation (9), each variable of X means standardized value, and the covariance matrix, C , for the vector X , is given in Equation (10). Here, i and j are the order numbers corresponding to the n th dimension, T represents the transposed matrix, and μ is the mean value of all data. Then, eigenvalues and eigenvectors can be calculated as in Equation (11), where λ is an eigenvalue, and E is an eigenvector. The eigenvector E can be formulated as an eigenvector V , as shown in Equation (12), by arranging the number of variables ( k ) in order of magnitude. Finally, the principal component ( Z ) linearly transformed through PCA can be calculated as Equation (13), and the number of principal components will be K n , respectively [17]. Typically, the number of principal components can be determined as less than the number of features, and the principal components can be calculated through eigenvalues ( λ n ) and the cumulative contribution of the features [18]. In the current research, two principal components were selected based on the cumulative contribution of 95% or more, which are shown in Table 1 and Table 2. The decision was made to consider only the major contributors among principal components as a sharp decrease in the contributions was observed between the second and the third principal components.
X = x 11 x 21 x 12 x 22 x 1 n x 2 n x m 1 x m 2 x m n
C i j = 1 m l = 1 m ( X i l μ i ) ( X i l μ j ) T , μ n = 1 m i = 1 m X n i
C E = λ E
V = V 1 , V 2 , , V k
Z = V T X

2.5. Multiple Linear Regression Model

Based on the results from PCA, two principal components were reconstructed through a linear combination of initially selected five input features. With these two transformed features (Z1, Z2), a multiple linear regression process was performed for the estimation of battery capacity. The multiple linear regression model can be formulated as Equations (14) and (15) where ϵ follows N ( 0 , σ 2 ) , normal distribution with variance σ 2 . The difference between the actual discharge capacity and the fitted regression line is expressed by errors, and the regression coefficient β 0 , β 1 , and β 2 are calculated to minimize the sum of squared error (SSE) [19,20,21]. In this work, Z1 and Z2 are used as independent variables to calculate the regression coefficient, and the battery capacity measured through the coulomb counting method is used as the dependent variable of the multiple linear regression (MLR) model that minimize the SSE for each SOC range.
Y k = β 0 + β 1 Z 1 k + β 2 Z 2 k + ϵ k ,     ( k = 1 , 2 n )
Y = Y 1 Y 2 Y k , X = 1 1 1   x 11   x 21   x k 1   x 21   x 22   x k 2   x 1 n   x 2 n   x k n , β = b ^ 1 b ^ 2 b ^ k , ϵ = ε 1 ε 2 ε k

3. Estimated Battery Storage Capacity and Comparison with the Measured Capacities

The coefficient of determination, R 2 , is calculated to evaluate the performance of the regression model. It is a measure of the degree to which the estimated linear model fits the given dataset. The adjusted coefficient of determination, R a d j 2 , is a scale to compensate for the problem that R 2 increases as the training dataset and independent variables increase [22,23]. R 2 , R a d j 2 , and the percentage of error of the model’s estimated value are shown in Equations (16) to (18), where n is the number of samples and k is the number of independent variables.
R 2 = i = 1 n ( y i y ^ i ) 2 i = 1 n ( y i y ¯ ) 2
R a d j 2 = 1 ( n 1 ) ( 1 R 2 ) ( n k 1 )
e r r o r = | y i y ^ i | y i × 100 %

3.1. Case Study1: Cylindrical Cells

The training dataset for the MLR model used the datasets of C1 and C2 up to 1000 cycles, and the 1000th cycle dataset was used as a test dataset. The results in Table 3 show that the errors were within 4% of C1 and C2. Based on the results, it can be regarded that the proposed SOH estimation model shows high performance over the SOC 100% to 30% range.

3.2. Case Study2: Prismatic Cells

For the prismatic cell training dataset, data of up to 1200 cycles were used, and the dataset with the 1200th cycle was used as the test dataset. The SOH estimation results in Table 4 show that the errors were within 3% in most SOC ranges (100% to 30%) except for the range of SOC 100% to 90% of the P1 case and the range of 70% to 60% of the P2 case. As both R 2 and R a d j 2 are reasonably high in 10 SOC ranges and among 14 SOC ranges, it shows that the estimation algorithm for SOH for prismatic cells is reasonably dependable.

4. Discussion and Concluding Remarks

Through the partial discharging experiment along with the proposed estimation algorithm of battery capacity, the battery capacities of all cells were assessed and compared with the actual obtained true values. While the proposed algorithm could evaluate battery capacity only after 6 min of partial discharging, the results showed that the SOH of the battery cells was estimated within the range of 6% at the maximum error in all SOC ranges.
To improve regression model performance, it is obvious that more partial discharge datasets are required for the estimation reliability and accuracy. Nonetheless, the performance of the proposed algorithm demonstrated with limited data that the methodology is quite unique and meaningful. Based on the results of cylindrical cells and prismatic cells, the SOH evaluation algorithm proposed in this paper showed a powerful advantage in the assessment of SOH in terms of evaluation speed, as only the partial discharging process of target batteries is required. It is strongly believed that the current approach will improve as the datasets for the regression model increase by securing additional partial discharge datasets.
As a notable remark about the current approach, the importance of the use of PCA should be mentioned since the input features or parameters leading to reliable estimation of battery capacity can be numerous, and the number of them is far more than five compared to the five features used in the current study. With the PCA approach, under any number of initial features, a systematic approach can be followed to establish a reduced number of independent input parameters. This is done through a linear combination of initial parameters. Multiple regression analyses can then be performed for the reliable estimation of battery capacities after dimensionality reduction.

Author Contributions

Conceptualization, C.J.; methodology, C.J.; software, C.J.; validation, C.J. and W.C.; formal analysis, W.C.; resources, W.C.; writing—original draft preparation, C.J.; writing—review and editing, C.J. and W.C.; supervision, W.C. All authors have read and agreed to the published version of the manuscript.

Funding

This research received no external funding.

Data Availability Statement

Not applicable.

Conflicts of Interest

The authors declare no conflict of interest.

References

  1. Zhu, J.; Mathews, I.; Ren, D.; Li, W.; Cogswell, D.; Xing, B.; Sedlatschek, T.; Kantareddy, S.N.R.; Yi, M.; Gao, T.; et al. End-of-life or second-life options for retired electric vehicle batteries. Cell Rep. Phys. Sci. 2021, 2, 100537. [Google Scholar] [CrossRef]
  2. Hua, Y.; Liu, X.; Zhou, S.; Huang, Y.; Ling, H.; Yang, S. Toward Sustainable Reuse of Retired Lithium-ion Batteries from Electric Vehicles. Resour. Conserv. Recycl. 2021, 168, 105249. [Google Scholar] [CrossRef]
  3. Shahjalal, M.; Roy, P.K.; Shams, T.; Fly, A.; Chowdhury, J.I.; Ahmed, M.R.; Liu, K. A review on second-life of Li-ion batteries: Prospects, challenges, and issues. Energy 2021, 241, 122881. [Google Scholar] [CrossRef]
  4. Hu, X.; Deng, X.; Wang, F.; Deng, Z.; Lin, X.; Teodorescu, R.; Pecht, M.G. A Review of Second-Life Lithium-Ion Batteries for Stationary Energy Storage Applications. Proc. IEEE 2022, 110, 735–753. [Google Scholar] [CrossRef]
  5. Martinez-Laserna, E.; Gandiaga, I.; Sarasketa-Zabala, E.; Badeda, J.; Stroe, D.-I.; Swierczynski, M.; Goikoetxea, A. Battery second life: Hype, hope or reality? A critical review of the state of the art. Renew. Sustain. Energy Rev. 2018, 93, 701–718. [Google Scholar] [CrossRef]
  6. Steckel, T.; Kendall, A.; Ambrose, H. Applying levelized cost of storage methodology to utility-scale second-life lithium-ion battery energy storage systems. Appl. Energy 2021, 300, 117309. [Google Scholar] [CrossRef]
  7. Yao, L.; Xu, S.; Tang, A.; Zhou, F.; Hou, J.; Xiao, Y.; Fu, Z. A Review of Lithium-Ion Battery State of Health Estimation and Prediction Methods. World Electr. Veh. J. 2021, 12, 113. [Google Scholar] [CrossRef]
  8. Lin, Q.; Li, H.; Chai, Q.; Cai, F.; Zhan, Y. Simultaneous and rapid estimation of state of health and state of charge for lithium-ion battery based on response characteristics of load surges. J. Energy Storage 2022, 55, 105495. [Google Scholar] [CrossRef]
  9. Ren, P.; Wang, S.; He, M.; Cao, W. Novel strategy based on improved Kalman filter algorithm for state of health evaluation of hybrid electric vehicles Li-ion batteries during short and long term operating conditions. J. Power Electron. 2021, 21, 1190–1199. [Google Scholar] [CrossRef]
  10. Wang, S.; Yin, Z.; Lu, X.; Yang, D.; Tian, S.; Han, Y.; Zheng, Z. Research on the Influence of Battery Cell Static Parameters on the Capacity of Different Topology Battery Packs. Energies 2021, 14, 1610. [Google Scholar] [CrossRef]
  11. Edge, J.S.; O’KaneKane, S.; Prosser, R.; Kirkaldy, N.D.; Patel, A.N.; Hales, A.; Ghosh, A.; Ai, W.; Chen, J.; Yang, J.; et al. Lithium ion battery degradation: What you need to know. Phys. Chem. Chem. Phys. 2021, 23, 8200. [Google Scholar] [CrossRef]
  12. Han, X.; Lu, L.; Zheng, Y.; Feng, X.; Li, Z.; Li, J.; Ouyang, M. A review on the key issues of the lithium ion battery degradation among the whole life cycle. eTransportation 2019, 1, 100005. [Google Scholar] [CrossRef]
  13. Cao, J.; Harrold, D.; Fan, Z.; Morstyn, T.; Healey, D.; Li, K. Deep Reinforcement Learning-Based Energy Storage Arbitrage With Accurate Lithium-Ion Battery Degradation Model. IEEE Trans. Smart Grid 2020, 11, 4513–4521. [Google Scholar] [CrossRef]
  14. Li, Y.; Stroe, D.; Cheng, Y.; Sheng, H.; Sui, X.; Teodorescu, R. On the feature selection for battery state of health estimation based on charging–discharging profiles. J. Energy Storage 2021, 33, 102122. [Google Scholar] [CrossRef]
  15. Li, Q.; Li, D.; Zhao, K.; Wang, L.; Wang, K. State of health estimation of lithium-ion battery based on improved ant lion optimization and support vector regression. J. Energy Storage 2022, 50, 104215. [Google Scholar] [CrossRef]
  16. Chang, C.; Wang, Q.; Jiang, J.; Wu, T. Lithium-ion battery state of health estimation using the incremental capacity and wavelet neural networks with genetic algorithm. J. Energy Storage 2021, 38, 102570. [Google Scholar] [CrossRef]
  17. Granato, D.; Santos, J.S.; Escher, G.B.; Ferreira, B.L.; Maggio, R.M. Use of principal component analysis (PCA) and hierarchical cluster analysis (HCA) for multivariate association between bioactive compounds and functional properties in foods: A critical perspective. Trends Food Sci. Technol. 2018, 72, 83–90. [Google Scholar] [CrossRef]
  18. Lyu, Z.; Wang, G.; Tan, C. A novel Bayesian multivariate linear regression model for online state-of-health estimation of Lithium-ion battery using multiple health indicators. Microelectron. Reliab. 2022, 131, 114500. [Google Scholar] [CrossRef]
  19. Wei, Z.; He, Q.; Zhao, Y. Machine learning for battery research. J. Power Sources 2022, 549, 232125. [Google Scholar] [CrossRef]
  20. Vilsen, S.B.; Stroe, D. Battery state-of-health modelling by multiple linear regression. J. Clean. Prod. 2021, 290, 125700. [Google Scholar] [CrossRef]
  21. Tamilselvi, S.; Gunasundari, S.; Karuppiah, N.; Razak RK, A.; Madhusudan, S.; Nagarajan, V.M.; Sathish, T.; Shamim, M.Z.M.; Saleel, C.A.; Afzal, A. A Review on Battery Modelling Techniques. Sustainability 2021, 13, 10042. [Google Scholar] [CrossRef]
  22. Gong, D.; Gao, Y.; Kou, Y.; Wang, Y. State of health estimation for lithium-ion battery based on energy features. Energy 2022, 257, 124812. [Google Scholar] [CrossRef]
  23. Driscoll, L.; de la Torre, S.; Gomez-Ruiz, J.A. Feature-based lithium-ion battery state of health estimation with artificial neural networks. J. Energy Storage 2022, 50, 104584. [Google Scholar] [CrossRef]
Figure 1. (a) cylindrical cell cycler (b) prismatic cell cycler.
Batteries 09 00424 g001
Figure 2. Transient response of voltage curve obtained from a partial discharge experiment.
Batteries 09 00424 g002
Figure 3. Transient responses of voltage curve from a battery at different SOHs and SOCs (a) Cylindrical cells (b) Prismatic cells.
Batteries 09 00424 g003
Figure 4. Selected features from transient responses of voltage curves for various SOC and SOH from (a) cylindrical cell #1, (b) cylindrical cell #2, (c) prismatic cell #1, and (d) prismatic cell #2.
Batteries 09 00424 g004aBatteries 09 00424 g004b
Figure 5. Correlation matrix of selected features and discharge capacity (a) Cylindrical cells (b) Prismatic cells.
Batteries 09 00424 g005
Table 1. Eigenvalues and contributions of each principal component (cylindrical cell).
PCEigenvaluePercentage of VarianceCumulative
14.427488.55%88.55%
20.46239.24%97.79%
30.08931.79%99.58%
40.02070.41%99.99%
50.00040.01%100.00%
Table 2. Eigenvalues and contributions of each principal component (prismatic cell).
PCEigenvaluePercentage of VarianceCumulative
14.559091.18%91.18%
20.41178.23%99.41%
30.02440.49%99.90%
40.00490.10%100.00%
50.00010.00%100.00%
Table 3. The result of SOH estimation (Cylindrical cells).
Cell No.SOC β 0 β 1 β 2 R 2 R a d j 2 Estimated
SOH
(%)
Measured
SOH
(%)
Error (%)
C1100% to 90%0.33250.35240.51940.87880.865471.4772.851.90
90% to 80%0.3325−0.43840.10650.93560.928470.353.43
80% to 70%0.3325−0.43010.00370.92740.919469.973.96
70% to 60%0.33250.42640.46950.90720.896969.993.92
60% to 50%0.3325−0.43820.26350.96840.964971.441.94
50% to 40%0.3325−0.4212−0.45150.94980.944271.132.37
40% to 30%0.33250.3457−0.59350.89340.881671.571.76
C2100% to 90%0.33250.35240.51940.87880.865471.5372.781.72
90% to 80%0.3325−0.43840.10650.93560.928471.651.55
80% to 70%0.3325−0.43010.00370.92740.919471.092.32
70% to 60%0.33250.42640.46950.90720.896971.052.38
60% to 50%0.3325−0.43820.26350.96840.964972.201.04
50% to 40%0.3325−0.4212−0.45150.94980.944271.341.98
40% to 30%0.33250.3457−0.59350.89340.881671.831.30
Table 4. The result of SOH estimation (Prismatic cells).
Cell No.SOC β 0 β 1 β 2 R 2 R a d j 2 Estimated
SOH
(%)
Measured
SOH
(%)
Error (%)
P1100% to 90%0.3150−0.36950.45820.72910.704488.772484.934.52
90% to 80%0.31500.38830.70840.89550.886087.23572.71
80% to 70%0.3150−0.3787−0.81170.85640.843388.37084.05
70% to 60%0.3150−0.3062−0.86930.65770.626585.22960.35
60% to 50%0.3150−0.3486−0.32500.68820.659886.20331.50
50% to 40%0.31500.41280.55510.94300.937886.69412.08
40% to 30%0.31500.39950.48770.95980.956186.88592.30
P2100% to 90%0.3150−0.36950.45820.72910.704485.991984.232.09
90% to 80%0.31500.38830.70840.89550.886086.59292.81
80% to 70%0.3150−0.3787−0.81170.85640.843385.48281.49
70% to 60%0.3150−0.3062−0.86930.65770.626589.10345.79
60% to 50%0.3150−0.3486−0.32500.68820.659885.39561.39
50% to 40%0.31500.41280.55510.94300.937884.09640.16
40% to 30%0.31500.39950.48770.95980.956183.97110.30
Disclaimer/Publisher’s Note: The statements, opinions and data contained in all publications are solely those of the individual author(s) and contributor(s) and not of MDPI and/or the editor(s). MDPI and/or the editor(s) disclaim responsibility for any injury to people or property resulting from any ideas, methods, instructions or products referred to in the content.

