4.2. Determination of BPC Parameters
The definition of BPC in
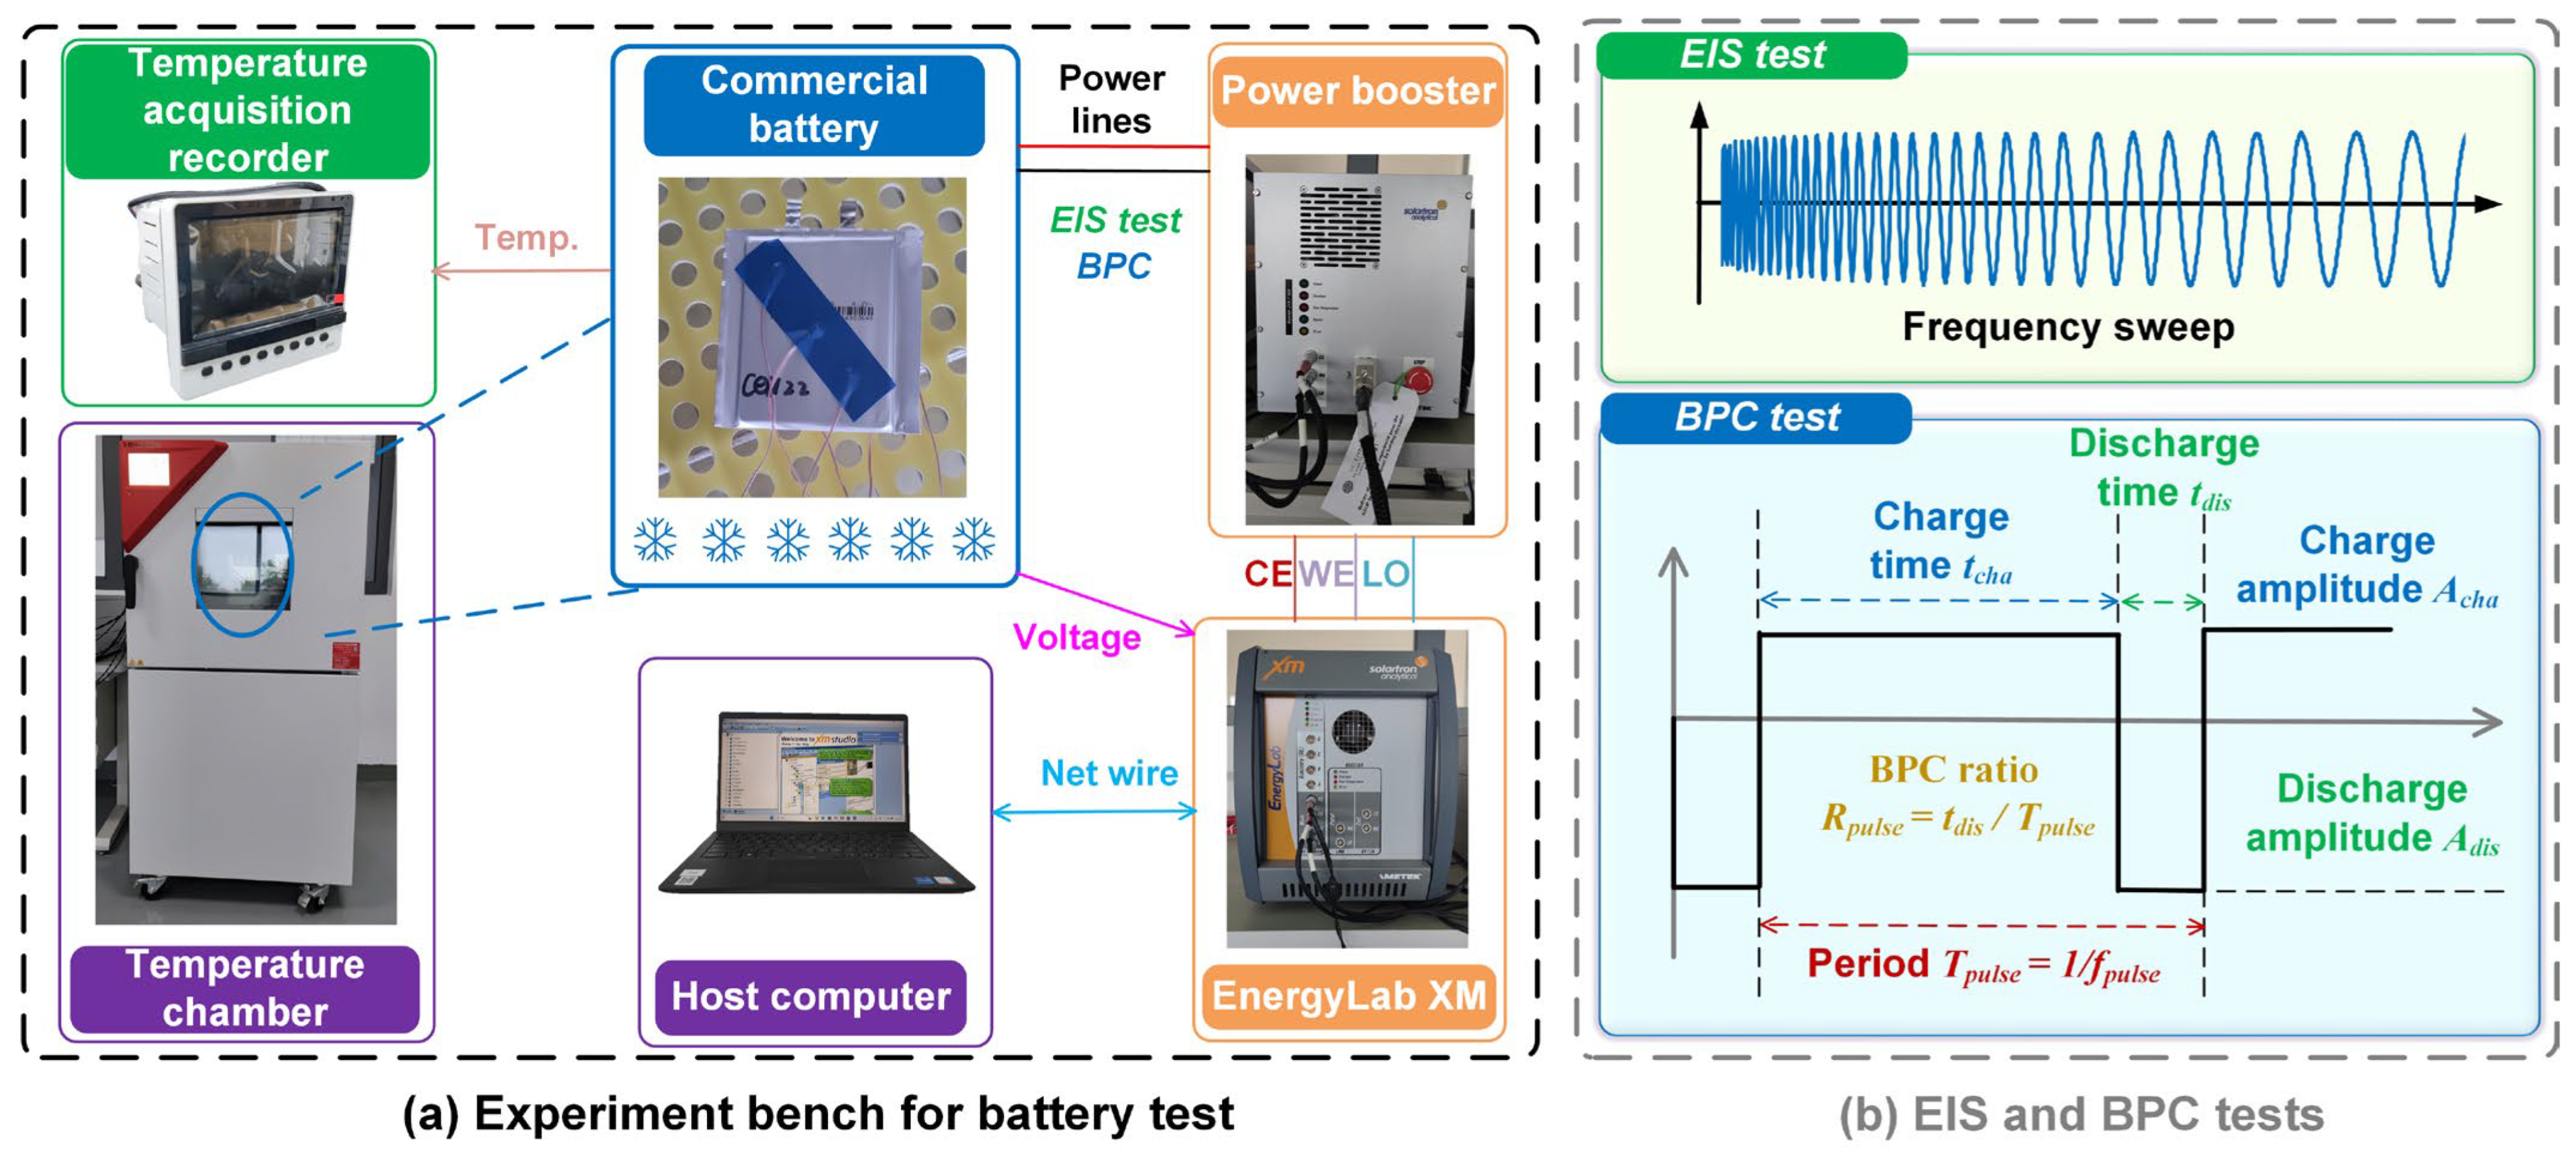
Figure 1 contains several parameters, which makes it difficult to study the heating power variation of the BPC with different parameters. In practical scenarios of AC heating applications, there are two primary types of AC heating schemes. One category encompasses the AC heating scheme with energy injection, as seen in instances where battery packs are heated through charge devices [
40,
41,
42,
43]. The second type involves the AC heating scheme without energy injection. In the latter approach, the design of the AC heating scheme commonly leverages circuit elements to configure heating systems, effectively employing controlled switching elements to induce AC heating in batteries [
13,
14,
16,
44]. For the AC heating scheme with energy injection, adhering to an equilibrium between discharge and charge ampere-hours in a single cycle may not be theoretically essential. In contrast, for the AC heating schemes without energy injection, it is preferable to uphold parity between discharge and charge ampere-hours in a single cycle, thereby mitigating energy consumption. Given the context of EV applications, the AC heating scheme without energy injection proves more expedient for implementation. Furthermore, the AC heating scheme with energy injection can also embrace the strategy of equalizing the charge and discharge ampere-hours. Consequently, this paper delves into an analysis of the influence exerted by varying BPC parameters on heating power under the stipulation of maintaining equal charge and discharge ampere-hours. This can be expressed as
Subject to the constraints outlined in Equation (13), the BPC can be uniquely determined by the three parameters: frequency
fpulse, ratio
Rpulse, and discharge amplitude
Adis. In addition, the failure boundary of the battery also needs to be considered during the design of AC heating strategies. Therefore, in this study, the heating power corresponding to different BPC parameters must satisfy the failure boundary constraints. Although various approaches have been proposed by researchers for the development of AC heating strategies, the determination of constraint boundaries remains a topic of controversy. Currently, recognized failure modes of low-temperature AC heating include lithium plating, overcharge, and over-discharge [
25,
30,
45], which have been the focal points of recent research. Controlling the polarization voltage of the battery, specifically the charge and discharge cut-off voltages, is one way to mitigate these failure modes. However, the relationships between lithium plating and terminal voltage, overcharge and terminal voltage, and over-discharge and terminal voltage under high-frequency AC conditions remain unclear. Thus, to encompass a wide range of terminal voltage, this paper considers charge cut-off voltage constraints within the range of 4.2 V–5 V and discharge cut-off voltage constraints within the range of 2 V–3 V. In addition, although the parameters determining the BPC include frequency
fpulse, ratio
Rpulse, and discharge amplitude
Adis,
Adis is determined by the voltage constraint. When the frequency
fpulse and ratio
Rpulse are determined, there is a maximum amplitude
Adis so that the terminal voltage is exactly at the constraint boundary and the corresponding heating power is maximum. This heating power is the object of the subsequent study in this paper.
In addition to the discharge amplitude
Adis, two other parameters that require attention are frequency
fpulse and ratio
Rpulse. The ratio
Rpulse takes values between 0 and 1. The values of 0 and 1 represent complete charging and complete discharging, respectively. Therefore, 0 and 1 cannot be taken. For this research, the ratio analysis ranges from 0.05 to 0.95 and the calculation of the heating power is conducted at an interval of 0.05. Moreover, the selection of frequency range is based on the EIS test results of the battery. Four frequencies (0.5 Hz, 5 Hz, 100 Hz, and 10,000 Hz) are chosen to ensure the coverage of the entire impedance distribution as extensively as possible.
Figure 8 illustrates the distribution of these four frequencies over the EIS at different temperatures. The current amplitude corresponding to each impedance is 0.25 A.
4.3. Heating Power of the Battery with Different BPC Parameters
Figure 9 shows the variation of the relationship between
Rpulse and heating power with frequency and temperature at different discharge cut-off voltages. The legends for the 0.5 Hz, 5 Hz, and 100 Hz results in the figure range from 0 W to 150 W, while the legends for the 10,000 Hz results range from 0 W to 300 W. The black areas in the plots indicate that the heating power exceeds the maximum value in the legend. For further analysis of the heating power distribution,
Figure A1 provides detailed information for each case. The heating power falling in the black area can be examined and analyzed in
Figure A1. In each subplot of
Figure 9 and
Figure A1, it is evident that the heating power gradually increases as the discharge cut-off voltage decreases at the same
Rpulse. When the discharge cut-off voltage is set to a smaller value, a higher discharge current is required to reach the discharge cut-off voltage. Additionally, based on Equation (13), the charge current also increases accordingly. Consequently, the battery heating power increases. Then, under the same discharge cut-off voltage constraint, the battery heating power becomes larger first and then smaller as
Rpulse increases in most cases. The heating power variation can be attributed to the combined effects of currents and time of discharge and charge. To illustrate this phenomenon, the results for 100 Hz@−5 °C with the discharge cut-off voltage of 2.7 V as shown in
Table 3. Combined with Equation (1), currents and the time of discharge and charge are relatively large in terms of magnitude. (In calculating the heating power, the discharge time is
tdis/Tpulse and the charge time is
tcha/
Tpulse according to Equation (1)) Although
and
exhibit variation, their impact on heating power is comparatively minor. Therefore, currents and the time of discharge and charge are the main factors affecting the battery heating power. When
Rpulse increases, the discharge current diminishes while the discharge heating power initially rises and subsequently declines. Notably, the discharge heating power reaches its peak when
Rpulse is 0.8. When
Rpulse is less than 0.8, although the discharge current decreases, the degree of decrease is not large. In addition, the discharge time in one cycle increases. Therefore, the discharge heating power increases. When
Rpulse exceeds 0.8, although the discharge time increases, the discharge current is significantly smaller. Therefore, the discharge heating power decreases. Combined with the above analysis, the reason for the increase in the discharge heating power is attributed to the elevation in the discharge time, while the reason for the decline in the discharge heating power is the reduction in the discharge current. In addition, when
Rpulse increases, it can be seen from
Table 3 that the charge current increases, and the charge heating power initially rises and subsequently declines. When
Rpulse is 0.85, the charge heating power has the maximum value. In the same way as the analysis of the discharge heating power, the reason for the increase in the charge heating power can be attributed to the elevation in the charge current. The decrease in the charge heating power can be attributed to the reduction in charge time. Finally, the changes in the discharge heating power and the charge heating power together determine the changes in the battery heating power.
Furthermore, the relationship between heating power and frequency and the relationship between heating power and temperature exhibit variability across different
Rpulse values and discharge cutoff voltages.
Figure 9 demonstrates that the area covered in white and red becomes larger as the temperature increases at the same frequency, which shows that the area covered by the high heating power is increasing. Therefore, at the same discharge cut-off voltage and
Rpulse, the battery heating power may become larger with the increase in temperature. This phenomenon can be explained by the variation of battery resistance with temperature. In
Figure 8, the resistance becomes small as the temperature increases. Thus, at the same discharge cut-off voltage, the battery needs a larger current to reach the constraint. From the above analysis, it is clear that the battery heating power is mainly affected by the current. Therefore, the battery heating power becomes large as the current increases. In addition,
Figure A1 shows that the relationship between the maximum heating power and temperature is not certain. For example, at a frequency of 0.5 Hz, the
Rpulse value corresponding to the maximum heating power remains at 0.9 within the temperature range of −15 °C to 0 °C. However, when temperatures are 5 °C and 10 °C, the
Rpulse value associated with the maximum heating power increases to 0.95. Moreover, the maximum heating power gradually increases with rising temperature. Conversely, when the frequency is 100 Hz, the
Rpulse value linked to the maximum heating power tends to decrease with the increase in temperature. The difference in the maximum heating power is not significant. Additionally, the variations of
Rpulse corresponding to the maximum heating power with frequency at the same discharge cut-off voltage are not the same at temperatures of −15 °C and 5 °C. When the temperature is below 0 °C,
Figure 9 demonstrates that the area covered in white and red becomes large as the frequency increases at the same temperature, which shows that the area covered by the high heating power is increasing. However, when the temperature exceeds 0 °C, this phenomenon is not obvious. At the same temperature, the area covered in white and red seems to first diminish and then grow large with increasing frequency. At a frequency of 100 Hz, the region is the smallest and the heating power in this region is significantly small. The reason for the difference can be attributed to variations in battery resistance. For example,
Table 4 demonstrates the parameter variations in Equation (1) with different BPC frequencies at −15 °C and 10 °C when the discharge cut-off voltage is 2.2 V and
Rpulse is 0.85. Both
and
decrease gradually with increasing frequency at −15 °C and 10 °C. However, compared to the results at 10 °C,
and
decrease more significantly at −15 °C, which also leads to a greater increase in discharge and charge currents at −15 °C. Thus, the battery heating power at −15 °C becomes large with the increase in frequency. When the temperature is 10 °C, the increase in discharge and charge currents from 0.5 Hz to 100 Hz is not obvious and
and
decrease, thus causing the battery heating power to reduce. When the frequency is 10,000 Hz,
and
are significantly smaller, which makes a significant increase in the discharge and charge currents. Consequently, the battery heating power becomes large again. Comprehensive analysis of the above shows that, when the temperature is less than 0 °C, because the battery resistance reduces more obviously with the increase in frequency, the battery heating power is mainly dominated by the discharge and charge currents. Therefore, the battery heating power gradually becomes large with the increase in frequency. When the temperature is equal to or greater than 0 °C, as the battery resistance decreases less with the increase of frequency, the battery heating power is dominated by the discharge and charge currents, in conjunction with
and
. Therefore, the battery heating power changes uncertainly with the increase in frequency. In addition, the variation of the maximum heating power with different frequencies is similar to the variation of the maximum heat production power with different temperatures. There is no obvious pattern as can be seen in
Figure A1.
Figure 10 shows the variation of the relationship between
Rpulse and heating power with frequency and temperature at different charge cut-off voltages. The legends in the figure range from 0 W to 130 W. The black areas in the plots indicate that the heating power exceeds the maximum value in the legend.
Figure A2 demonstrates detailed information for each case. In each subplot of
Figure 10 and
Figure A2, the battery heating power at the same
Rpulse increases gradually as the charge cut-off voltage becomes larger. This is similar to the results for the discharge cut-off voltage. A larger charge cut-off voltage needs a higher current to reach the constraint boundary. The heating power will also become larger. Similar to the discharge cut-off voltage, the battery heating power becomes large first and then smaller as
Rpulse increases in most cases under the same charge cut-off voltage. Unlike the discharge cut-off voltage, the large heating power is mainly concentrated in the interval where
Rpulse is small. To illustrate this phenomenon,
Table 5 shows the results for 100 Hz@−5 °C with the charge cut-off voltage of 4.8 V. It can be seen that the battery heating power first increases and then decreases with the increase of
Rpulse, which is the same as the changes of discharge heating power and charge heating power. Moreover, the maximum values of the battery heating power, discharge heating power, and charge heating power correspond to
Rpulse of 0.25, 0.2, and 0.45, respectively. Similar to the analysis of the discharge cut-off voltage, due to the small influence of
and
on the battery heating power, the discussion will exclusively focus on the currents and time of charge and discharge. For the discharge heating power, with the increase of
Rpulse, the variation of the discharge heating power is the same as the variation of the discharge current. Therefore, the change in the discharge heating power is mainly dominated by the discharge current. For the charge heating power, with the increase of
Rpulse, the charge current gradually increases, while the charge time gradually decreases. The initial increase in charge heating power can be attributed to the increase in charge current. As the charge time decreases sharply afterward, the dominant factor of the charge heating power changes from the charge current to the charge time. As a result, the charge heating power becomes small with the increase in
Rpulse.
Similar to the discharge cut-off voltage, the effect of temperature and frequency on the heating power is also diverse. First, it can be seen from
Figure 10 that at the same frequency, the area covered by high heating power becomes larger as the temperature increases. Therefore, at the same charge cut-off voltage and
Rpulse, the battery heating power may become large with the increase in temperature. The reason is the same as that for the discharge cut-off voltage, which is caused by the decrease in battery resistance due to the increase in temperature. When the battery resistance decreases, the current increases at the same charge cut-off voltage. Thus, the battery heating power becomes large. In addition, the relationship between the maximum heating power and temperature is not clear in
Figure A2. For example, at 0.5 Hz, the
Rpulse corresponding to the maximum heating power at the same charge cut-off voltage is 0.1 when the temperature is less than 5 °C. When the temperature is 10 °C, the
Rpulse becomes 0.05 and the maximum heating power becomes larger as the temperature increases. At 10 kHz, the
Rpulse of the maximum heating power at the same charge cut-off voltage becomes larger as the temperature increases. Then, at the same temperature, the result of high heating power distribution with frequency is similar to that of discharge cut-off voltage. When the temperature is less than 0 °C, the region of high heating power distribution increases with frequency. When the temperature is equal to or greater than 0 °C, the region of high heating power distribution decreases and then increases with frequency. To explain this phenomenon,
Table 6 shows the parameter variations in Equation (1) with different BPC frequencies at −15 °C and 10 °C when the charge cut-off voltage is 4.8 V and
Rpulse is 0.2. Whether the temperature is −15 °C or 10 °C, the battery resistance gradually gets small as the frequency increases. However, at −15 °C, the resistance decreases more significantly, which makes the increase in current at −15 °C more pronounced. Therefore, the battery heating power becomes progressively larger with increasing frequency at −15 °C. When the temperature is 10 °C, the current does not increase much from 0.5 Hz to 100 Hz, while the resistance decreases. Therefore, the battery heating power decreases. When the frequency is 10,000 Hz, the current is a little larger. Therefore, the battery heating power becomes large again. Comprehensive analysis of the above shows that at −15 °C, the battery heating power becomes larger with the increase of frequency, which is determined by the current. The change of battery heating power at 10 °C is determined by the current and resistance together. In addition, the variation of the maximum heating power with different frequencies in
Figure A2 is similar to the result of discharge cut-off voltage. Neither of them has a clear pattern.
The variations of the relationship between
Rpulse and heating power with frequency and temperature for different discharge and charge cut-off voltages are analyzed in
Figure 9 and
Figure 10, respectively. However, when the AC heating strategy in practice is designed, the charge and discharge cut-off voltages should be considered simultaneously.
Figure 11 shows the variation of the relationship between
Rpulse and heating power with charge and discharge cut-off voltages at −5 °C and 100 Hz. The curves in the figure represent the maximum heating power that can be achieved at the corresponding charge and discharge cut-off voltages. When both charge and discharge cut-off voltages are considered, the battery heating power is determined by the smaller one. Therefore, the intersection of the heating power curves for the charge and discharge cut-off voltages is the maximum heating power under the constraints of charge and discharge terminal voltages, such as the green dots in
Figure 11. If the value of
Rpulse is smaller than the
Rpulse value of the intersection, the maximum heating power is determined by the discharge cut-off voltage. Conversely, if the value of
Rpulse is larger than the
Rpulse value of the intersection, the maximum heating power is determined by the charge cut-off voltage. The two figures on the right in
Figure 11 demonstrate the influences of the discharge cut-off voltage and the charge cut-off voltage on the position of the intersection, respectively. As the discharge cut-off voltage increases, the intersection gradually shifts towards a larger
Rpulse value. Conversely, as the charge cut-off voltage decreases, the intersection gradually shifts towards a smaller
Rpulse value. Moreover, the heating power corresponding to
Rpulse of 0.5 is not the maximum heating power. For example, when the charge cut-off voltage and the discharge cut-off voltage are 5 V and 3 V, the maximum heating power corresponds to
Rpulse of about 0.8.
The intersection of the heating power curves for the charge and discharge cut-off voltages corresponds to the maximum heating power. Thus, the impact of different frequencies and temperatures on the heating power under the constraints of both charge and discharge cut-off voltage can be assessed through the intersection. In this study, the charge and discharge cut-off voltages of the battery are 4.2 V and 3 V, respectively. Therefore, the maximum heating power at these voltage constraints serves as the basis for analyzing the effects of frequency and temperature, and the results are presented in
Figure 12.
Figure 12a,b depict the variations in maximum heating power with frequency and temperature and the distribution of the corresponding
Rpulse value, respectively. Notably, the maximum heating power increases with temperature for a given frequency. Similarly, at a constant temperature, the maximum heating power exhibits continuous growth with the increase in frequency.
Figure 12b reveals that the value of
Rpulse corresponding to the maximum heating power is predominantly 0.55. The value of
Rpulse corresponding to the maximum heating power is 0.5 only when the frequency is 0.5 Hz and the temperatures are 5 °C and 10 °C.

 ,
, 


