Article

Investigating the Production Atmosphere for Sulfide-Based Electrolyte Layers Regarding Occupational Health and Safety

Electrical Energy Storage Systems, Institute for Photovoltaics, University of Stuttgart, Pfaffenwaldring 47, 70569 Stuttgart, Germany
*
Author to whom correspondence should be addressed.
Batteries 2023, 9(9), 472; https://doi.org/10.3390/batteries9090472
Submission received: 31 August 2023 / Revised: 14 September 2023 / Accepted: 18 September 2023 / Published: 19 September 2023

Abstract

:
In all-solid-state battery (ASSB) research, the importance of sulfide electrolytes is steadily increasing. However, several challenges arise concerning the future mass production of this class of electrolytes. Among others, the high reactivity with atmospheric moisture forming toxic and corrosive hydrogen sulfide (H2S) is a major issue. On a production scale, excessive exposure to H2S leads to serious damage of production workers’ health, so additional occupational health and safety measures are required. This paper investigates the environmental conditions for the commercial fabrication of slurry-based sulfide solid electrolyte layers made of Li3PS4 (LPS) and Li10GeP2S12 (LGPS) for ASSBs. First, the identification of sequential production steps and processing stages in electrolyte layer production is carried out. An experimental setup is used to determine the H2S release of intermediates under different atmospheric conditions in the production chain, representative for the production steps. The H2S release rates obtained on a laboratory scale are then scaled up to mass production dimensions and compared to occupational health and safety limits for protection against H2S. It is shown that, under the assumptions made for the production of a slurry-based electrolyte layer with LPS or LGPS, a dry room with a dew point of τ = 40   C and an air exchange rate of AER = 30   1 h is sufficient to protect production workers from health hazards caused by H2S. However, the synthesis of electrolytes requires an inert gas atmosphere, as the H2S release rates are much higher compared to layer production.

Graphical Abstract

1. Introduction

In the field of all-solid-state batteries (ASSBs), research is currently focusing more and more on sulfide-based electrolytes [1,2,3]. This class of solid electrolytes (SEs) shows a high ionic conductivity of lithium ions (Li+) in the range of κ = 10 3   S cm to κ = 10 2   S cm and mechanical strength [4,5,6,7]. Regarding the transfer from the laboratory scale to the scale of mass production, sulfide electrolytes offer the possibility of being processed into slurry-based form, which allows already established manufacturing technologies for the commercial production of lithium ion cells to be used [8,9,10]. A major challenge in processing sulfides is their high reactivity with water, forming toxic and corrosive hydrogen sulfide (H2S) [11,12]. This affects not only product quality and chemical resistance of the production equipment, but also the occupational safety of the employees in production. However, the laboratory scale processing of sulfide electrolytes usually takes place in an argon-filled glove box with oxygen and water concentrations below 0.5 ppm. An argon (Ar) atmosphere is hardly to imagine on a production scale due to financial reasons. As with commercial lithium ion cell manufacturing, dry room production would be advantageous. However, for ASSBs with sulfide electrolytes, occupational exposure limits must be complied with and the decomposition of the materials by the reaction with the smallest amounts of atmospheric water must also be prevented.
In this paper, the individual processing steps of a sulfide ASSB will be considered with respect to H2S release during production. The aim is to investigate whether the atmospheric conditions of commercial lithium ion cell manufacturing are sufficient for solid-state cells with sulfide electrolyte or whether more stringent requirements have to be placed on the production environments. The focus is on compliance with occupational health and safety limits; effects on product quality play a minor role in this article. For the investigations, an experimental setup is designed for measuring H2S concentrations under well defined conditions. Subsequently, the obtained measurement data are scaled up to a commercial production level.
The following subsections serve to describe the production steps in detail, and provide further information about the formation of H2S and its impact on human health.

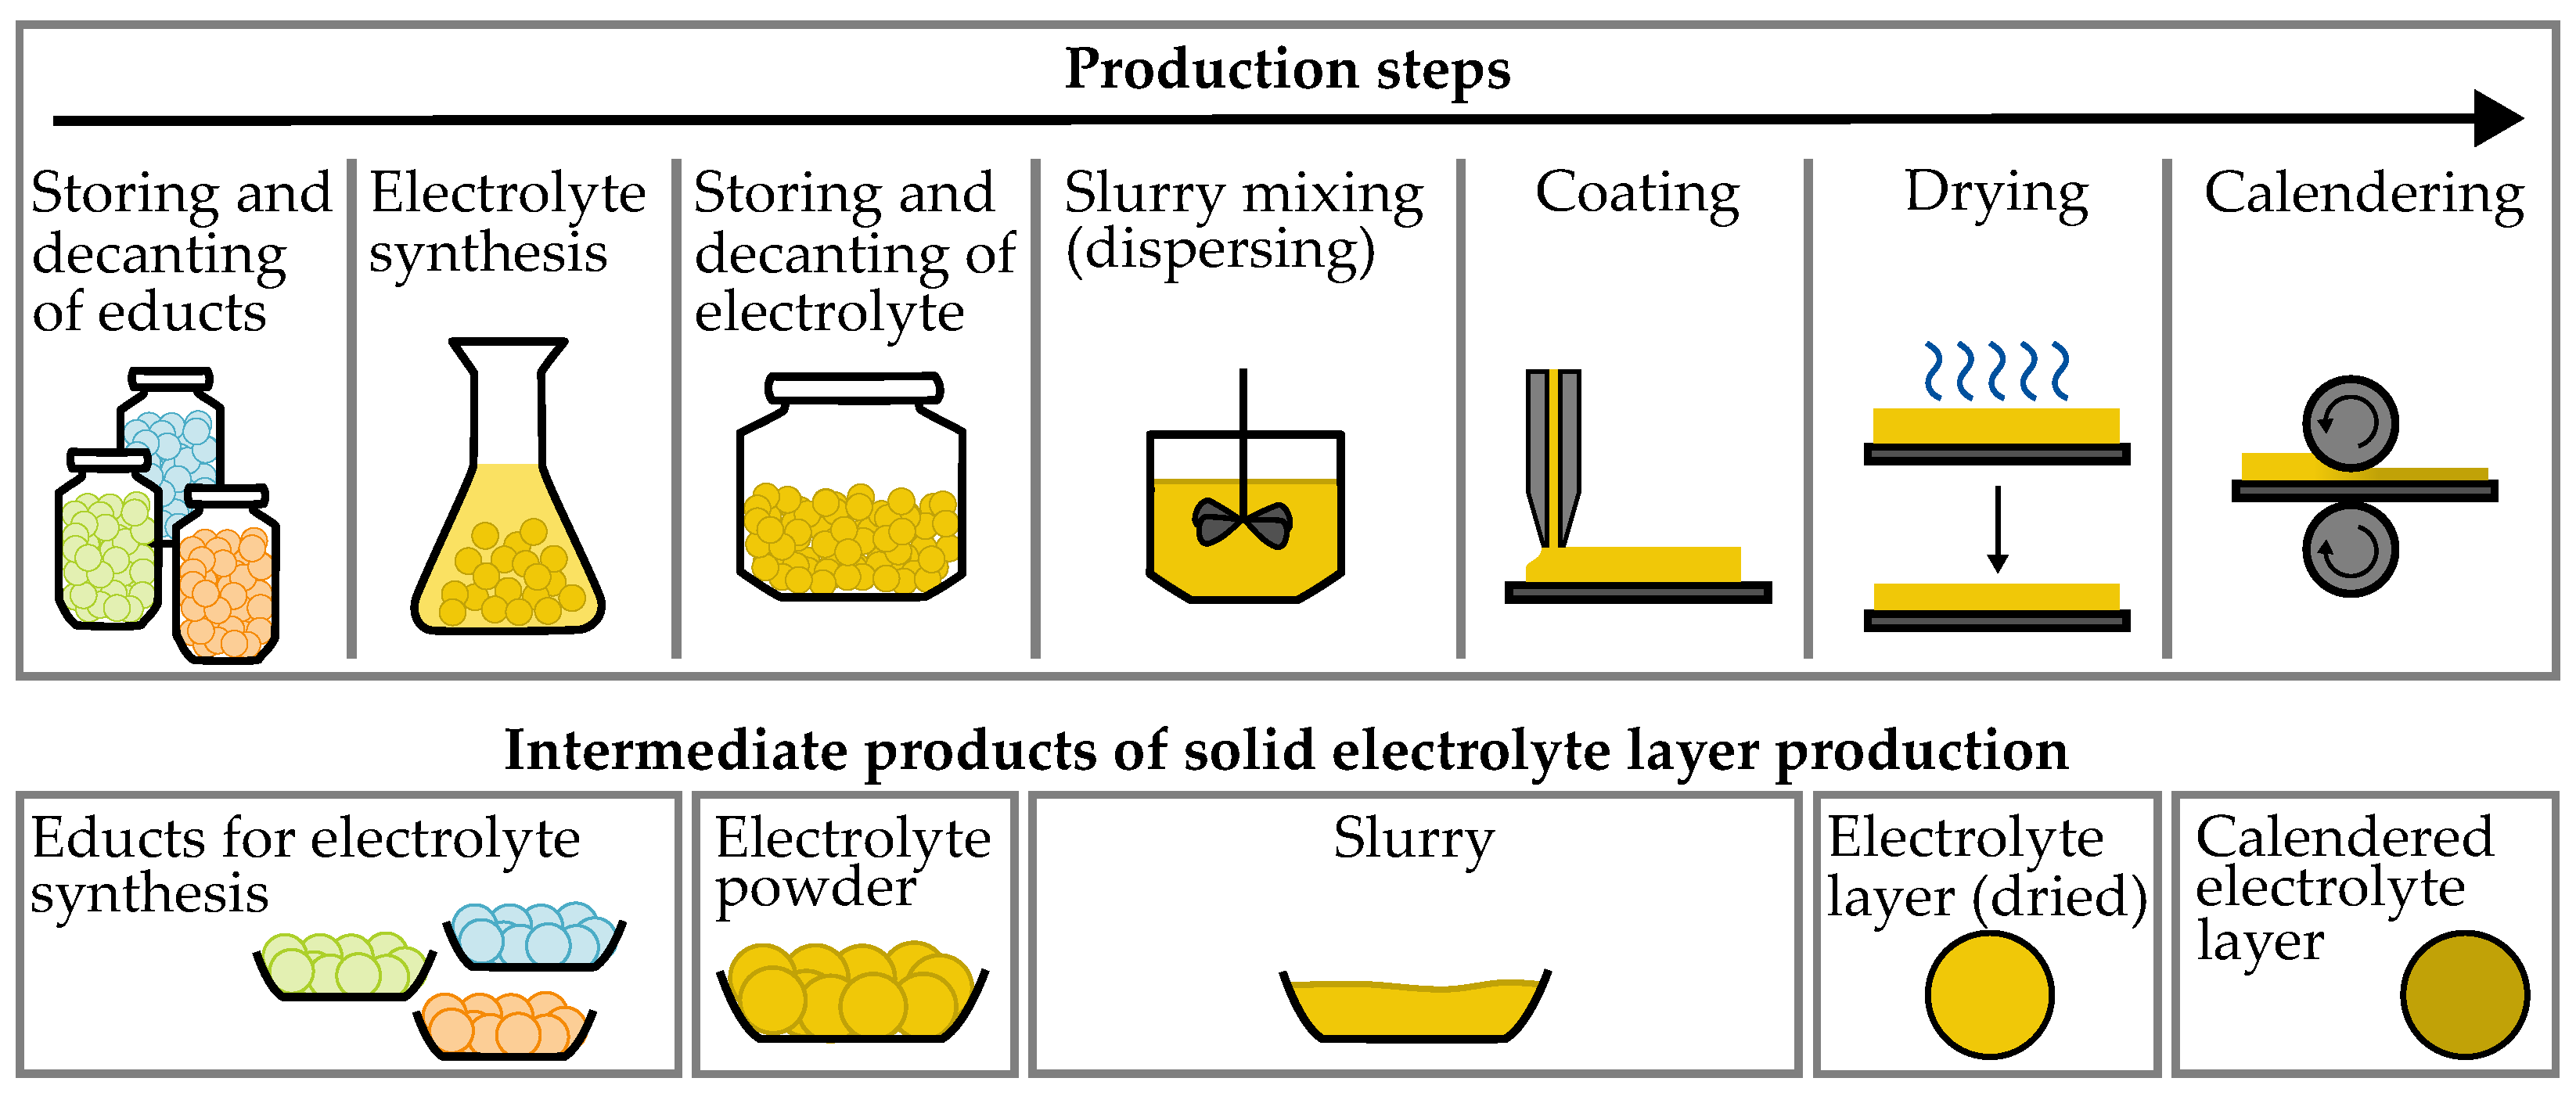
1.1. Production Process

The fabrication of a solid electrolyte layer, which is slurry-based, is considered, as the H2S release of this cell component can be assumed to be maximum. The slurry-based processing of sulfide electrolyte powder allows the use of existing technologies from the commercial production of lithium ion cells. Figure 1 shows the single steps and intermediate products for the production of a slurry-based solid electrolyte layer, starting with precursors for the electrolyte synthesis in the upper left corner of the figure to the final calendering step on the right. Depending on the type of sulfide electrolyte, typical educts are, for example, lithium sulfide (Li2S), phosphorus pentasulfide (P2S5) and germanium disulfide (GeS2) [13,14,15]. These educts are usually available in powdered form and also stored in this way. Sulfide electrolytes are mostly synthesized in a liquid phase reaction or by a mechanochemical milling process followed by heat treatment [16,17,18]. Depending on the desired particle size, an additional milling process can be carried out.
After being synthesized, the electrolyte is stored as a powder in large containers prior to further processing. The next step is to prepare the coating paste. For this, the components, such as electrolyte powder, solvent and pre-prepared binder solution, must be weighed in the correct ratio and mixed in order to obtain a homogeneous dispersion. To break up agglomerates by high shear rates, a high performance mixer is required. After preparation, the electrolyte slurry is applied on a carrier substrate by a coating process such as screen printing or by slot-die coating. In a subsequent drying step, the evaporation of the solvent takes place in order to obtain a dry electrolyte layer. The final processing step is the compaction of this layer, which is usually performed by calendering. In this technique, the dried layer is transported through rotating cylinders, which compress the layer by pressure and improve adhesion to the substrate. The presented production process is based on the publications of Schnell et al. [10] and Singer et al. [8,19], which were supplemented by our own considerations.
The lower part of Figure 1 shows materials and intermediate products generated during the production process, which can release H2S. These are the educts of the electrolyte synthesis, the solid electrolyte powder, the slurry with solid electrolyte, the dried solid electrolyte layer, as well as the calendered solid electrolyte layer. Based on these materials, the formation of hydrogen sulfide during the production of sulfide solid electrolyte layers shall be studied. The sulfide electrolytes lithium phosphorus sulfide (LPS) as β -Li3PS4 structure, and lithium germanium phosphorus sulfide Li10GeP2S12 (LGPS), as well as their starting materials, are available for these investigations. According to the production steps in Figure 1 a slurry-based electrolyte layer is produced and the intermediate products are exposed to air with a defined water content in order to analyze their H2S release.

1.2. Production Atmosphere

Humidity describes the water content in ambient air, whereby exceeding the saturation limit leads to condensation. The absolute humidity of f abs
f abs = m water V air
indicates the amount of water vapor m water related to the total air volume V air [20]. The value for the relative humidity f rel is given by
f rel = f abs f max   ·   100 %
where f max is the maximum possible moisture at a certain air temperature and pressure [21]. If the relative humidity (RH) is f rel = 100 % , the corresponding temperature value ϑ is called the dew point temperature τ . It defines the temperature to which humid air needs to be cooled to in order to achieve f rel = 100 % at constant pressure. Cooling the air further, the contained water vapor condenses. Converting f rel into τ is quite complex; however, an approximation is derived by Lawrence [22] with the mathematical expression
τ = B 1 l n ( f rel 100 % + A 1 ϑ B 1 + ϑ ) A 1 l n ( f rel 100 % ) A 1 ϑ B 1 + ϑ
where ϑ is the temperature in °C. For the coefficients A 1 and B 1 , recommended values are A 1 = 17.625 and B 1 = 243.04   C [22]. The results for dew point calculation with these parameter values lead, according to Lawrence [22], to a relative error of <0.4% in a temperature range of 40   C ϑ 50   C .
The commercial production of lithium ion cells takes place in dry rooms with a dew point temperature between τ = 60   C and τ = 40   C [23]. The production machines are positioned directly in the dry room, easily accessible for the production staff. This area is accessed via an airlock, where protective clothing must be worn [19]. The internationally valid standard DIN EN ISO 14644 specifies the processes in cleanrooms, focusing on airborne particles [24]. Classification is based on the quantity and size of particles. Dry rooms form a subgroup of clean rooms. The main focus here is on dew point control, with particulate air purity playing a secondary role [25]. In a dry room, air volume flows, air exchange rates, temperature, and humidity are important operating parameters. The humidity to be controlled has a significant impact on the operating and energy costs of the room. Ahmed et al. [26] show that, if the relative humidity is for example reduced from f rel = 50 % to f rel = 10 % , costs can increase by a factor of about five.
If dry rooms are not suitable for manufacturing solid sulfide electrolyte layers, the production must be carried out in an inert gas atmosphere such as argon or nitrogen [10]. Duffner et al. [27] compared, in their publication, the investment and resource costs for a dry room and glove box-like argon environment. It turns out that the operating costs per day and cubic meter are almost 600 times higher for argon. Using a nitrogen atmosphere reduces the cost for the inert gases without the infrastructure by a factor of 14 [28].
The financial aspects lead to the conclusion that it is important to investigate and define the production atmospheres for the individual production steps of ASSBs in detail. The environment should be as dry as possible, but also only as dry as necessary to keep costs and energy consumption low.

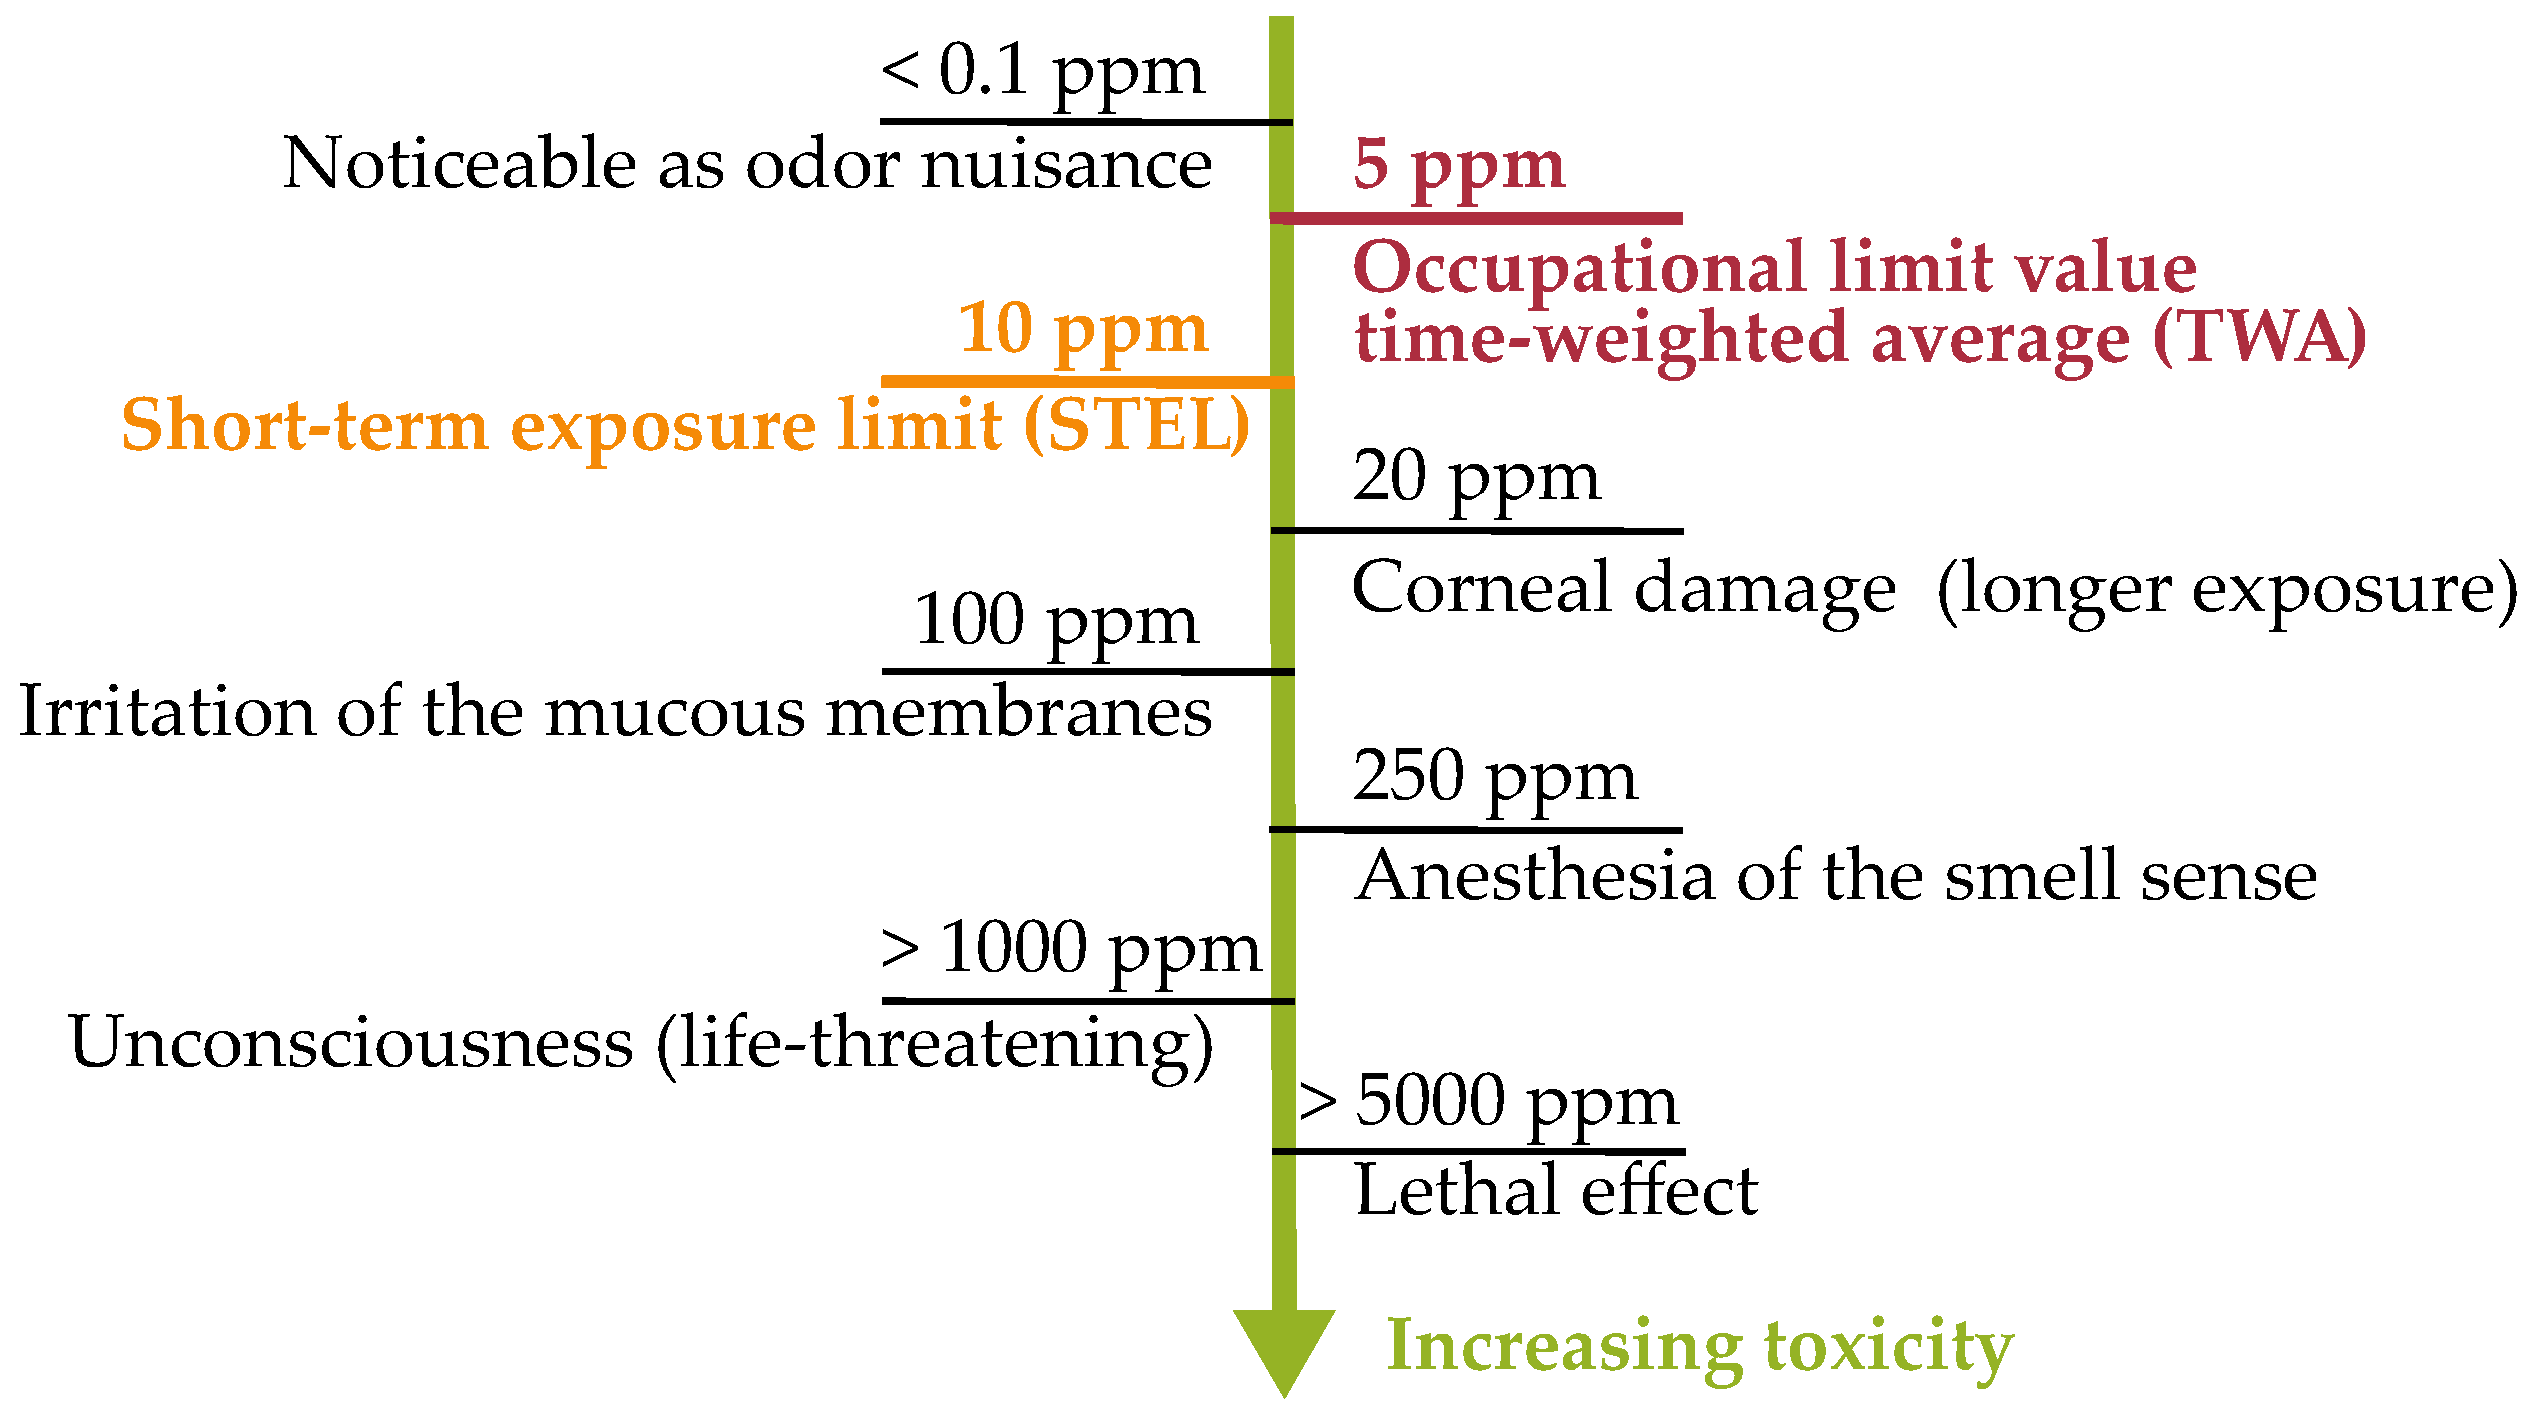
1.3. Hydrogen Sulfide—Toxicology, Health and Safety Regulations and Formation

Hydrogen sulfide is a toxic, colorless, and very foul-smelling gas. It occurs naturally in geological deposits and is also produced by various industrial processes. H2S has a boiling point of ϑ = 60.2   C at ambient pressure and is with a molar weight of M H 2 S = 34.08 g mol slightly denser than air. Due to its flammability, it forms an explosive mixture with air. Hydrogen sulfide is an acute health hazard and also classified as a water-hazardous substance [29,30].
In the human organism, strongly irritating alkali sulfides are formed when H2S comes into contact with body fluids, for example, on eyes or mucous membranes. However, inhalation is the most important route of exposure. By destroying the red blood pigment hemoglobin, H2S impairs the intracellular respiration. Figure 2 lists the effects on the human body by increasing the H2S concentration c H 2 S in parts per million (ppm). Below c H 2 S < 0.1   ppm H2S is noticeable and causes an odor nuisance. In case of longer exposure time at c H 2 S = 20   ppm , a damage of the cornea of the eyes occurs. If the concentration continues to increase, the irritation of the mucous membranes starts at about c H 2 S = 100   ppm . Anesthesia of one’s senses of smell begins to occur above c H 2 S = 250   ppm . If the H2S concentration exceeds c H 2 S > 1000   ppm , one falls unconsciousness within a few minutes followed by a lethal effect above c H 2 S = 5000   ppm [30,31,32].
Additionally, the occupational limit values are marked in Figure 2. At this point, it must be mentioned that the permissible H2S concentrations at the workplaces partly vary between individual countries. A technical article by Drägerwerk AG and Co. KGaA (Lübeck, Germany) ([33]) provides an overview of various region-dependent limit values. Basically, a distinction is made between a time-weighted average (TWA) for a long-term period of t = 8   h to t = 10   h and a short-term exposure limit (STEL) for a time span of t = 10   min to t = 15   min . In Germany and the United Kingdom, a H2S concentration of c TWA = 5   ppm is defined as TWA. Short-term exposure limits start at c STEL = 10   ppm for usually t = 15   min depending on national regulations [33].
After considering the permissible limits, the H2S release of sulfide electrolytes is discussed in more detail. Sulfide electrolytes, such as LPS and LGPS, decompose in contact with humid air under the formation of H2S. The chemical reaction of LPS and water (H2O) takes place according to Equation Li3PS4 + 4 H2O → Li3PO4 + 4 H2S [34]. The scheme Li10GeP2S12 + 12 H2O → Li10GeP2O12 + 12 H2S describes the degradation of LGPS exposed to moisture forming Li10GeP2O12 and H2S [35]. Like the solid electrolytes themselves, the educts or precursors for their synthesis also tend to release hydrogen sulfide. For the production of LPS, lithium sulfide (Li2S) and phosphorus pentasulfide (P2S5) are used [13,14]. The decomposition process of Li2S is mentioned in [36] with the chemical equation Li2S + 2H2O → 2 LiOH + H2S. The reaction for P2S5 with water is similar: P2S5 + 8 H2O → 2 H3PO4 + 5 H2S [37]. The synthesis of LGPS additionally requires germanium disulfide (GeS2) [18]. To the best of our knowledge, not much can be found in the literature on its H2S release. A possible hydrolysis reaction GeS2 + H2O → GeO2 + H2S forms germanium oxide (GeO2) as well as hydrogen sulfide [38,39].
In the literature, many publications investigate the H2S formation of different electrolytes. It can be seen that the amount of hydrogen sulfide released, and consequently, the electrolytes’ air stability, is strongly dependent on the type of sulfide electrolyte [40,41,42]. For example, Kimura et al. [43] induces Li4SnS4, which shows a “suppressed evolution of H2S”. In contrast, the pure Li3PS4 shows high moisture sensitivity [44]. Also, particle sizes and surface properties influence the hydrolysis behavior [12]. Furthermore, a significant decrease in ionic conductivity and morphological changes, due to decomposition, are observed [45,46,47]. To the best of our knowledge, the H2S release from sulfide electrolytes with respect to occupational health and safety was studied sparsely. Singer et al. [12] deals with this issue based on Li6PS5Cl, showing that, for this type of electrolyte, a minimum dew point of τ = 40   C is required to ensure the employees’ safety.

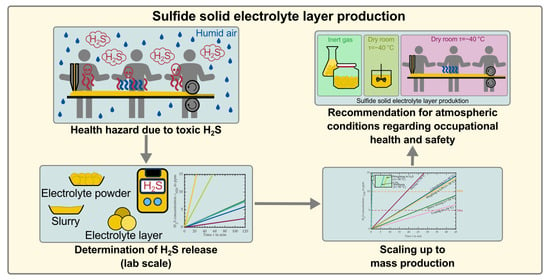
1.4. Aim of This Study

The previous subsections show the production process of a slurry-based solid electrolyte layer containing sulfides, the H2S formation of sulfides electrolytes in humid air, as well as the effects on human health by exposition to H2S. In order to protect staff from harmful health effects, occupational health and safety limits must also be complied with in the production of sulfide solid electrolyte layers. Consequently, H2S release must be minimized, which requires production in a very dry environment, such as a dry room. However, for cost reasons, it is reasonable to design the atmosphere only as dry as necessary and, for example, to define different conditions in mini-environments for the individual production steps. Therefore, the H2S formation at varying humidity values from precursors of the electrolyte layer and the electrolyte layer itself, representative for the individual production steps, will be investigated in this paper. Focusing on the compliance with occupational limit values, the aim of this study is to propose environmental conditions for every single manufacturing step of the production of a slurry-based sulfide electrolyte layer, based on LPS and LGPS. For these investigations, an experimental setup is designed to measure H2S concentrations released from samples containing LPS and LGPS, such as powders, slurries, and dry and calendered electrolyte layers. By upscaling the obtained data from the laboratory scale to that of mass production, the results can be compared to occupational limit values and finally, the conclusion outlines the requirements for the atmospheric conditions of the individual production steps.

2. Experimental

The production of the sulfide-based electrolyte layer was performed in an argon-filled glove box (LABstar by MBraun, Garching, Germany). All solid materials were dried in a vacuum oven (B-580 by BÜCHI Labortechnik GmbH, Essen, Germany) for at least t dry = 16   h before processing. Solvents are dried with the help of molecular sieves with a pore size of p = 3   Å , which is activated by an elevated temperature ( ϑ = 300   C ) under vacuum.

2.1. Materials

For the measurements of the H2S release of the different processing stages in the production of solid electrolyte layers, the educts are needed at first. The starting materials Li2S, P2S5, and GeS2 are purchased from Sigma-Aldrich Chemie GmbH (Darmstadt, Germany), on the basis of which IoLiTec Ionic Liquids Technologies GmbH (Heilbronn, Germany) synthesizes and provides the sulfide electrolytes LPS and LGPS in powdered form. The production process of the electrolyte layer is analogous to our previous paper [48]. For producing slurry, the binder hydrogenated nitrile-butadiene rubber (HNBR) from ARLANXEO Holding B.V. (The Hague, The Netherlands) and the solvent p-xylene (PX) from Supelco Sigma-Aldrich Chemie GmbH (Darmstadt, Germany) are used. In order to obtain a binder solution with ω binder = 5   wt . % , HNBR is dissolved in p-xylene. Subsequently, solid electrolyte powder, p-xylene, and binder solution are mixed in a ratio of SE:HNBR:PX = 19:1:20 in a planetary mixer Thinky ARE-250 (C3 Prozess- und Analysentechnik GmbH, Haar, Germany). For the mixing process, the slurry with a solid content of ω = 50   wt . % is taken out of the glove box in a sealed container. Coating the electrolyte layer is performed using a doctor blade (PG-031-150, Thierry GmbH, Stuttgart, Germany) with a gap height of h = 400   μ m . A 1.4310 stainless steel foil (H&S Präzisionsfolien, Vohenstrauss, Germany) with a thickness of h SST = 10   μ m serves as carrier substrate. The dried layer’s composition is ω SE = 95   wt . % sulfide electrolyte and ω HNBR = 5   wt . % HNBR. In the next step, the samples of the electrolyte layer with a diameter of d SE = 17.5   mm are punched out and dried overnight under vacuum in order evaporate remaining solvent. A hydraulic press (YLJ-15L by MTI Corporation, Richmond, CA, USA) functions as a representative of a calender used to compact the SE coins with a pressure of p = 200   bar .

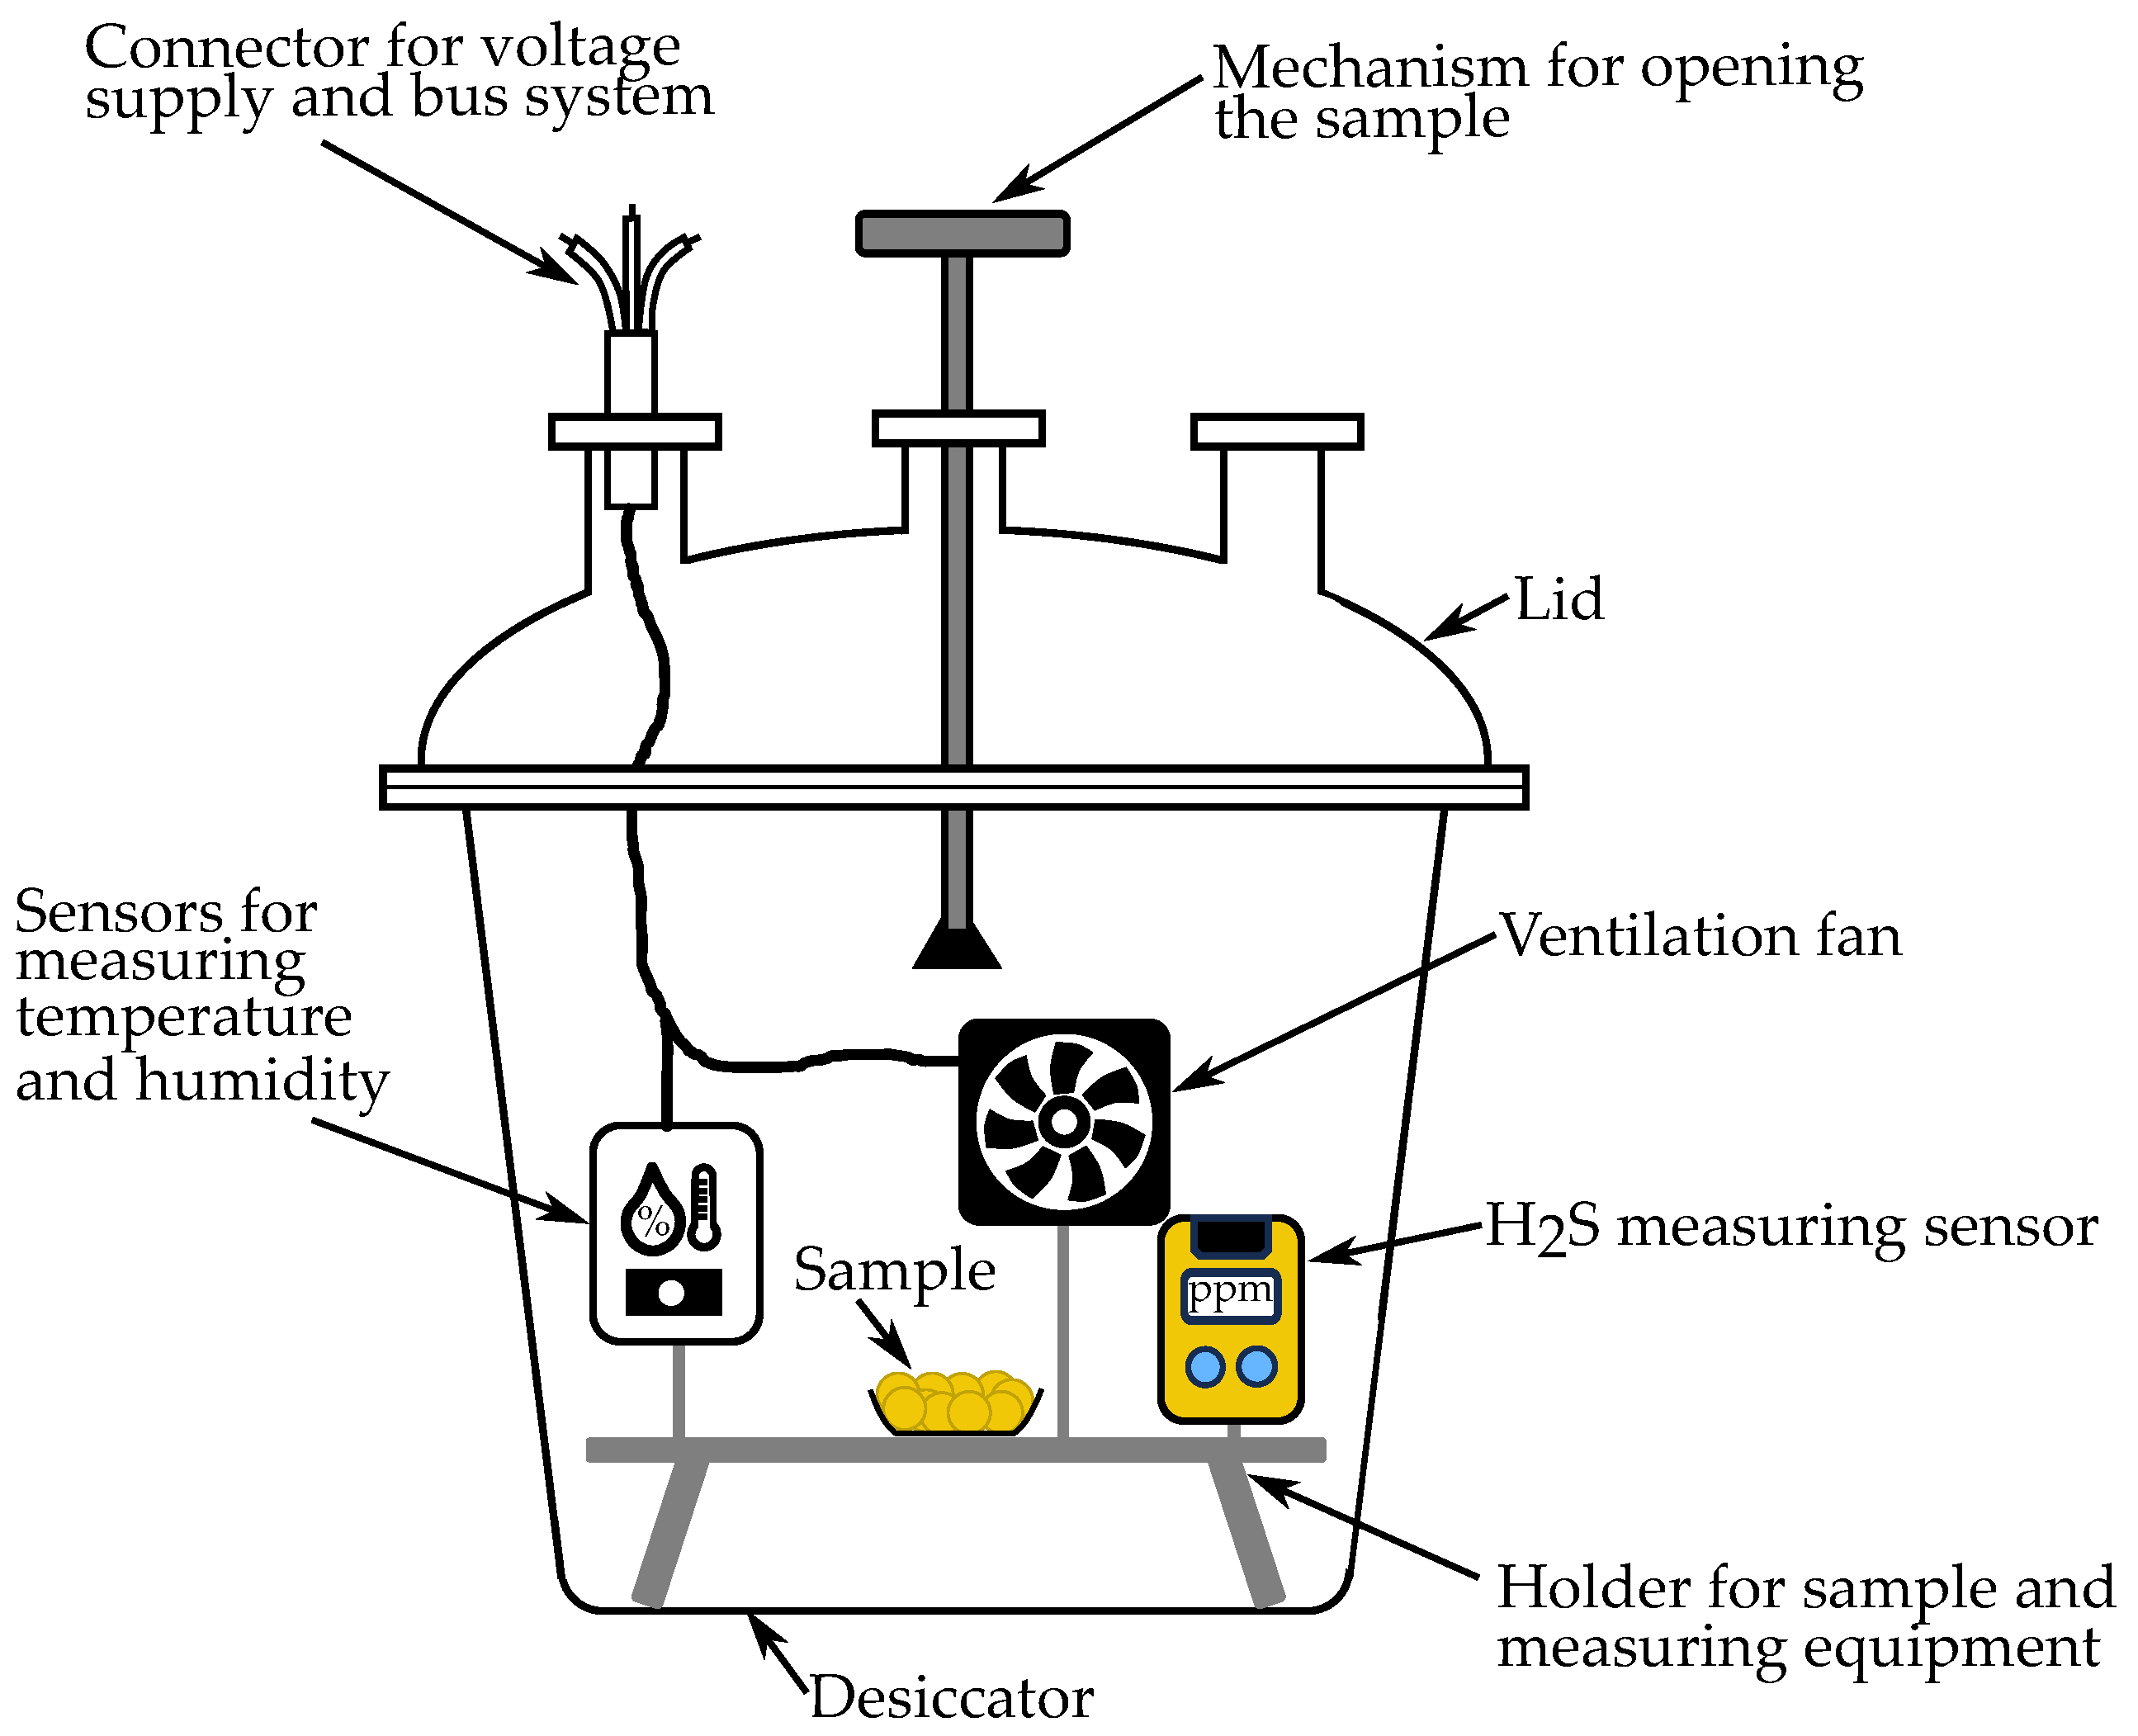
2.2. Experimental Setup

The test setup is placed in a DURAN® glass desiccator of DN 150 type (DWK Life Sciences, Wertheim, Germany) which is hermetically sealed with a flat flange cover consisting of three necks. It has a nominal volume of V nominal = 3000   mL and an experimentally determined effective volume of V exp = 5500   mL . Figure 3 illustrates the desiccator with the device used for measuring the H2S release of samples inside. The test setup comprises a 3D-printed holder that fixes the sample for testing and to which the sensors and actuators are affixed. For measuring the concentration of H2S, a Pac® 6500 gas detector manufactured by Dräger Safety AG & Co. KGaA (Lübeck, Germany) was used. The measurement range extends from c H 2 S , min = 0.4   ppm to c H 2 S , max = 100   ppm , with a resolution of c H 2 S , res = 0.1   ppm [49]. A Sensirion SHT45 sensor (Stäfa, Switzerland) records temperature and humidity levels within the desiccator to determine the dew point. The humidity can be measured from f rel , min = 0 % to f rel , max = 100 % with a resolution of f rel , res = ± 1 % , and temperature is measured with a resolution of ϑ res = ± 0.1   C [50]. The measured values are retrieved through an I 2 C bus system utilizing a microcontroller. For an even gas distribution, an electric fan ( U = 12   V ) creates artificial air circulation to prevent H2S accumulation above the sample. Additionally, the elevated sample holder further enhances this effect. For the experiment’s execution, an additional mechanism is integrated with a rod that protrudes outward through a neck on the lid. This allows the sealed sample to be opened from the outside through a rotary movement without disrupting the inner atmosphere once the desired dew point is set.
The experimental setup is located in a climate-controlled chamber (KMF 720 by BINDER GmbH, Tuttlingen, Germany). It is used to set a permanent temperature of ϑ = 25   C at a relative humidity of f rel = 10 % . Thereby, this also ensures that the components do not accumulate moisture from the environment during the inactive periods. For the respective gas release studies, relative humidity values lower than f rel = 10 % are required for the dew point temperatures needed. For this purpose, a molecular sieve with a pore size of p = 3   Å (Type 562 C by Carl Roth GmbH + Co. KG, Karlsruhe, Germany) is placed inside the desiccator through the unused neck of the lid. Once the desired dew point temperature has been reached, the molecular sieve is removed and the desiccator is sealed tightly. Due to the accuracy and resolution of the temperature and humidity measurements, this procedure achieves a minimum dew point temperature of τ min = 54   C . It is not feasible to establish a lower dew point using this method.
The experimental procedure includes four steps. (1) Sample preparation: the sample to be tested (powder, slurry, layers, calendered layers) is prepared in the argon-filled glove box and filled into a round 3D-printed dish with a surface area of A sample = 2.40   cm 2 . In general, m p = 100   mg of powder, m s = 500   mg of slurry and circular electrolyte layers with a diameter of d SE = 17.5   mm are required to cover the entire surface of the dish. This, in turn, is placed in an upside down cryogenic box (ROTILABO 10 mL, Carl Roth GmbH + Co. KG, Karlsruhe, Germany) and then sealed airtight. Next, the sealed sample is taken out of the glove box and placed in the desiccator in the climatic chamber. (2) Setting the test conditions: once the climatic chamber reaches the minimum humidity level, the relative humidity inside the desiccator is reduced using the molecular sieve as described before. (3) The determination of H2S release: the sample is opened via the mechanism depicted, thus initiating the test period. For this study, the maximum exposure time is set to t exposure = 30   min . (4) Post-processing: At the end of the designated testing period, the sample is resealed and properly disposed of. The desiccator is then flushed with nitrogen to prevent any impact on future experiments.
After evaluating the sensor data, the measured data within t exposure = 30   min are presented as H2S concentration c H 2 S over time t. To extrapolate these data to a longer time period, the measured values are linearly interpolated. This is feasible since the release of hydrogen sulfide is linear during the analyzed exposure period. The slope of the linear interpolation corresponds to the release rate R exp , ppm , indicating the H2S release in ppm per minute. With this release rate, it is possible to scale up the laboratory scale experiment to larger scales.

2.3. Upscaling from Laboratory to Mass Production Scale

In order to compare the data obtained in the experimental setup with occupational health and safety limits, data must be scaled to a production environment. For this purpose, the individual production steps are considered in more detail and dimensions for workplaces and machines are assumed. A schematic representation of the production steps with workers is shown in Figure 4. Red boxes symbolize the air volume in which the employee is located during a production step and in which H2S can be directly released. The orange boxes assume that this process is fully automated in a closed area or container. Only in exceptional cases, for example, when a housing cover has to be opened, the employee may come into contact with H2S. Step (a) is the manual weighing in and decanting of educts for the electrolyte synthesis. The synthesis in step (b) is assumed to be fully automated. The filling of the container, as well as the subsequent synthesis and cleaning, takes place in a closed cabinet. Subsequently, the finished electrolyte is stored in tightly sealed drums until it needs to be weighed in and decanted for slurry production, as can be seen in (c). The mixing of the slurry, as well as the cleaning of the mixer, is again assumed to be fully automated. In step (d), a carrier substrate is coated with the coating paste. Employees can be right next to the coating line at all times for visual inspections. Drying (e) takes place in a closed drying oven, with the coated film moving through it and coming out fully dried at the end. The last step, calendering (g), takes place in an open space, with employees performing quality checks directly at the electrolyte layer.
For every production step, assumptions are made for the following calculations, which are listed in Table 1. First, for each step, the area A product is defined at which sulfide electrolyte can come into contact with ambient air in the process. These are, for example, the opening diameter of drums, coating widths and lengths. Subsequently, a working area with height h, width w, and length l is defined, which results in the air volume V work in which employees can be located around the machines in the respective process step.
For scaling up data determined in the experimental setup in Section 2.2, the release rate R exp , ppm is converted into the release rate R pro , ppm of every production step by introducing the ratios of areas and volumes
R pro , ppm = R exp , ppm   ·   A product A sample   ·   V exp V work                         [ R pro , ppm ] = 1   ppm min
where V exp is the volume and A sample is the sample area of the experimental setup. The area A product and air volume V work refer to the assumed dimensions for scaling up data determined on a laboratory scale to a mass production scale. The current H2S concentration c H 2 S ( t ) in the air volume V work is then calculated by
c H 2 S ( t ) = R pro , ppm   ·   t                         [ c H 2 S ( t ) ] = 1   ppm
It is assumed that the amount of H2S released remains in the air volume and increases in concentration. If a constant air exchange rate (AER) in 1 h is considered, which is common in a dry room, it must be added to the formula. The concentration c w / AER in ppm
c w / AER ( t ) = c w / AER ( t 1 ) + R pro , ppm   ·   Δ t c ex ( t )             [ c w / AER ( t ) ] = 1   ppm
with     c ex ( t ) = [ c w / AER ( t 1 ) + R pro , ppm   ·   Δ t ]   ·   AER   ·   Δ t
is obtained recursively. The release rate R pro , ppm is multiplied with the time difference Δ t to the previous time step. The expression c ex ( t ) specifies the amount of H2S extracted, c w / AER ( t 1 ) stands for the concentration determined in the previous step ( t 1 ) . Subsequently, based on both formulas for concentration, time t until the limit values TWA and STEL are exceeded is calculated. If the determined times are longer than that permitted by law, stricter occupational safety measures must be implemented in this production step.

3. Results and Discussion

The presentation and discussion of the results start with the laboratory-scale data obtained from the experimental setup. Afterwards, they are scaled up to the production scale and checked against occupational health and safety limits.

3.1. Hydrogen Sulfide Release of Intermediate Products

The following subsections present the H2S release of various intermediates in solid electrolyte layer production. This is started in detail with the study of powdered reactants for electrolyte production, followed by the electrolyte powder LPS, and slurry and layers produced from it. Subsequently, the results with LGPS electrolyte will be discussed.

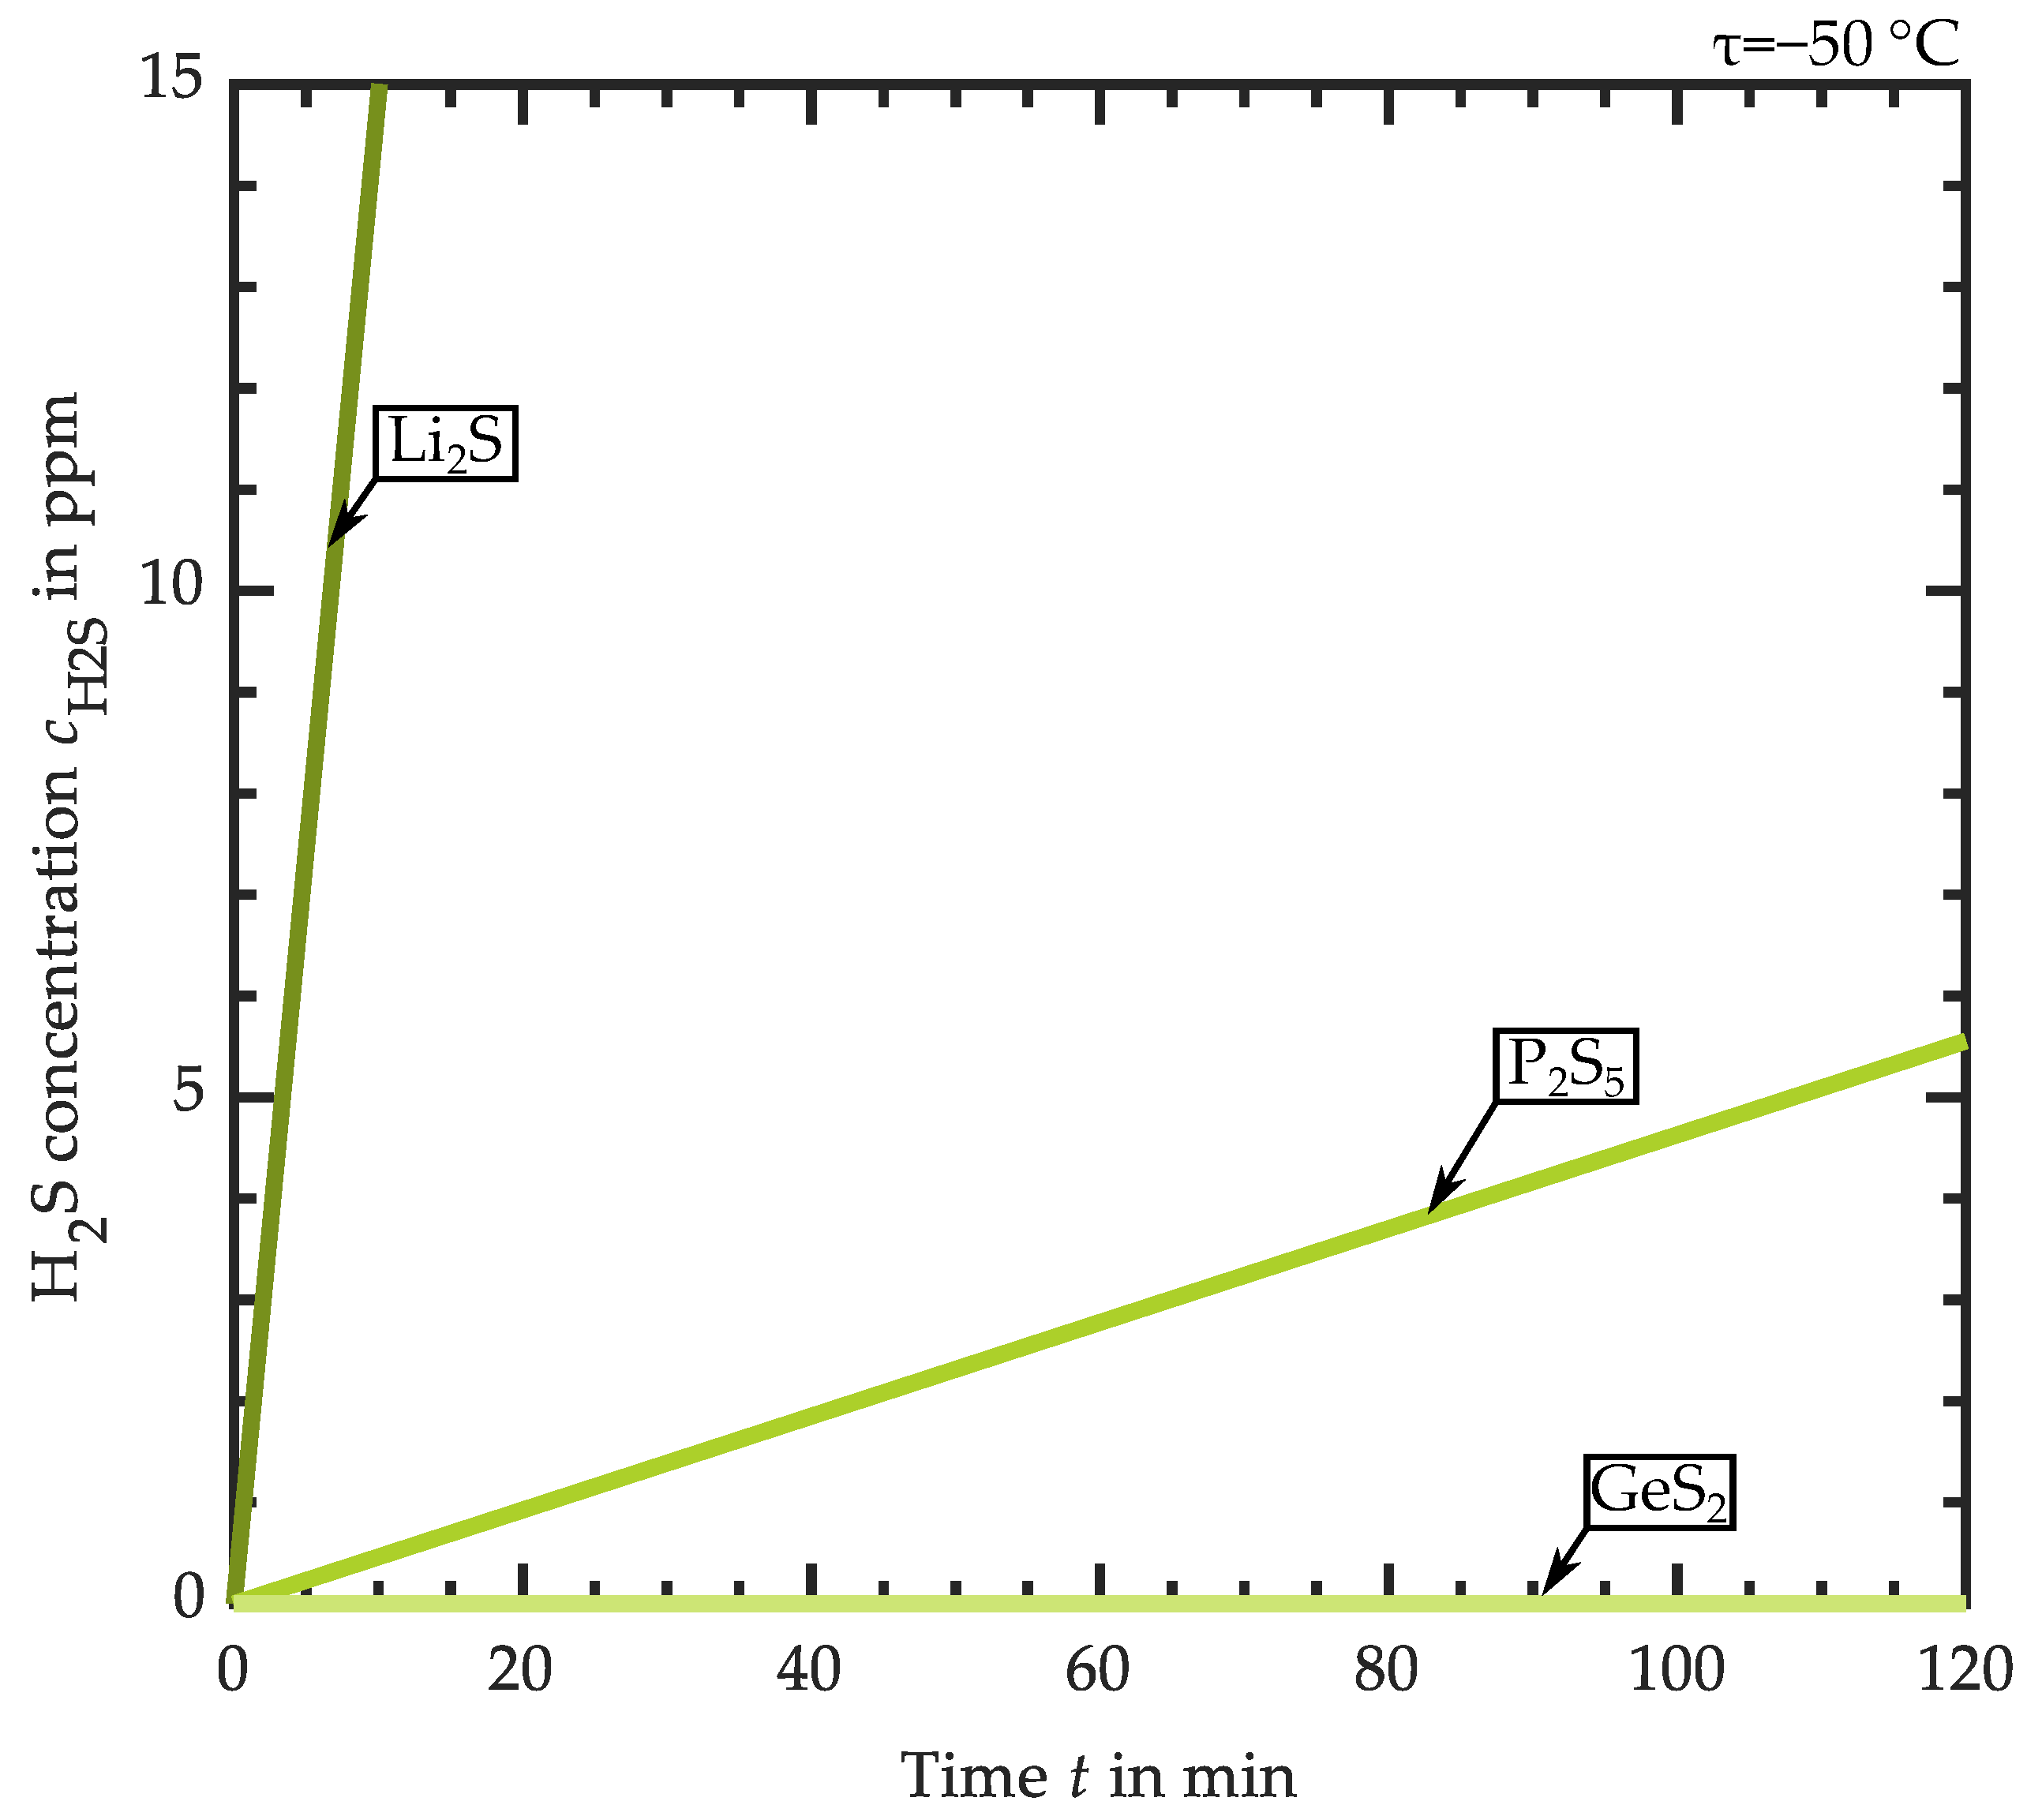
3.1.1. H2S Release of Educts for Electrolyte Synthesis

Figure 5 shows the results of the H2S release of educts for electrolyte synthesis at a dew point of τ = 50   C . The H2S concentration is plotted against time. In this comparison, lithium sulfide Li2S (dark green) has the highest release rate of R exp , ppm = 1.4887   ppm min . With R exp , ppm = 0.0463   ppm min , the release rate is lower for P2S5, as depicted in green. The experiment with germanium disulfide GeS2 (light green), which is needed for LGPS synthesis, shows no measurable amount of H2S during the observation period. Since the release of Li2S is already very high at a dew point of τ = 50   C , which corresponds to a relative humidity of f rel = 0.1 % , experiments at higher humidity are not performed.

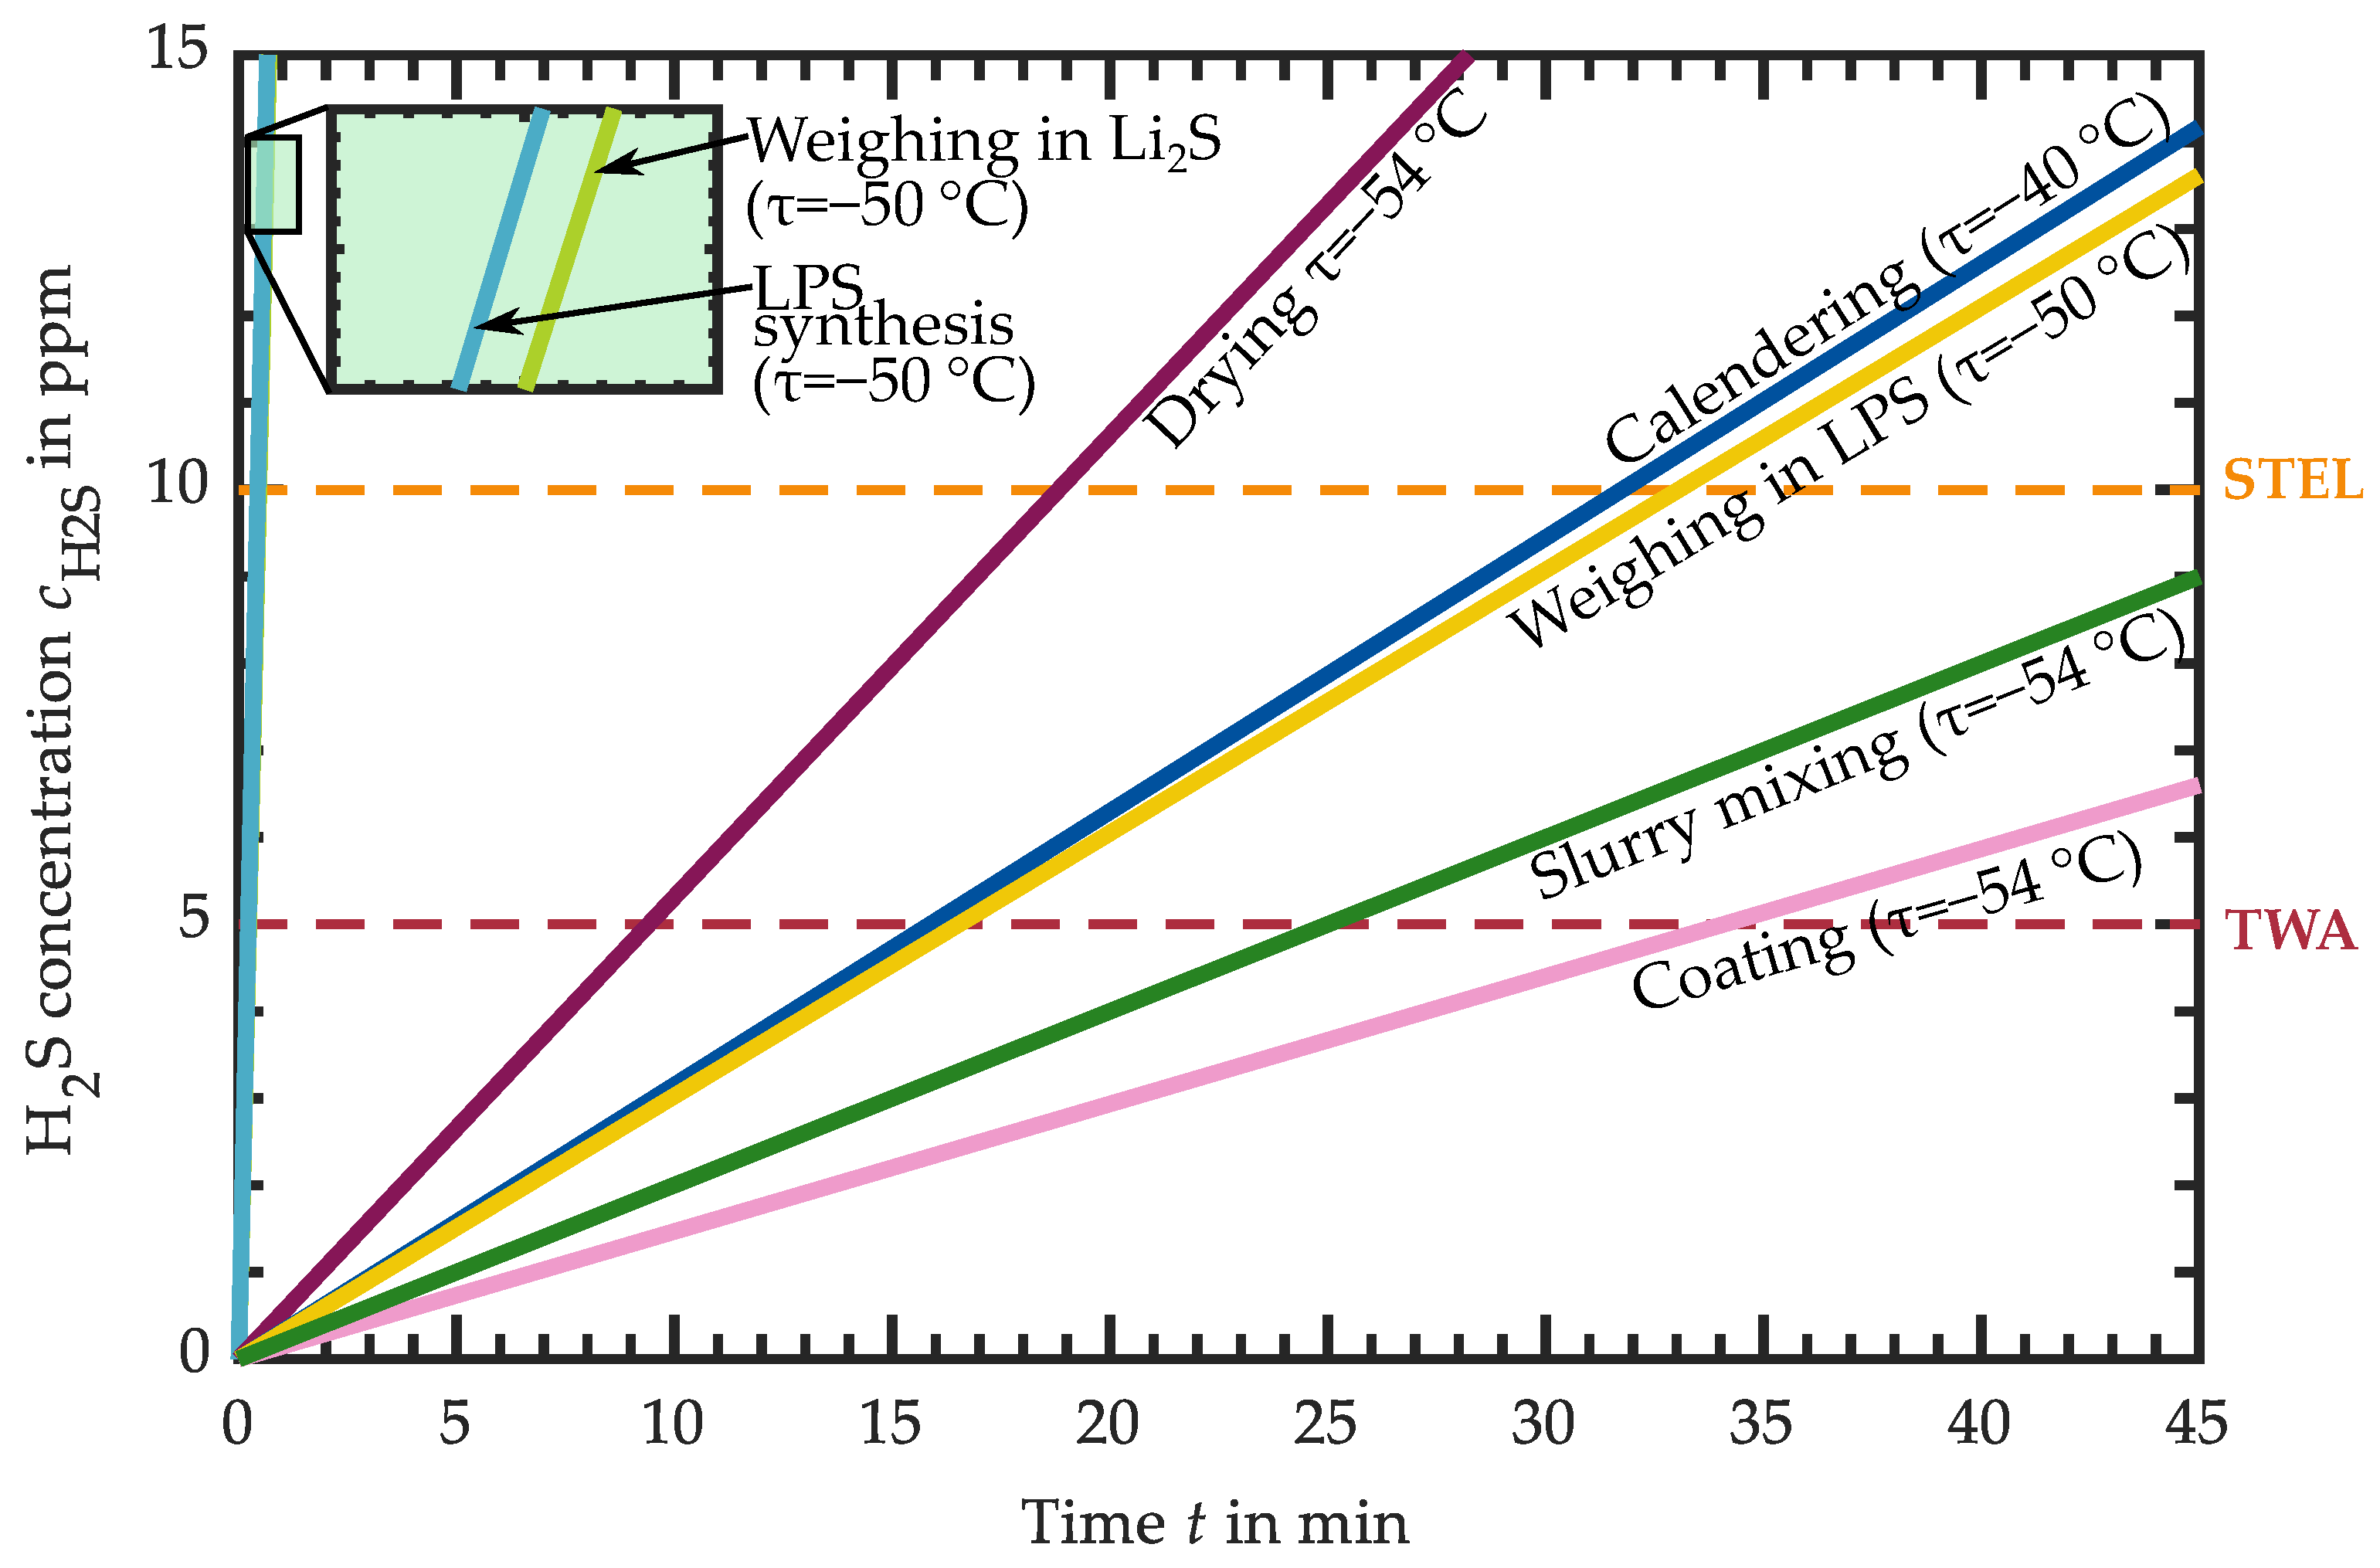
3.1.2. H2S Release of LPS Electrolyte

In Figure 6a, LPS electrolyte powder samples are exposed to different environmental conditions, resulting in a relatively high humidity of f rel = 10 % ( τ 9   C —yellow) to a low dew point of τ = 50   C (purple). The extrapolated release rates in the range of τ = 27   C (green) and τ = 35   C (light blue) are R exp , ppm = 0.064   ppm min and R exp , ppm = 0.061   ppm min . These values are closer to each other than expected, which can be due to the measurement accuracy of the humidity sensor ( f rel , res = ± 1 % ) for dew point calculation. At a dew point of τ = 41   C (blue), which aligns with current battery production conditions, an increase in gas concentrations of R exp , ppm = 0.049   ppm min was determined. A significant reduction in H2S formation of almost 60 % was achieved when the dew point was reduced from τ = 41   C to τ = 50   C . The computed emission rates R exp , ppm for various dew points range from R exp , ppm = 0.028   ppm min at a dew point of τ = 50   C to R exp , ppm = 0.629   ppm min at τ 9   C .

3.1.3. H2S Release of LPS-Based Slurry

The H2S formation of slurries is displayed in Figure 6b at various dew points. At a high dew point of τ = 8.7   C (yellow), the release is R exp , ppm = 0.216   ppm min . A 75 % lower release is measured at a dew point of τ = 26.8   C (green) with R exp , ppm = 0.053   ppm min . At the dew points τ = 32.8   C (light blue) and τ = 40   C (blue), only a small difference in release of about 20 % is observed. Here too, the close release rates can be attributed to the tolerance of the dew point calculation. At the lower dew point of the two experiments, the release rate is R exp , ppm = 0.033   ppm min . With an H2S release rate of only R exp , ppm = 0.011   ppm min at a dew point of τ = 54   C (purple), the hydrogen sulfide concentration after two hours is C H 2 S = 2.5   ppm . Compared to the LPS powder in Figure 6a, the release rates are lower with coating pastes. One possible explanation for this behavior is that the electrolyte particles in the slurry are surrounded by binder and solvent. Compared to powder, this results in a smaller effective surface area on which LPS can be decomposed under the formation of H2S.

3.1.4. H2S Release of LPS-Based Dried Layers

Figure 7a shows the concentrations of H2S determined over a period of t = 120   min for circular layers with a diameter of d SE = 17.5   mm prepared with LPS. The exposure of the samples at a dew point of τ = 8.7   C (yellow) and τ = 26   C (green) show release rates of R exp , ppm = 1.063   ppm min and R exp , ppm = 0.083   ppm min , respectively. The gas release rate at τ = 34   C (light blue) is R exp , ppm = 0.037   ppm min and further decreases by 60 % at τ = 41   C (blue). Upon exposing a sample at a dew point of τ = 54   C (purple) and a relative humidity of f rel < 0.1 % , no detection of H2S gas is measurable during the period under observation.

3.1.5. H2S Release of LPS-Based Calendered Layers

The influence of different environmental conditions on the H2S release from calendered solid electrolyte layers shows Figure 7b. At a dew point of τ = 8.7   C (yellow), exposure results in a release rate of R exp , ppm = 0.319   ppm min . In this case, the release after calendering is 70 % lower than before calendering, under the same atmospheric conditions. This behavior could be explained by the fact that the effective surface area in contact with the ambient air is reduced by the compacting process and thus less H2S is formed. The release rate decreases to R exp , ppm = 0.075   ppm min at a lower dew point temperature of τ = 26   C (green). Those at low dew points around τ = 34   C (light blue) and τ = 41   C (blue) behave similarly regarding gas release. However, the percentage deviation from non-calendered layers is minimal.

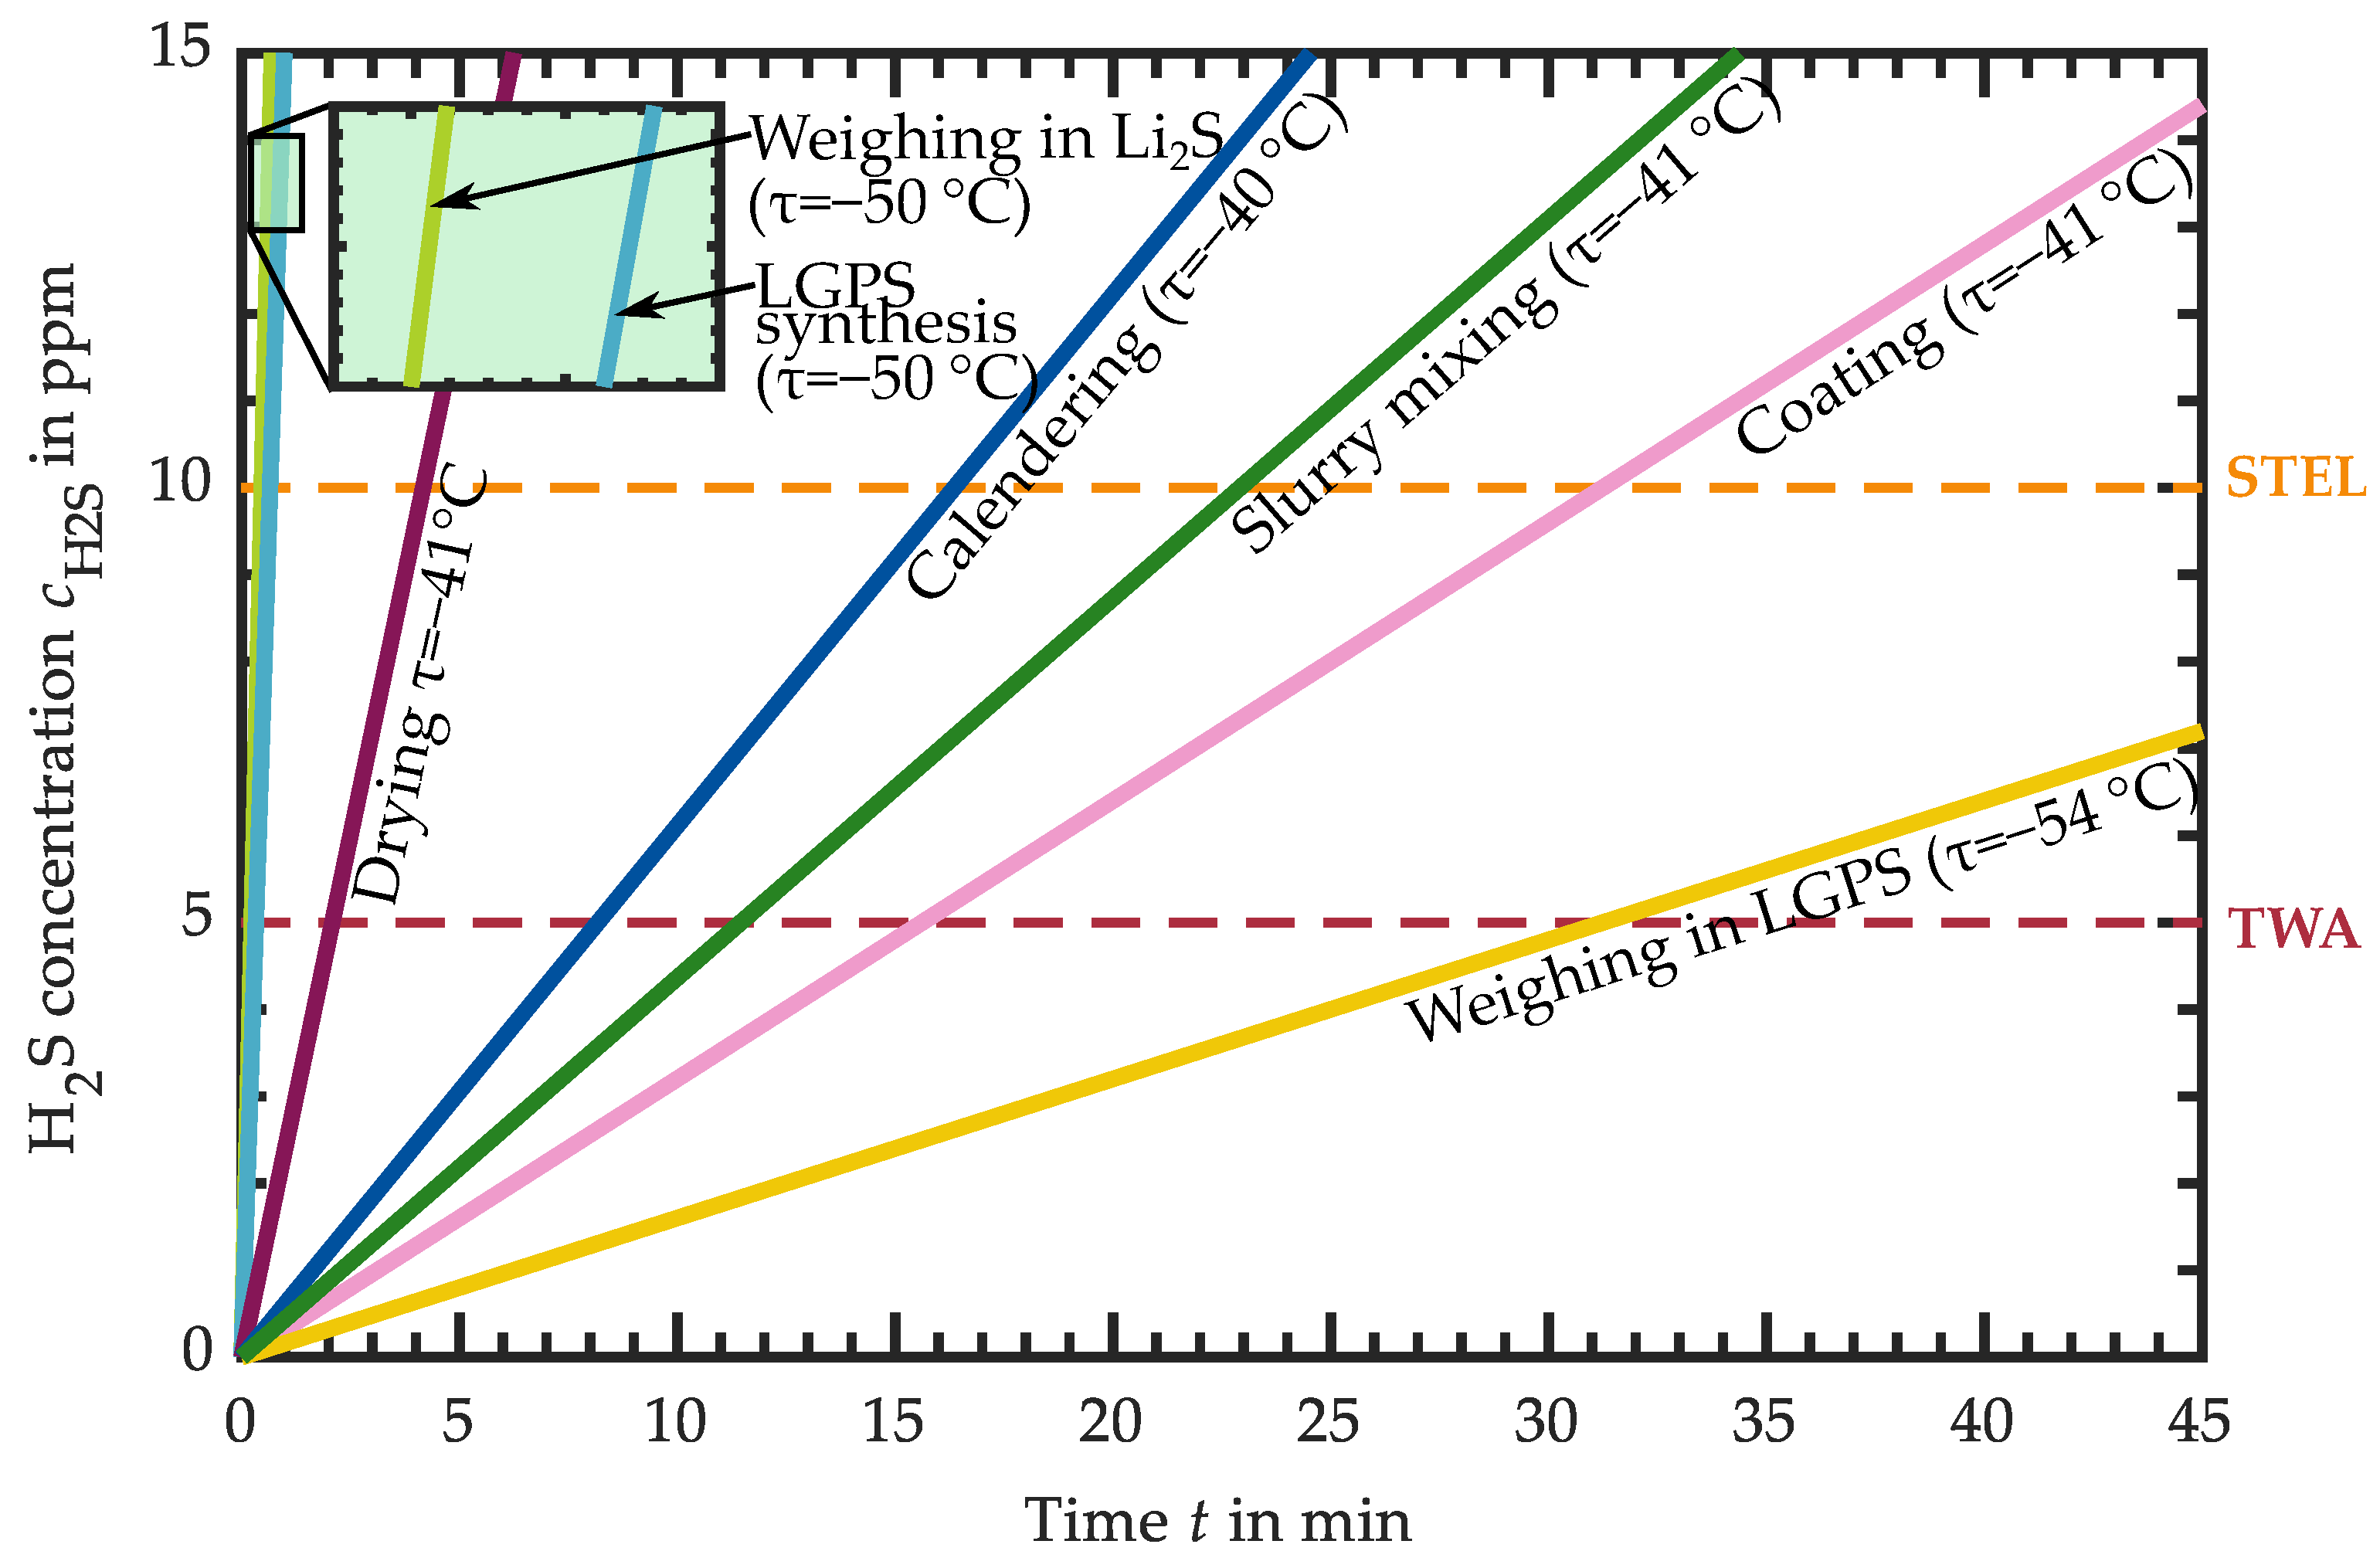
3.1.6. H2S Release of LGPS-Based Intermediates

The series of measurements described for LPS are also performed with LGPS electrolyte. In Figure 8, a compilation and comparison of the results at a dew point of τ = 40   C , respectively, τ = 50   C for the reactants, can be found. The measured and extrapolated H2S concentration is plotted against time. As mentioned in Section 3.1.1, Li2S (dark green) shows the highest and GeS2 (light green) shows no H2S release. In the case of the LGPS intermediates, the release rates at a dew point of τ = 40   C show values between R exp , ppm = 0.039   ppm min (LGPS layer) and R exp , ppm = 0.024   ppm min (LGPS slurry). As with the LPS electrolyte, less gas formation can be observed here when examining the slurry compared to the electrolyte powder. The same applies to the comparison of uncalandered and calandered solid electrolyte layers.
Comparing the measuring results for the LPS- and LGPS-based electrolyte layer production under the same atmospheric conditions ( τ 40   C ), it can be observed that the release rate of LPS powders and slurry are basically higher. The behavior is the opposite in the case of uncalandered and calandered electrolyte layers. Here, the LGPS-based layers release more H2S. A possible explanation for the reversed behavior could be the nature of the electrolyte powder. Visually, the LPS electrolyte has a smaller and finer particle size compared to the LGPS electrolyte. It can be assumed that, in the case of powder and slurry, the small particles of the LPS have a higher total effective surface area and thus offer a greater surface area for decomposition in humid air. The LPS solid electrolyte layer becomes homogeneous and even. In the case of LGPS with larger particles, the resulting solid electrolyte layer becomes more uneven and rough, which could result in a larger surface area compared to the LPS layer and consequently a higher release. Detailed information about the particle sizes of the electrolytes are not available from the supplier.

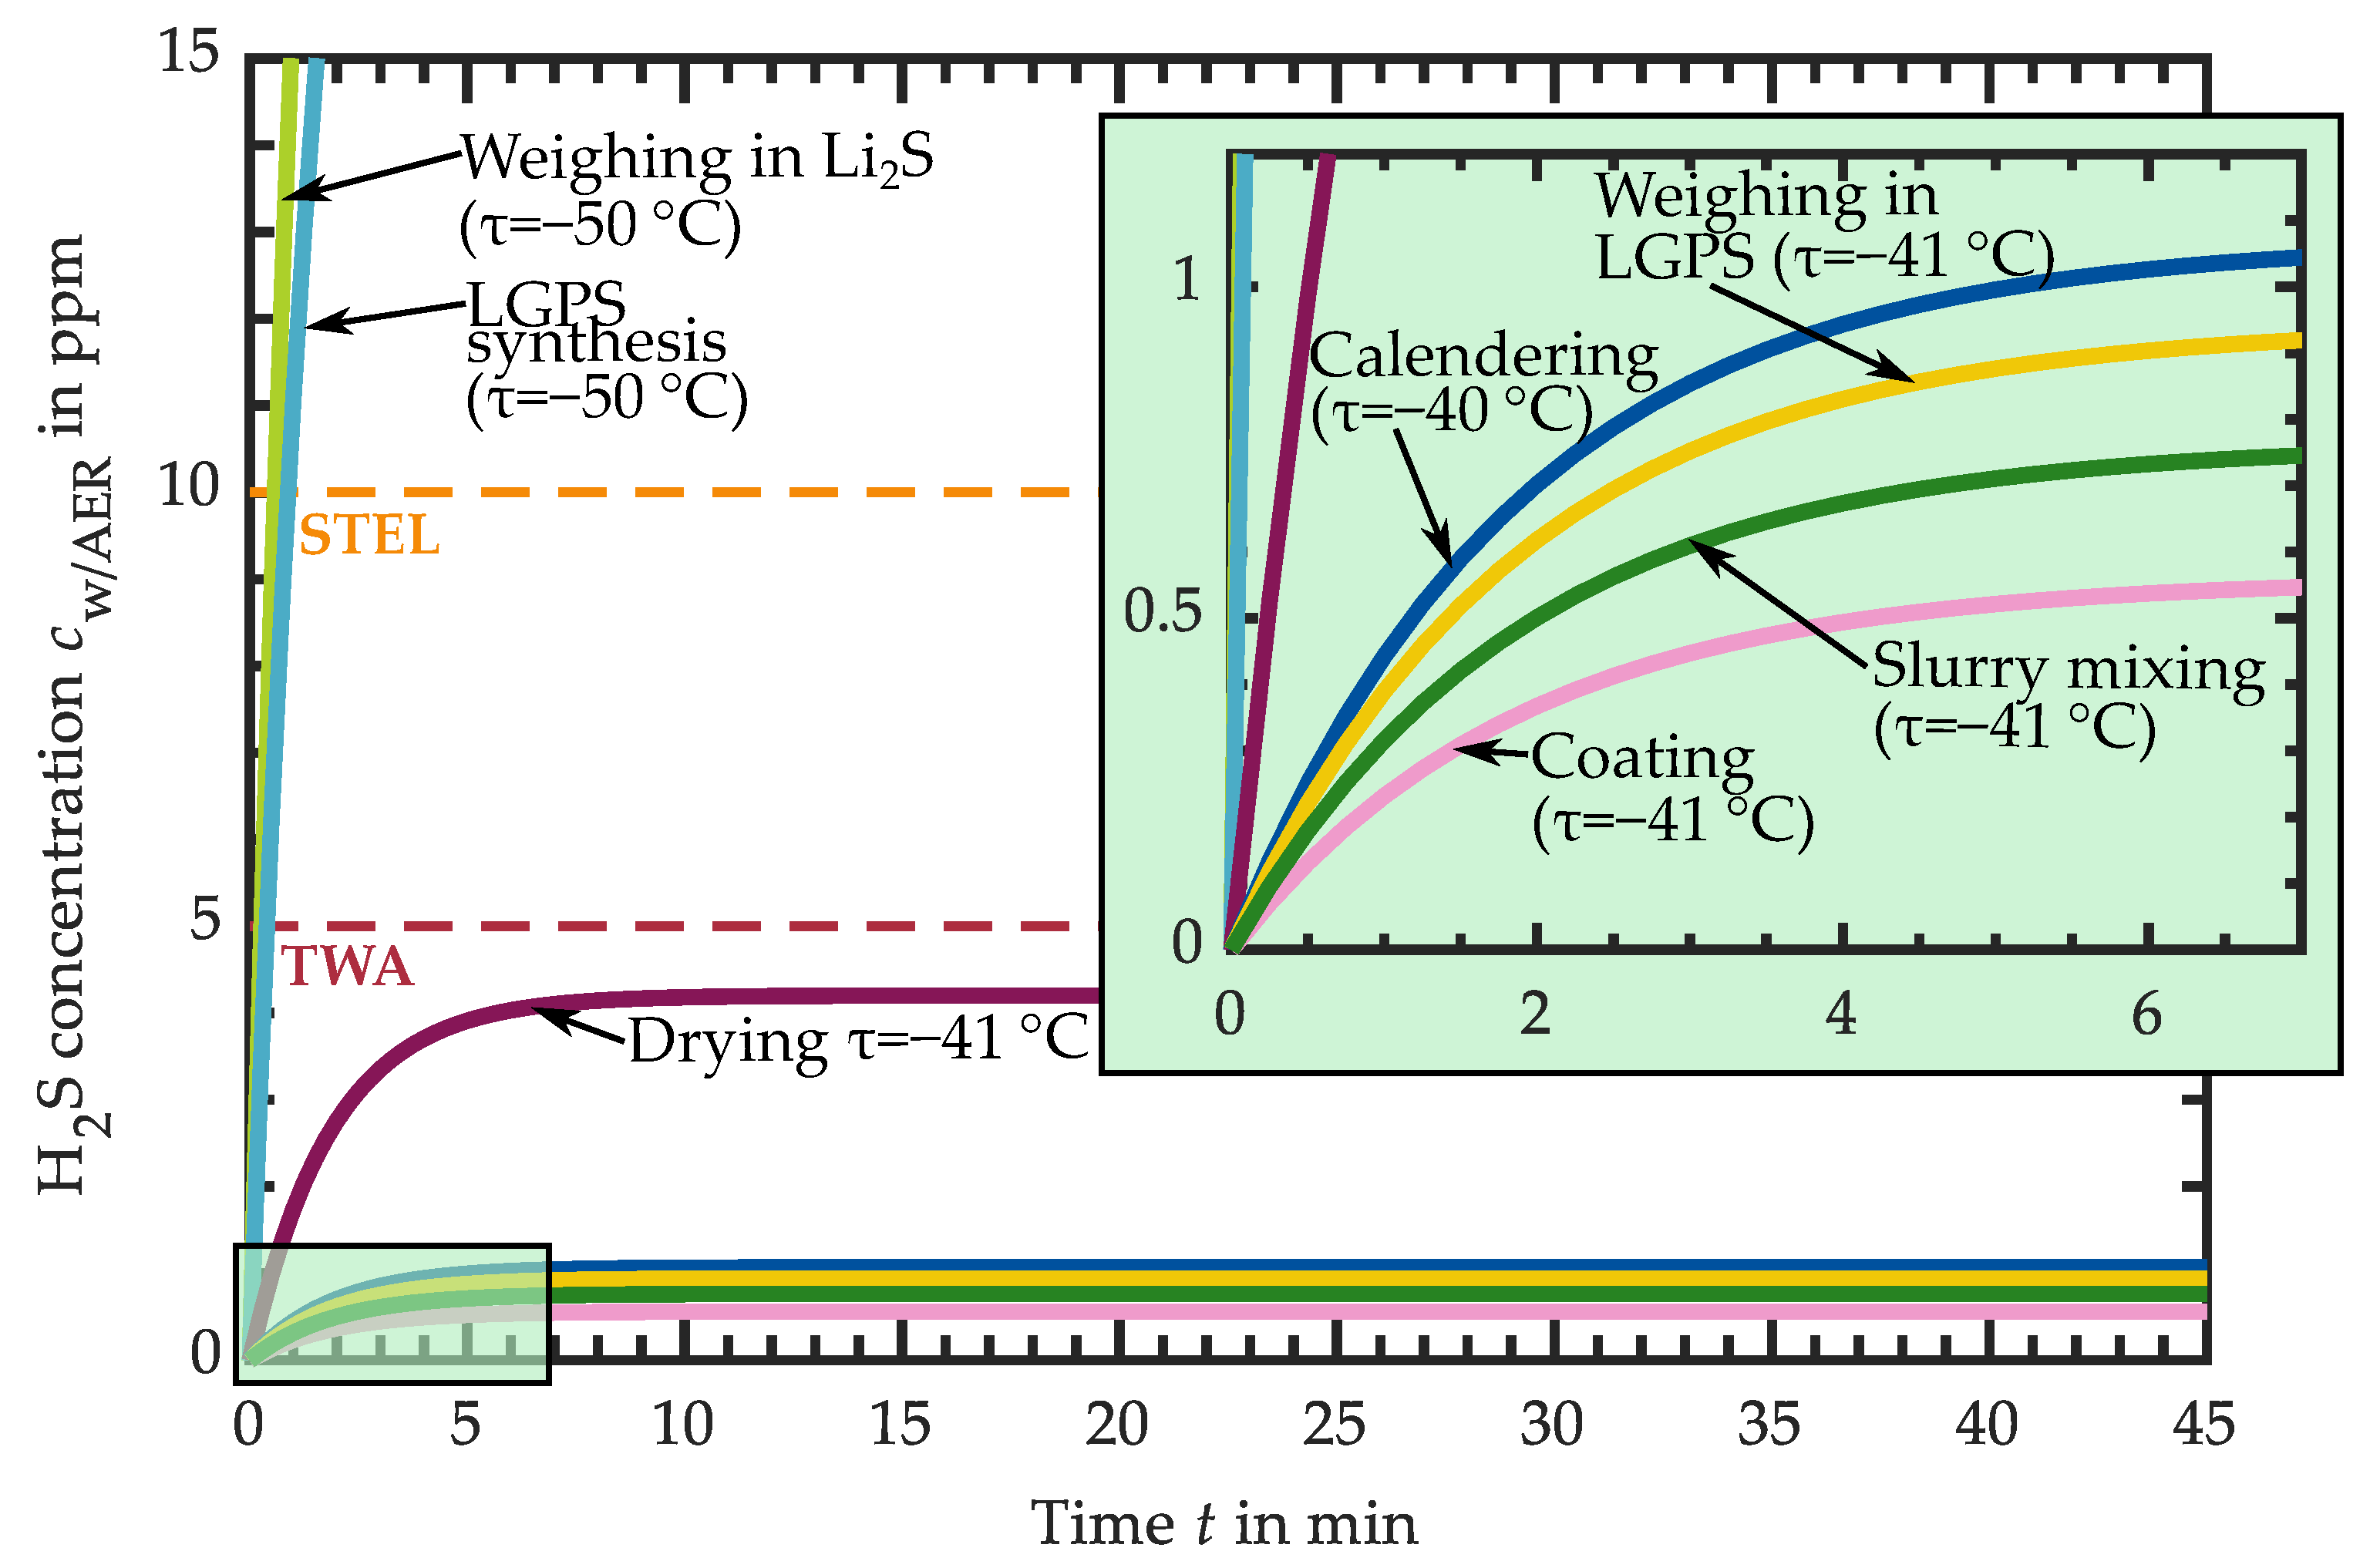
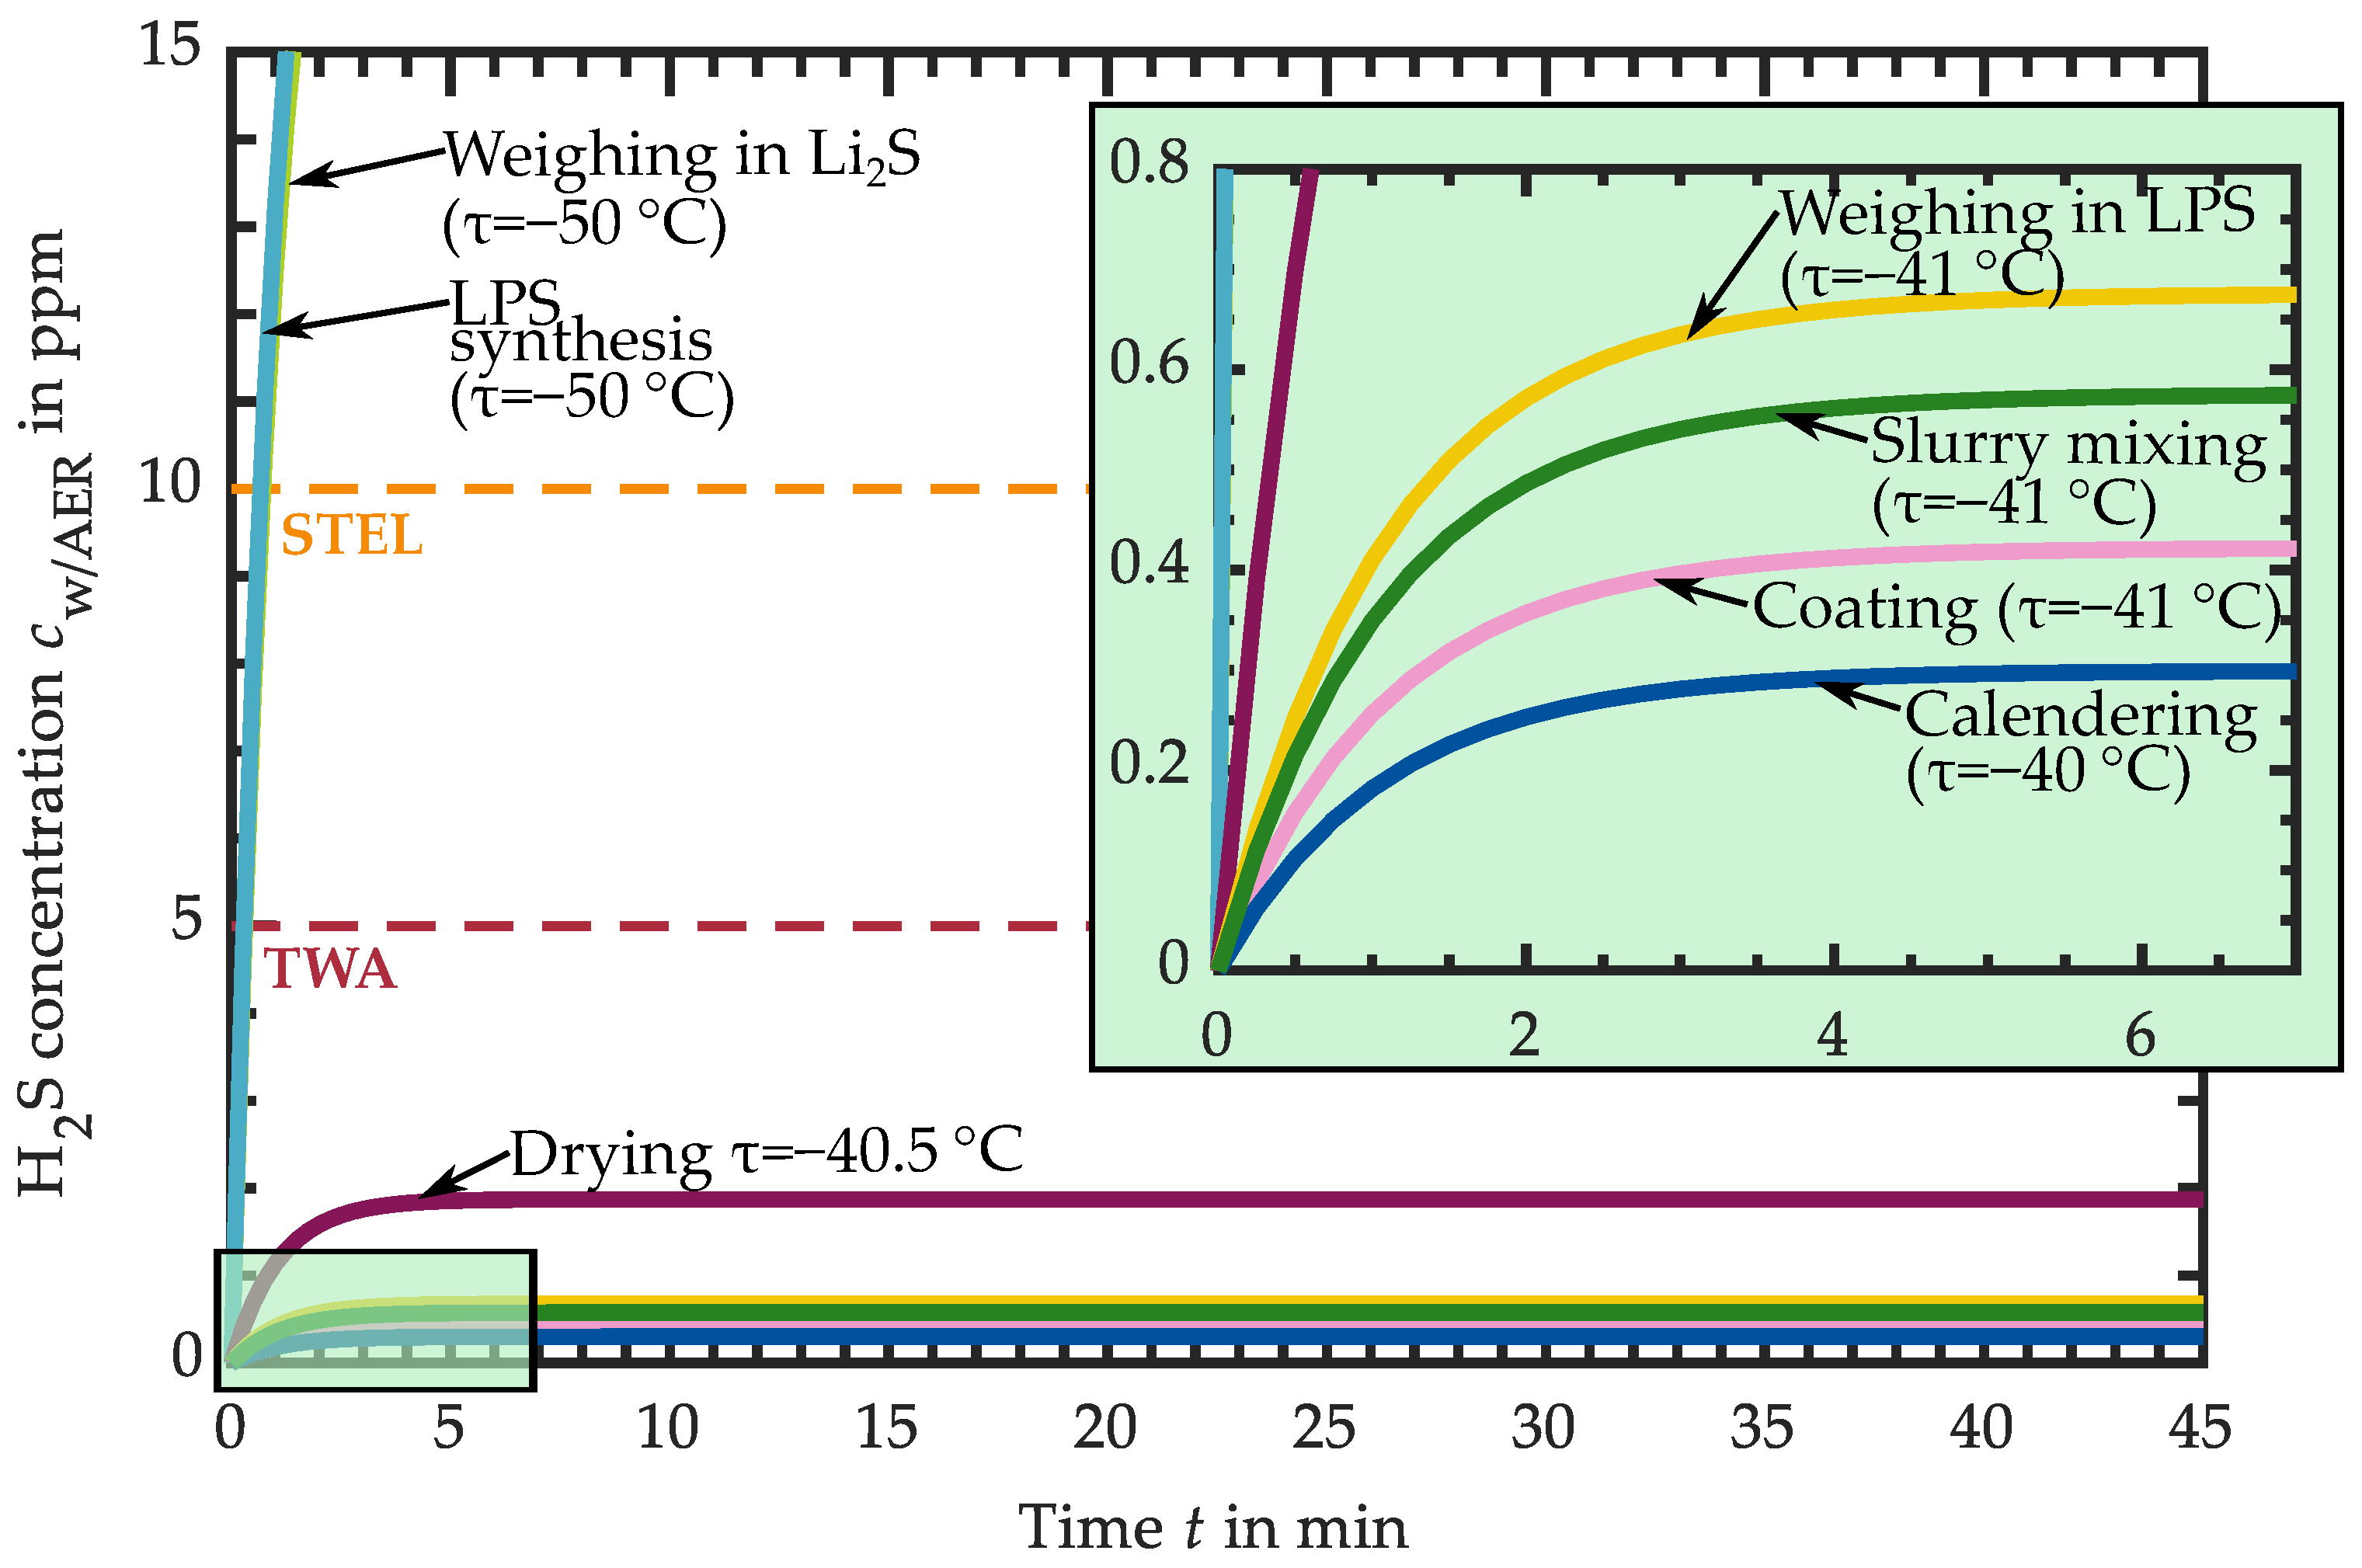
3.2. Requirements for the Atmospheric Conditions in Industrial Production

The data obtained with the experimental setup are now scaled up to the production scale as described in Section 2.3 and compared with permissible occupational health and safety limits. As a reminder, it should be mentioned here again: an H2S concentration of c TWA = 5   ppm defines the occupational limit value as time-weighted average (TWA) for a long-term period of t = 8   h , c STEL = 10   ppm is the short-term exposure limit (STEL) for a time span of t = 15   min . In these investigations, the worst case is assumed. First, the STEL limit is checked for each production step; if this is not exceeded within 15 min, compliance with the TWA is checked. Basically, the measured values at the lowest dew point are used for scaling. First, the concentration curves are considered without taking into account air exchange rates. It is assumed that the released H2S is homogeneously and instantaneously distributed in the given air volume V work .
The results for the LPS-based electrolyte layer are shown in Figure 9. Here, the H2S concentration in ppm within the defined air volume V work is plotted against time t. The TWA limit is marked in red and the STEL limit is marked in orange. For the weighing in and decanting educts (light green), the first thing to be done is to open the drums in which the educts are stored. For this, the H2S release is assumed to be based on Li2S, since this educt represents the worst case with the highest release rate. The STEL is already exceeded within t = 28   s at a dew point of τ = 50   C . The release rate is R pro , ppm = 21.65   ppm min . The same applies to the LPS synthesis (light blue). Assuming that the H2S releasing surface in the mixer consists of half Li2S and P2S5, the STEL limit is exceeded after only t = 26   s at a dew point of τ = 50   C . Even if the synthesis is fully automated in a closed container, an unacceptably high amount of H2S will be emitted when the enclosure is opened for maintenance purposes, for example. The release rates at dew points τ 50   C for the process steps “weighing in LPS” (yellow) and “slurry mixing” (green) indicate the need for a drier environment regarding the long-term limit. However, the permissible H2S amounts for STEL are not exceeded within t = 15   min . During the coating process (pink), the TWA limit is exceeded at the latest in the production chain at a dew point of τ = 54   C . Also, compliance with the STEL is given. For the drying step (purple), a mixed release rate of a 40% dry layer and a 60% wet layer is calculated in these studies. The result is that a dew point of τ = 54   C is sufficient for a short-term exposure since the permissible limit value STEL is reached after t = 18.8   min . Finally, the calendering process (blue) is considered. At a dew point of τ = 40   C , the H2S concentration does not stay below limit values under the assumptions made.
Next, the results for scaling up the LGPS measurement data are presented in Figure 10, which are analogous to the data of LPS. Here, most of the data are available at a dew point of τ 40   C . According to the scaling of the LPS data, Li2S is taken as a worst case for weighing the reactants (light green). Both limits, TWA and STEL, are exceeded within t = 28   s at τ = 50   C . A similar behavior is exhibited by the concentration curve for LGPS synthesis (light blue). Assuming that the H2S releasing surface in the mixer consists one third each of Li2S, P2S5 and GeS2. The limit value violation occurs in this step after t = 19.6   s (TWA) and t = 39.2   s (STEL). Due to the high release rates, the first two production steps can only take place under an inert gas atmosphere, such as argon. At a dew point of τ = 54   C for weighing and decanting the LGPS electrolyte (yellow), it can be observed that less H2S is released compared to the LPS electrolyte. However, the TWA limit value is exceeded after t = 31   min . The release rates at dew points τ = 41   C for the process steps “slurry mixing” (green) and “coating” (pink) indicate the need for a drier environment. The permissible H2S amounts are no longer complied with in the defined air volumes in both cases after t = 11.4   min and t = 15.6   min (TWA). Next, the H2S release during the drying step (purple) is considered. At a dew point of τ = 41   C , the H2S concentration exceeds the permissible TWA limit within a very short time ( t = 2   min ). Calendering (blue) in an atmosphere with τ = 40   C leads to the TWA limit value being exceeded after t = 8   min .
In neither of the results presented, the occupational health and safety limits are complied with. The release rates are so high that the permissible concentration limits are exceeded within a very short time. For a more realistic investigation, it is necessary to consider the air exchange rate in a dry room. Typically, production steps like the anode or cathode coating of lithium ion cells take place in dry rooms with a clean room class of 7, which requires an air exchange rate between AER = 30   1 h and AER = 70   1 h [24,51]. To estimate the worst case, a clean room class of 7 with an AER = 30   1 h is chosen. This consideration also assumes that the released H2S is homogeneously distributed instantaneously in the given air volume V work .
Figure 11 shows the results for the manufacturing of a LPS solid electrolyte layer taking into account the air exchange rate in a dry room. This means that part of the H2S is continuously removed from the production environment. The H2S concentration c w / AER in ppm is plotted over time t for every production step. The diagram area near the origin is shown in detail in the magnification highlighted in green. As shown before, weighing in Li2S (light green) and the LPS synthesis (light blue) exhibit a very strong H2S release at a dew point of τ = 50   C . Despite the air exchange, the concentrations increase within t = 30   s over the allowed limits. Even at lower dew points, it can be assumed that the H2S release is too high to ensure the occupational safety of the employees. As a consequence, this process step must be performed in a glove box-like inert gas atmosphere under argon. For the other process steps, the H2S concentrations rise within the first t = 5   min after the observation starts and then approach constant values. Even at a higher dew point of τ 40   C compared to the LPS synthesis, the values remain below the TWA limit.
Similar results are obtained by regarding the production of an LGPS-based electrolyte layer. Analogous to the LPS results, the representation of the concentration curves for this case is plotted in Figure 12. Here, too, the released H2S in production steps “weighing in Li2S” (light green) and the “LGPS synthesis” (light blue) exceed the permissible limits within a very short time at a dew point of τ = 50   C . In the further production steps, the concentrations in an environment with τ 40   C are much lower and remain stable below the TWA limit. Here, the highest value is c w / AER = 4.24   ppm in the drying step.
The previous scaling up of measurement data to the scale of mass production shows that, depending on the processing step, different environmental conditions must be fulfilled in order to comply with legally specified occupational health and safety limits. A summary of the results obtained for the production of a slurry-based LPS or LGPS electrolyte layer is shown in Figure 13. The conditions for each production step are illustrated here, assuming the most strict atmosphere required for the respective step. In order to meet the requirements for occupational health and safety limits, the storage and processing of the educts must be performed in an inert gas environment. Electrolyte storage under inert gas (e.g., argon) is also recommended here, as this prevents H2S from flowing out when the drum is opened, which means a sudden increase in concentration. Decanting the electrolyte, slurry mixing, coating, drying, and calendering can take place in a dry room with a dew point τ = 40   C or below.
The specified environmental conditions are necessary in order not to exceed the limit value for occupational health and safety limits under the defined conditions. These investigations show that dry rooms for lithium ion cell production with a dew point of τ = 40   C or lower and an air exchange rate of at least AER = 30   1 h appear to be suitable for the large-scale production of slurry-based solid electrolyte layers based on LPS and LGPS. Nevertheless, higher concentrations may occur locally; therefore, it is essential to equip employees with gas detectors and to continuously monitor the atmosphere in the dry room, and at the workplaces, with regard to the health hazards caused by hydrogen sulfide. However, a constant odor nuisance cannot be eliminated. At this point, it should be pointed out once again that compliance with legal limit values is the main focus of the present investigation. The influence of the atmosphere on the product quality must be checked separately.

4. Conclusions

In this paper, the H2S release of single production steps of slurry-based sulfide solid electrolyte layers made of LPS and LGPS was investigated. For this purpose, a laboratory-scale experimental setup was first designed to determine the H2S release from the educts for electrolyte synthesis via the intermediates to the calendered solid electrolyte layer at defined dew points. Thus, the H2S release from reactants, electrolyte powders, electrolyte slurry, and uncalandered and calendered solid electrolyte layers was measured. Based on the release rates determined, an upscaling to dimensions of mass production took place. An initial analysis showed that, without further measures, the occupational health and safety limits to protect employees from health hazards caused by hydrogen sulfide would be exceeded within a very short time. In a next step, a typical air exchange rate for a dry room was assumed, and the H2S concentration that may form during production was determined again. The results show that, under the assumptions made, an already existing dry room for lithium ion cell production with a dew point of τ = 40   C or lower and an air exchange rate of at least AER = 30   1 h is suitable for the large-scale production of slurry-based solid electrolyte layers using LPS and LGPS with regard to compliance with occupational health and safety limits.

Author Contributions

Conceptualization, T.K.; methodology, T.K. and P.J.; investigation, T.K. and P.J.; writing—original draft preparation, T.K. and P.J.; writing—review and editing, T.K., F.H. and P.J.; visualization, T.K.; supervision, K.P.B.; funding acquisition, K.P.B. All authors have read and agreed to the published version of the manuscript.

Funding

The project on which this publication is based was funded by the Baden-Württemberg Ministry of Economics, Labor and Tourism under grant no. BW1_0094/05 as part of the invest BW funding program. The author is responsible for the content of this publication.

Data Availability Statement

The data presented in this study are available upon request.

Acknowledgments

The authors thank IoLiTec Ionic Liquids Technologies GmbH (Heilbronn, Germany) for providing materials.

Conflicts of Interest

The authors declare no conflict of interest.

Abbreviations

The following abbreviations are used in this manuscript:
AERair exchange rate
Arargon
ASSBall-solid-state batterie
ASSBsall-solid-state batteries
HNBRhydrogenated nitrile-butadiene rubber
Li+lithium ion
LGPSlithium germanium phosphorus sulfide (Li10GeP2S12)
LPSlithium phosphorus sulfide (β−Li3PS4)
ppmparts per million
PXp-xylene
RHrelative humidity
SEsolid electrolyte
SEssolid electrolytes
STELshort-term exposure limit
TWAtime-weighted average

References

  1. Wu, M.; Li, M.; Jin, Y.; Chang, X.; Zhao, X.; Gu, Z.; Liu, G.; Yao, X. In situ formed LiF-Li3N interface layer enables ultra-stable sulfide electrolyte-based all-solid-state lithium batteries. J. Energy Chem. 2023, 79, 272–278. [Google Scholar] [CrossRef]
  2. Zuo, T.T.; Walther, F.; Ahmed, S.; Rueß, R.; Hertle, J.; Mogwitz, B.; Volz, K.; Janek, J. Formation of an Artificial Cathode–Electrolyte Interphase to Suppress Interfacial Degradation of Ni-Rich Cathode Active Material with Sulfide Electrolytes for Solid-State Batteries. ACS Energy Lett. 2023, 8, 1322–1329. [Google Scholar] [CrossRef]
  3. Guo, R.; Zhang, K.; Zhao, W.; Hu, Z.; Li, S.; Zhong, Y.; Yang, R.; Wang, X.; Wang, J.; Wu, C.; et al. Interfacial Challenges and Strategies toward Practical Sulfide-Based Solid-State Lithium Batteries. Energy Mater. Adv. 2023, 4, 22. [Google Scholar] [CrossRef]
  4. Wu, J.; Liu, S.; Han, F.; Yao, X.; Wang, C. Lithium/Sulfide All-Solid-State Batteries Using Sulfide Electrolytes. Adv. Mater. 2021, 33, 2000751. [Google Scholar] [CrossRef] [PubMed]
  5. Su, H.; Jiang, Z.; Liu, Y.; Li, J.; Gu, C.; Wang, X.; Xia, X.; Tu, J. Recent progress of sulfide electrolytes for all-solid-state lithium batteries. Energy Mater. 2022, 2, 200005. [Google Scholar] [CrossRef]
  6. Chen, S.; Xie, D.; Liu, G.; Mwizerwa, J.P.; Zhang, Q.; Zhao, Y.; Xu, X.; Yao, X. Sulfide solid electrolytes for all-solid-state lithium batteries: Structure, conductivity, stability and application. Energy Storage Mater. 2018, 14, 58–74. [Google Scholar] [CrossRef]
  7. Sakuda, A.; Hayashi, A.; Tatsumisago, M. Sulfide solid electrolyte with favorable mechanical property for all-solid-state lithium battery. Sci. Rep. 2013, 3, 2261. [Google Scholar] [CrossRef]
  8. Singer, C.; Schnell, J.; Reinhart, G. Scalable Processing Routes for the Production of All-Solid-State Batteries—Modeling Interdependencies of Product and Process. Energy Technol. 2021, 9, 2000665. [Google Scholar] [CrossRef]
  9. Ates, T.; Keller, M.; Kulisch, J.; Adermann, T.; Passerini, S. Development of an all-solid-state lithium battery by slurry-coating procedures using a sulfidic electrolyte. Energy Storage Mater. 2019, 17, 204–210. [Google Scholar] [CrossRef]
  10. Schnell, J.; Günther, T.; Knoche, T.; Vieider, C.; Köhler, L.; Just, A.; Keller, M.; Passerini, S.; Reinhart, G. All-solid-state lithium-ion and lithium metal batteries—Paving the way to large-scale production. J. Power Sources 2018, 382, 160–175. [Google Scholar] [CrossRef]
  11. Lu, P.; Wu, D.; Chen, L.; Li, H.; Wu, F. Air Stability of Solid-State Sulfide Batteries and Electrolytes. Electrochem. Energy Rev. 2022, 5, 3. [Google Scholar] [CrossRef]
  12. Singer, C.; Töpper, H.C.; Kutsch, T.; Schuster, R.; Koerver, R.; Daub, R. Hydrolysis of Argyrodite Sulfide-Based Separator Sheets for Industrial All-Solid-State Battery Production. ACS Appl. Mater. Interfaces 2022, 14, 24245–24254. [Google Scholar] [CrossRef] [PubMed]
  13. Teragawa, S.; Aso, K.; Tadanaga, K.; Hayashi, A.; Tatsumisago, M. Liquid-phase synthesis of a Li3PS4 solid electrolyte using N-methylformamide for all-solid-state lithium batteries. J. Mater. Chem. A 2014, 2, 5095. [Google Scholar] [CrossRef]
  14. Ito, A.; Kimura, T.; Sakuda, A.; Tatsumisago, M.; Hayashi, A. Liquid-phase synthesis of Li3PS4 solid electrolyte using ethylenediamine. J. Sol-Gel Sci. Technol. 2022, 101, 2–7. [Google Scholar] [CrossRef]
  15. Kato, Y.; Hori, S.; Kanno, R. Li10GeP2S12—Type Superionic Conductors: Synthesis, Structure, and Ionic Transportation. Adv. Energy Mater. 2020, 10, 2002153. [Google Scholar] [CrossRef]
  16. Duchardt, M.; Diels, M.; Roling, B.; Dehnen, S. Flow-Oriented Synthesis of Li2S and Li3PS4·3THF: Opening Up a Completely Solvent-Based Solid Electrolyte Value Chain. ACS Appl. Energy Mater. 2020, 3, 6937–6945. [Google Scholar] [CrossRef]
  17. Miura, A.; Rosero-Navarro, N.C.; Sakuda, A.; Tadanaga, K.; Phuc, N.H.H.; Matsuda, A.; Machida, N.; Hayashi, A.; Tatsumisago, M. Liquid-phase syntheses of sulfide electrolytes for all-solid-state lithium battery. Nat. Rev. Chem. 2019, 3, 189–198. [Google Scholar] [CrossRef]
  18. Kamaya, N.; Homma, K.; Yamakawa, Y.; Hirayama, M.; Kanno, R.; Yonemura, M.; Kamiyama, T.; Kato, Y.; Hama, S.; Kawamoto, K.; et al. A lithium superionic conductor. Nat. Mater. 2011, 10, 682–686. [Google Scholar] [CrossRef]
  19. Singer, C.; Töpper, H.C.; Günter, F.J.; Reinhart, G. Plant Technology for the Industrial Coating Process for Sulfide-Based All-Solid-State Batteries. Procedia CIRP 2021, 104, 56–61. [Google Scholar] [CrossRef]
  20. von Hann, J.F. Handbuch der Klimatologie: Bände 1-2; Salzwasser: Paderborn, Germany, 2012. [Google Scholar]
  21. Bencloski, J.W. Air temperature and relative humidity: A simulation. J. Geogr. 1982, 81, 64–65. [Google Scholar] [CrossRef]
  22. Lawrence, M.G. The Relationship between Relative Humidity and the Dewpoint Temperature in Moist Air: A Simple Conversion and Applications. Bull. Am. Meteorol. Soc. 2005, 86, 225–234. [Google Scholar] [CrossRef]
  23. Kwade, A.; Haselrieder, W.; Leithoff, R.; Modlinger, A.; Dietrich, F.; Droeder, K. Current status and challenges for automotive battery production technologies. Nat. Energy 2018, 3, 290–300. [Google Scholar] [CrossRef]
  24. DIN EN ISO 14644; Reinräume und Zugehörige Reinraumbereiche. Deutsche Norm, Beuth Verlag GmbH: Berlin, Germany, 2016.
  25. Gail, L.; Gommel, U. (Eds.) Reinraumtechnik, 4th ed.; Springer: Berlin/Heidelberg, Germany, 2018. [Google Scholar]
  26. Ahmed, S.; Nelson, P.A.; Dees, D.W. Study of a dry room in a battery manufacturing plant using a process model. J. Power Sources 2016, 326, 490–497. [Google Scholar] [CrossRef]
  27. Duffner, F.; Kronemeyer, N.; Tübke, J.; Leker, J.; Winter, M.; Schmuch, R. Post-lithium-ion battery cell production and its compatibility with lithium-ion cell production infrastructure. Nat. Energy 2021, 6, 123–134. [Google Scholar] [CrossRef]
  28. Schnell, J.; Knörzer, H.; Imbsweiler, A.J.; Reinhart, G. Solid versus Liquid—A Bottom–Up Calculation Model to Analyze the Manufacturing Cost of Future High–Energy Batteries. Energy Technol. 2020, 8, 1901237. [Google Scholar] [CrossRef]
  29. Cubitt, A.; Henderson, C.; Staveley, L.; Fonseca, I.; Ferreira, A.; Lobo, L. Some thermodynamic properties of liquid hydrogen sulphide and deuterium sulphide. J. Chem. Thermodyn. 1987, 19, 703–710. [Google Scholar] [CrossRef]
  30. GESTIS-Substance Database: Hydrogen Sulfide. 2020. Available online: https://gestis.dguv.de/data?name=001130 (accessed on 30 August 2023).
  31. Goubern, M.; Andriamihaja, M.; Nübel, T.; Blachier, F.; Bouillaud, F. Sulfide, the first inorganic substrate for human cells. FASEB J. Off. Publ. Fed. Am. Soc. Exp. Biol. 2007, 21, 1699–1706. [Google Scholar] [CrossRef]
  32. Reiffenstein, R.J.; Hulbert, W.C.; Roth, S.H. Toxicology of hydrogen sulfide. Annu. Rev. Pharmacol. Toxicol. 1992, 32, 109–134. [Google Scholar] [CrossRef]
  33. Sicher Atmen—Auch Bei Extremen H2S-Konzentrationen. Available online: https://www.draeger.com/library/content/fachartikel-h2s-hanscray-999-de.pdf (accessed on 30 August 2023).
  34. Nikodimos, Y.; Huang, C.J.; Taklu, B.W.; Su, W.N.; Hwang, B.J. Chemical stability of sulfide solid-state electrolytes: Stability toward humid air and compatibility with solvents and binders. Energy Environ. Sci. 2022, 15, 991–1033. [Google Scholar] [CrossRef]
  35. Zhang, J.; Huang, L.; Gu, X. Failure mechanism of solid-state electrolyte Li10GeP2S12 in a moist atmosphere: A first-principles study. Mater. Adv. 2022, 3, 3143–3150. [Google Scholar] [CrossRef]
  36. Muramatsu, H.; Hayashi, A.; Ohtomo, T.; Hama, S.; Tatsumisago, M. Structural change of Li2S–P2S5 sulfide solid electrolytes in the atmosphere. Solid State Ionics 2011, 182, 116–119. [Google Scholar] [CrossRef]
  37. Picot, A.; Grenouillet, P. Safety in the Chemistry and Biochemistry Laboratory, 1st ed.; VCH Publishers: New York, NY, USA, 1995. [Google Scholar]
  38. Rochow, E.G.; Abel, E.W. The Chemistry of Germanium, Tin and Lead; Elsevier Science: Burlington, VT, USA, 2014. [Google Scholar]
  39. Horton, J.H.; Peat, K.L.; Lambert, R.M. Surface photo-oxidation and Ag deposition on amorphous GeS2. J. Phys. Condens. Matter 1993, 5, 9037–9048. [Google Scholar] [CrossRef]
  40. Xue, X.; Liu, G.; Zhao, X.; Xie, W.; He, H.; Yao, X. Superior Air–Stable Li4P0 · 9 Sb0 · 1 S4I Solid Electrolyte for All–Solid–State Lithium Batteries. Energy Technol. 2023, 11, 2201320. [Google Scholar] [CrossRef]
  41. Lee, Y.; Jeong, J.; Lee, H.J.; Kim, M.; Han, D.; Kim, H.; Yuk, J.M.; Nam, K.W.; Chung, K.Y.; Jung, H.G.; et al. Lithium Argyrodite Sulfide Electrolytes with High Ionic Conductivity and Air Stability for All-Solid-State Li-Ion Batteries. ACS Energy Lett. 2022, 7, 171–179. [Google Scholar] [CrossRef]
  42. Yersak, T.A.; Zhang, Y.; Hao, F.; Cai, M. Moisture Stability of Sulfide Solid-State Electrolytes. Front. Energy Res. 2022, 10, 882508. [Google Scholar] [CrossRef]
  43. Kimura, T.; Nakano, T.; Sakuda, A.; Tatsumisago, M.; Hayashi, A. Hydration and Dehydration Behavior of Li4SnS4 for Applications as a Moisture-Resistant All-Solid-State Battery Electrolyte. J. Phys. Chem. C 2023, 127, 1303–1309. [Google Scholar] [CrossRef]
  44. Hayashi, A.; Muramatsu, H.; Ohtomo, T.; Hama, S.; Tatsumisago, M. Improvement of chemical stability of Li3PS4 glass electrolytes by adding MxOy (M = Fe, Zn, and Bi) nanoparticles. J. Mater. Chem. A 2013, 1, 6320. [Google Scholar] [CrossRef]
  45. Chen, Y.T.; Marple, M.A.T.; Tan, D.H.S.; Ham, S.Y.; Sayahpour, B.; Li, W.K.; Yang, H.; Lee, J.B.; Hah, H.J.; Wu, E.A.; et al. Investigating dry room compatibility of sulfide solid-state electrolytes for scalable manufacturing. J. Mater. Chem. A 2022, 10, 7155–7164. [Google Scholar] [CrossRef]
  46. Lu, P.; Liu, L.; Wang, S.; Xu, J.; Peng, J.; Yan, W.; Wang, Q.; Li, H.; Chen, L.; Wu, F. Superior All-Solid-State Batteries Enabled by a Gas-Phase-Synthesized Sulfide Electrolyte with Ultrahigh Moisture Stability and Ionic Conductivity. Adv. Mater. 2021, 33, 2100921. [Google Scholar] [CrossRef]
  47. Khurram Tufail, M.; Ahmad, N.; Zhou, L.; Faheem, M.; Yang, L.; Chen, R.; Yang, W. Insight on air-induced degradation mechanism of Li7P3S11 to design a chemical-stable solid electrolyte with high Li2S utilization in all-solid-state Li/S batteries. Chem. Eng. J. 2021, 425, 130535. [Google Scholar] [CrossRef]
  48. Kreher, T.; Heim, F.; Pross-Brakhage, J.; Hemmerling, J.; Birke, K.P. Comparison of Different Current Collector Materials for In Situ Lithium Deposition with Slurry-Based Solid Electrolyte Layers. Batteries 2023, 9, 412. [Google Scholar] [CrossRef]
  49. Drägerwerk AG & Co. KGaA. Datasheet Dräger Pac® 6500 Eingasmessgerät. 2021. Available online: https://www.draeger.com/Products/Content/pac-6500-pi-9104115-de-dach.pdf (accessed on 30 August 2023).
  50. Sensirion, A.G. Datasheet SHT45. 2023. Available online: https://sensirion.com/media/documents/33FD6951/64D3B030/Sensirion_Datasheet_SHT4x.pdf (accessed on 30 August 2023).
  51. Simon, R. Facilities of a lithium-ion battery production plant. In Lithium-Ion Batteries: Basics and Applications; Korthauer, R., Ed.; Springer: Berlin/Heidelberg, Germany, 2018; pp. 227–235. [Google Scholar] [CrossRef]
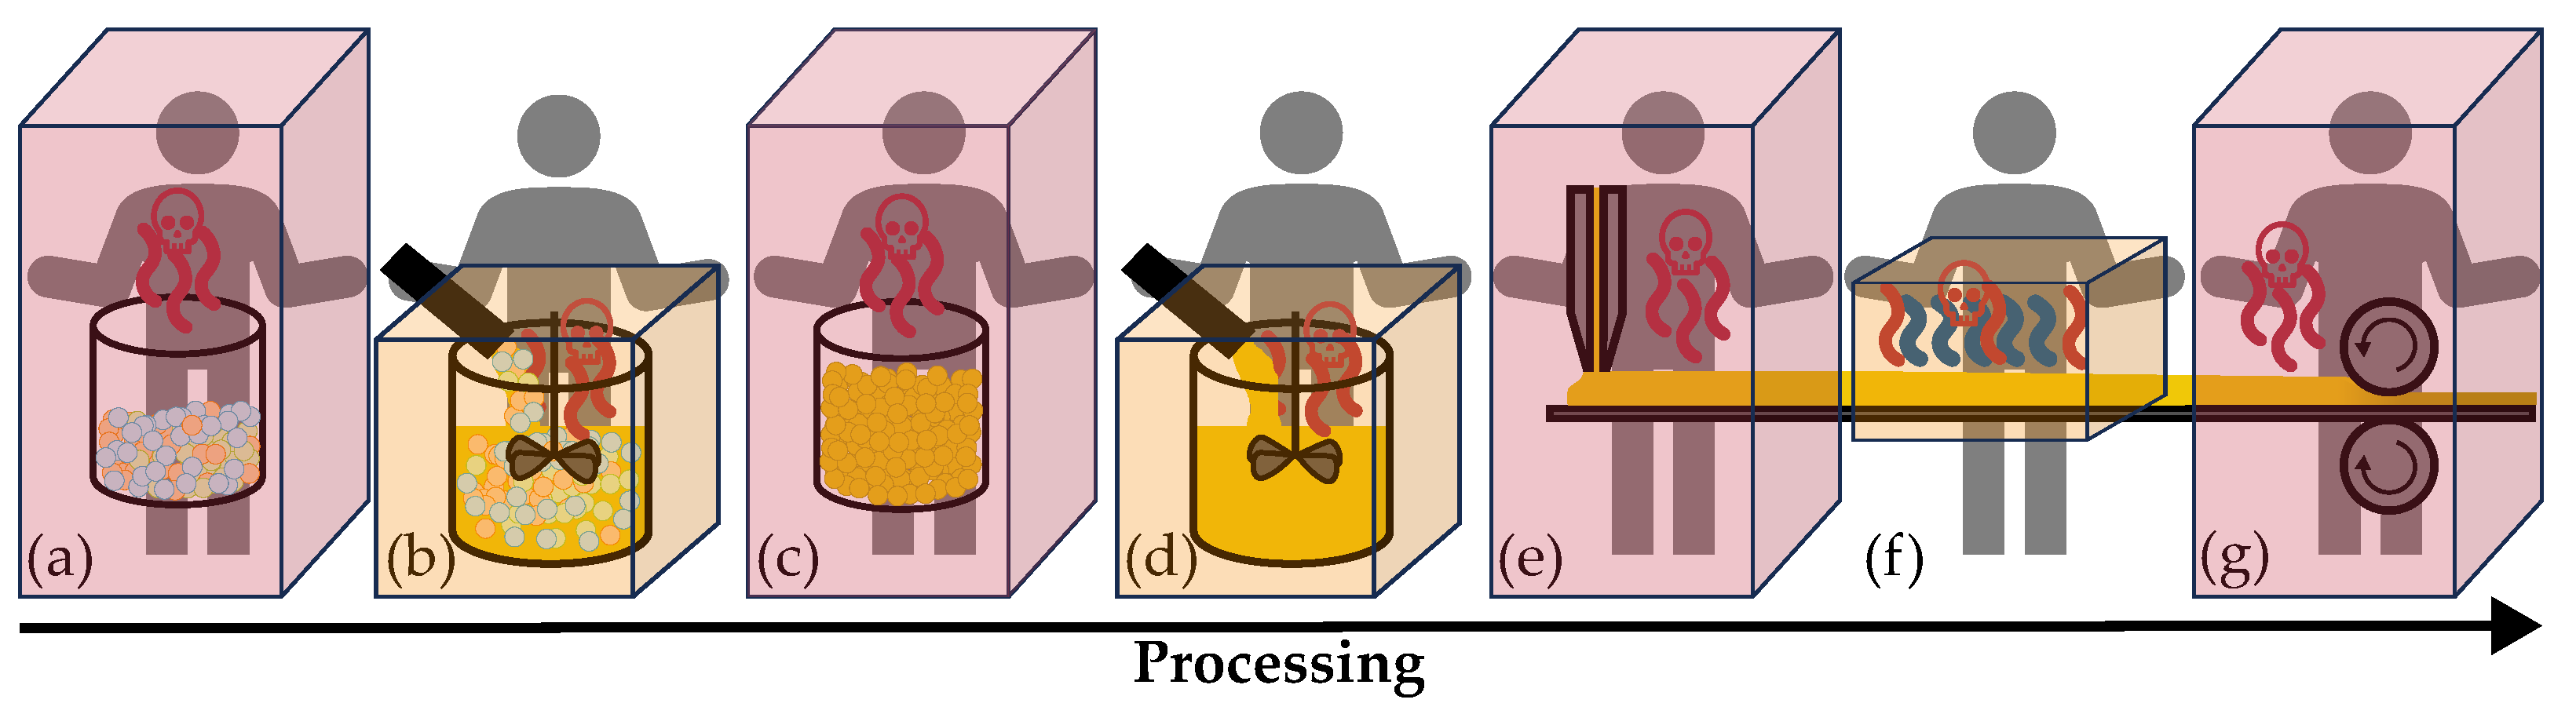
Figure 1. The schematic illustration of the production process and intermediate products during the manufacturing of solid electrolyte layers. In the upper part of the figure, the individual production steps are shown from left to right. It starts with the storage of the educts for electrolyte production, followed by electrolyte synthesis and the temporary storage of the prepared electrolyte powder. A coating paste is then produced, which is applied to a carrier substrate. Next is a drying step to evaporate the solvent from the still wet coating film. Finally, the dried layer is compacted. In the lower part of the figure, the intermediate products of the individual production step are shown from left to right. The H2S release of the production steps is to be analyzed on the basis of these products: the educts of the electrolyte synthesis, the solid electrolyte powder, slurry with solid electrolyte, a dried solid electrolyte layer, as well as a calendered solid electrolyte layer.
Batteries 09 00472 g001
Figure 2. Effects of increasing H2S concentration on the human body. Below c H 2 S < 0.1   ppm , H2S is noticeable, with higher concentrations damaging damage, increasing up to a lethal effect at concentrations of c H 2 S > 5000   ppm . Additionally, the occupational limit values are marked. A H2S concentration of c TWA = 5   ppm defines the occupational limit value as a time-weighted average (TWA) for a long-term period of t = 8   h , c STEL = 10   ppm is the short-term exposure limit (STEL) for a time span of t = 15   min (data for threshold values taken from [31,32,33]).
Batteries 09 00472 g002
Figure 3. Schematic diagram illustrating the experimental setup used for measuring the H2S release of various samples. The sealed sample is placed on a 3D-printed holder inside a desiccator and can be opened by a mechanism from the outside. Sensors measure temperature, humidity, and H2S concentration, whilst a ventilation fan creates artificial air circulation.
Batteries 09 00472 g003
Figure 4. Visualization of individual production steps with production staff. The red boxes symbolize the air volume in which the employee is located during this production step and in which H2S can be directly released. The orange boxes assume that this process is fully automated in a closed area or container. Only in exceptional cases, for example, when a housing cover has to be opened, may the employee come into contact with H2S. (a) Weighing in and decanting educts for electrolyte synthesis, (b) fully automated electrolyte synthesis, (c) weighing in and decanting electrolyte powder for slurry production, (d) fully automated slurry mixing, (e) coating on carrier substrate and occasional visual inspection, (f) fully automated drying, (g) calendering and quality control.
Batteries 09 00472 g004
Figure 5. Plot of H2S concentration c H 2 S in ppm versus time t in minutes for educts at a dew point of τ = 50 °C: lithium sulfide Li2S (dark green), phosphorus pentasulfide P2S5 (green), germanium disulfide GeS2 (light green). Li2S shows the highest release rate compared to P2S5 and GeS2. For GeS2, no measurable amount of H2S during the observation period can be detected.
Batteries 09 00472 g005
Figure 6. (a) Comparison of the hydrogen sulfide concentration over time for LPS powder samples with a weight of m p = 100   mg while exposed to different dew points ranging from τ = 9   C to τ = 50   C . (b) H2S concentration over time of samples with an LPS slurry of ( m s = 500   mg ), which were, respectively, exposed to dew points between τ = 8.7   C and τ = 54   C .
Batteries 09 00472 g006
Figure 7. (a) The hydrogen sulfide concentration c H 2 S of solid LPS electrolyte layers with a diameter of d SE = 17.5   mm is examined by exposing them to dew points ranging from τ = 8.7   C to τ = 50   C and comparing their hydrogen sulfide release. (b) H2S release from calendered LPS layers with a diameter of d SE = 17.5   mm when exposed to dew points between τ = 8.7   C and τ = 41   C .
Batteries 09 00472 g007
Figure 8. Comparison of hydrogen sulfide concentration over time for LGPS-based intermediates at τ = 40   C (blue tones) and educts for electrolyte synthesis at τ = 50   C (green tones). The highest release rate of R exp , ppm = 1.4887   ppm min was determined for Li2S, and the lowest rate R exp , ppm = 0.024   ppm min for LGPS slurry.
Batteries 09 00472 g008
Figure 9. Representation of the emitted H2S concentration c H 2 S in ppm in the defined working air volume V work without air exchange plotted against time t for the production steps of the LPS-based electrolyte layer. The TWA limit is marked in red, the STEL limit in orange. The single production steps are depicted as follows: weighing in the educts (light green), LPS synthesis (light blue), weighing in LPS (yellow), slurry mixing (green), coating (pink), drying (purple), and calendering (blue).
Batteries 09 00472 g009
Figure 10. Representation of the emitted H2S concentration c H 2 S in ppm in the defined working air volume V work without air exchange plotted against time t for the production steps of the LGPS-based electrolyte layer. The TWA limit is marked in red and the STEL limit is marked in orange. The single production steps are depicted as follows: weighing in the educts (light green), LPS synthesis (light blue), weighing in LPS (yellow), slurry mixing (green), coating (pink), drying (purple), and calendering (blue).
Batteries 09 00472 g010
Figure 11. Representation of the emitted H2S concentration c w / AER in ppm in the defined working air volume V work plotted against time t in min for the production steps of the LPS-based electrolyte layer taking into account an AER = 30   1 h . The TWA limit is marked in red and the STEL limit is marked in orange. The single production steps are depicted as follows: weighing in the educts (light green), LPS synthesis (light blue), weighing in LPS (yellow), slurry mixing (green), coating (pink), drying (purple) and calendering (blue). Except for the first two production steps, the occupational health and safety limits are complied with at a dew point of τ 40   C .
Batteries 09 00472 g011
Figure 12. Representation of the emitted H2S concentration c w / AER in ppm in the defined working air volume V work plotted against time t in min for the production steps of the LGPS-based electrolyte layer taking into account an AER = 30   1 h . The TWA limit is marked in red, and the STEL limit is marked in orange. The single production steps are depicted as follows: weighing in the educts (light green), LPS synthesis (light blue), weighing in LPS (yellow), slurry mixing (green), coating (pink), drying (purple) and calendering (blue). Except for the first two production steps, the occupational health and safety limits are complied with at a dew point of τ 40   C .
Batteries 09 00472 g012
Figure 13. Requirements for the atmospheric conditions with regard to occupational health and safety limits. The results of the investigations show that the first production steps must take place under an inert gas atmosphere, since the H2S release of the intermediate products is too high to comply with the allowed limits. Decanting the electrolyte, mixing the slurry, coating, drying, and calendering can be performed in a dry room with a dew point of τ = 40   C or below.
Batteries 09 00472 g013
Table 1. Assumed dimensions for scaling up data determined on laboratory scale to a mass production scale.
Production StepArea A product of H2S-Working AreaAir Volume
Releasing Product V work
(a) Weighing in and decanting educts for electrolyte synthesisStorage in a 100 l drum h ( a ) = 2.5   m V ( a ) = 2.5   m 3
d drum = 0.45   m w ( a ) = 1   m
A drum = 0.159   m 2 l ( a ) = 1   m
(b) Fully automated electrolyte synthesisSynthesis container h ( b ) = 1.5   m V ( b ) = 1.5   m 3
d syn = 0.50   m w ( b ) = 1   m
A syn = 0.196   m 2 l ( b ) = 1   m
(c) Weighing in and decanting electrolyte powderStorage in a 100 l drum h ( c ) = 2.5   m V ( c ) = 2.5   m 3
d drum = 0.45   m w ( c ) = 1   m
A drum = 0.159   m 2 l ( c ) = 1   m
(d) Fully automated slurry mixingMixer h ( d ) = 2   m V ( d ) = 2   m 3
d mix = 0.50   m b ( d ) = 1   m
A mix = 0.196   m 2 w ( d ) = 1   m
(e) Coating on carrier substrate w coat = 0.35   m h ( e ) = 2.5   m V ( e ) = 6   m 3
l coat = 1   m w ( e ) = 1.2   m
A coat = 0.35   m 2 l ( e ) = 2   m
(f) Fully automated drying w dry = 0.35   m h ( f ) = 1   m V ( f ) = 10   m 3
l dry = 10   m w ( f ) = 1   m
A dry = 3.5   m 2 l ( f ) = 10   m
(g) Calendering and quality control w cal = 0.35   m h ( g ) = 2   m V ( g ) = 43.2   m 3
l cal = 10   m w ( g ) = 1.2   m
A cal = 3.5   m 2 l ( g ) = 18   m
Disclaimer/Publisher’s Note: The statements, opinions and data contained in all publications are solely those of the individual author(s) and contributor(s) and not of MDPI and/or the editor(s). MDPI and/or the editor(s) disclaim responsibility for any injury to people or property resulting from any ideas, methods, instructions or products referred to in the content.

