
Experimental Investigation and Safety Classification Evaluation of Small Drone Collision with Humans

Abstract
:1. Introduction
2. Materials and Methods
2.1. Samples
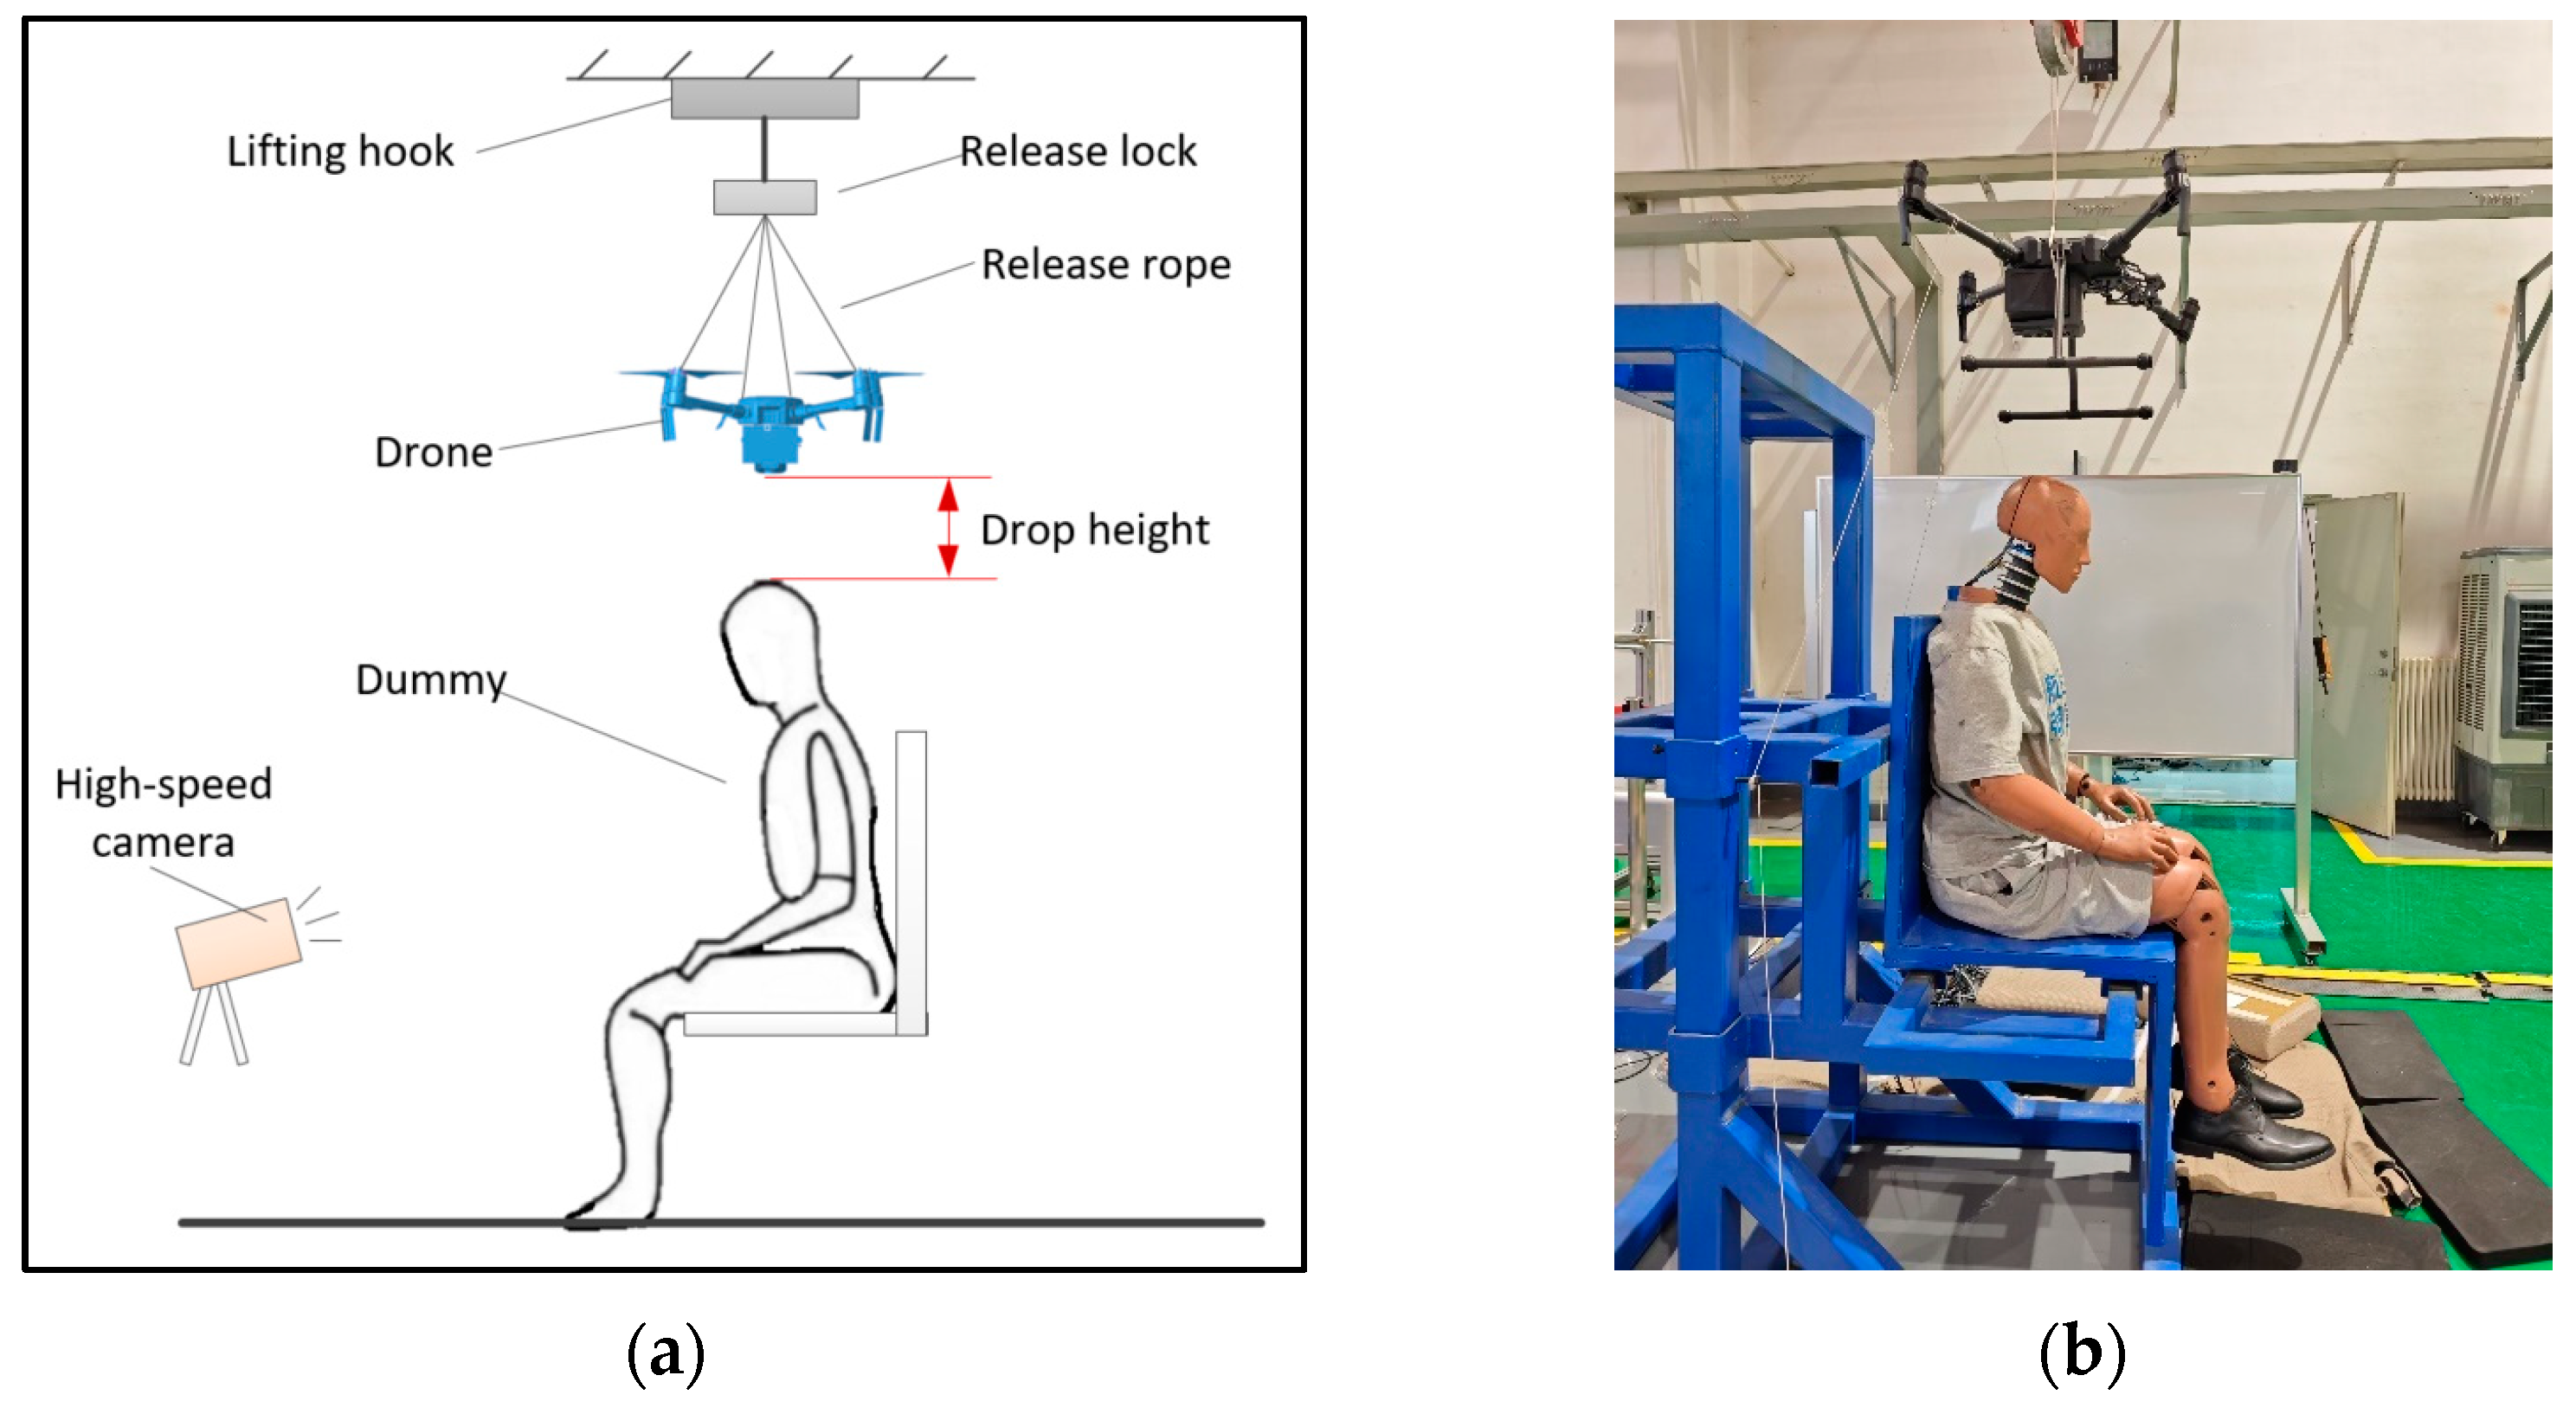
2.2. Experiment Setup
2.3. Experimental Matrix
2.4. Head and Neck Injury Criteria
3. Results
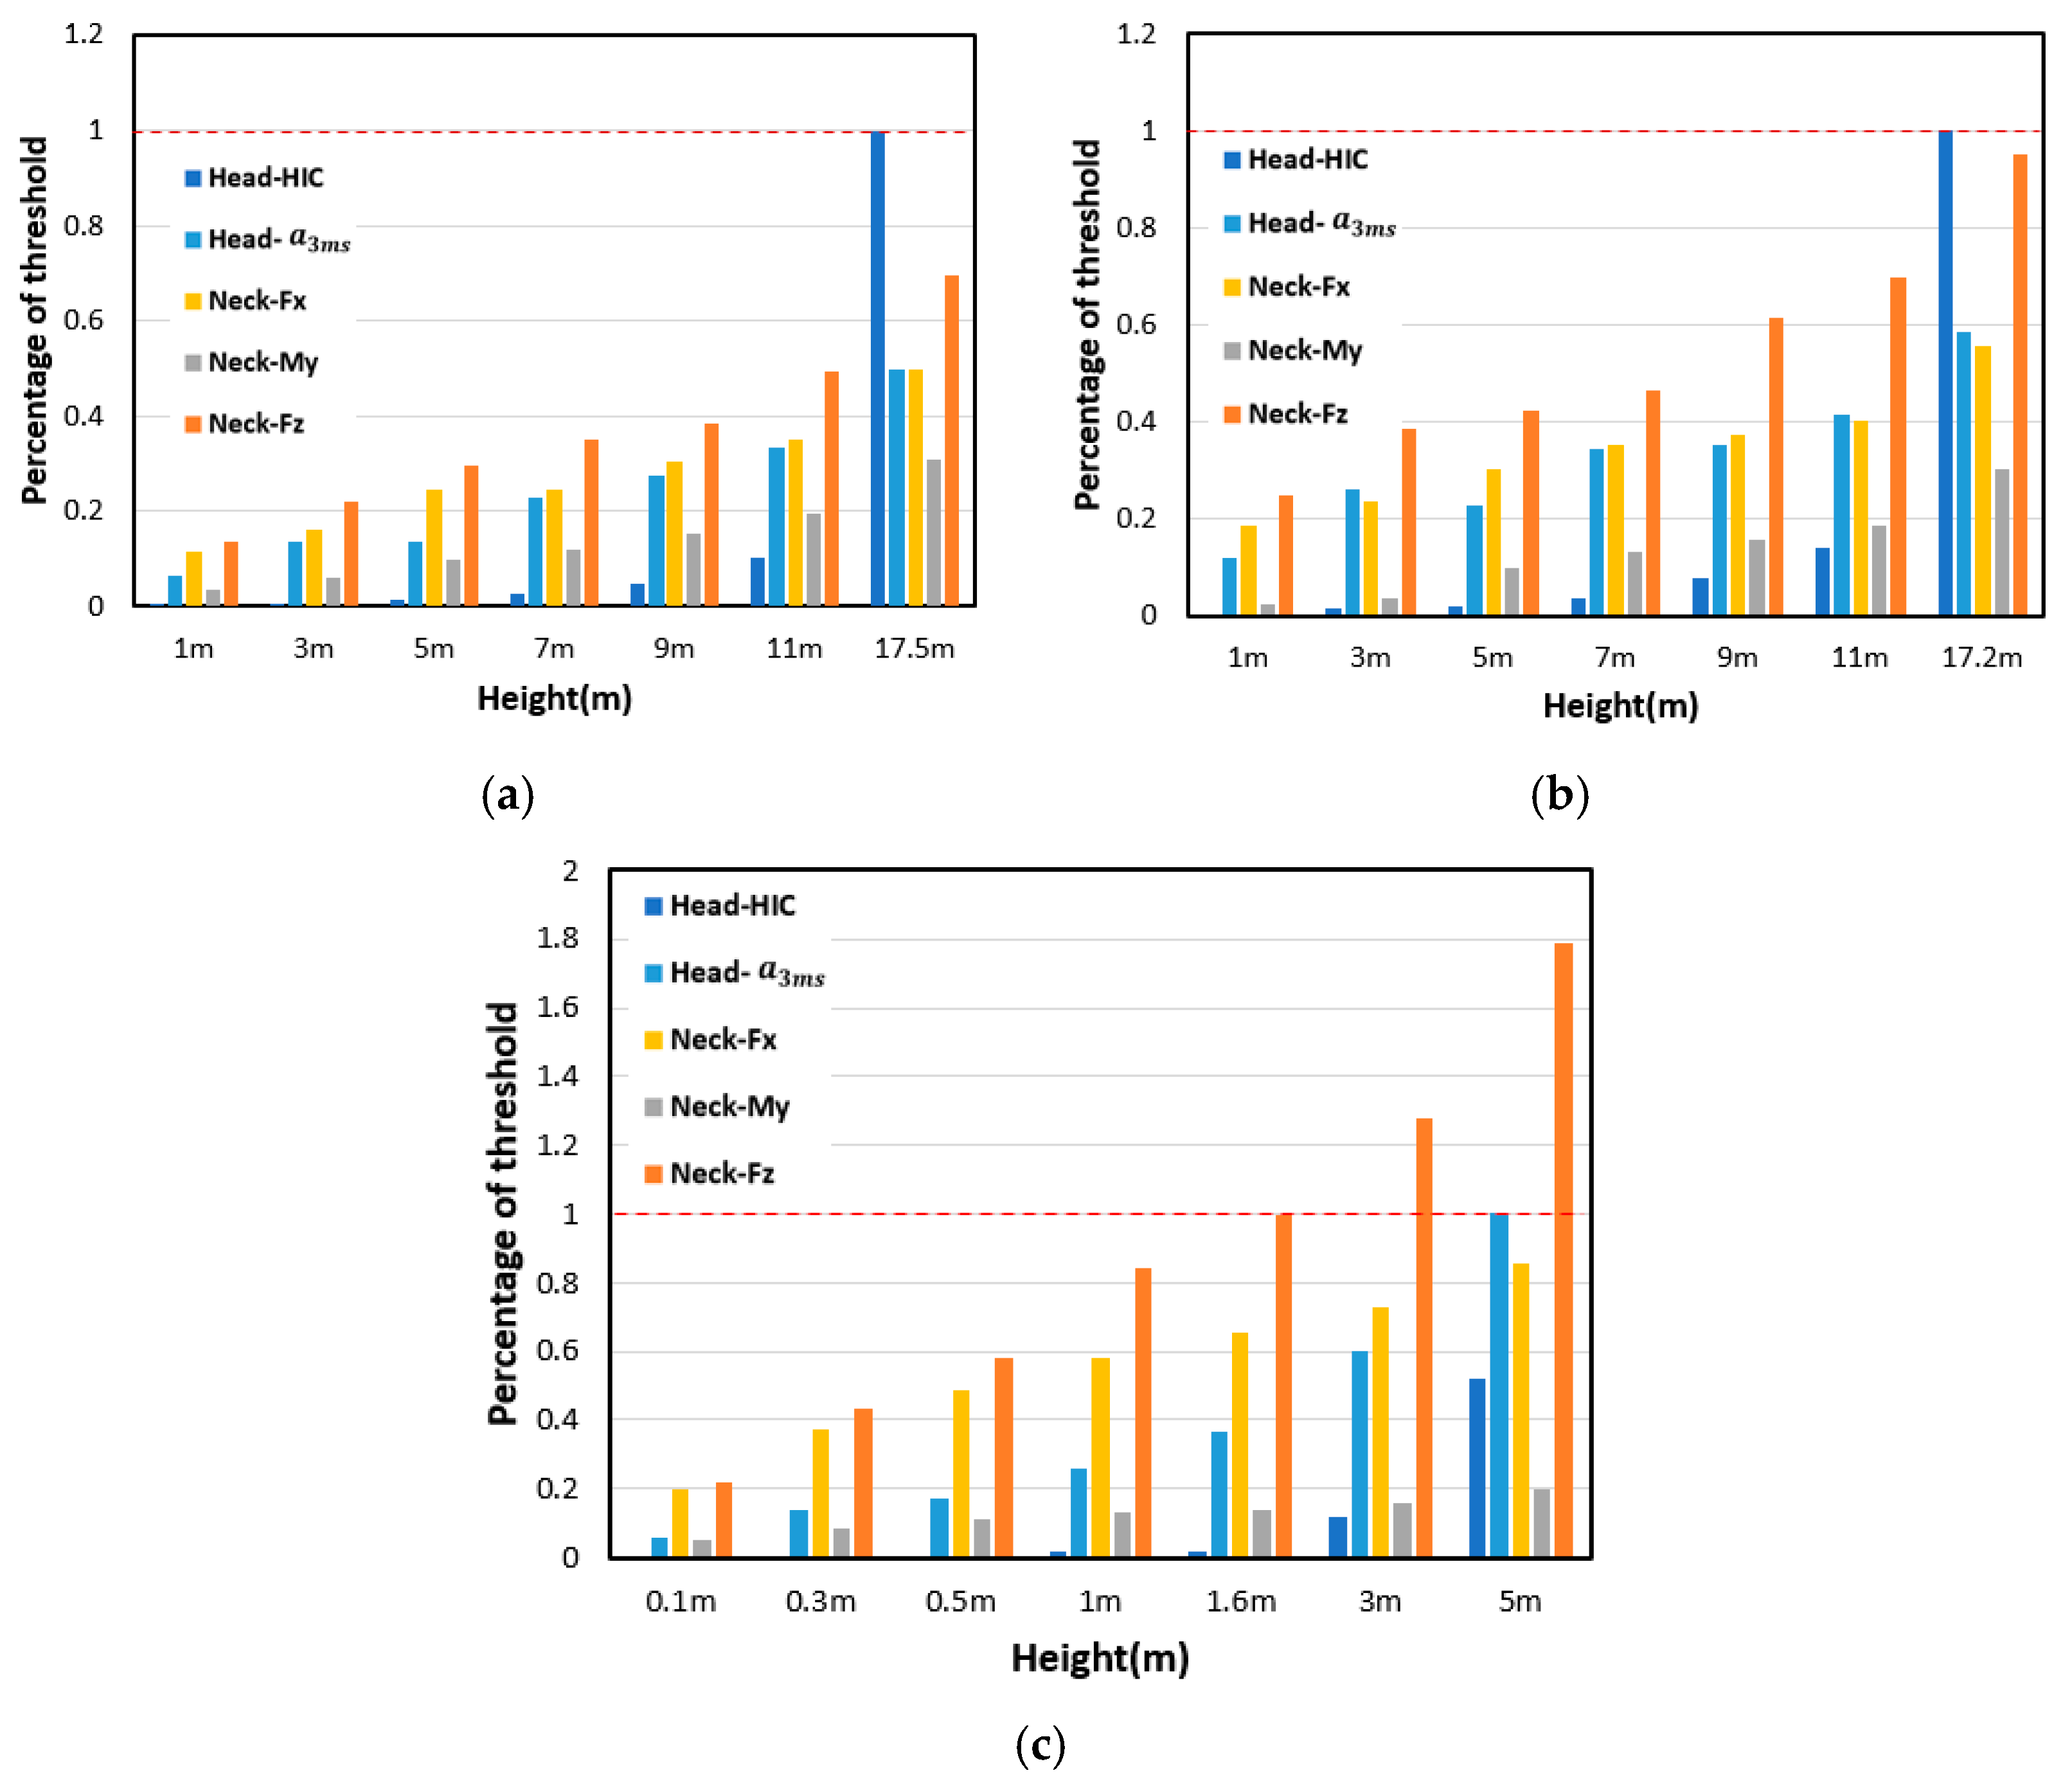
3.1. Effect of Drop Height
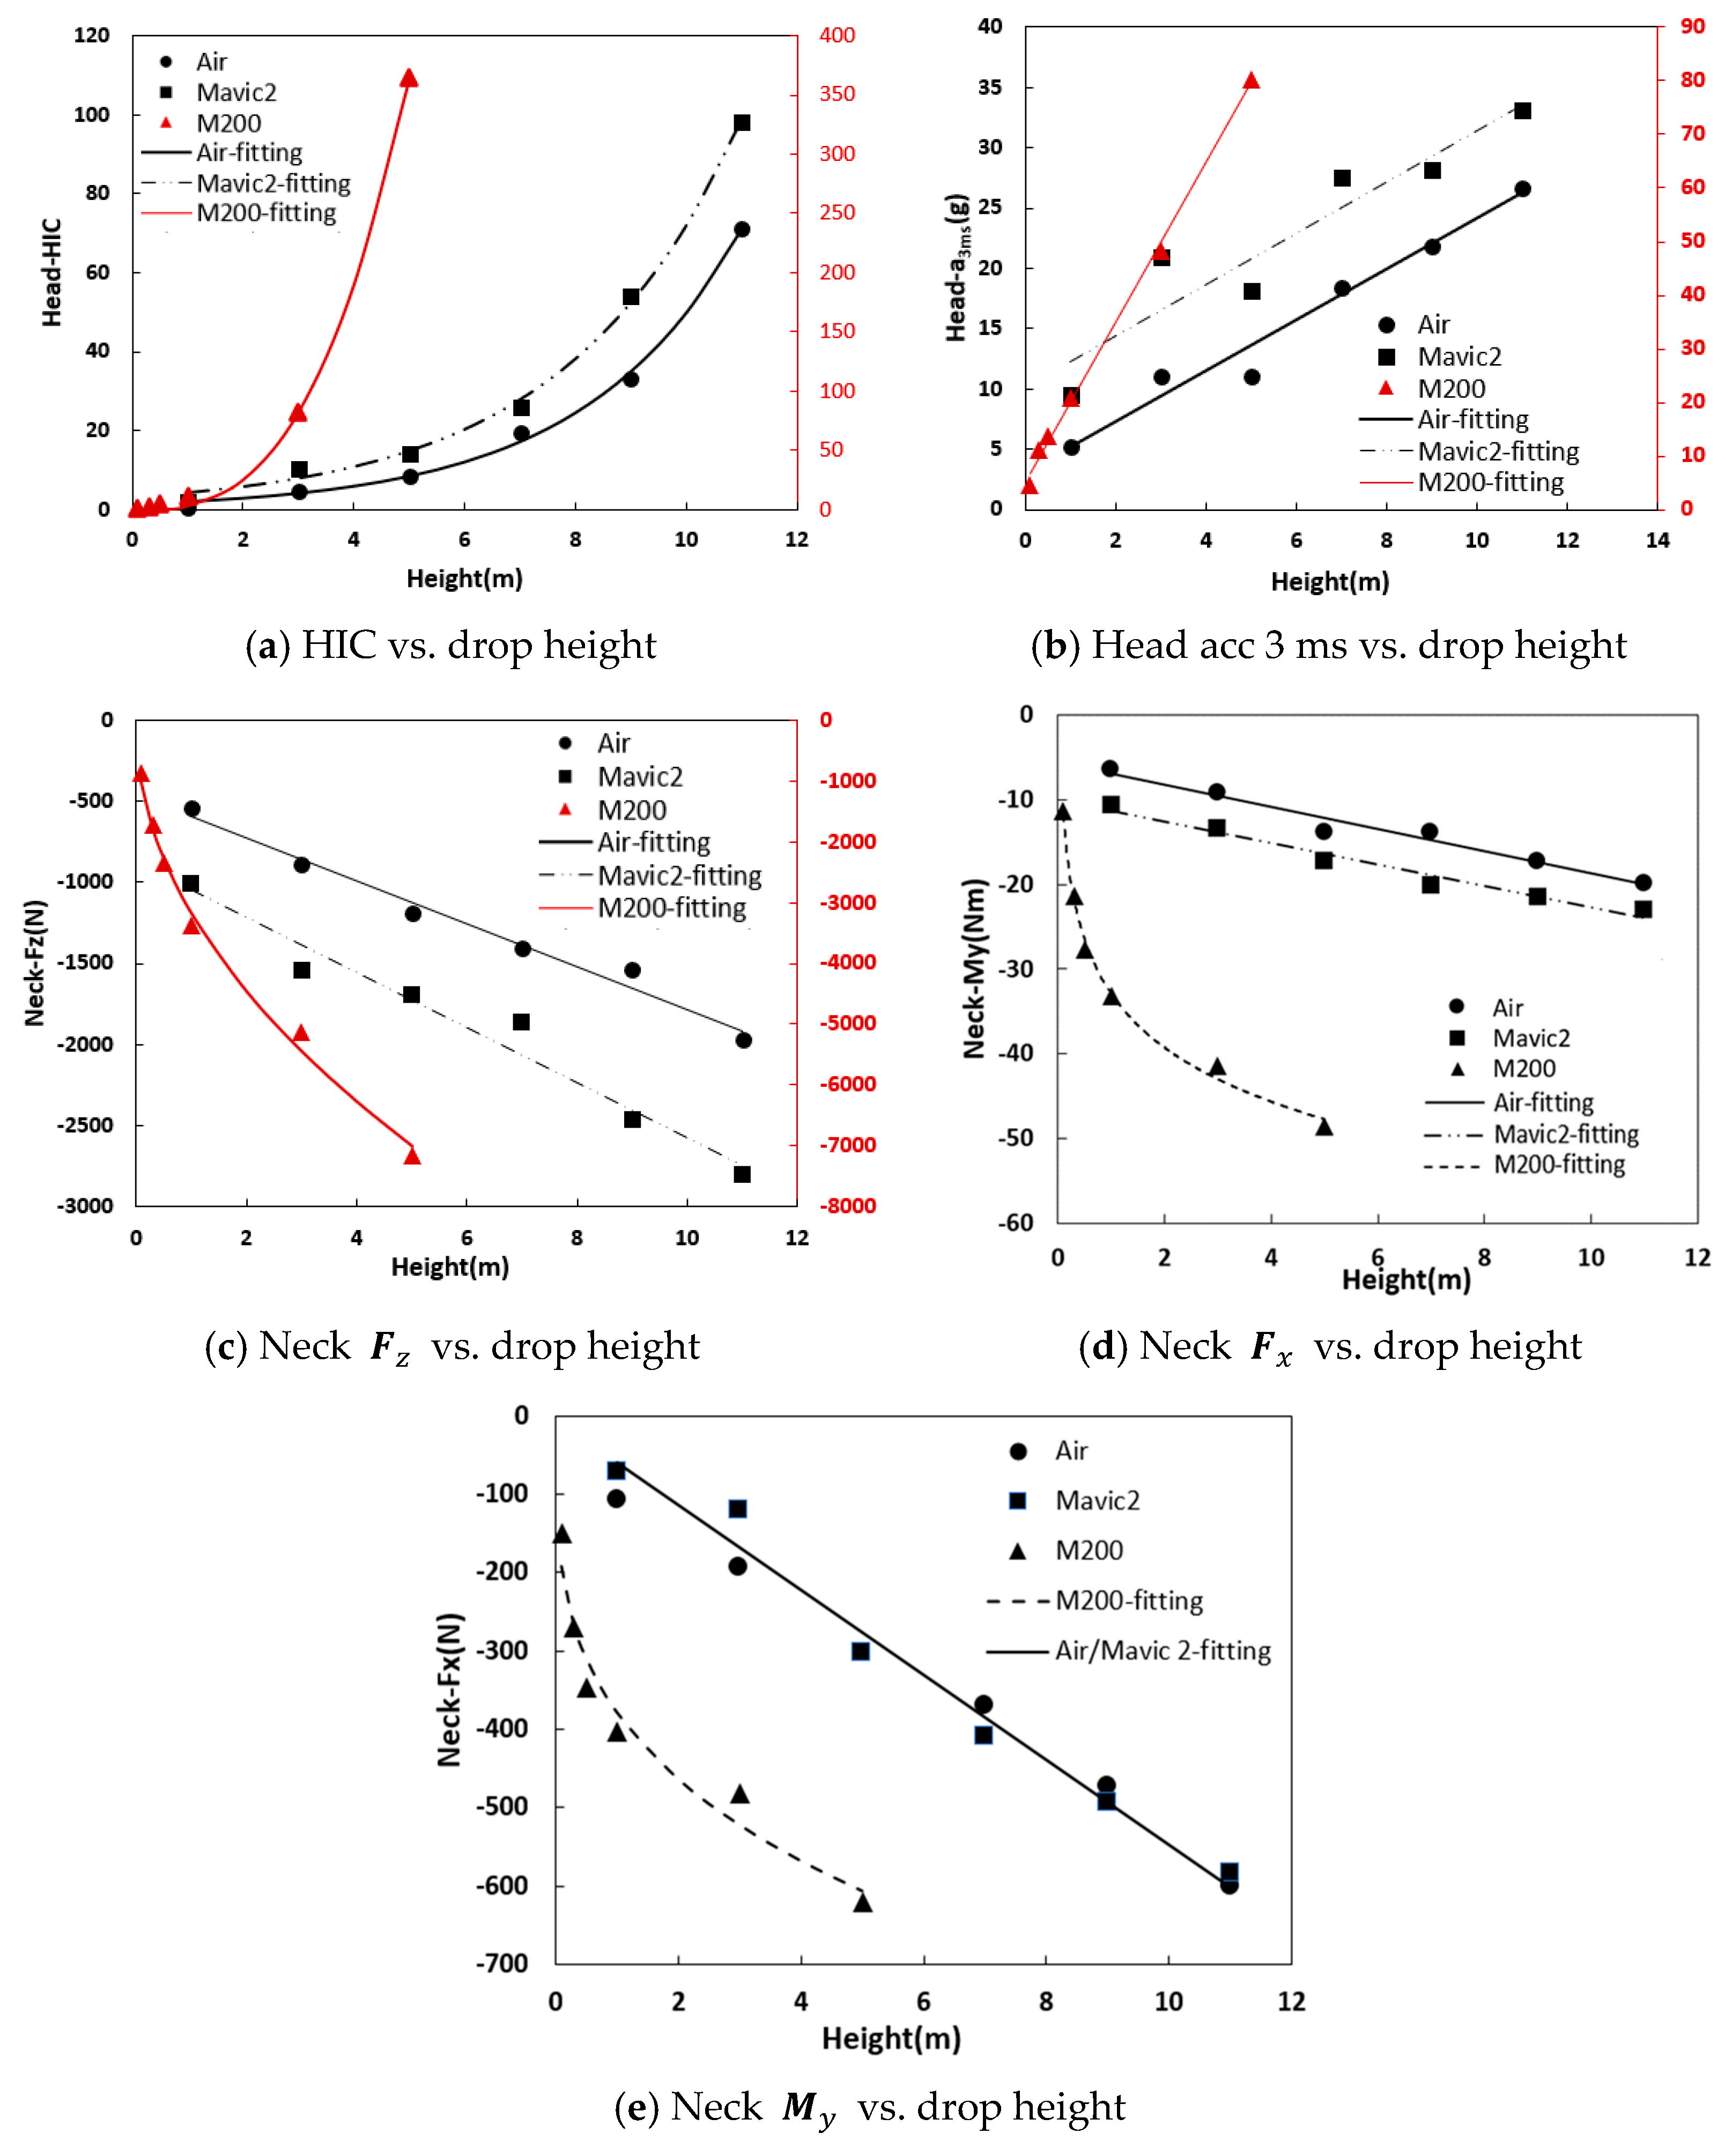
3.1.1. Experimental Results of Drones Impacting Dummy Head at Different Drop Heights
3.1.2. Analysis of Results
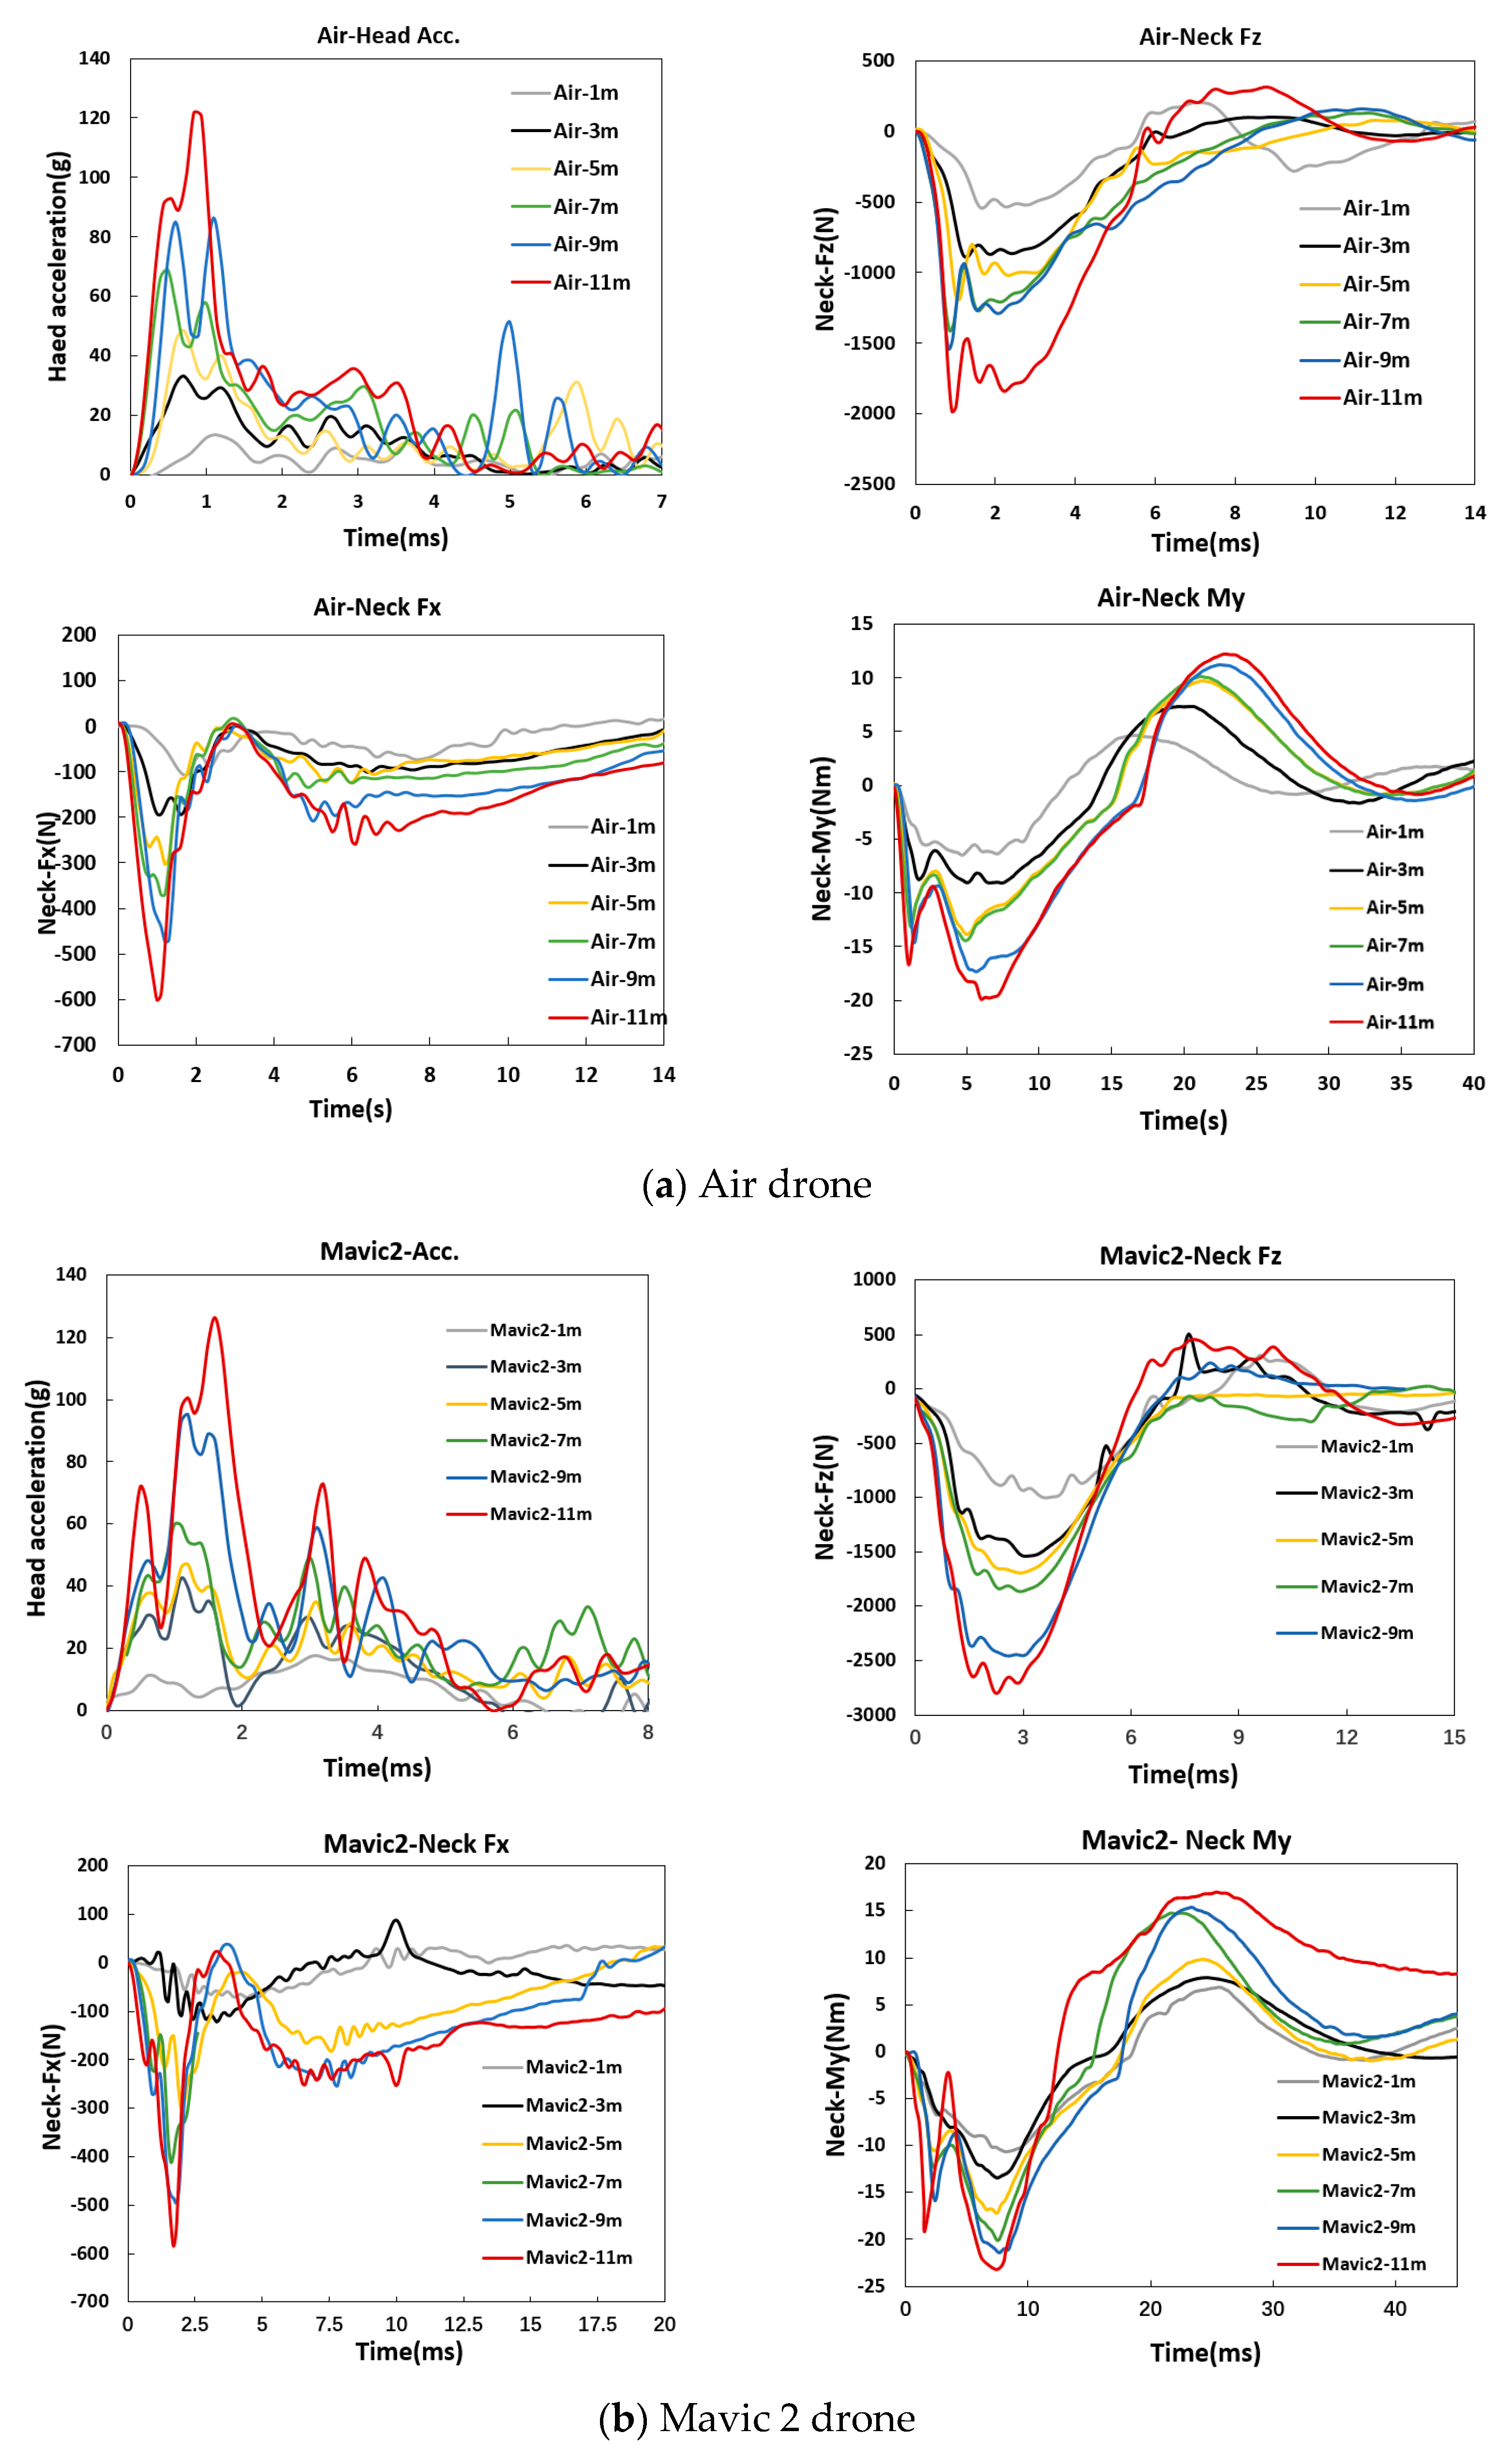
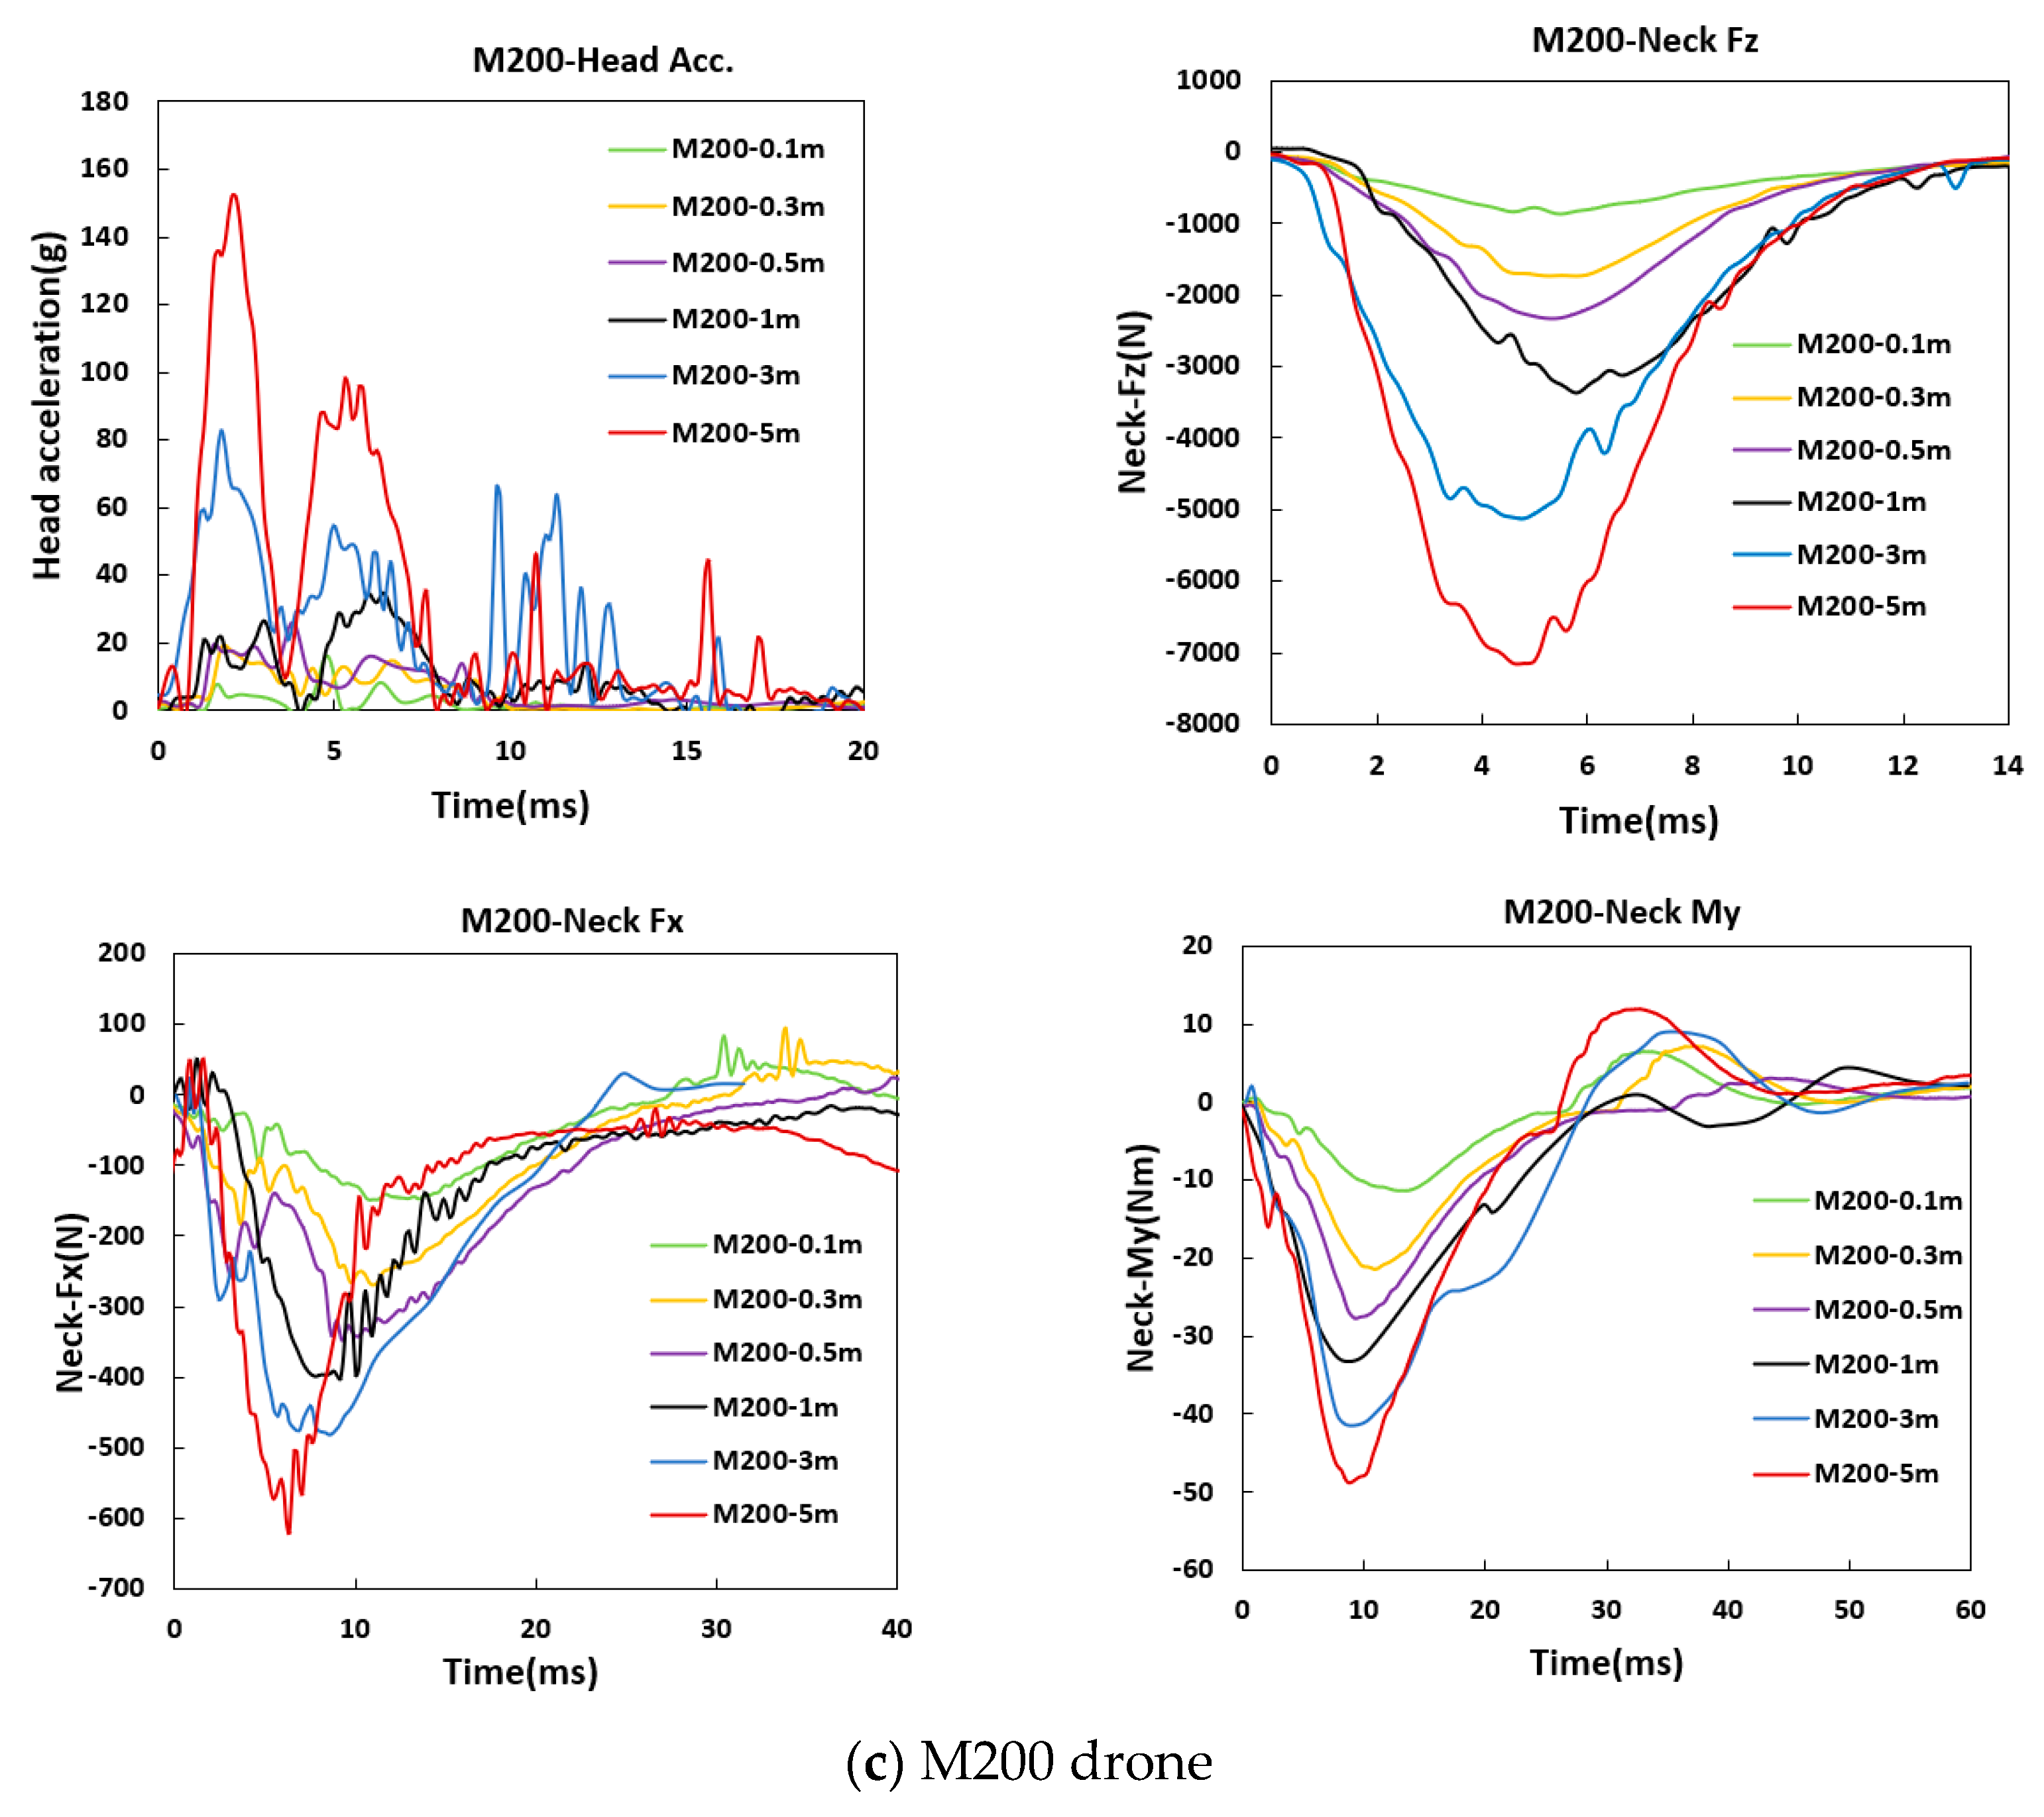
- Air drone,Mavic 2 drone,M200 drone,
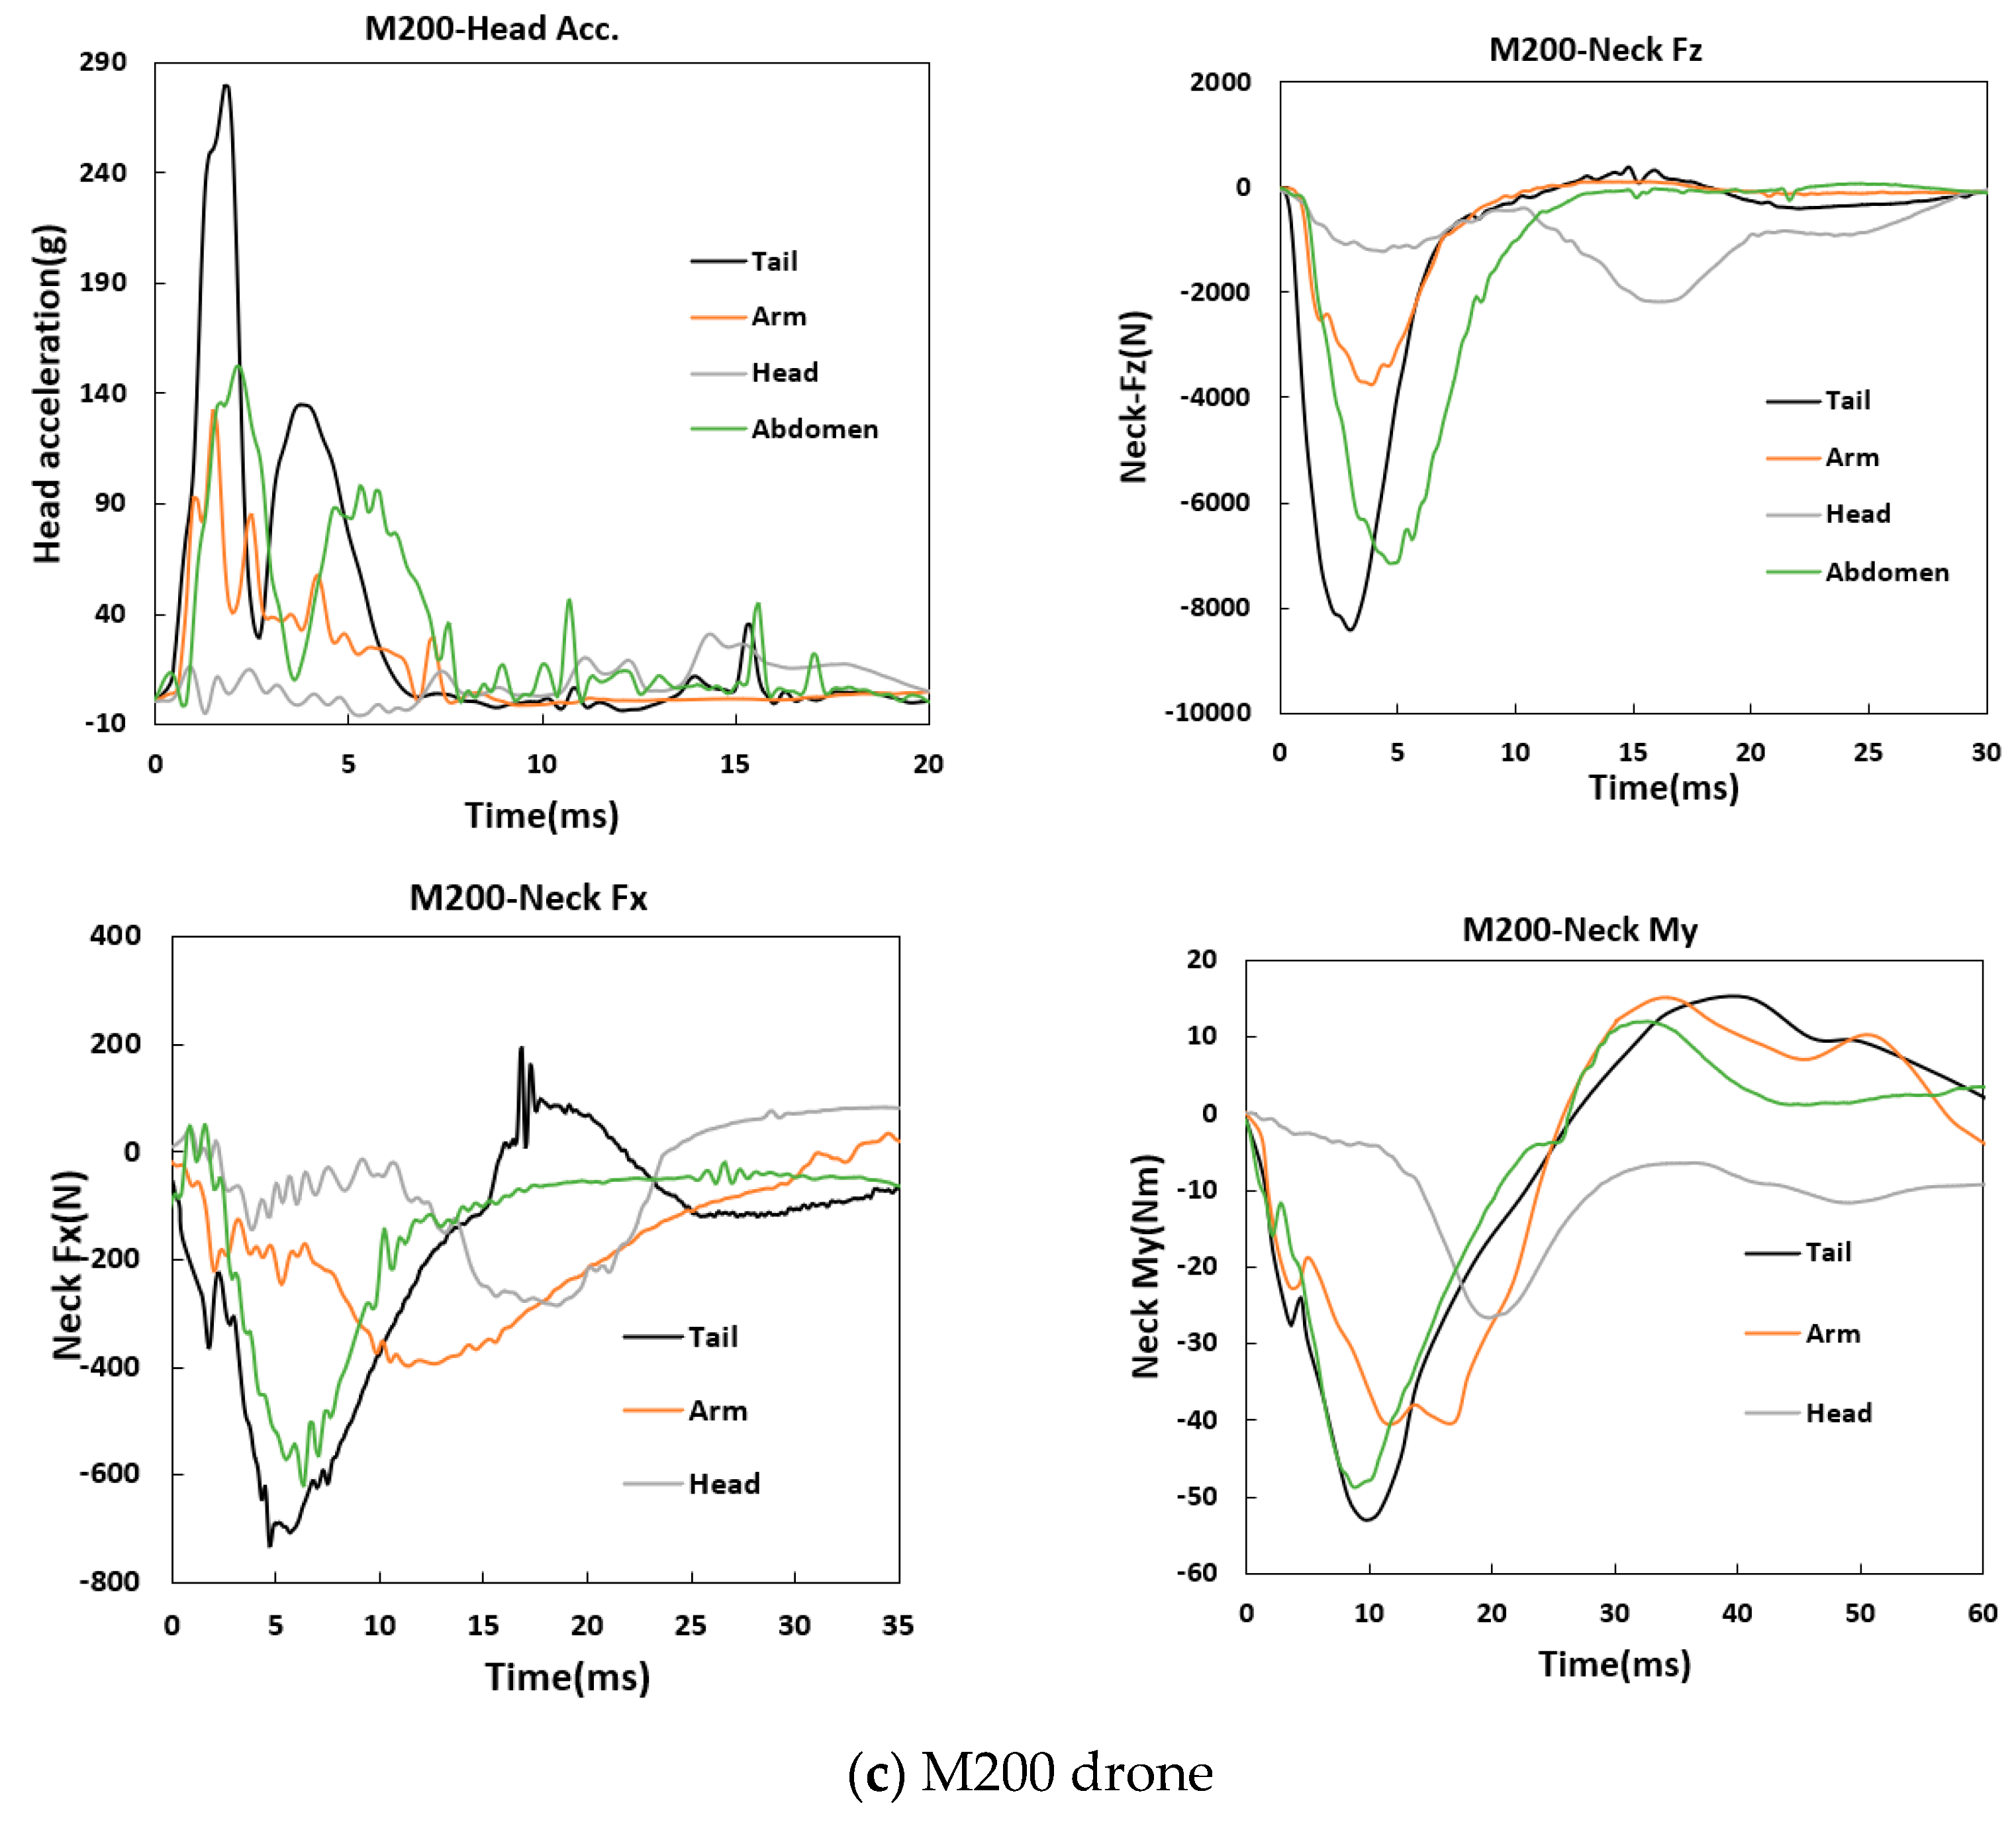
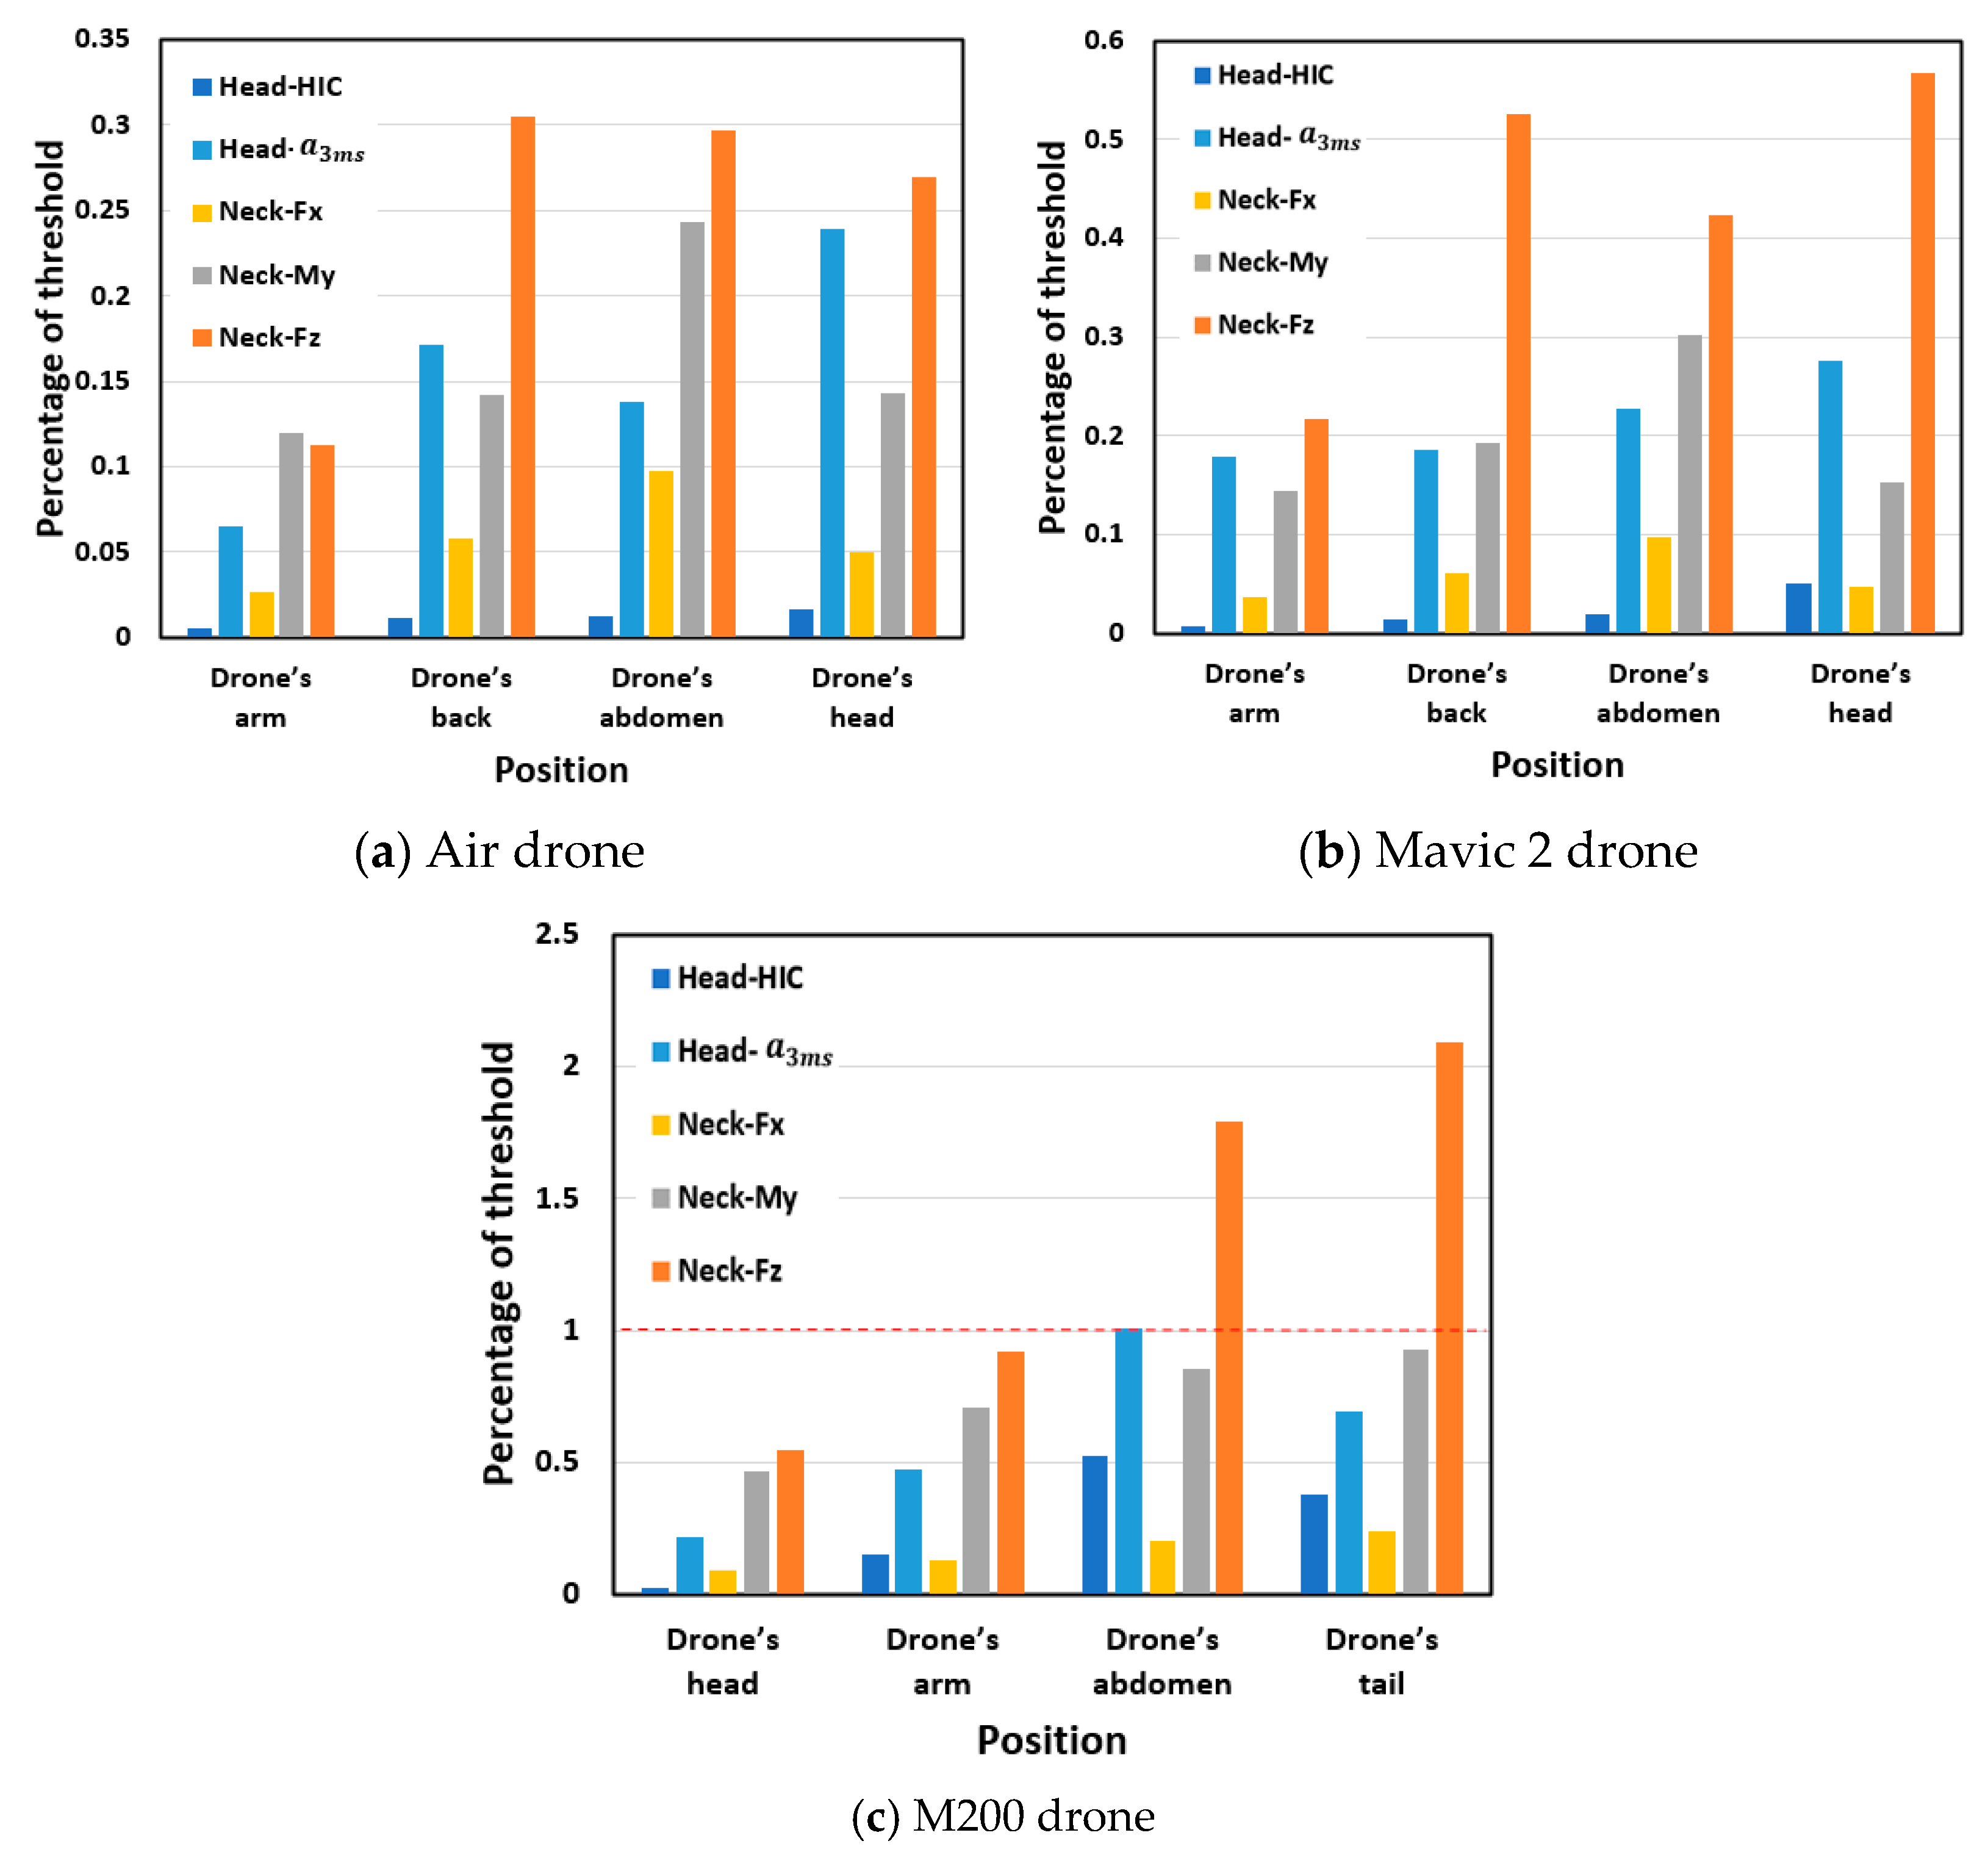
3.2. Effect of Collision Position
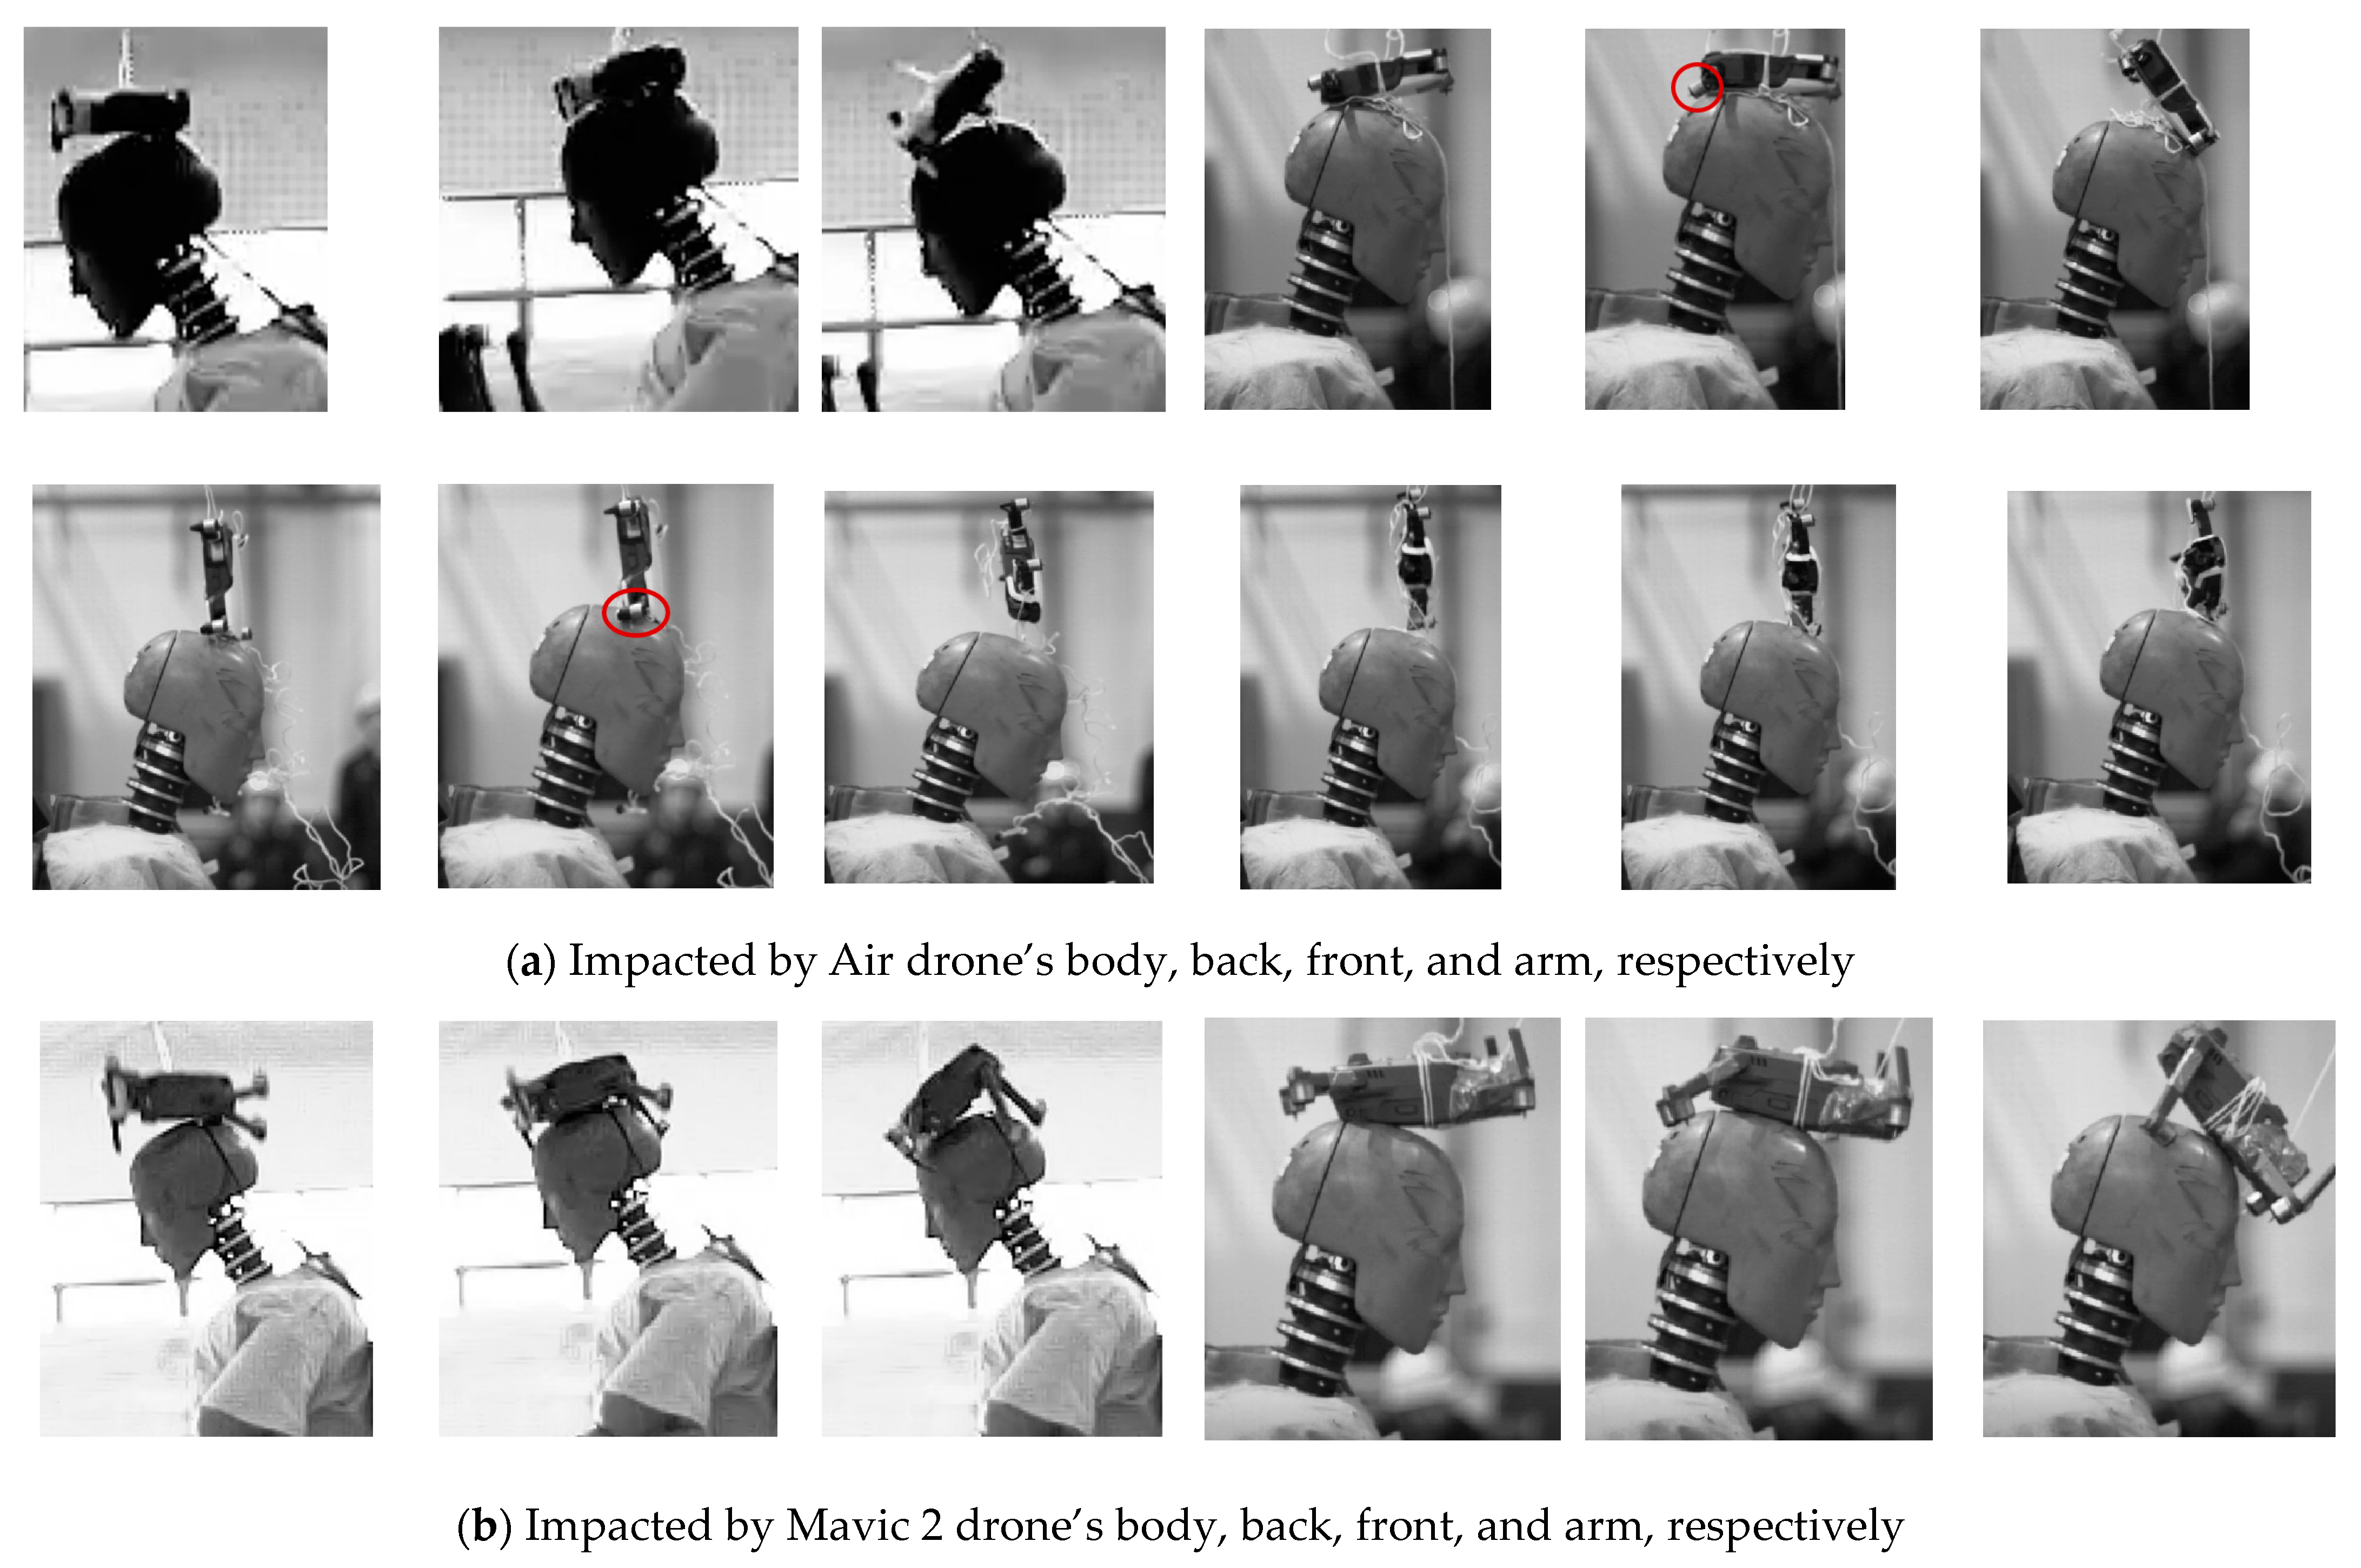
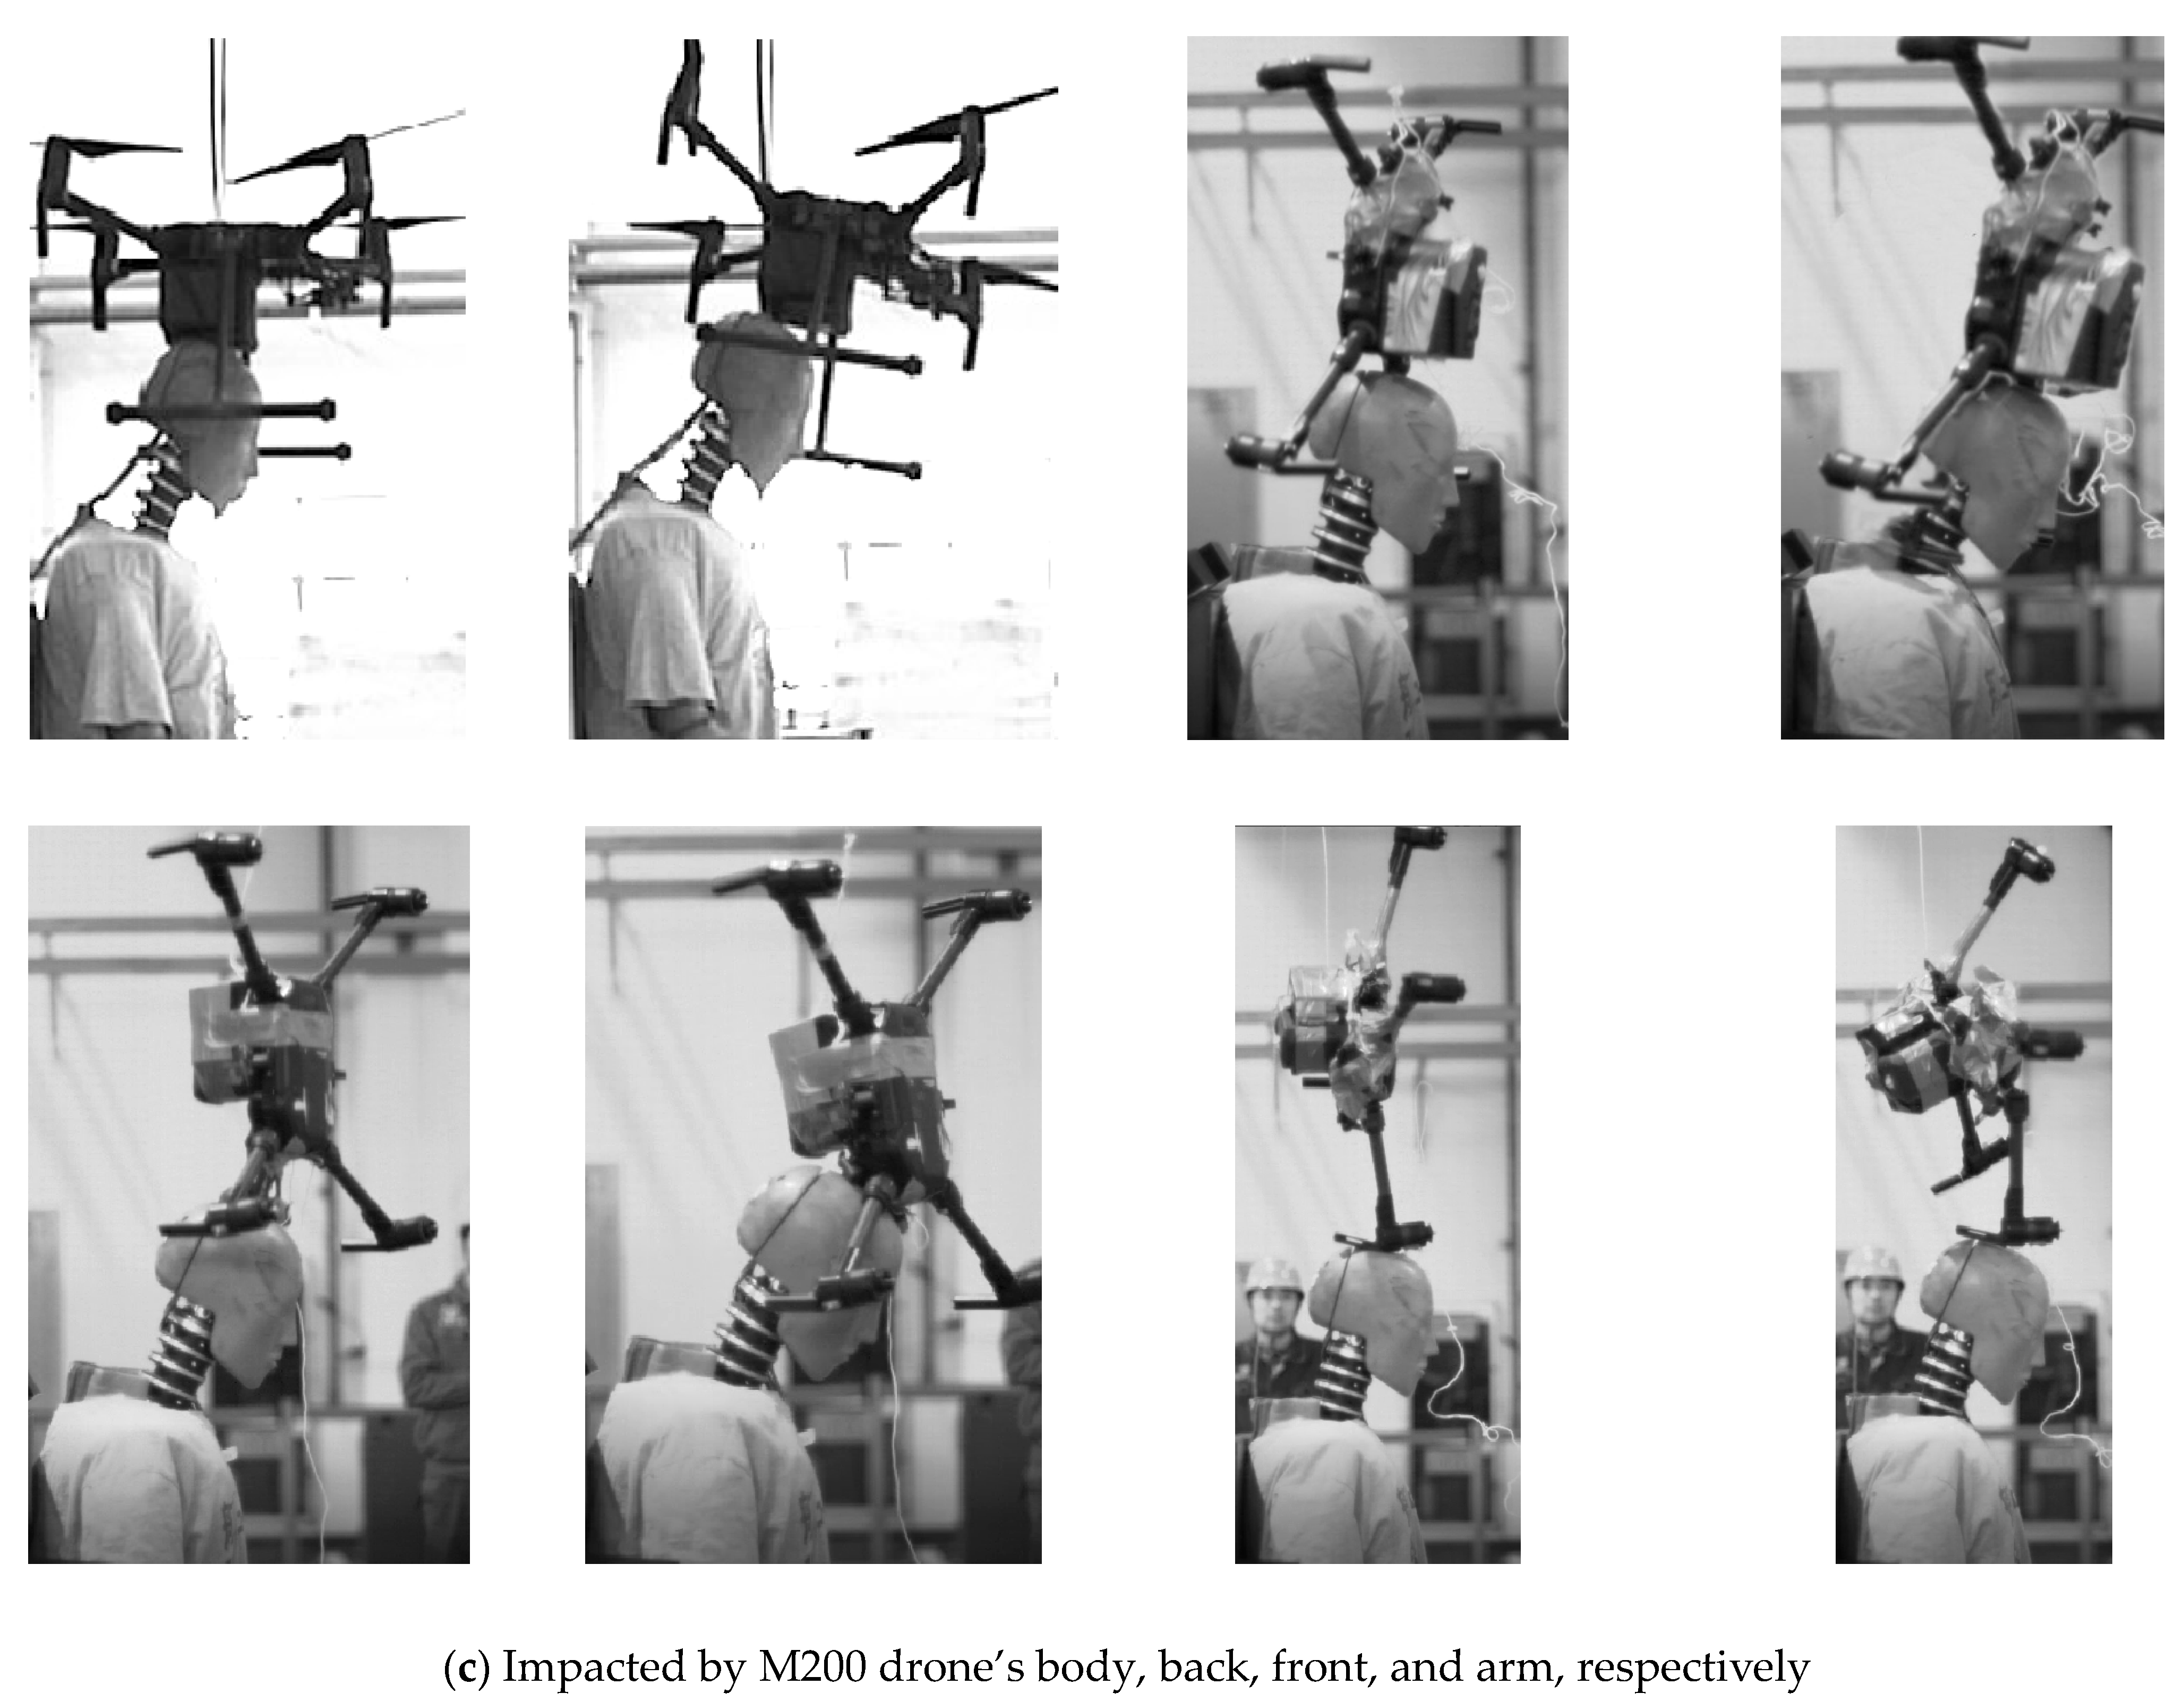
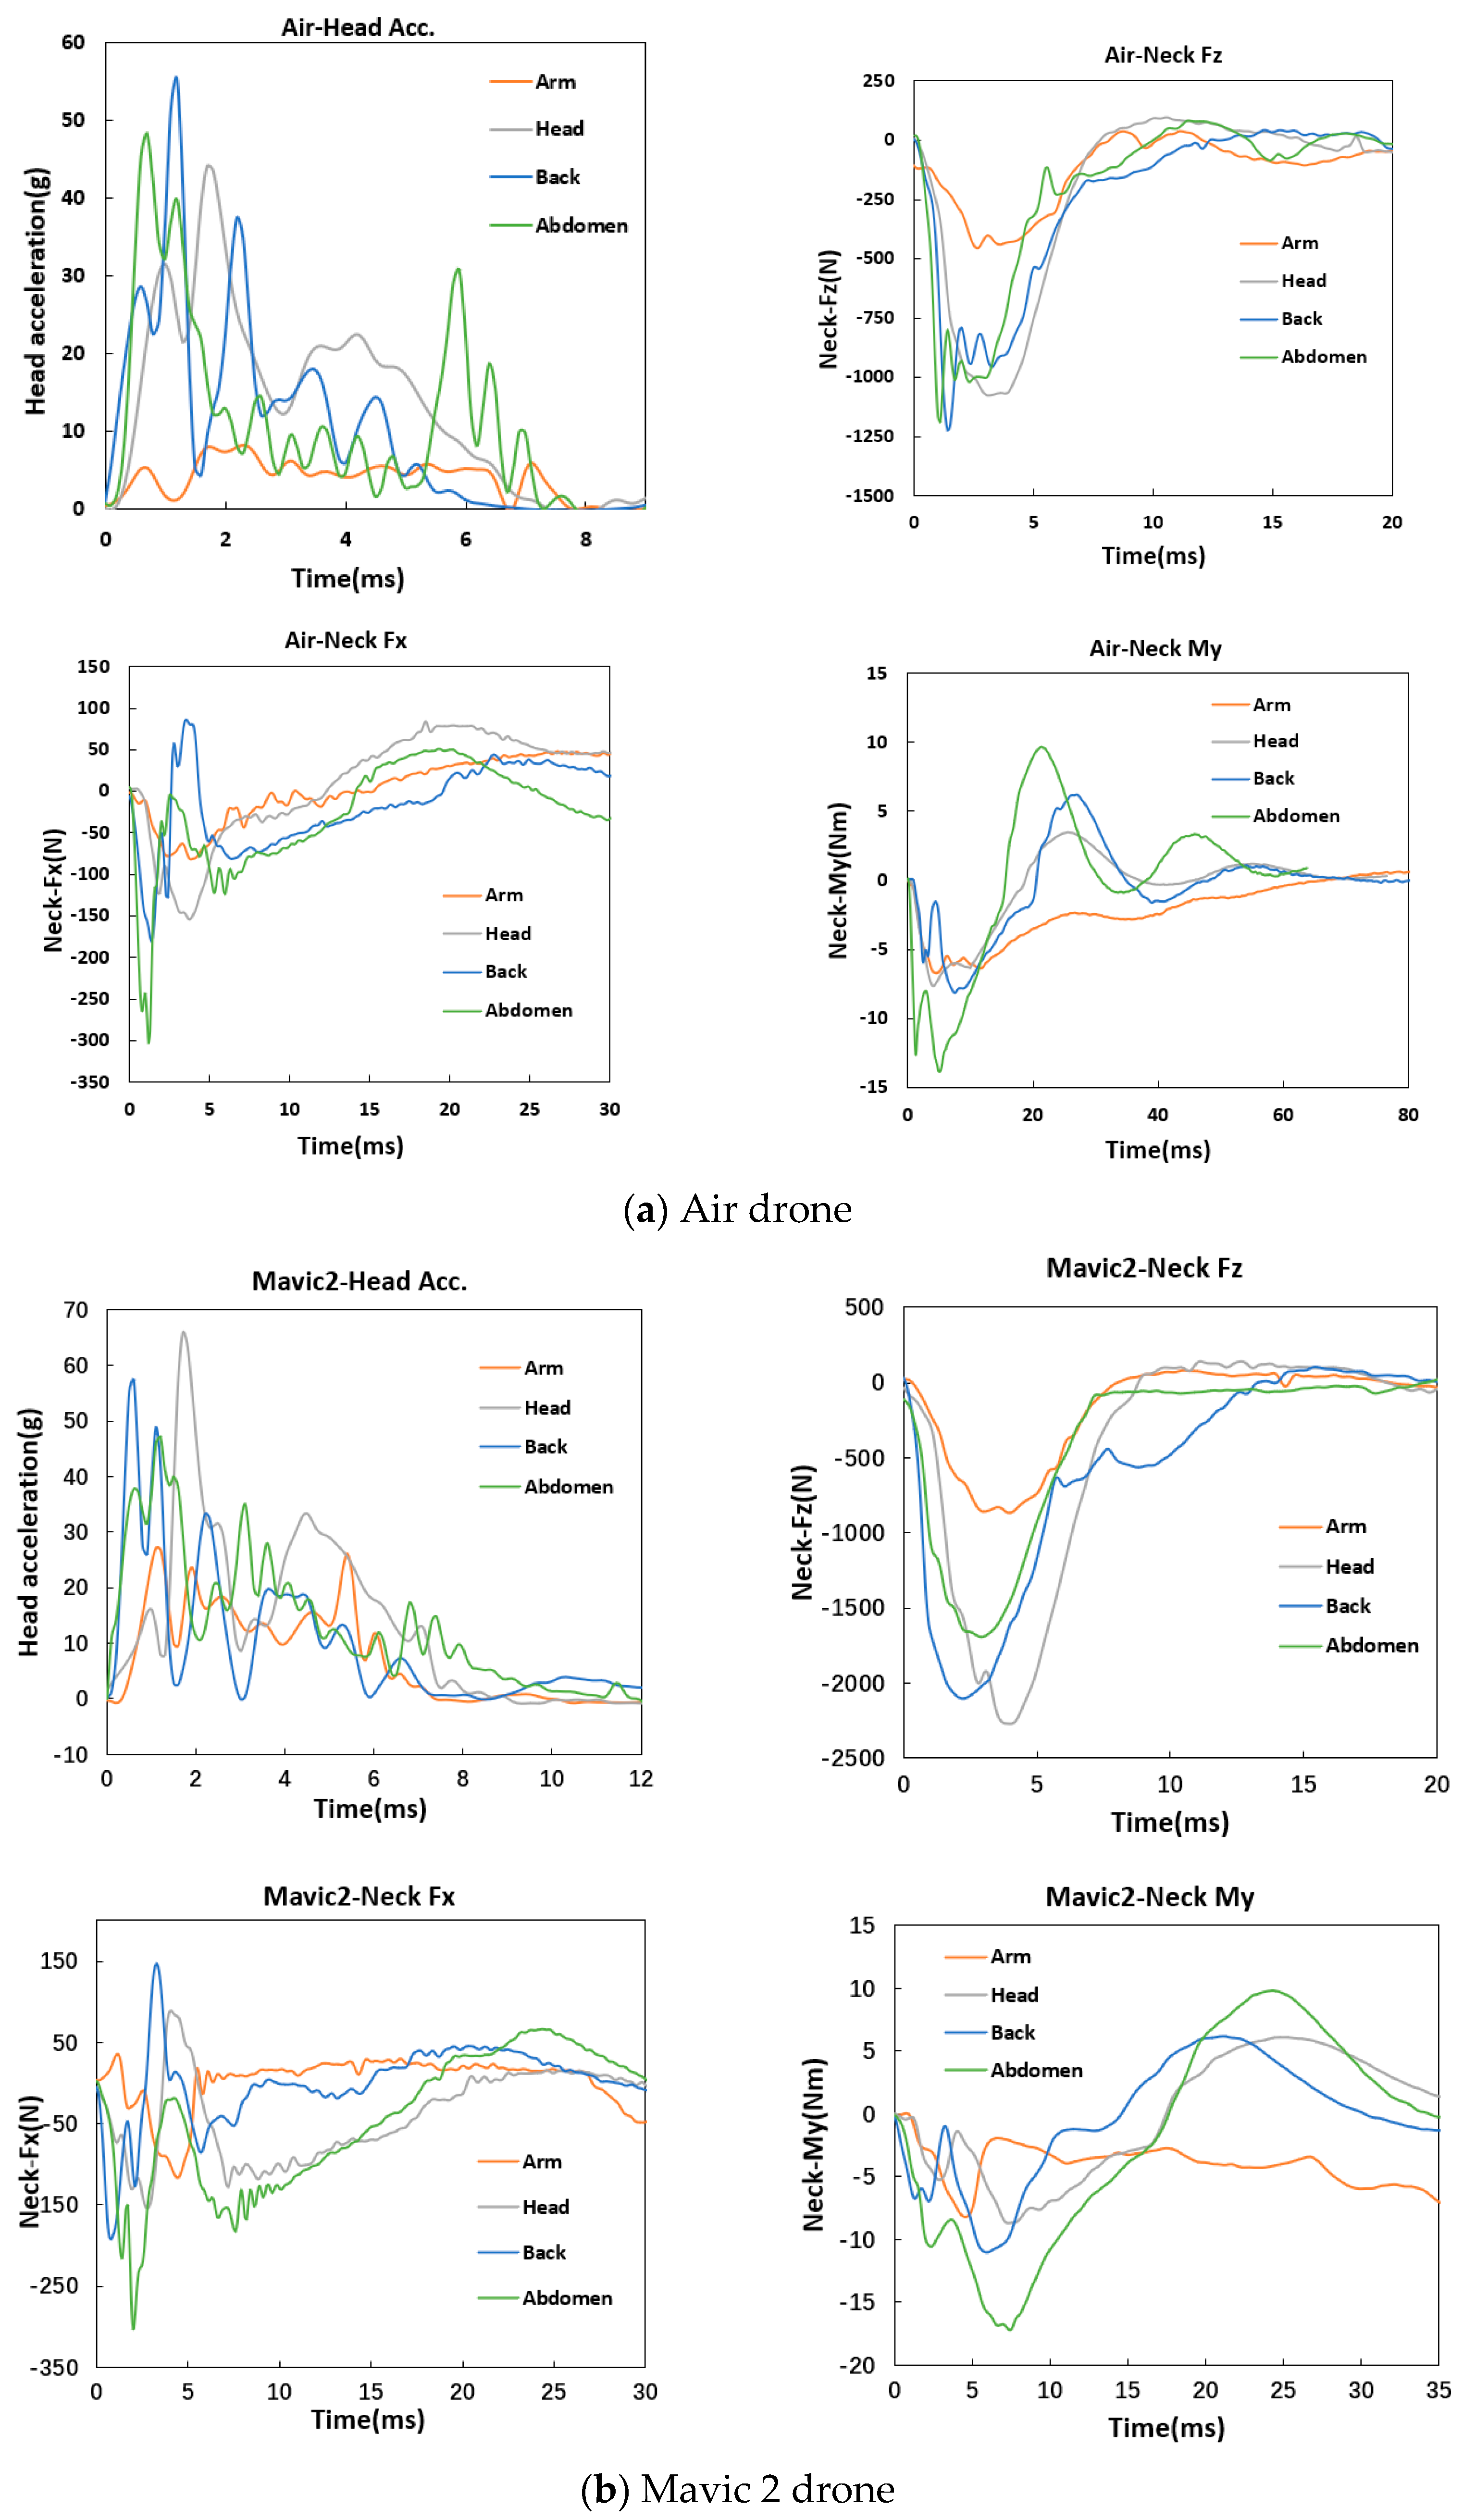
3.2.1. Experimental Results of Different Positions of Drones Impacting Dummy Head
3.2.2. Results Analysis
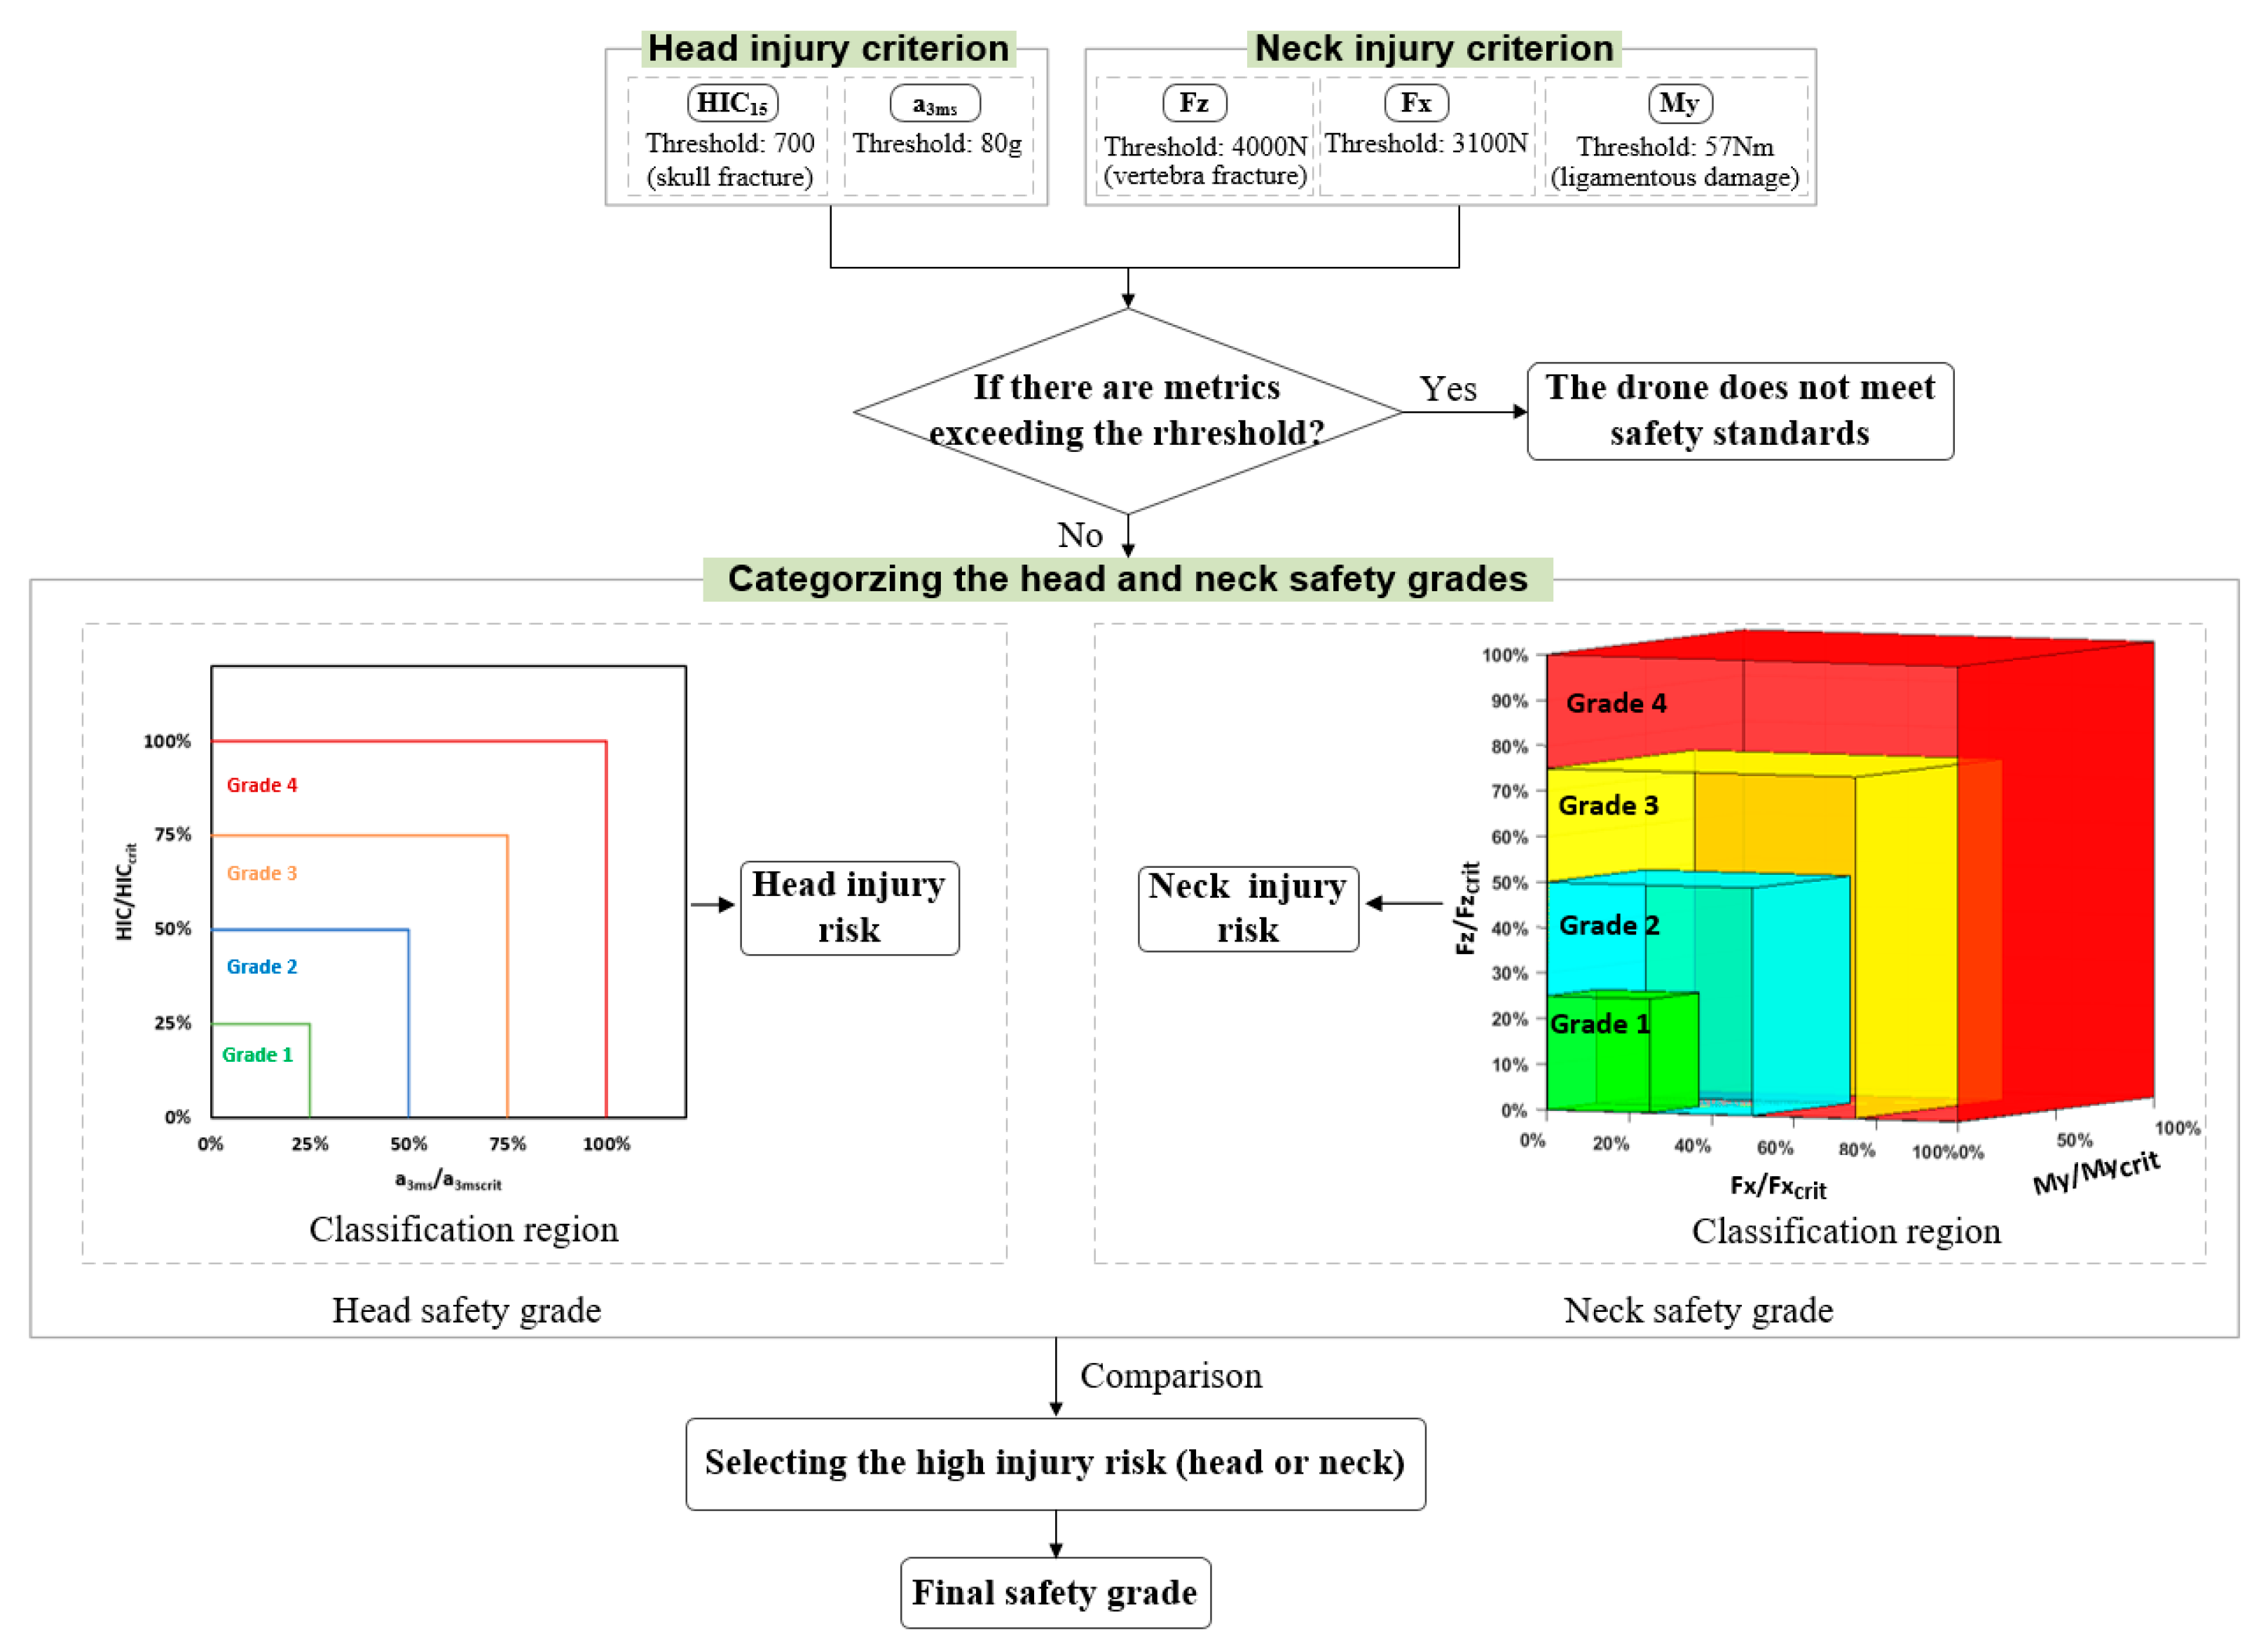
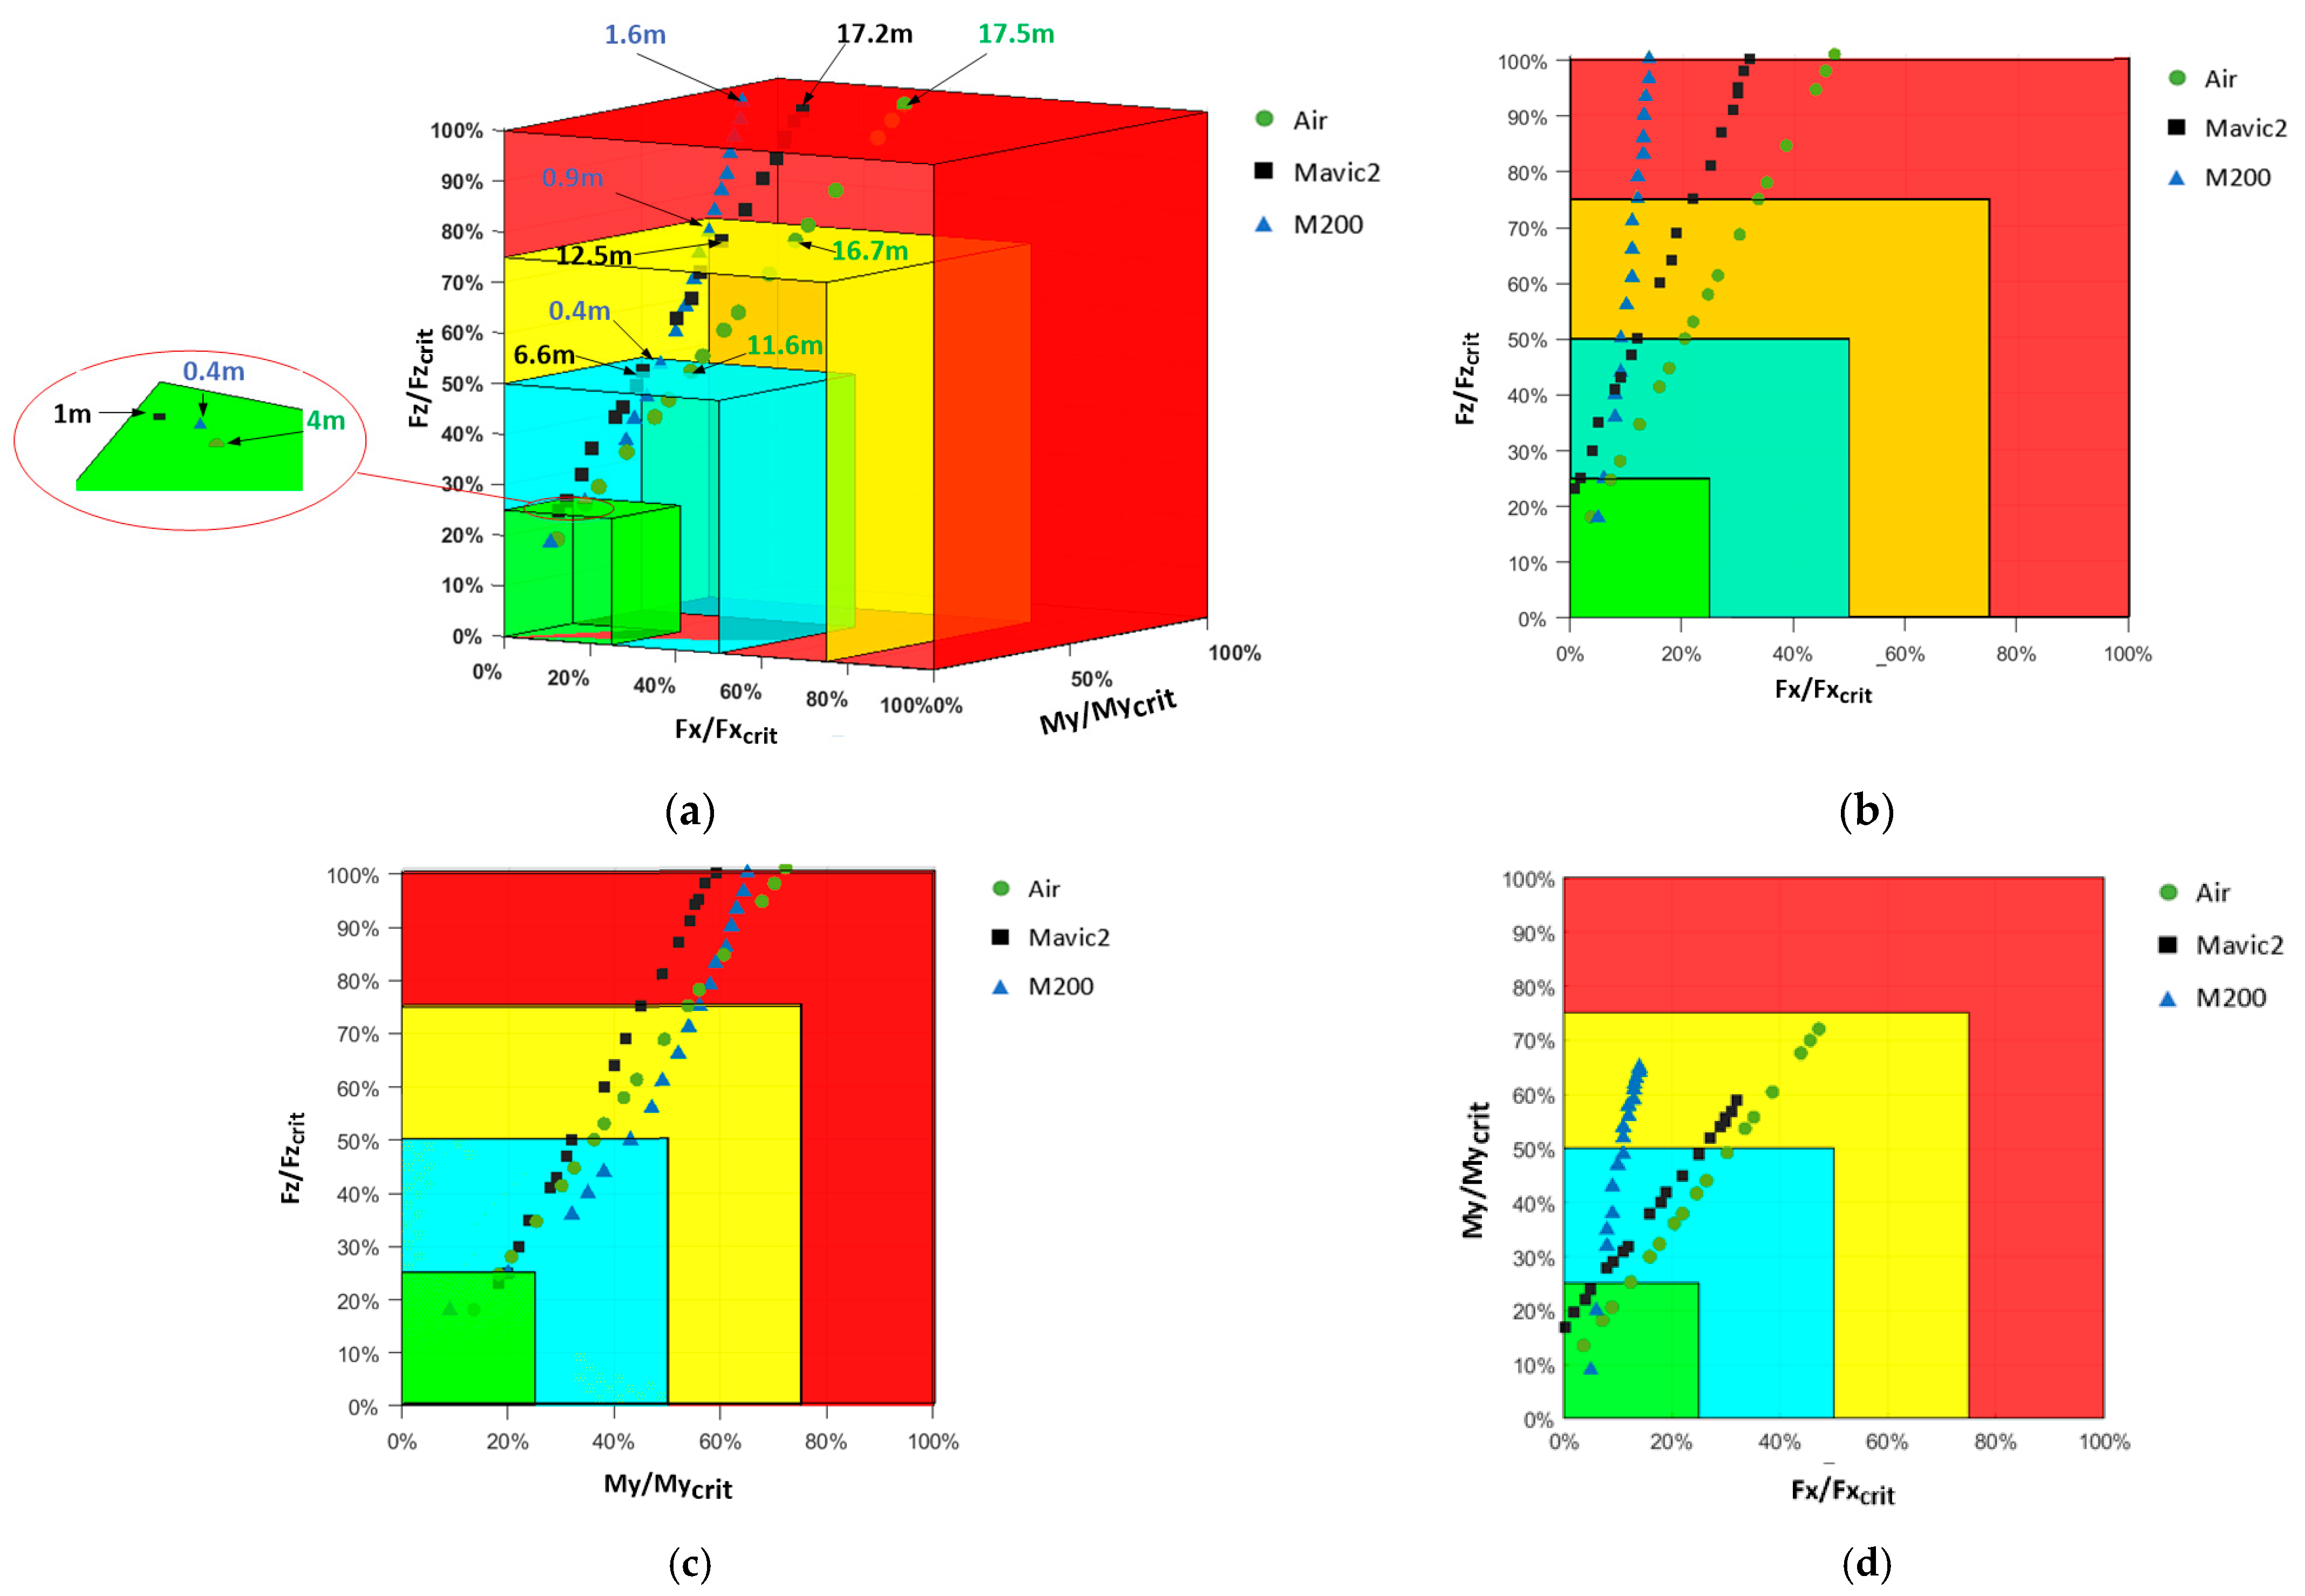
4. Safety Grade Classification of Drone Collision with Dummy
4.1. Safety Grade Classification Method Development
4.2. Safety Grade Classification for the Three Typical Drones
5. Discussion and Conclusions
- (1)
- This study is experimental in nature. While cadaver tests are considered the most accurate method for representing human responses to collisions, ethical and legal constraints make it challenging to obtain cadaver specimens for such tests. As an alternative, we conducted the drone collision tests using the crash dummy and investigated the head and neck injury risk. A limitation is that the dummy cannot be equivalent to the true human, and certain differences exist between the dummy and the true human. For example, the Hybrid III dummy’s neck exhibits high stiffness and lacks biofidelity compared to a human neck [30]. This difference can lead to deviations between the acquired head and neck dynamic responses and those of a human. However, the development of the dummy is also based on some biomechanical data, and it can be repeatedly used to conducted tests according to certain procedures, thus it is widely used in the automotive and aviation industries. While the head and neck mechanical responses measured from Hybrid III dummy-based drone collision tests may differ from those of a human in specific collision scenarios, the relative law of head and neck mechanical responses induced by different collision conditions and locations should be accurate, and can provide valuable guidance for drone safety design. It is noted that the exact corresponding relationship between the measurements obtained for a drone hit of a Hybrid III dummy to a drone hit of a true human need to be further explored in future.
- (2)
- This study presents a method for classifying the safety grades of small drones. A limitation is that the safety grades were obtained based on the head and neck responses from Hybrid III dummy instead of a human. Due to the difference existing between the dummy and a human, the safety levels assigned to small drones in this study may not fully capture the actual safety levels in collisions involving humans. Nevertheless, the method for classifying small drone safety levels is effective and the classification framework can be also appliable to humans. It is noted that the classification results based on the human results (once the data were obtained) may be varied when compared to the results based on the dummy results, which remains to be addressed in our follow-up work.
- (3)
- According to Klevien [31], brain tissue injury is more sensitive to rotational motion relative to linear motion. This is mainly due to the fact that the bulk modulus of brain tissue is about five to six orders of magnitude higher than its shear modulus, and the brain tissue strain induced by rotational loading is more sensitive when a head collision occurs. Head linear dynamics (e.g., linear acceleration, impact force, and HIC) primarily correlate with skull fractures and are insufficient for evaluating brain injuries resulting from rotational motion. Such rotational injuries, which constitute the majority of brain injuries, include concussion, diffuse axonal injury, contusion (in absence of skull fracture), subdural hematoma, and intra-cerebral hematoma. This is a limitation of this study because no angular kinematics were collected, although head rotation is small under vertical drop. Next step, head rotational dynamics under various collision conditions (e.g., frontal, rear, and oblique collisions) between UAVs and human heads should be collected and analyzed to investigate brain injury.
- (1)
- The variation law of the injury metrics of the dummy head and neck with drop height was obtained. As the drop height of the drones increases, the HIC and head acc. 3 ms metrics exhibited exponential and linear growth, respectively, with increasing drop height for all drones. However, the M200 drone exhibited a notably faster increase rate in the HIC and head acc 3 ms upon impact than the Air and Mavic 2 drones. As for neck injury, the three metrics (, , and ) for the Air and Mavic 2 drones increased linearly with increasing drop height. In contrast, the M200 drone presented a power function relation for and , and a logarithmic relationship for .
- (2)
- The impact positions of the drone also affect the dummy’s head and neck responses. For the Air and Mavic 2 drones, the head and neck responses from drone’s body, back, and front collisions were similar, while those from drone’s arm collisions were significantly lower. In the case of the M200 drone, the head and neck responses from the drone’s body and tail collisions were significantly higher than those from the drone’s front and arm collisions. In particular, when the M200 drone’s body or tail impacted the dummy vertically from a height of 5 m, the neck axial force exceeded the safety threshold.
- (3)
- Four safety grades were classified according to the injury metrics of the dummy vertically impacting the drones, and the drop height ranges corresponding to the different safety grades were further determined.
Author Contributions
Funding
Data Availability Statement
Acknowledgments
Conflicts of Interest
References
- Stevenson, J.D.; O’Young, S.; Rolland, L. Assessment of alternative manual control methods for small unmanned aerial vehicles. J. Unmanned Veh. Syst. 2015, 3, 73–94. [Google Scholar] [CrossRef]
- Jenkins, D.; Vasigh, B. The Economic Impact of Unmanned Aircraft Systems Integration in the United States; Association for Unmanned Vehicle Systems International (AUVSI): Arlington, VA, USA, 2013. [Google Scholar]
- Ruchti, J.; Senkbeil, R.; Carroll, J.; Dickinson, J.; Holt, J.; Biaz, S. Unmanned aerial system collision avoidance using artificial potential fields. J. Aerosp. Inform. Syst. 2014, 11, 140–144. [Google Scholar] [CrossRef]
- Shelley, A.V. A model of human harm from a falling unmanned aircraft: Implications for UAS regulation. Int. J. Aviat. Aeronaut. Aerosp. 2016, 3, 1. [Google Scholar] [CrossRef]
- FAA. Part 107 Small Unmanned Aircraft Regulations; FAA: Washington, DC, USA, 2016. [Google Scholar]
- Civil Aviation Adminstration of China. Operation Regulations for Light and Small UAVs (Trial); Civil Aviation Administration of China: Beijing, China, 2015. (In Chinese) [Google Scholar]
- Civil Aviation Adminstration of China. Regulations on the Management of Flight Dynamic Data of Light and Small Civil UAVs; Civil Aviation Administration of China: Beijing, China, 2019. (In Chinese) [Google Scholar]
- Low, K.H. An initial parametric study of weight and energy thresholds for falling unmanned aerial vehicles (UAVs). In Proceedings of the 2017 Workshop on Research, Education and Development of Unmanned Aerial Systems (RED-UAS), Linköping, Sweden, 3–5 October 2017; pp. 240–245. [Google Scholar]
- Henderson, J. Lethality Criteria for Debris Generated from Accidental Explosions; Ministry of Defence: London, UK, 2010. [Google Scholar]
- Radi, A. Human Injury Model for Small Unmanned Aircraft Impacts; Monash University: Melbourne, Australia, 2013. [Google Scholar]
- Courharbo, A.L. Mass threshold for “harmless” drones. Int. J. Micro Air Veh. 2016, 9, 77–92. [Google Scholar] [CrossRef]
- Weng, Y.; Bian, K.; Gunasekaran, K.; Gholipour, J.; Vidal, C.; Mao, H. Modeling small remotely piloted aircraft system to head impact for investigating craniocerebral response. J. Biomech. 2021, 128, 110748. [Google Scholar] [CrossRef]
- Arterburn, D.; Olivares, G.; Bolte, J.; Prabhu, R.; Duma, S. Alliance for System Safety of UAS Through Research Excellence (ASSURE). Task A14: UAS Ground Collision Severity Evaluation 2017–2019; Federal Aviation Administration: Washington, DC, USA, 2019. [Google Scholar]
- Rattanagraikanakorn, B.; Gransden, D.I.; Schuurman, M.; De Wagter, C.; Happee, R.; Sharpanskykh, A.; Blom, H.A.P. Multibody system modelling of unmanned aircraft system collisions with the human head. Int. J. Crashworthiness 2020, 25, 689–707. [Google Scholar] [CrossRef]
- Rattanagraikanakorn, B.; Schuurman, M.; Gransden, D.I.; Happee, R.; De Wagter, C.; Sharpanskykh, A.; Blom, H.A. Modelling head injury due to unmanned aircraft systems collision: Crash dummy vs human body. Int. J. Crashworthiness 2022, 27, 400–413. [Google Scholar] [CrossRef]
- Li, R.; Li, Z.; Lan, H.; Bai, C.; Guo, Y.; Wang, Y.; Wang, J.; Liu, X.; Yang, Z. Study on the head and neck injury risk impacted by UAV: Effect of impact velocity, angle, location, and mass. Int. J. Crashworthiness 2023, 29, 482–494. [Google Scholar] [CrossRef]
- Koh, C.H.; Deng, C.; Li, L.; Zhao, Y.; Tan, S.K.; Chen, Y.; Yeap, B.C.; Li, X.; Low, K.H. Experimental and simulation weight threshold study for safe drone operations. In Proceedings of the 2018 AIAA Information Systems-AIAA Infotech@Aerospace, Kissimmee, FL, USA, 8–12 January 2018. [Google Scholar]
- Koh, C.H.; Low, K.; Li, L.; Zhao, Y.; Deng, C.; Tan, S.K.; Chen, Y.; Yeap, B.C.; Li, X. Weight threshold estimation of falling UAVs (unmanned aerial vehicles) based on impact energy. Transp. Res. C Emerg. Technol. 2018, 93, 228–255. [Google Scholar] [CrossRef]
- Wang, J.; Li, Z.; Lan, H.; Cao, L.; Guo, D.; Hao, Z.; Bai, C.; Yang, Z. Study of the head and neck injury risk under impact conditions of the light UAV with a medium weight. Arch. Civ. Mech. Eng. 2023, 23, 226. [Google Scholar] [CrossRef]
- Campolettano, E.T.; Bland, M.L.; Gellner, R.A.; Sproule, D.W.; Rowson, B.; Tyson, A.M.; Duma, S.M.; Rowson, S. Ranges of injury risk associated with impact from unmanned aircraft systems. Ann. Biomed. Eng. 2017, 45, 2733–2741. [Google Scholar] [CrossRef] [PubMed]
- Alliance for System Safety of UAS through Research Excellence(ASSURE). Final Report for the FAA UAS Center of Excellence Task A4: UAS Ground Collision Severity Evaluation; Federal Aviation Administration: Washington, DC, USA, 2017. [Google Scholar]
- Stark, D.B.; Willis, A.K.; Eshelman, Z.; Kang, Y.-S.; Ramachandra, R.; Iv, J.H.B.; McCrink, M. Human Response and Injury Resulting from Head Impacts with Unmanned Aircraft Systems; SAE Tech Paper; SAE: Warrendale, PA, USA, 2020. [Google Scholar]
- SAE J211-1-2014; Instrumentation for Impact Test—Part 1—Electronic Instrumentation. SAE: Warrendale, PA, USA, 2014.
- National Highway Traffic Safety Administration (NHTSA); Federal Motor Vehicle Safety Standards (FMVSS). FMVSS 208: Occupant Crash Protection; National Highway Traffic Safety Administration, US Department of Transportation: Washington, DC, USA, 2007. [Google Scholar]
- United Nations Economic Commission for Europe (ECE). ECE R94: Uniform Provisions Concerning the Approval of Vehicles with Regard to the Protection of the Occupants in the Event of a Frontal Collision; United Nations Economic Commission for Europe (ECE): Geneva, Switzerland, 2016. [Google Scholar]
- Mertz, H.J.; Prasad, P.; Nusholtz, G. Head Injury Risk Assessment for Forehead Impacts; SAE Tech Paper; SAE: Warrendale, PA, USA, 1996. [Google Scholar]
- Mertz, H.J.; Hodgson, V.R.; Thomas, L.M. An assessment of compressive neck loads under injury-producing conditions. Phys. Sportsmed. 1978, 6, 95–106. [Google Scholar] [CrossRef] [PubMed]
- Mertz, H.J.; Patrick, L.M. Strength and Response of the Human Neck; SAE Transactions: Warrendale, PA, USA, 1971; pp. 2903–2928. [Google Scholar]
- Austen, W.J.; Lord, J.; Bridges, S.A.; EASA. Vulnerability of Manned Aircraft to Drone Strikes: Guidance on the Design of Drones, Based Upon Outcomes of Drone Collision Severity Studies (D8.1, D8.2); EASA: Cologne, Germany, 2023. [Google Scholar]
- Fahlstedt, M.; Halldin, P.; Kleiven, S. The protective effect of a helmet in three bicycle accidents—A finite element study. Accid. Anal. Prev. 2016, 91, 135–143. [Google Scholar] [CrossRef]
- Kleiven, S. Why most traumatic brain injuries are not caused by linear acceleration but skull fractures are. Front. Bioeng. Biotech. 2013, 1, 00015. [Google Scholar] [CrossRef] [PubMed]


| Model | Shape | Mass (kg) | Size (mm) | |
|---|---|---|---|---|
| Unfolded (L × W × H) | Folded (L × W × H) | |||
| Air |  | 0.43 | 168 × 184 × 64 | 168 × 83 × 49 |
| Mavic 2 |  | 0.907 | 322 × 242 × 84 | 214 × 91 × 84 |
| M200 |  | 4.53 | 887 × 880 × 378 | 716 × 220 × 236 |
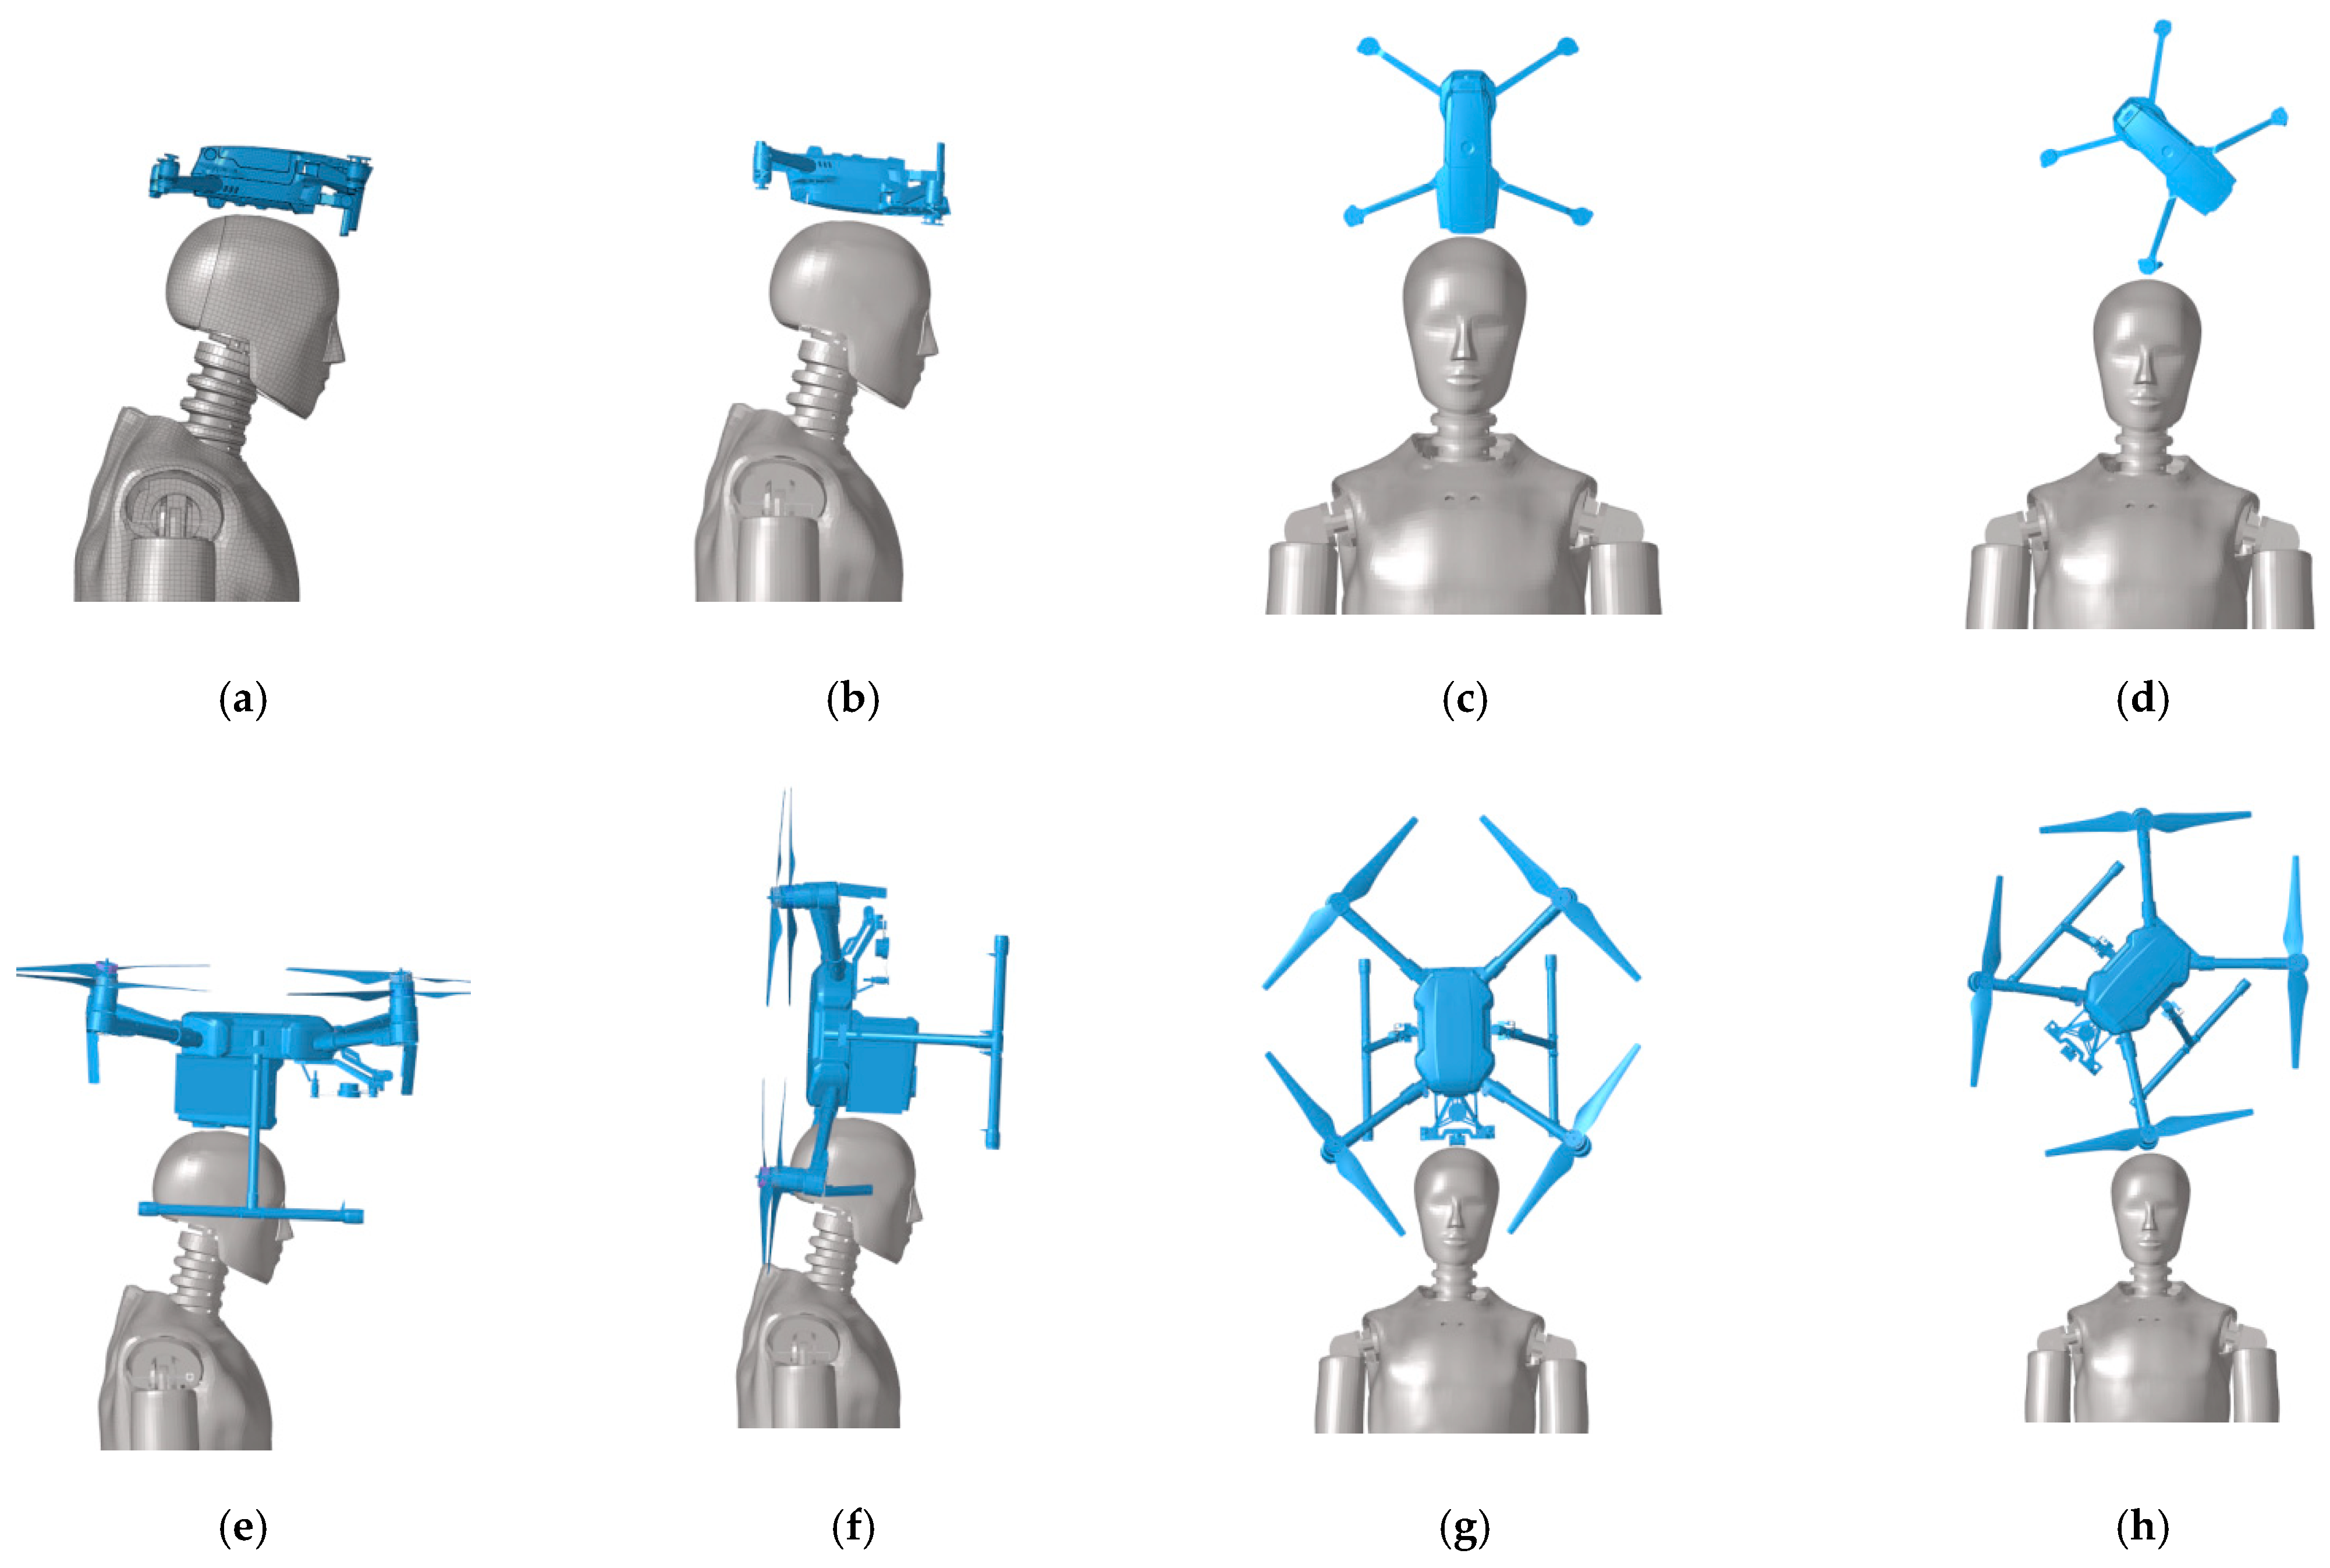
| Drone Model | Height (m) | Impact Position |
|---|---|---|
| Air | 1, 3, 7, 9, 11 | Body (Figure 2a) |
| 5 | Body (Figure 2a), Back (Figure 2b), Front (Figure 2c), Arm (Figure 2d) | |
| Mavic 2 | 1, 3, 7, 9, 11 | Body (Figure 2a) |
| 5 | Body (Figure 2a), Back (Figure 2b), Front (Figure 2c), Arm (Figure 2d) | |
| M200 | 0.1, 0.3, 0.5, 1, 3 | Body (Figure 2e) |
| 5 | Body (Figure 2e), Tail (Figure 2f), Front (Figure 2g), Arm (Figure 2h) |
| Region | Types of Injury | Metric | Threshold (FMVSS 208 [24]; ECE R94 [25]; Mertz et al., 1996, 1978 [26,27]; Mertz and Patrick 1971 [28]) |
|---|---|---|---|
| Head | Skull fracture | HIC15 | 700 |
| — | a3ms | 80 g | |
| Neck | Cervical vertebra fracture | Fz (compression) | 4000 N |
| — | Fx | 3100 N | |
| Ligamentous injury | My (tension) | 57 Nm |
| Drone | Grade 1 | Grade 2 | Grade 3 | Grade 4 |
|---|---|---|---|---|
| Air | 0 ≤ h < 4 m | 4 m ≤ h < 11.6 m | 11.6 m ≤ h < 16.7 m | 16.7 m ≤ h < 17.5 m |
| Mavic 2 | 0 ≤ h < 1 m | 1 m ≤ h < 6.6 m | 6.6 m ≤ h < 12.5 m | 12.5 m ≤ h < 17.2 m |
| M200 | 0 ≤ h < 0.1 m | 0.1 m ≤ h < 0.4 m | 0.4 m ≤ h < 0.9 m | 0.9 m ≤ h < 1.6 m |
Disclaimer/Publisher’s Note: The statements, opinions and data contained in all publications are solely those of the individual author(s) and contributor(s) and not of MDPI and/or the editor(s). MDPI and/or the editor(s) disclaim responsibility for any injury to people or property resulting from any ideas, methods, instructions or products referred to in the content. |
© 2025 by the authors. Licensee MDPI, Basel, Switzerland. This article is an open access article distributed under the terms and conditions of the Creative Commons Attribution (CC BY) license (https://creativecommons.org/licenses/by/4.0/).
Share and Cite
Bai, C.; Guo, Y.; Qin, Q.; Zhou, Y.; Li, Z.; Wang, Y. Experimental Investigation and Safety Classification Evaluation of Small Drone Collision with Humans. Biomimetics 2025, 10, 157. https://doi.org/10.3390/biomimetics10030157
Bai C, Guo Y, Qin Q, Zhou Y, Li Z, Wang Y. Experimental Investigation and Safety Classification Evaluation of Small Drone Collision with Humans. Biomimetics. 2025; 10(3):157. https://doi.org/10.3390/biomimetics10030157
Chicago/Turabian StyleBai, Chunyu, Yazhou Guo, Qinghua Qin, Yunlai Zhou, Zhigang Li, and Yafeng Wang. 2025. "Experimental Investigation and Safety Classification Evaluation of Small Drone Collision with Humans" Biomimetics 10, no. 3: 157. https://doi.org/10.3390/biomimetics10030157
APA StyleBai, C., Guo, Y., Qin, Q., Zhou, Y., Li, Z., & Wang, Y. (2025). Experimental Investigation and Safety Classification Evaluation of Small Drone Collision with Humans. Biomimetics, 10(3), 157. https://doi.org/10.3390/biomimetics10030157