3.1. Characterization of Catalysts
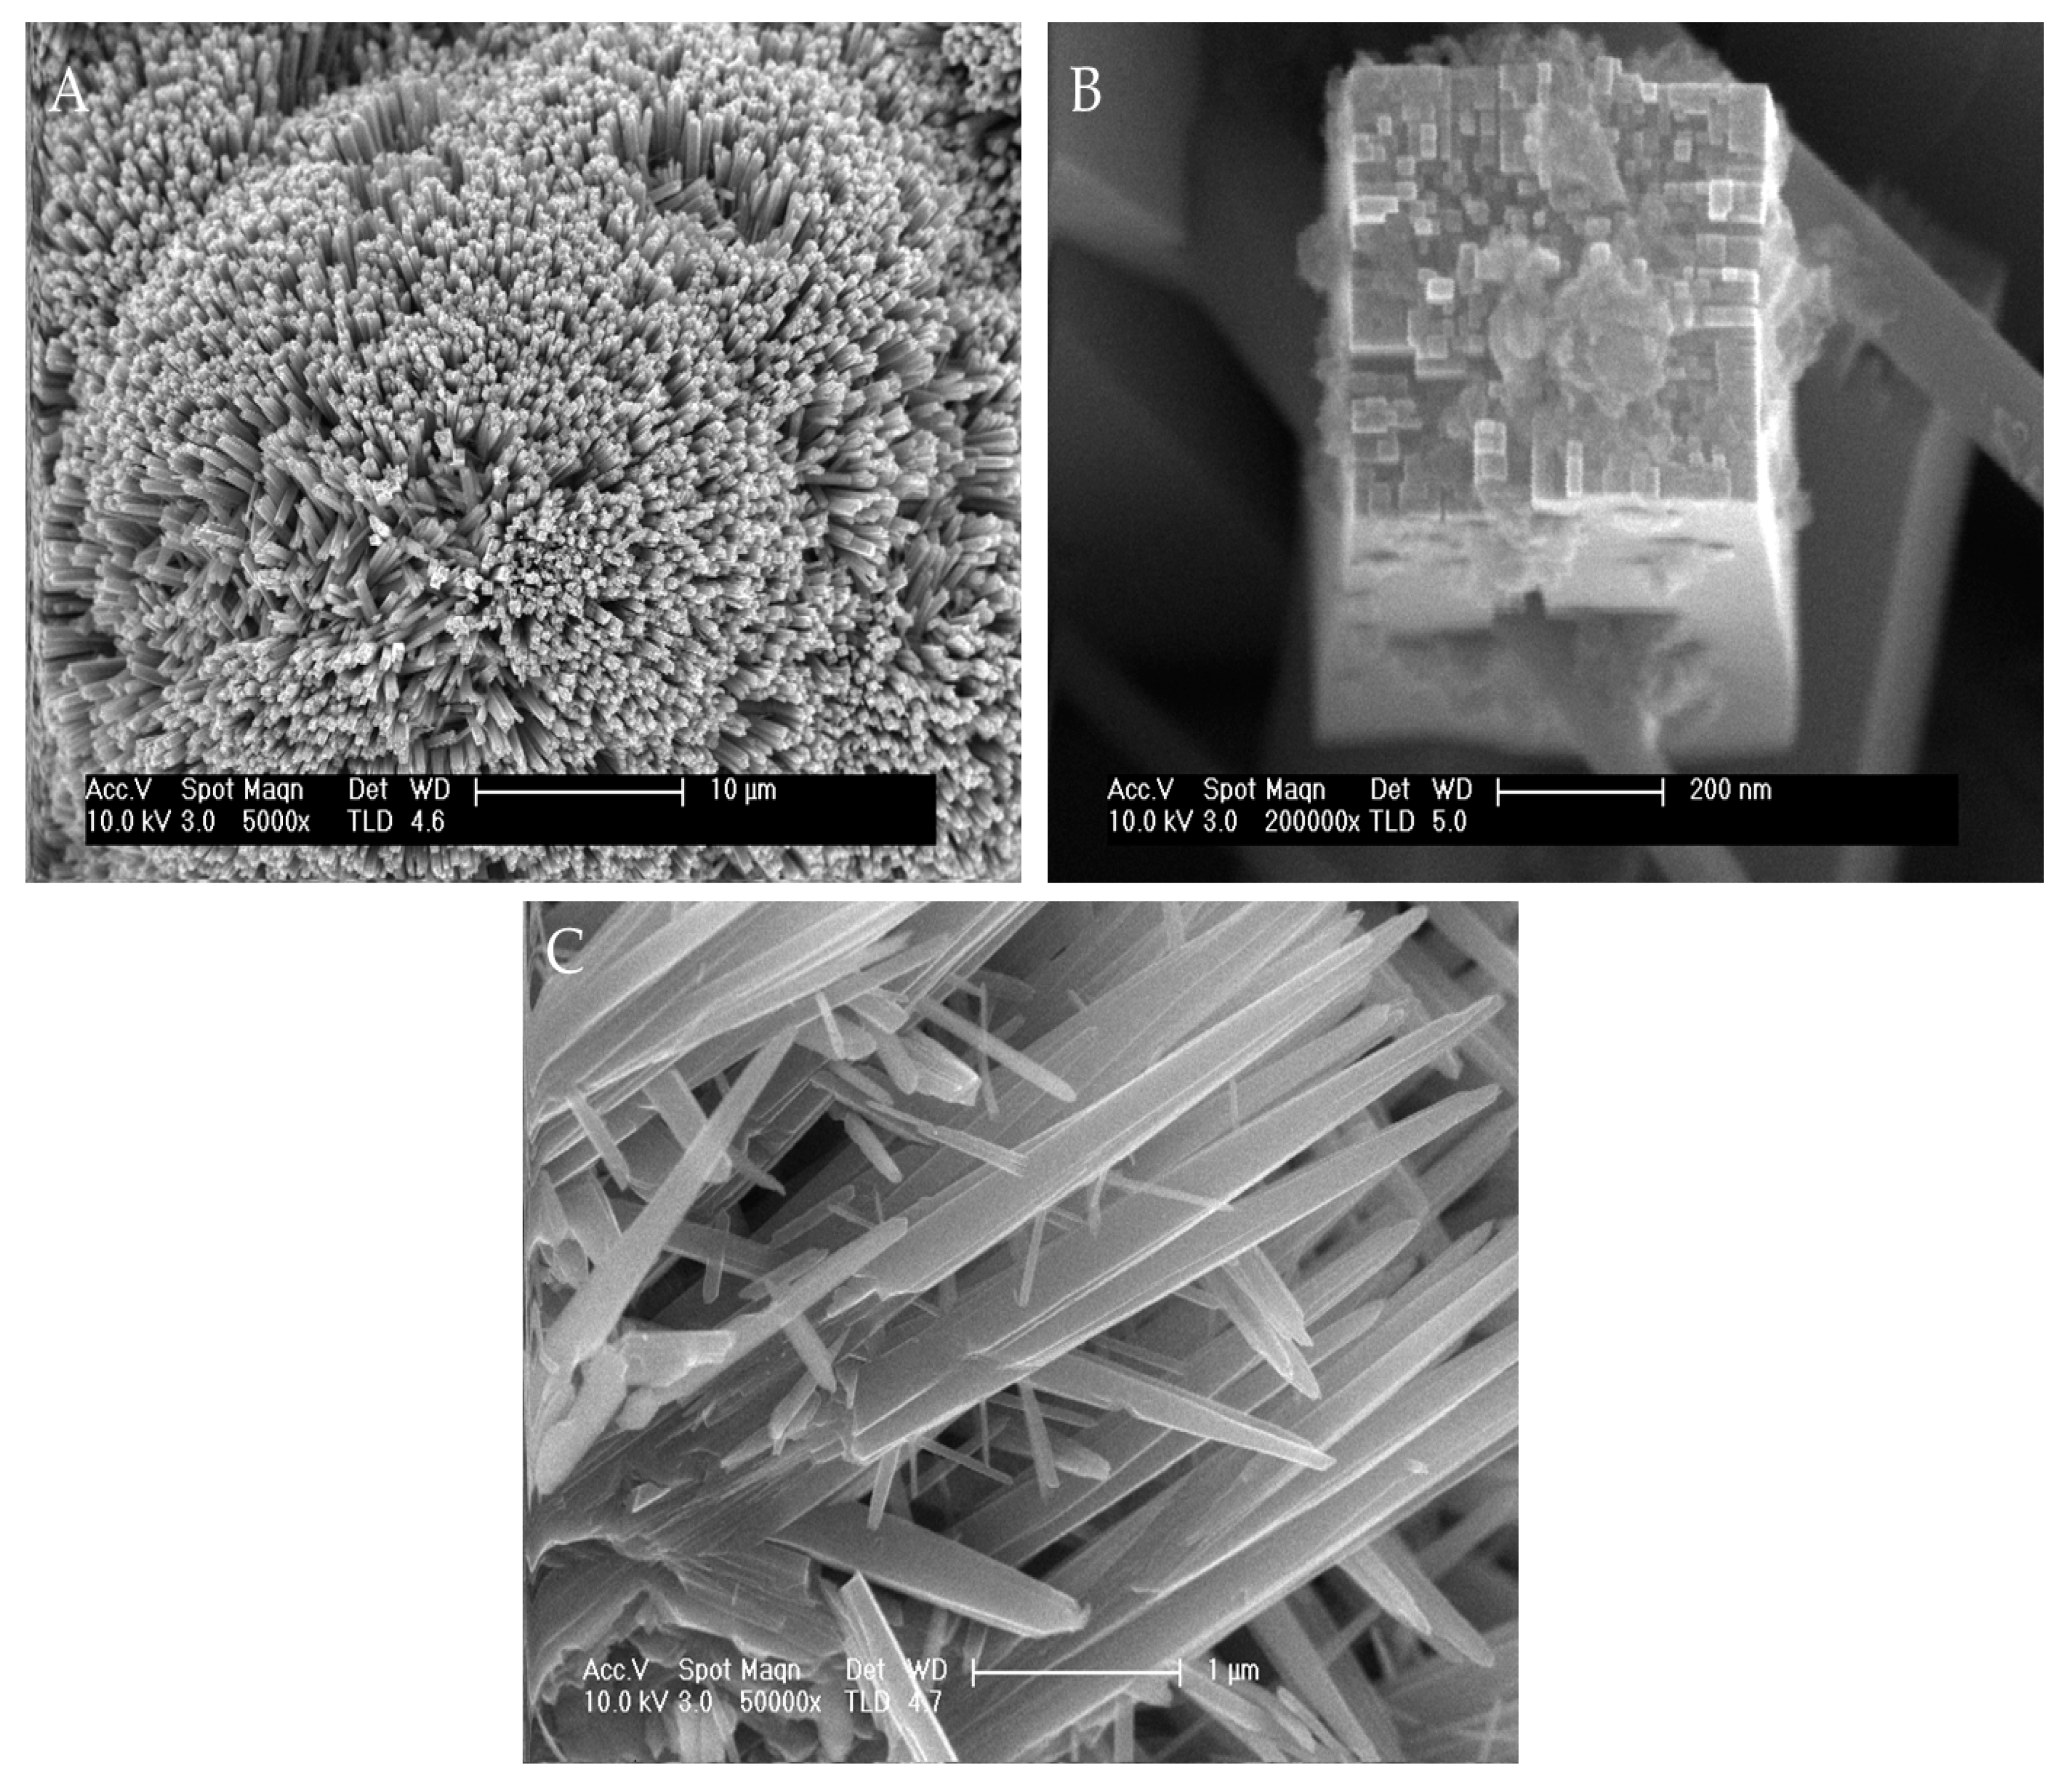
Figure 1 shows different FE-SEM images of TiO
2 NWs and ZnO NWs at different magnifications. The as-synthesized TiO
2 NWs consist of homogeneous and highly branched structures (
Figure 1A). At higher magnifications (
Figure 1B), TiO
2 NWs have a square-like form and are composed of smaller units with the same shape. The specific surface area of the catalyst obtained by BET measurements was 403 m
2 g
−1, a large area that may be justified by the highly branched structures and could have relevant effects on the catalytic properties of this material. The FE-SEM images of ZnO catalysts are shown in
Figure 1C. ZnO NWs consisted of non-homogenous wires, with differences in size and length. The BET surface area of ZnO NWs (160 m
2 g
−1) was clearly less than that observed for TiO
2 NWs.
After the synthesis of TiO
2 NWs and ZnO NWs catalysts, different amounts of Ag NPs (1%, 3%, 5%, and 10% wt.%) were deposited onto the surfaces of the as-synthesized catalysts and their commercial forms (TiO
2-P25 and commercial ZnO) for comparison purposes, using a chemical reduction method.
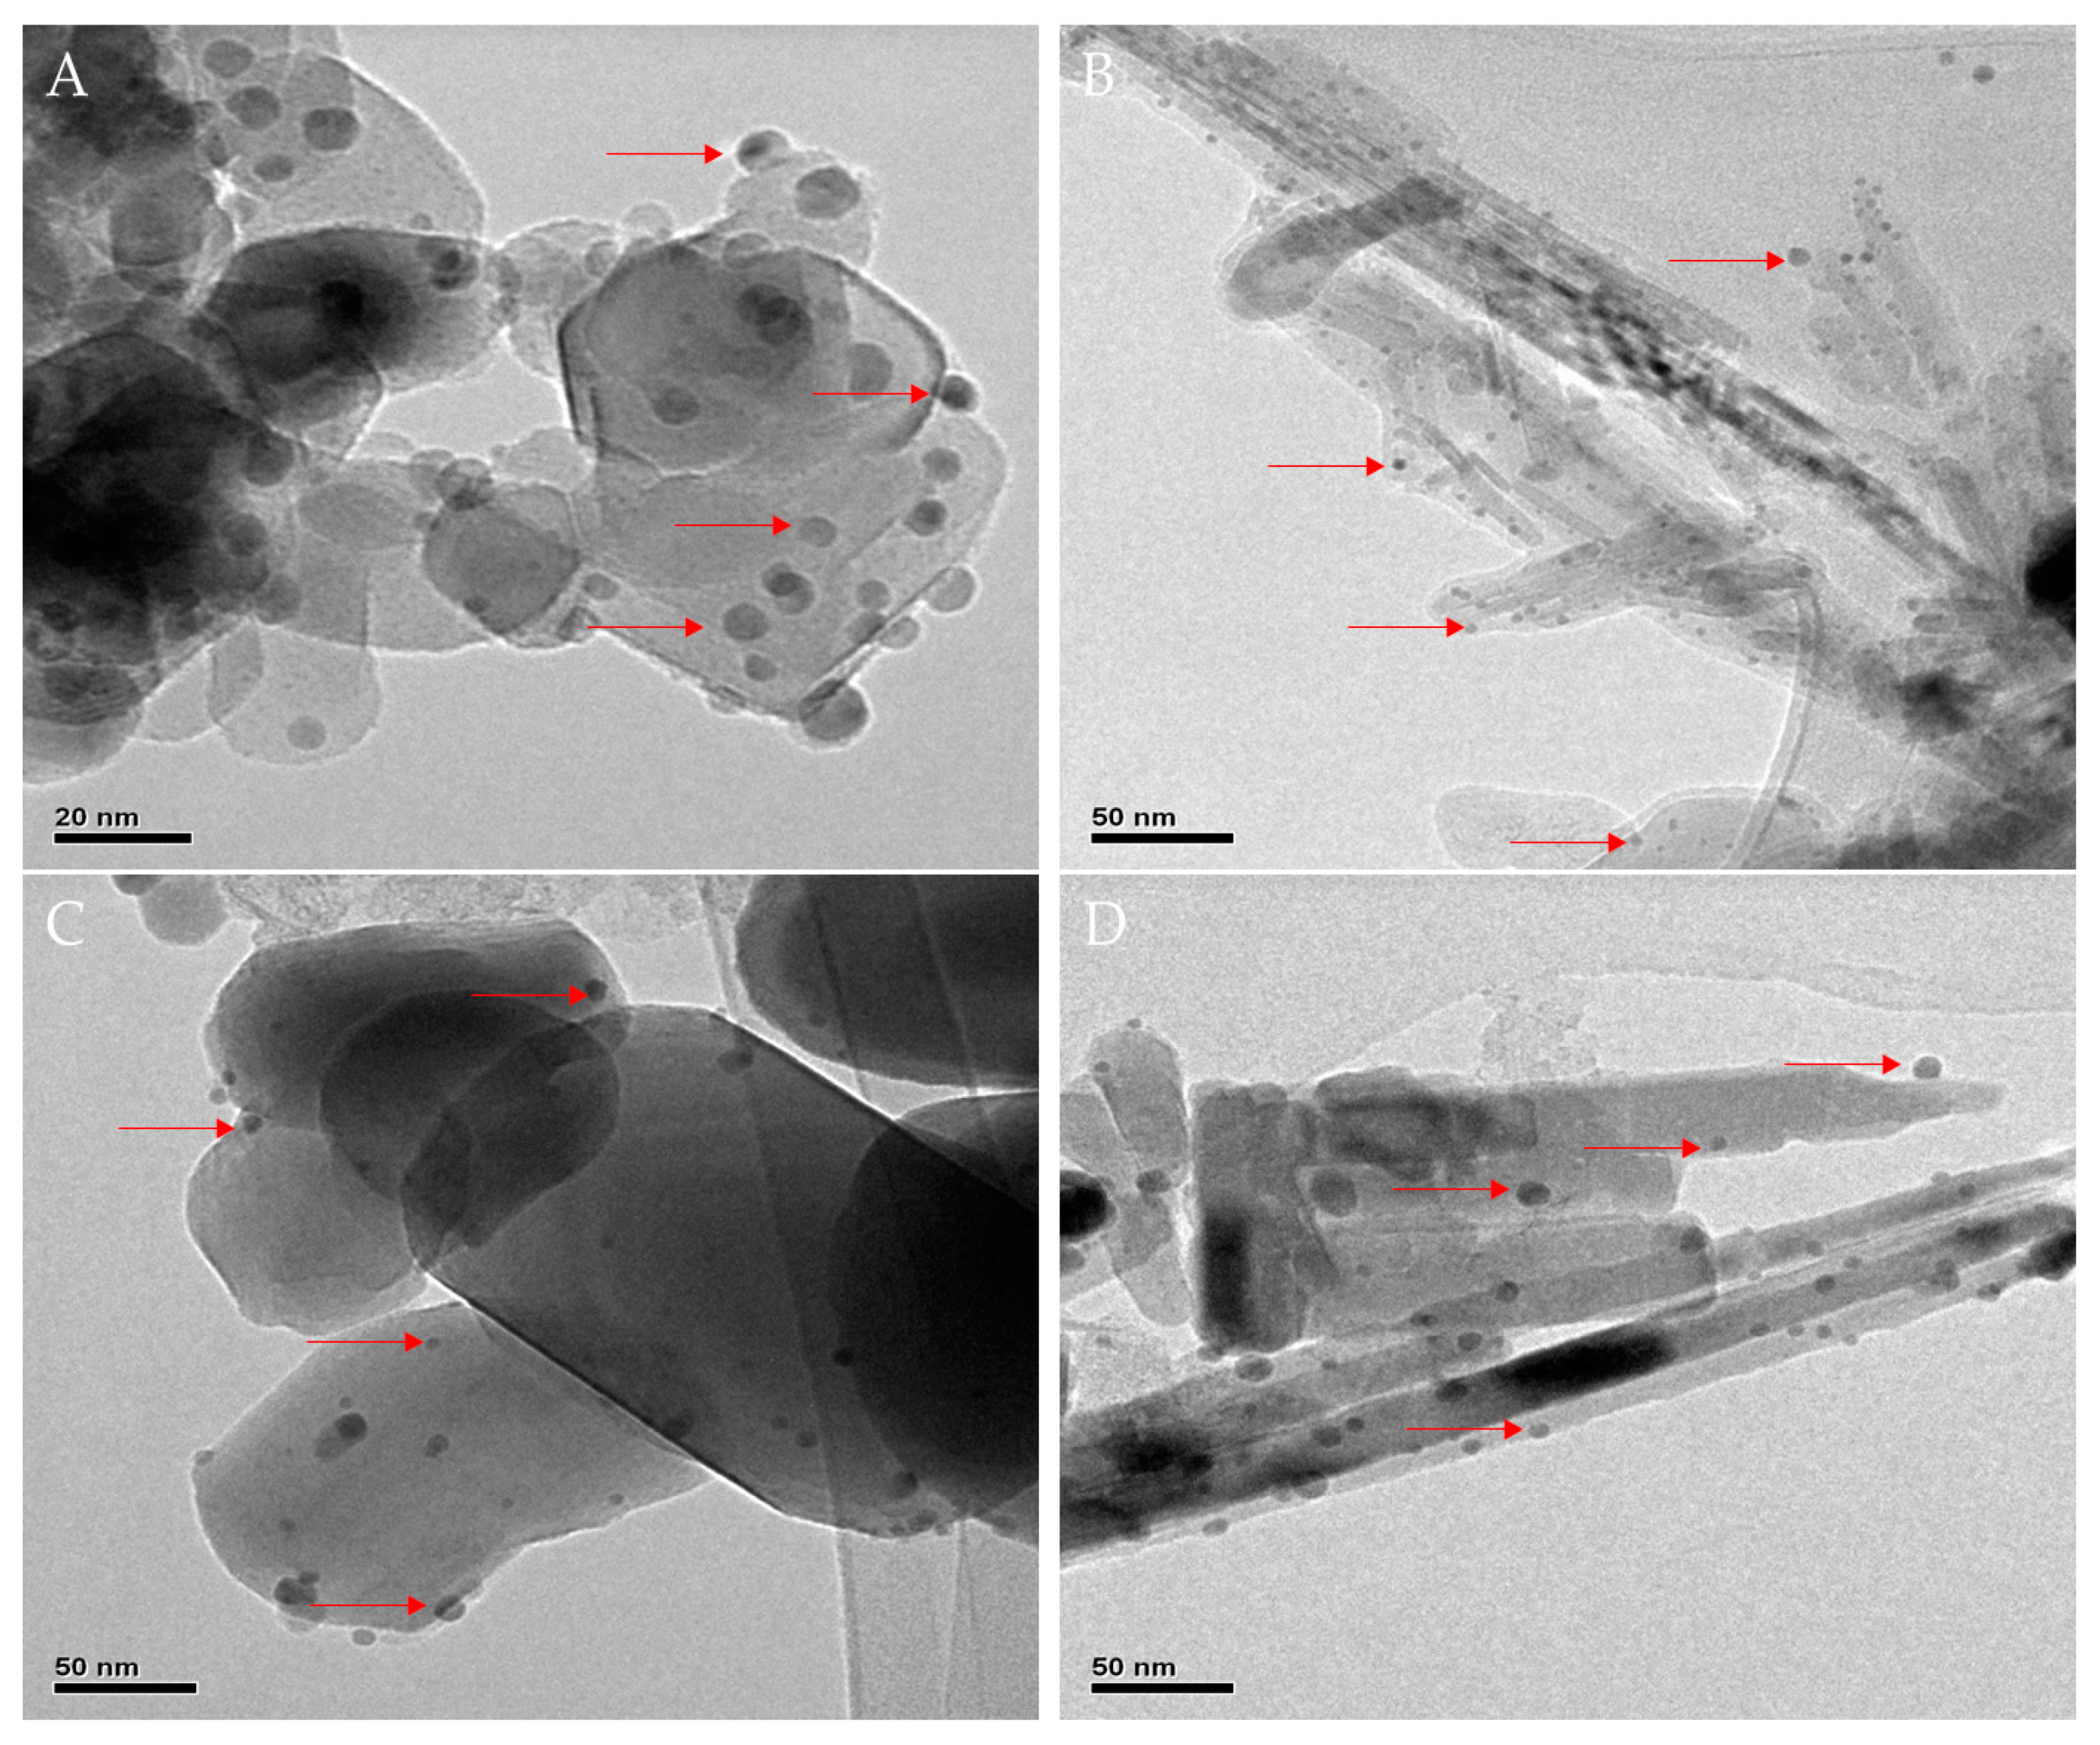
Figure 2 shows the high-resolution transmission electron microscopy (HRTEM) images of the catalysts containing 10 wt.% of Ag. All silver-based catalysts showed a non-homogenous distribution of the metal on the surface, with diameters of ca. < 10 nm (
Figure 2). This is a normal characteristic when using sodium borohydride (NaBH
4) as a reducing agent, and it has been documented in previous works [
25,
26,
27]. The 10%Ag@TiO
2-P25 (
Figure 2A) and 10%ZnO commercial (
Figure 2C) composites consisted of supports of different shapes and sizes, of micrometers in length, and both the 10%Ag@TiO
2 NWs (
Figure 2B) and 10%ZnO NWs (
Figure 2D) showed significant changes in their morphology compared to the bare catalysts shown in
Figure 1. These changes were expected and are also attributed to the synthesis process.
The BET surface areas of the silver-based catalysts with different Ag loadings were analyzed and the results are shown in
Table 1. Before the silver deposition, the average surface areas of the as-synthesized TiO
2 NWs and ZnO NWs were 403 and 160 m
2·g
−1, respectively, whereas the surface areas of the commercial ones (TiO
2-P25 and ZnO) were 53 and 18 m
2·g
−1, respectively. These results clearly show that the synthesis processes used to obtain TiO
2 NWs and ZnO NWs allowed us to obtain high-surface supports. Unexpectedly, the addition of silver nanoparticles on the pristine catalysts resulted in an increase in surface area. This effect is much more significant in composites with the highest percentage of silver on the surface (see
Table 1). As was determined by HRTEM, these nanoparticles are dispersed on the surfaces of the catalysts, suggesting that the chemical reduction approach is an efficient method for synthesizing these composites.
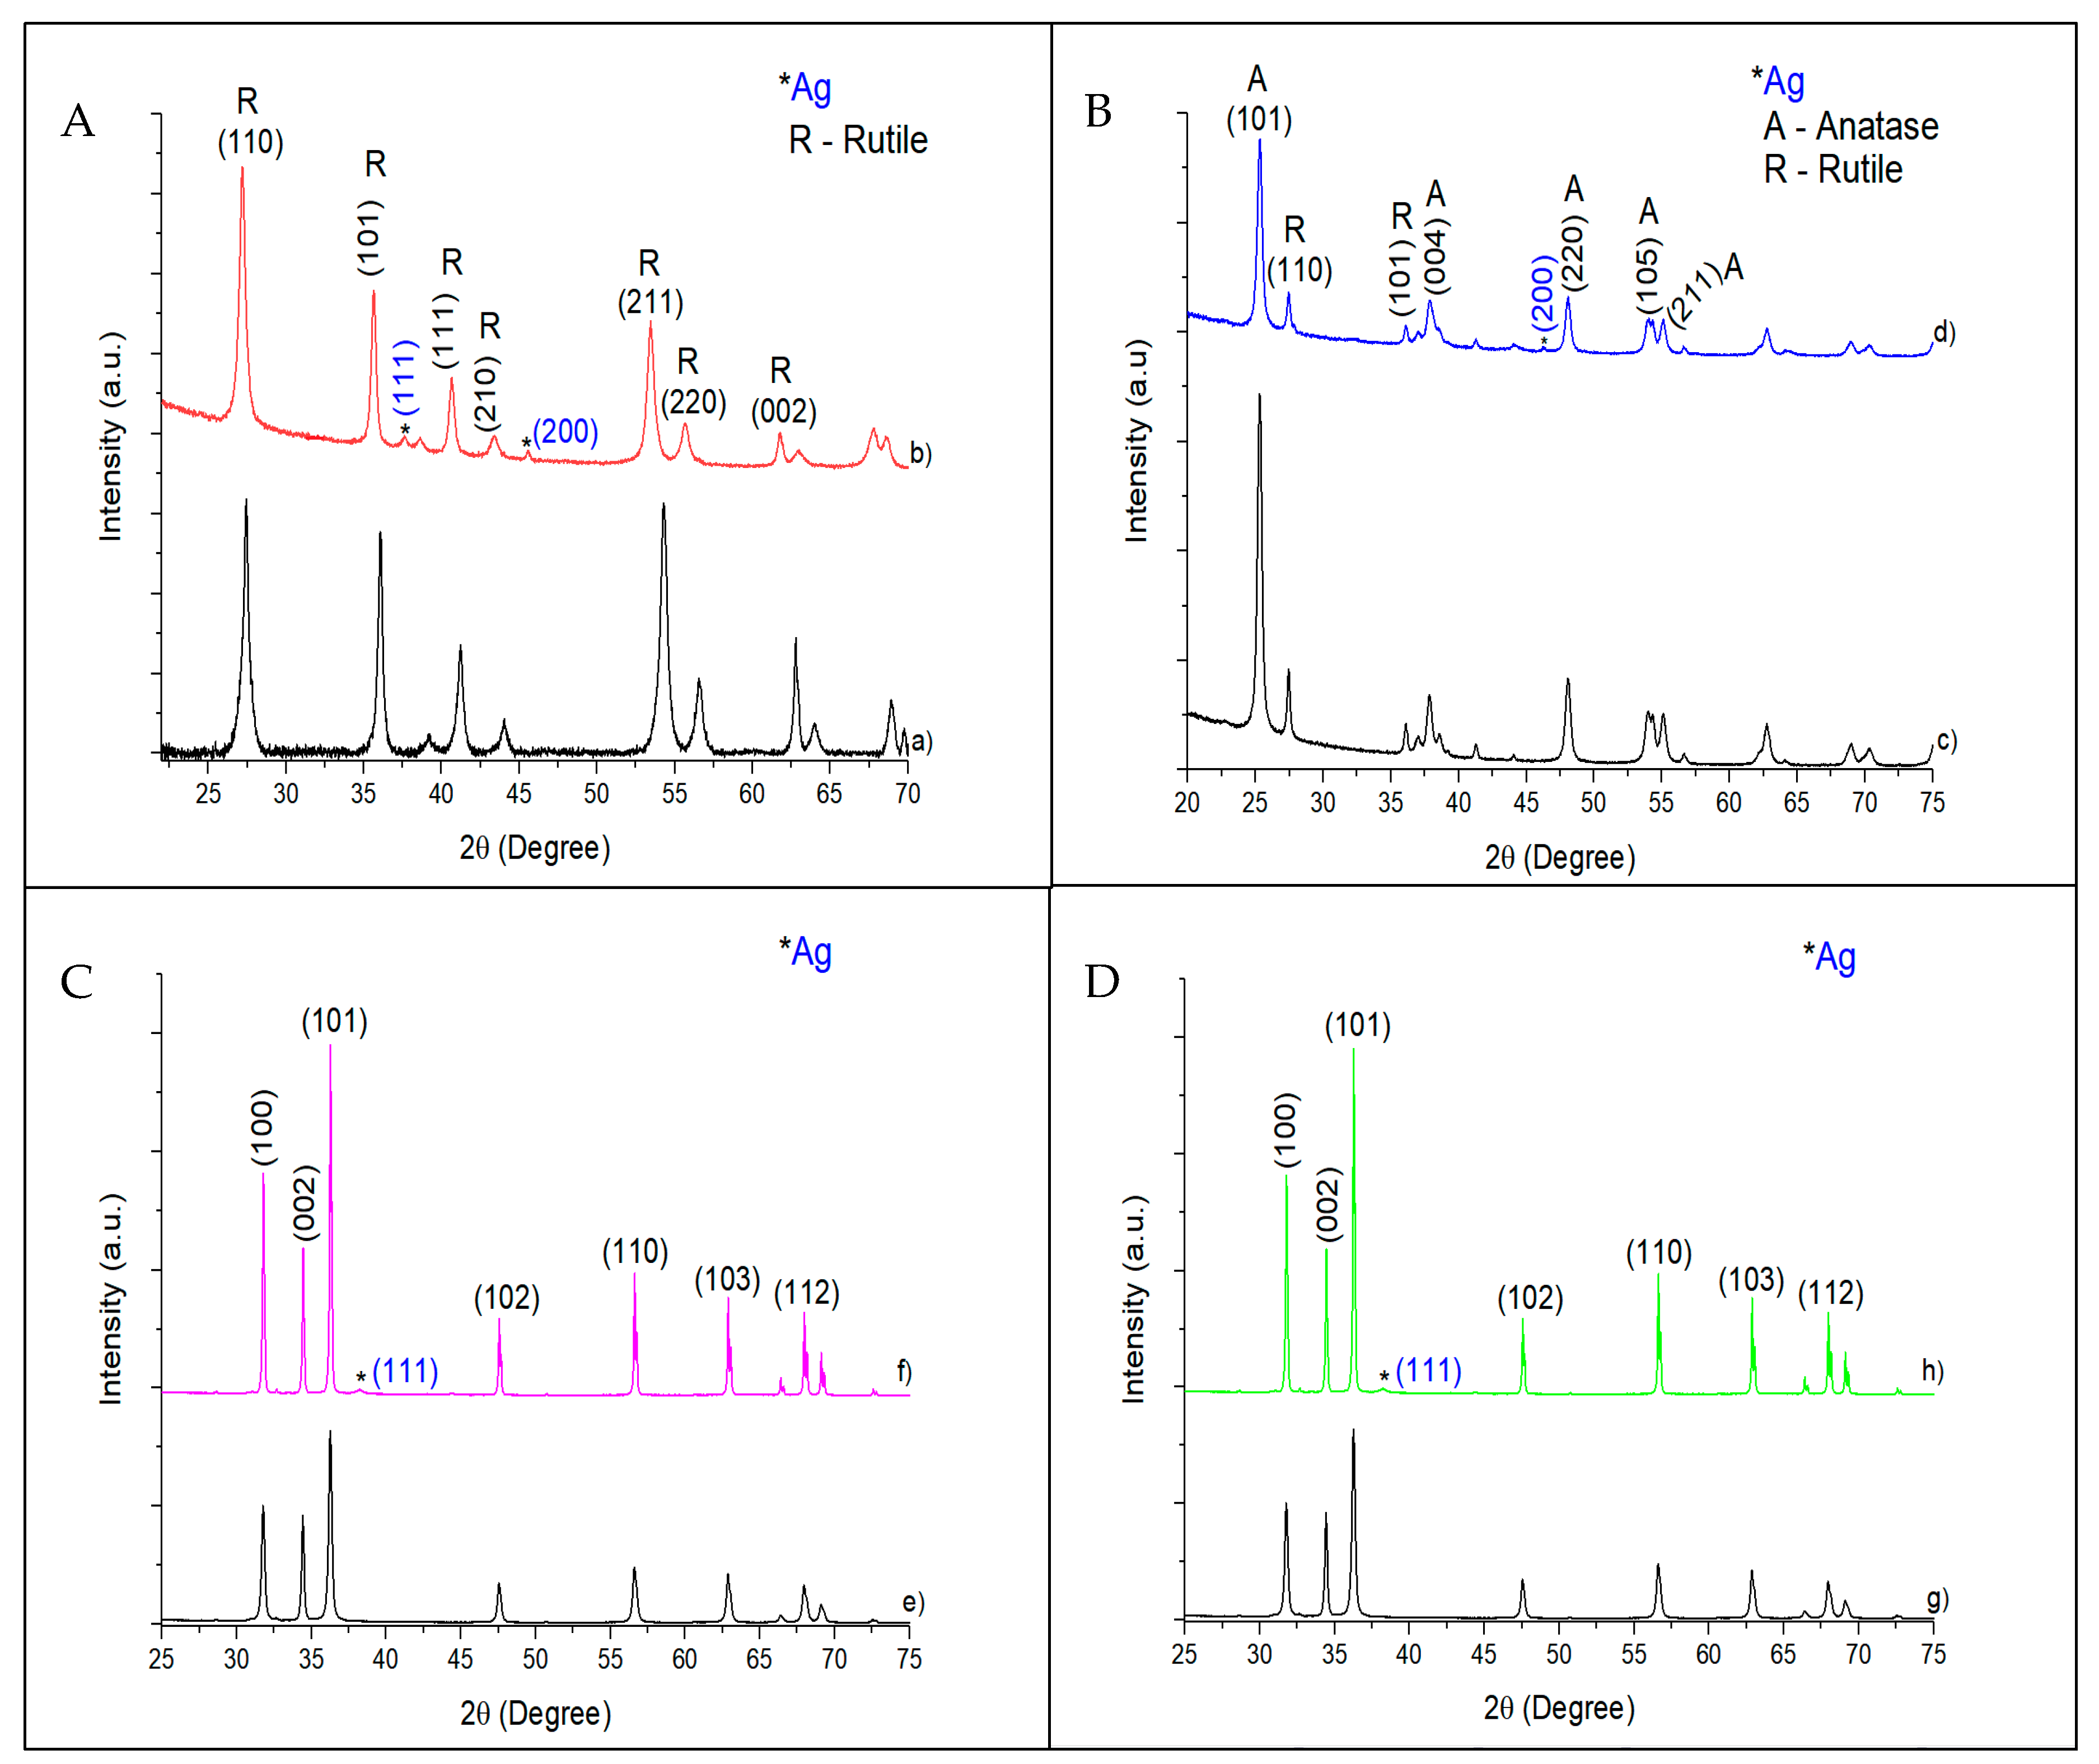
The XRD patterns of pristine catalysts and catalysts with 10 wt.% Ag are shown in
Figure 3.
Figure 3A, corresponding to TiO
2 NWs (pristine or with 10 wt.% Ag), shows intense peaks at 27° (110), 36° (101), and 55° (211), which have been unambiguously ascribed to the rutile phase (JCPDS 88-1175) [
28]. The 10% Ag @ TiO
2 NW diffractogram, as well as the rest of the catalysts with other percentages of silver, showed a small shift towards lower angles compared to the pure TiO
2 NWs. This displacement has been attributed to the incorporation of the silver nanoparticles on the surface of the support [
29]. No silver peak was observed at low silver loading (1%Au@TiO
2 NWs and 3%Au@TiO
2 NWs). Only 10%Ag@TiO
2 NWs presented two peaks at ca. 38° (111) and 46° (200), ascribed to the presence of silver nanoparticles with fcc unit cell.
TiO
2-P25 is a mixture of 70% anatase and 30% rutile. The characteristic peaks of anatase (JCPDS 21-1272) can be found at ca. 25° (101), 38° (004), 48° (220), 54° (105), and 55° (211) [
28], while the rutile crystalline phase has its characteristic peaks at ca. 27° (110), 36° (101), 41° (111), and 54° (211) (JCPDS 34-180) [
28]. All the peaks corresponding to both anatase and rutile are present in the diffraction pattern of
Figure 3B–D. The characteristic peak of rutile (ca. 27°) was not present in any silver loadings. Only the 10%Ag@TiO
2-P25 showed one peak assigned to the face-centered cubic (fcc) structure of the adsorbed Ag metal nanoparticles corresponding to the h k l parameters (200) at ca. 46° [
30].
The XRD patterns of silver-based ZnO NWs and commercial ZnO did not show major differences (
Figure 3C,D). Peaks shown at ca. 32° (100), 34.8° (002), 36° (101), 47.5° (102), 56.2° (110), 62.8° (103), 66° (200), 67.5° (112), and 68.8° (201) were ascribed to the ZnO wurtzite phase (JCPDS 396-1451) [
31]. The presence of silver nanoparticles was only detected in 10%Ag@ZnO commercial and 10%Ag@ZnO NWs at ca. 38° (111) and not in catalysts with lower silver percentages.
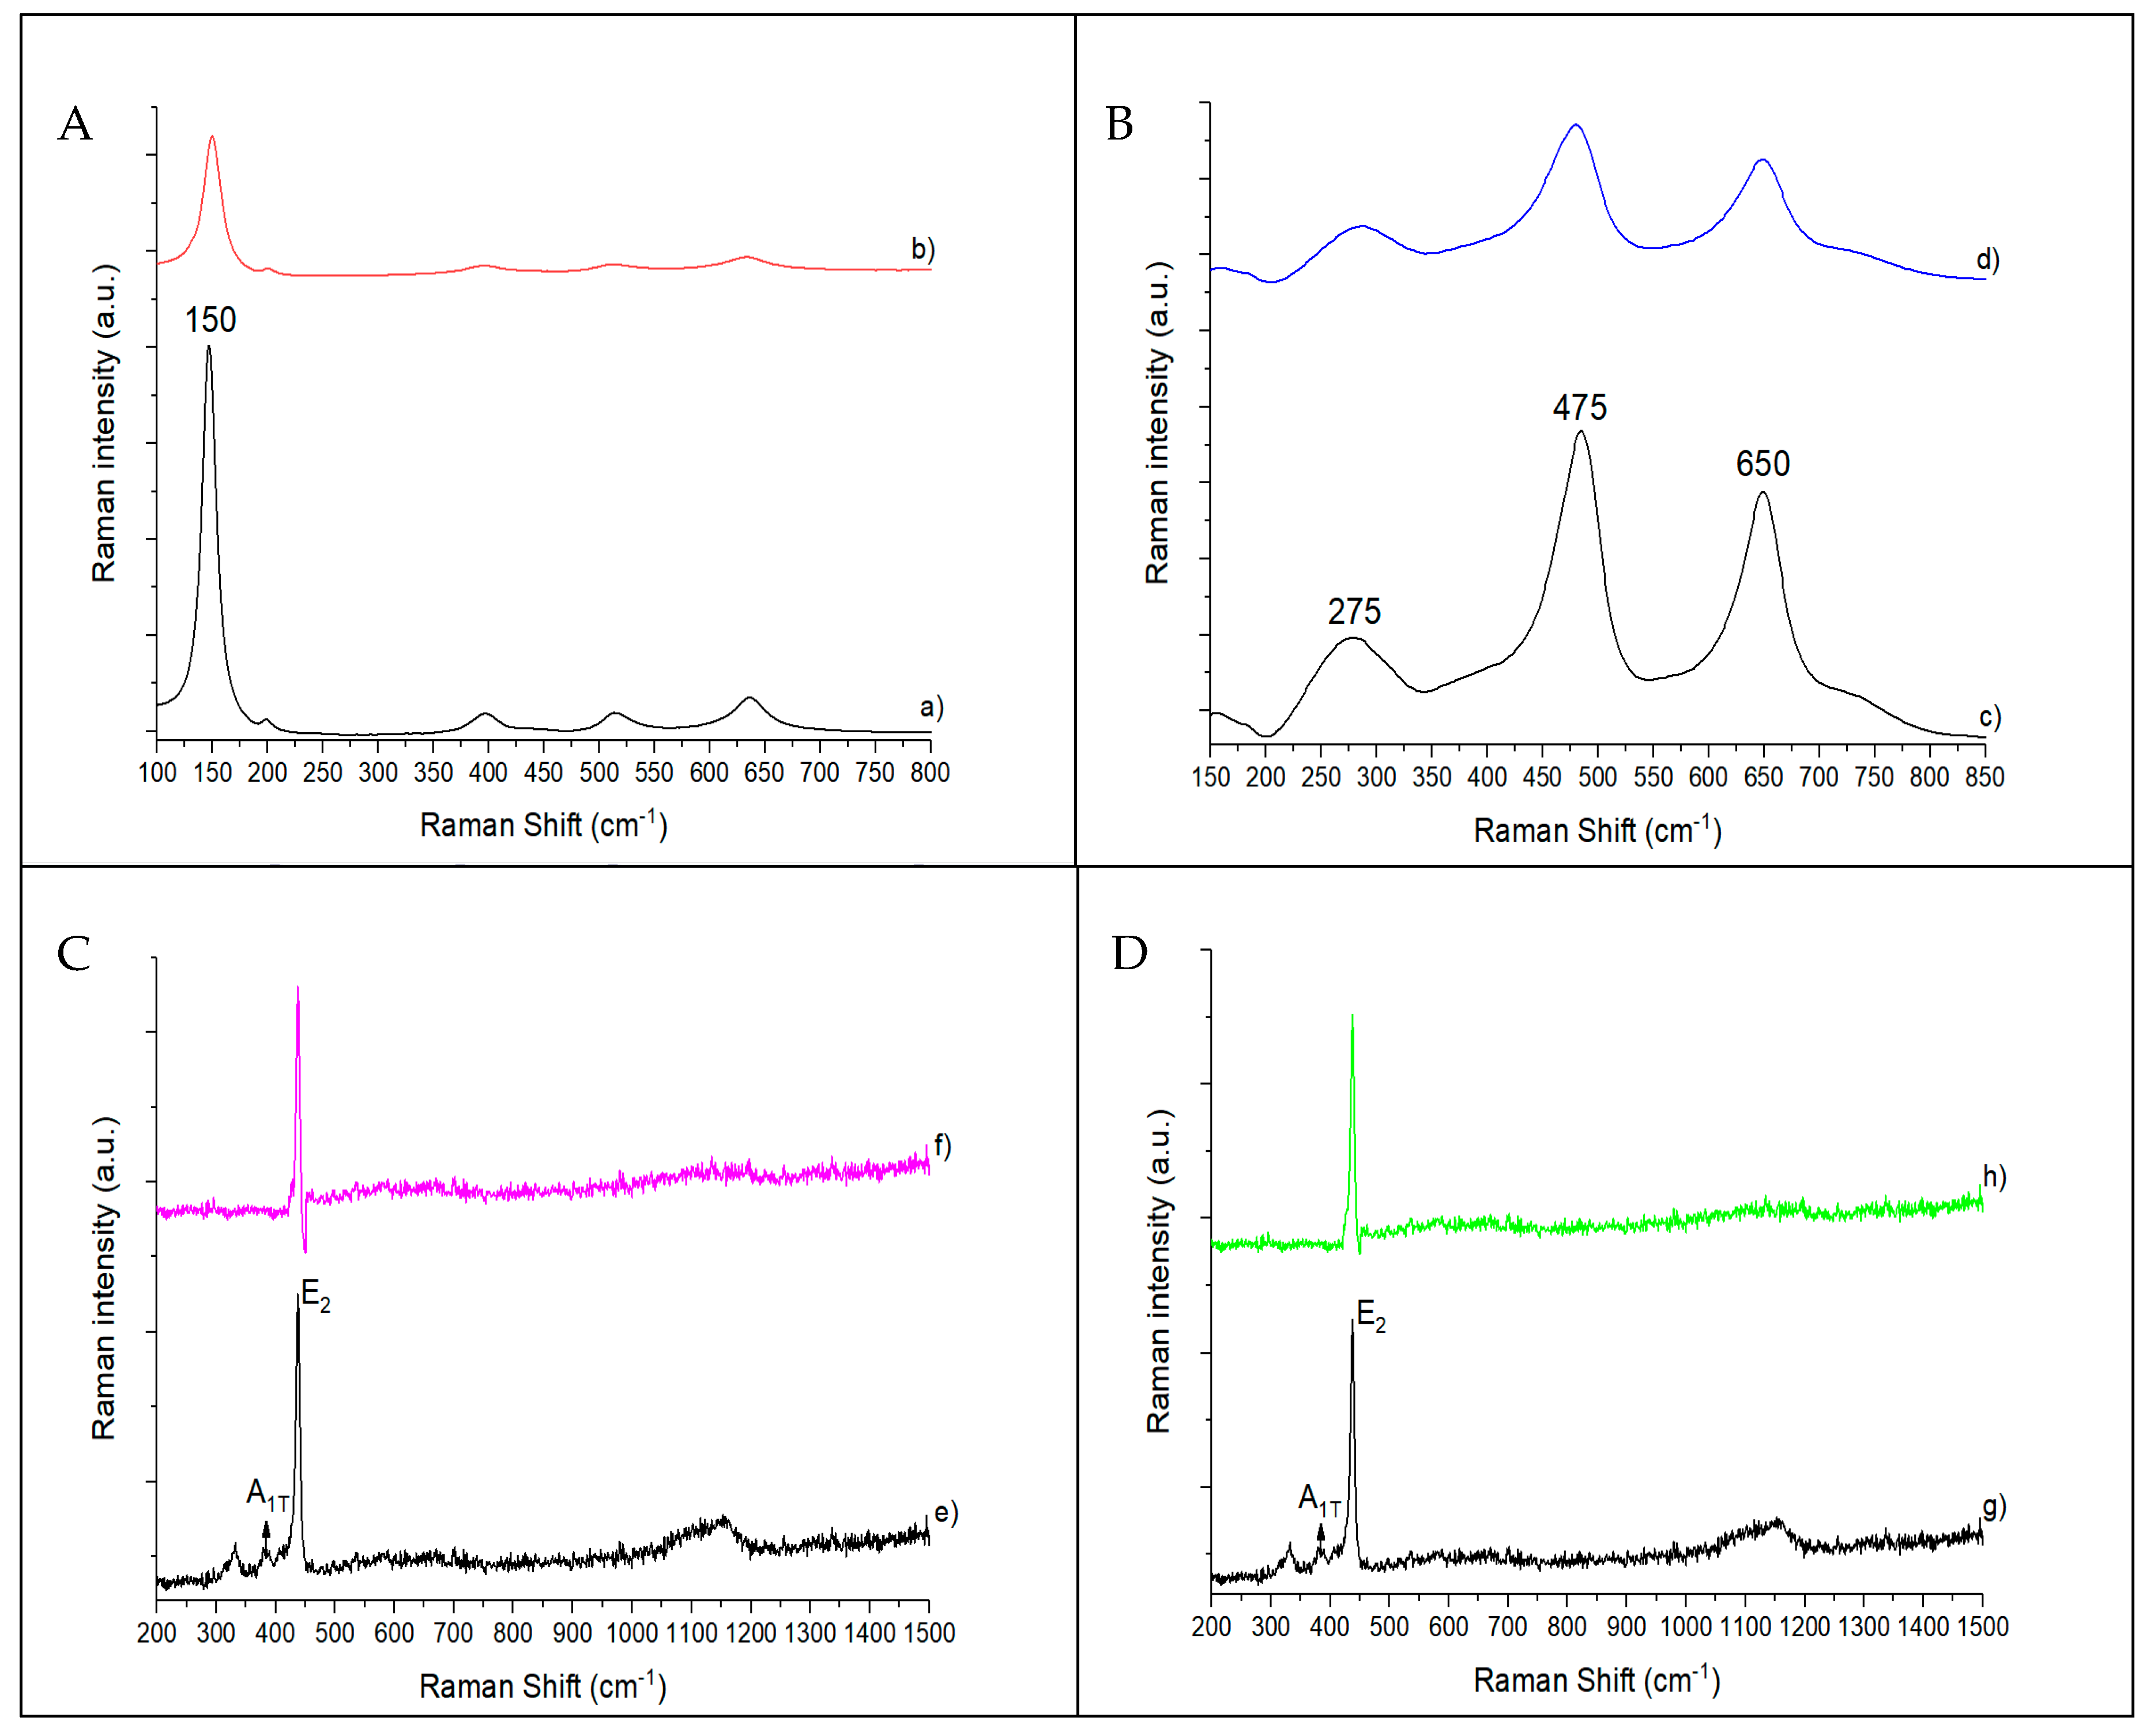
Figure 4 shows the Raman spectra of pristine catalysts and catalysts with 10 wt.% Ag. The anatase phase shows major bands at ca. 150, 395, 515, and 638 cm
−1 [
32] that can be observed in the bare TiO
2-P25 and 10%Ag@TiO
2-P25 (
Figure 4A, a,b) catalysts, being attributed to the five Raman-active modes of the anatase phase, corresponding to E
g(1), B
1g(1), A
1g + B
1g(2), and E
g(2) vibrational modes. The typical Raman bands resulting from the rutile phase appear at ca. 143 cm
−1 (superimposed with the 145 cm
−1 band from the anatase), 235, 455, and 612 cm
−1 and have been ascribed to the B
1g, E
g, and A
1g vibrational modes [
32]. In the case of the 10%Ag@TiO
2-P25 (
Figure 4A,b), and in catalysts with lower percentages of silver, the peak corresponding to the presence of silver nanoparticles was not detected. The only change observed by increasing the silver loading of the samples was a slight decrease in the intensity of the characteristic peaks. This effect has been attributed directly to the presence of silver [
33]. In TiO
2 NWs (
Figure 4B,c), the characteristic Raman bands of TiO
2 rutile can be found at ca. 275 and 475 cm
−1 [
34]. As can be seen in
Figure 4B,c, these bands are present, confirming that rutile is the only crystalline phase identified in the as-synthesized TiO
2 NWs. As already shown before for catalysts based on P25, no peaks corresponding to the presence of silver nanoparticles were detected (see
Figure 4B,d).
In the case of commercial ZnO and ZnO NWs, no relevant differences were observed (
Figure 4C,D). The wurtzite phase shows main bands at ca. 327, 378, 437, and 1050 cm
−1 [
35]. The 1150 cm
−1 band, observed in both the commercial catalyst (
Figure 4C,e) and the as-synthesized ZnO NWs (
Figure 4D,g), has been attributed to overtones and/or combination bands [
36]. The narrow strong band at 437 cm
−1 was assigned to the
E2 modes, involving mainly Zn motion, corresponding to the band characteristic of the wurtzite phase [
34]. The band at 378 cm
−1 was ascribed to the A
1T mode, indicating some degree of structural disorder in the ZnO lattice [
36]. No bands associated with Ag NPs were detected in 10%Ag@ZnO commercial (
Figure 4C,f), 10%ZnO NWs (
Figure 4D,h), or in catalysts with lower percentages of silver.
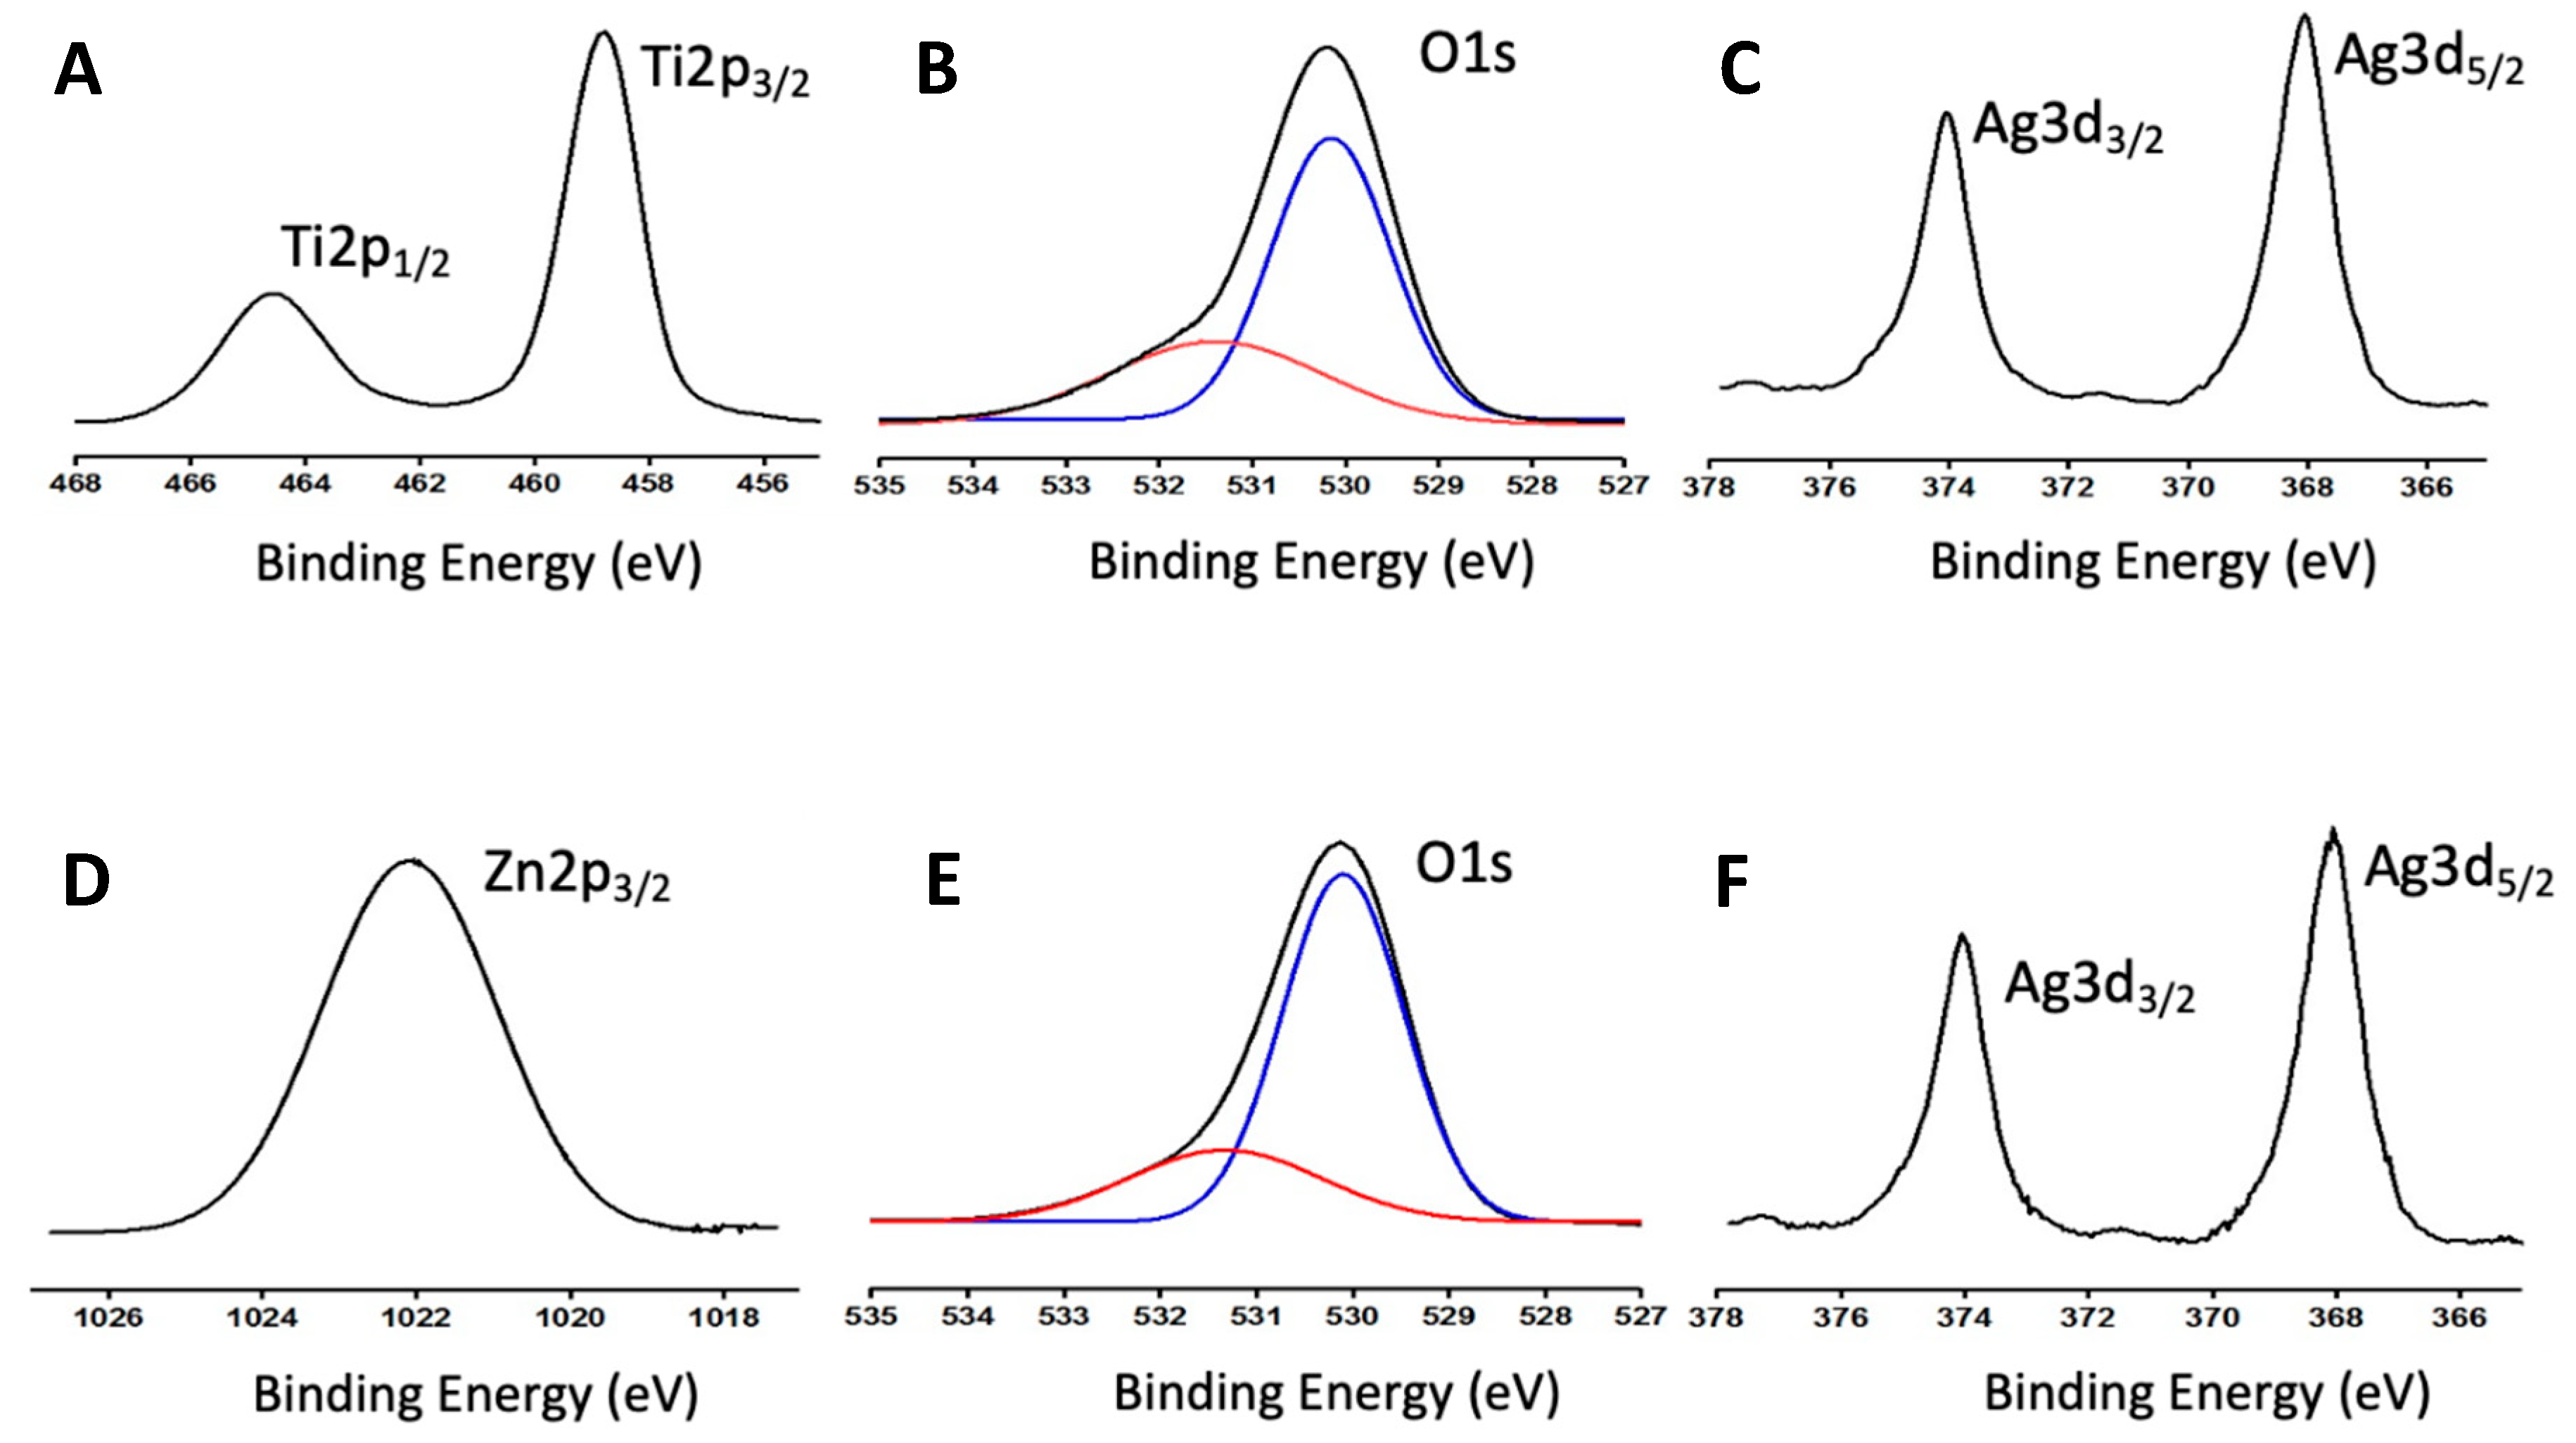
The two catalyst systems were also characterized by XPS.
Figure 5 shows the most relevant transitions of each system, considering the catalysts with the highest silver load (10%Ag@ZnO NWs and 10%Ag@TiO
2NWs).
Figure 5A shows the transitions corresponding to Ti2p of the 10%Ag@TiO
2NW catalyst. The peaks observed at 464.5 and 458.8 eV have been unambiguously assigned to Ti
4+, typical of rutile TiO
2, as identified by XRD [
36,
37]. In this catalyst, the O1s clearly shows two components at 530.1 and 531.4 eV. The lowest bond energy peak has been assigned to O
2− ions in the Ti-O bonds. The shoulder around 531.4 eV has been assigned to O
2− ions in the oxygen-deficient regions, as previously referenced in the literature [
36,
37].
Figure 5C shows the transitions corresponding to Ag3d, with peaks at 374 and 368 eV, and a characteristic spin-orbit splitting of 6.0 eV, which have been clearly assigned to metallic Ag [
36,
37]. In the case of the 10%Ag@ZnONWs catalyst, the result obtained was also as expected.
Figure 5D shows a peak at 1022.1 eV, corresponding to the Zn 2p
3/2 transition, which has been assigned to Zn
2+ in ZnO [
36,
37]. As was the case with the rutile-based catalyst, the peak corresponding to the O1s transition also shows two components: a main component at 530.1 eV, assigned to oxygen in Zn-O bonds, and a shoulder at ca. 531.3 eV that has been assigned to O
2− ions in the oxygen-deficient regions [
17,
38]. In this catalyst, and as can be deduced from the deconvolution carried out (see
Figure 5B,E), the ratio corresponding to the shoulder/main peak is lower than in the case of the rutile-based catalyst, which undoubtedly has implications for the catalytic behavior [
36,
37]. Finally, as with the rutile-based catalyst, the Ag nanoparticles on the surface are found as metallic silver (see
Figure 5F).
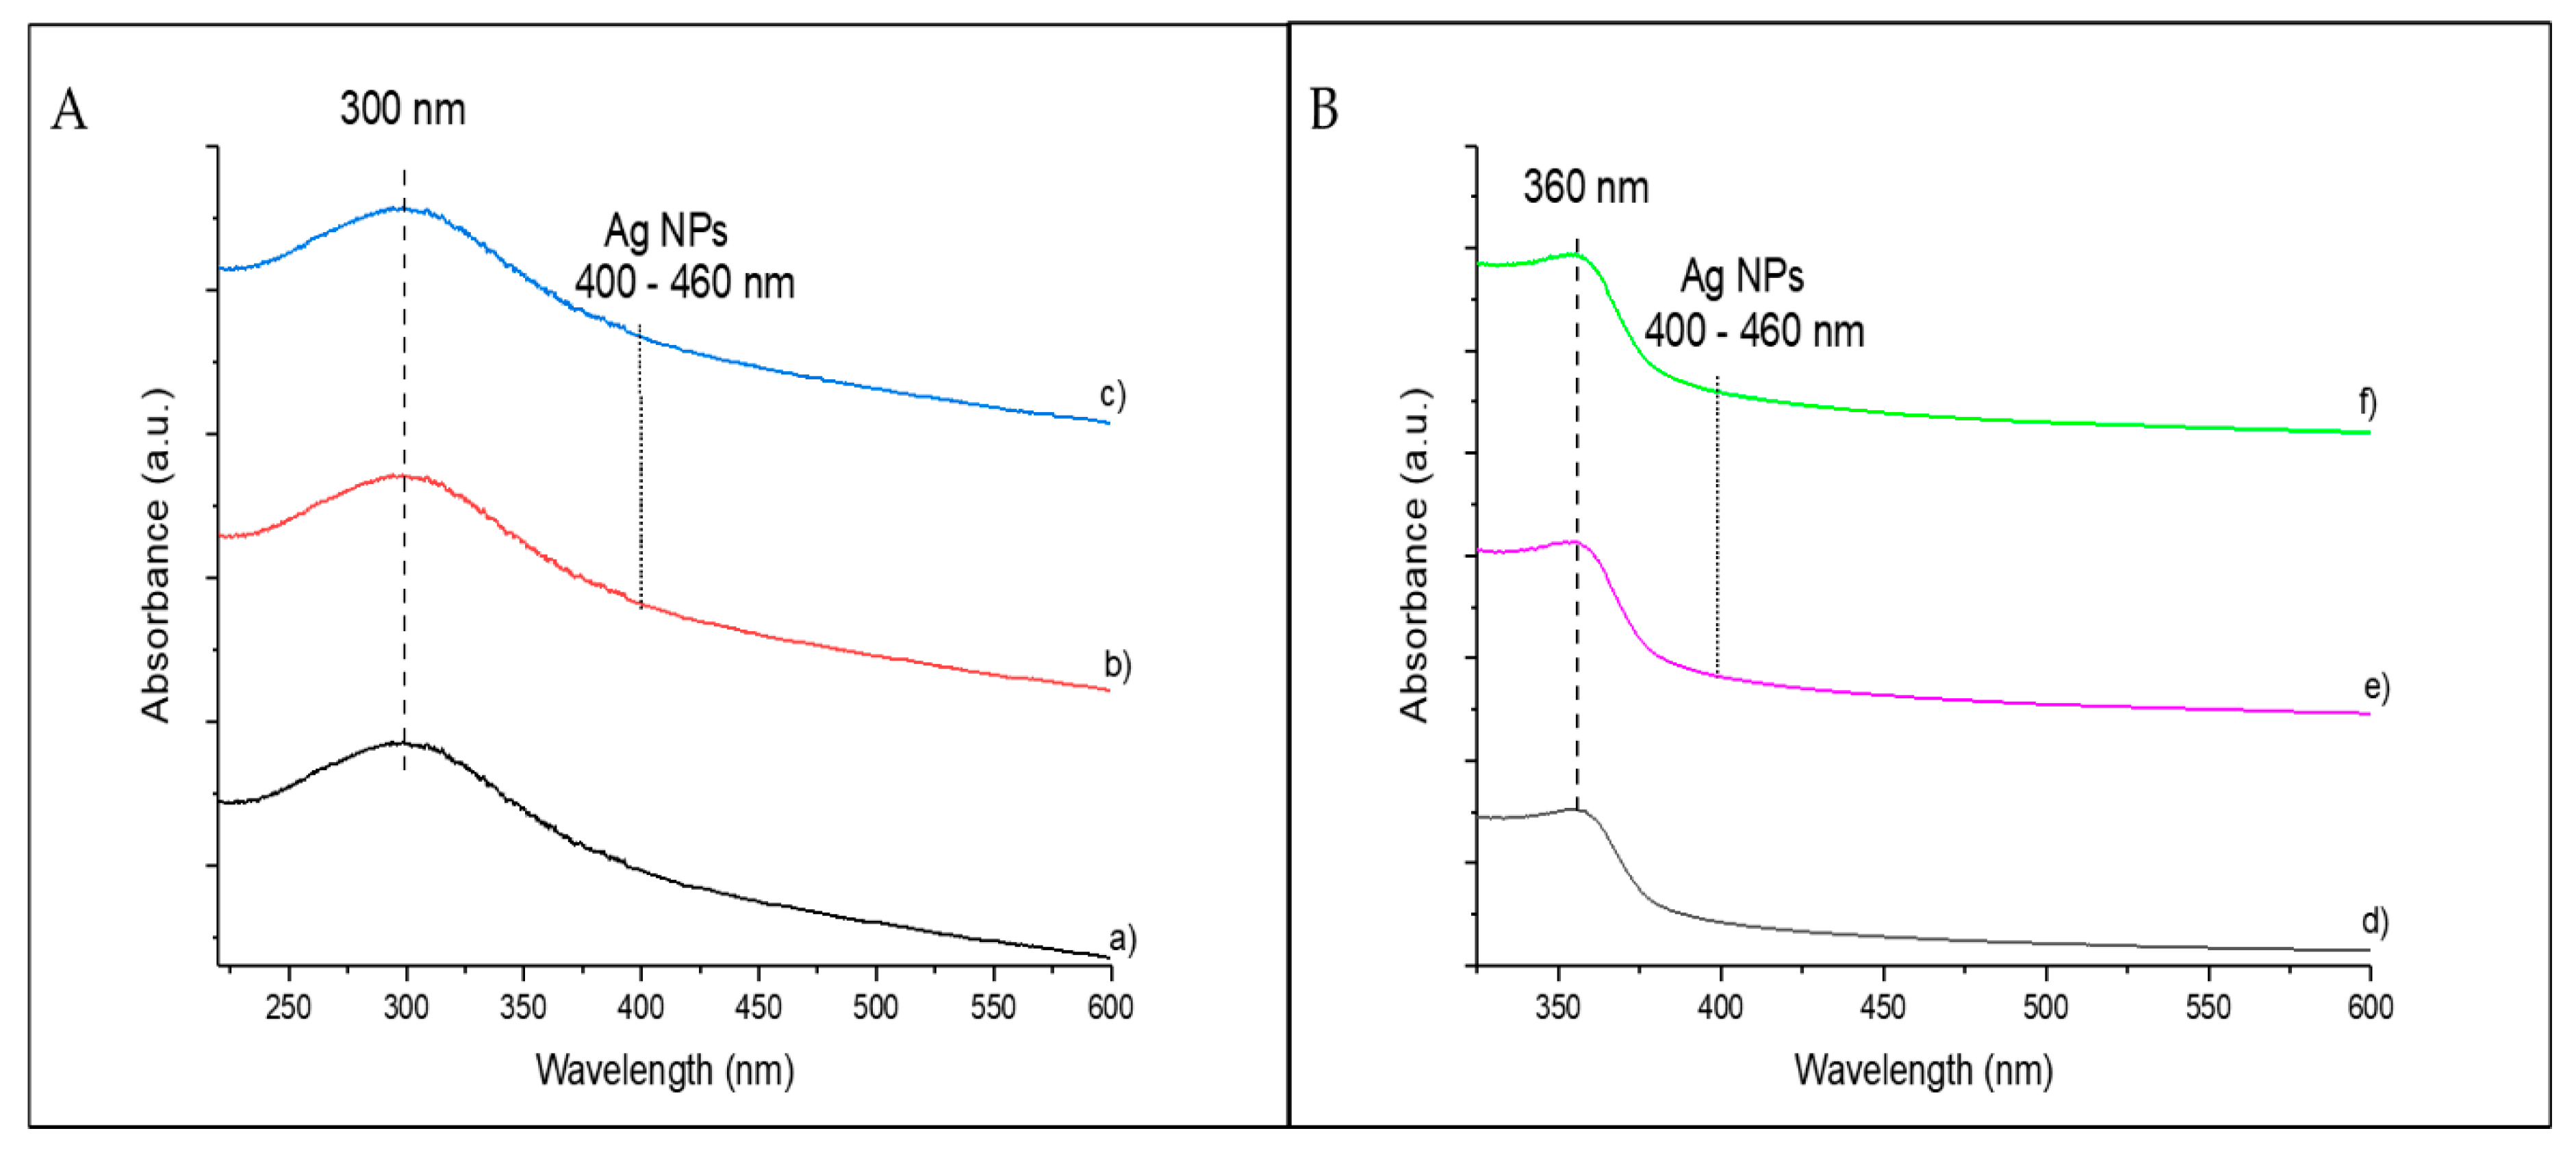
The pristine catalysts and catalysts with 10 wt.% were also characterized by UV–vis spectroscopy (see
Figure 6). The main absorption of TiO
2 (
Figure 6A) was observed at ca. 300 nm, showing low absorption efficiency in the visible range. No additional absorption peaks were detected for any of the Ag@TiO
2-P25 (
Figure 6A,b) and Ag@TiO
2 NW (
Figure 6A,c) catalysts. This result is justified by the limited sensitivity of the spectrophotometer and the small size of the Ag NPs [
39].
In the case of ZnO catalysts, the maximum absorption was observed at ca. 360 nm (
Figure 6B,d,e,f), with very low absorption efficiency in the visible region. As with TiO
2-based catalysts, no peaks associated with the presence of Ag NPs were observed.
3.2. Photocatalytic Hydrogen Production via Water Splitting
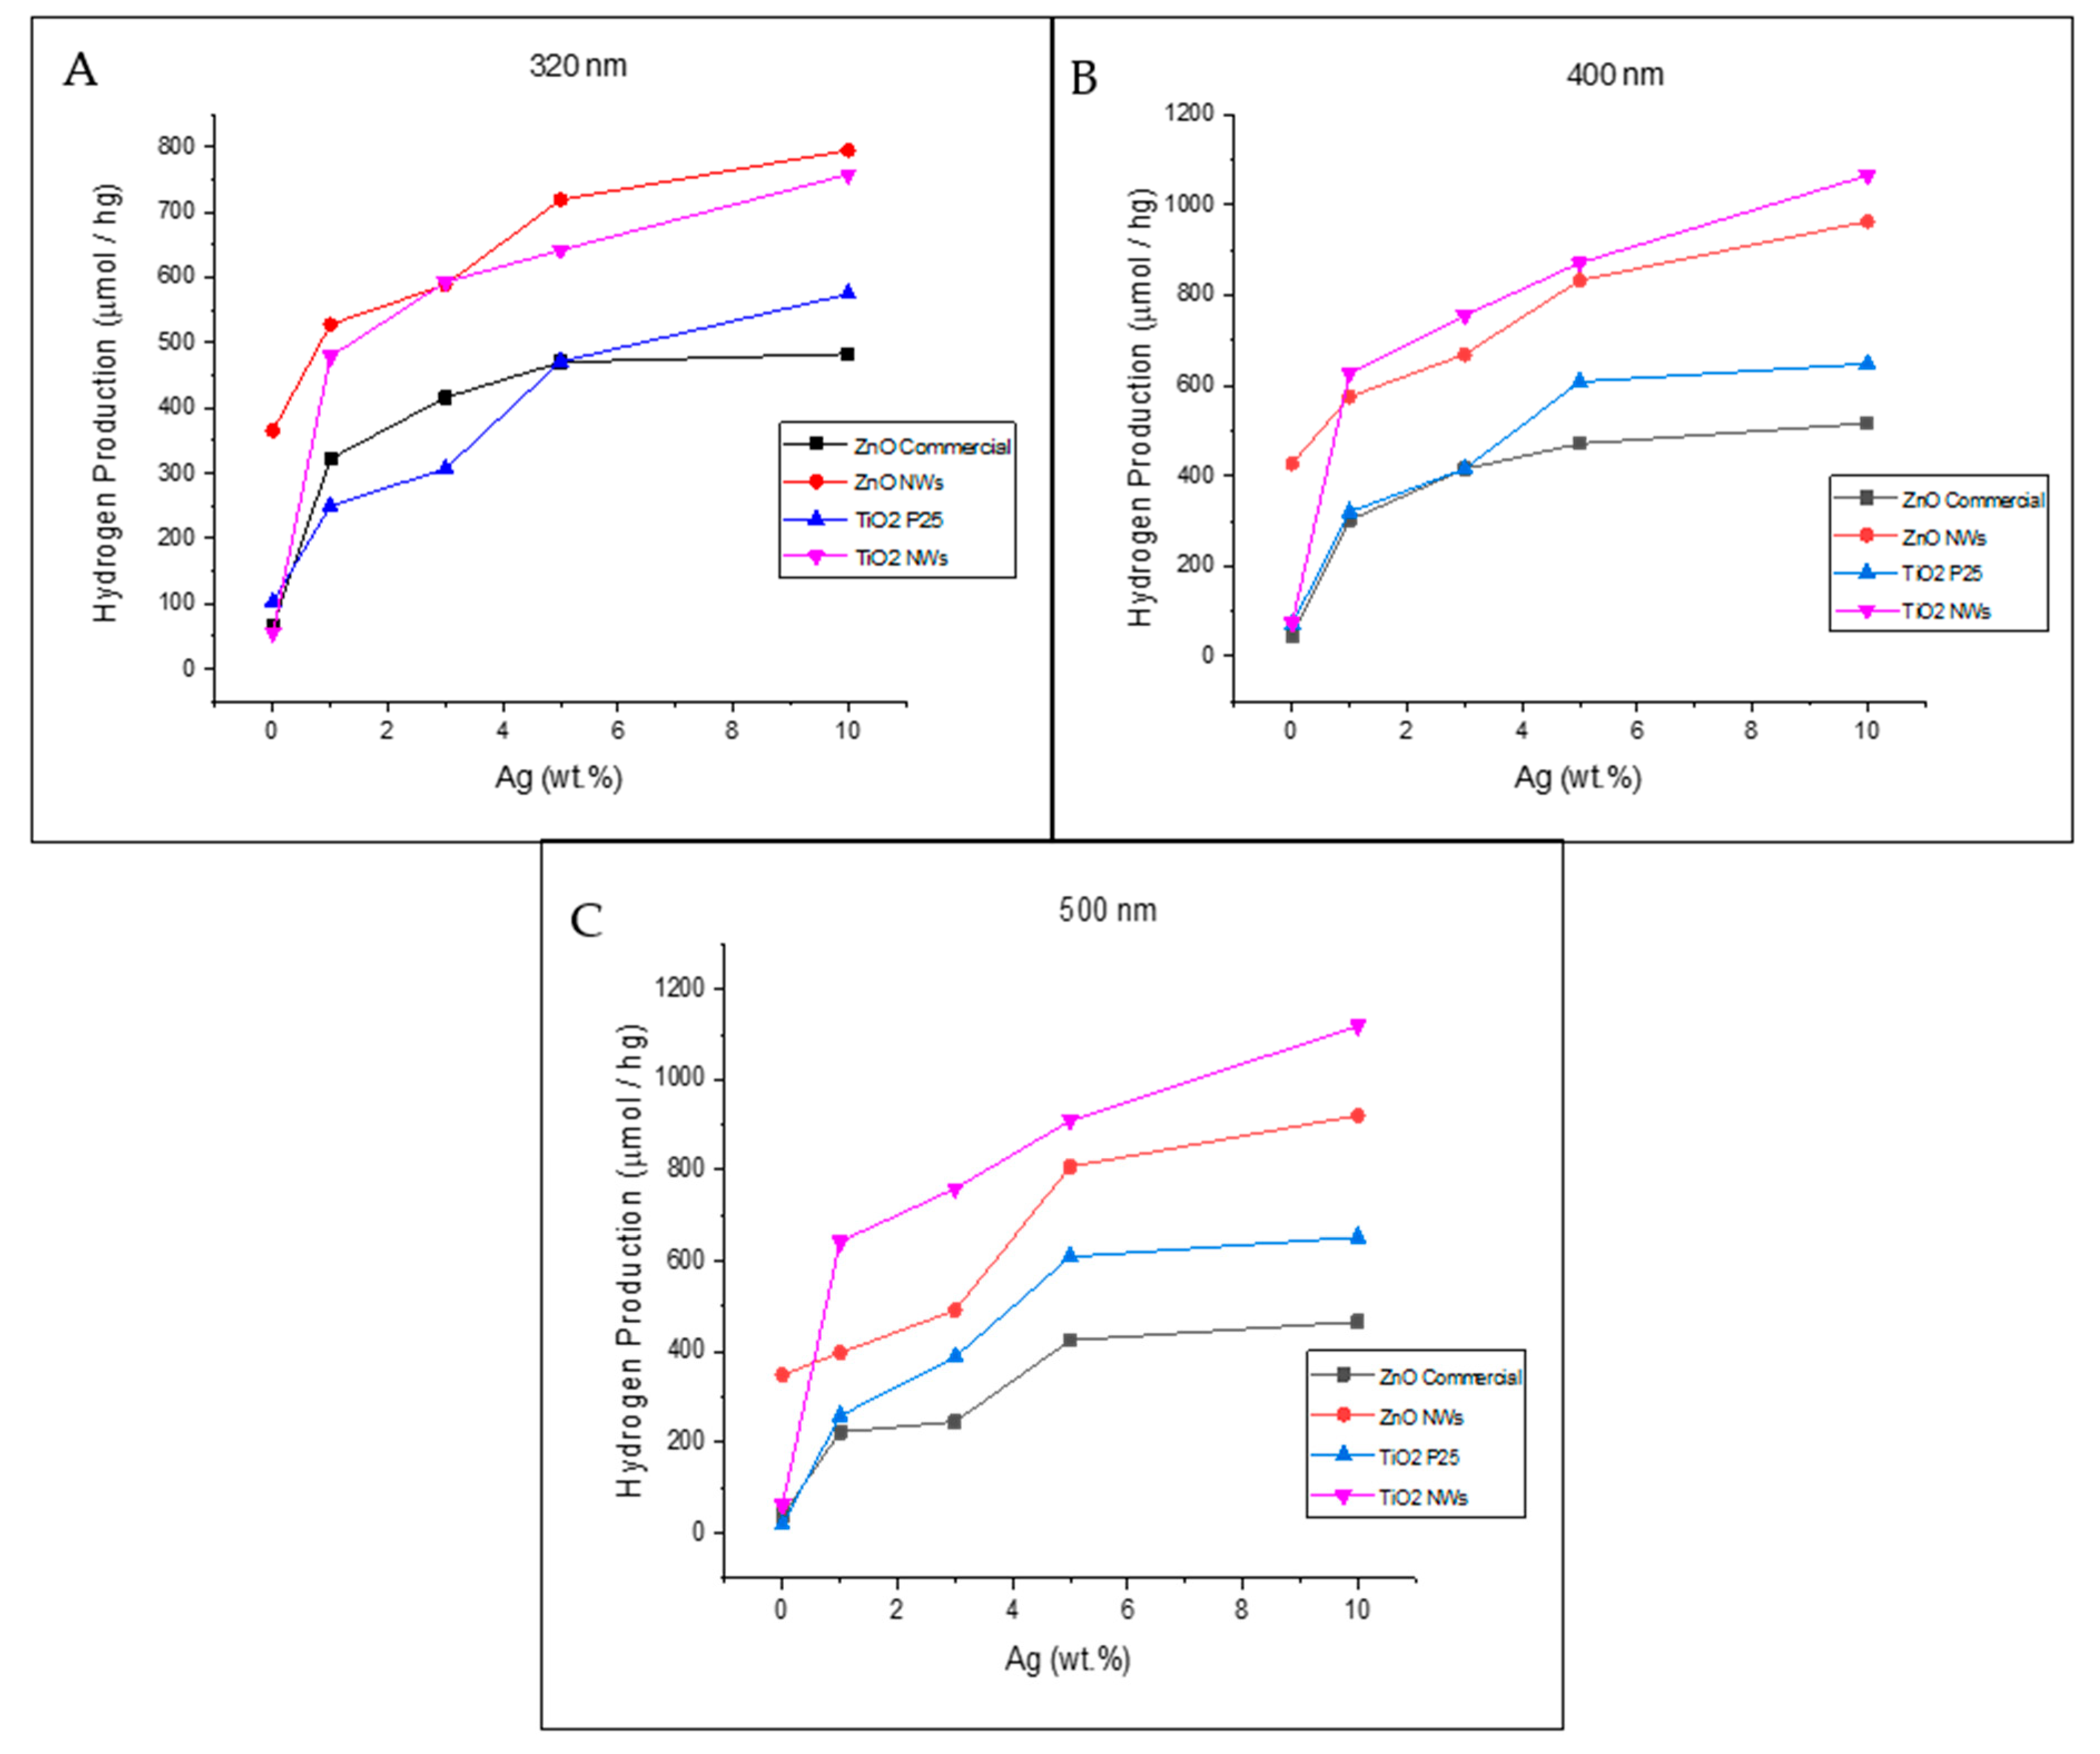
The photocatalytic hydrogen production of the unmodified and silver-based catalysts at wavelengths of 300, 400, and 500 nm is shown in
Figure 7. At 320 nm, the highest hydrogen production was obtained with the 10%Ag@ZnO NWs (795 µmol/hg), followed by 10%Ag@TiO
2 NWs (758 µmol/hg), 10%Ag@TiO
2-P25 (575 µmol/hg), and 10%Ag@ZnO commercial (483 µmol/hg), respectively. When compared with the production of the unmodified catalysts, all the silver-based catalysts increased their hydrogen production over 420 µmol/hg, with the 10%Ag@TiO
2 NWs catalyst being the one with the highest difference, 702 µmol/hg. This represented an increase that was 13.5 times greater than bare TiO
2 NWs. More details can be found in
Table 2.
In all cases, the highest amount of hydrogen was obtained with a silver load of 10% by weight, indicating that even higher hydrogen production could be obtained with higher silver loadings. Another important aspect is that the highest hydrogen production was obtained with the catalyst of higher surface area. Different studies [
34,
40,
41,
42,
43] have found that a key factor in the photocatalytic activity of semiconductors, such as TiO
2 and ZnO, is their high surface area. A high surface area leads to a higher density of localized states [
34], which involve electrons with energies between the conduction and valence bands. These electrons are present due to terminated and unsaturated bonds on the surfaces, providing beneficial charge separation in the form of trapping sites for photo-generated charge carriers [
34]. Although the 10%Ag@TiO
2 NW catalyst has a higher surface area compared to 10%Ag@ZnO NWs (see
Table 1), the 10%Ag@ZnO NW catalyst obtained higher hydrogen production. In fact, the amount of hydrogen obtained by the unmodified ZnO NWs was not expected and it is unusual for ZnO. Zhang et al. [
43] have reported that one-dimensional nanostructures, such as nanowires, may have greater photocatalytic activity due to their large surface-to-volume ratio, as compared to other morphologies. Additionally, different studies [
43,
44,
45] reveal that surface properties such as surface defects and oxygen vacancies of photocatalysts play a significant role in photocatalytic activity. These studies argue that the crystalline defects of ZnO nanowires exist primarily due to oxygen vacancies and that nanoparticles with crystalline defects can exhibit visible light photocatalysis even without doping with transitional metals.
At 320 nm (UV light), direct photoexcitation of TiO
2 or ZnO with photons of energy greater than the bandgap (λ < 380 nm) is assumed, leading to the generation of electrons in the semiconductor conduction band and electron holes in the valence band [
46]. The electrons in the conduction band will move to the silver nanoparticles, acting as electron buffers and catalytic sites for hydrogen generation [
46]. The electron holes will be quenched by the sacrificial electron donors (SO
32−/SO
42−) [
23,
24].
At 400 nm, the highest hydrogen production values were 1065, 963, 648, and 516 µmol/hg, obtained by 10%Ag@TiO
2 NWs, 10%Ag@ZnO NWs, 10%Ag@TiO
2-P25, and 10%Ag@ZnO commercial, respectively (
Figure 7B). The highest difference in hydrogen production between silver-based and unmodified catalysts was obtained by the 10%Ag@TiO
2 NWs and bare TiO
2 NWs (990 µmol/hg). This amount was 14 times higher than that reported by the pristine catalyst. Details of the other maximum amounts and differences can be found in
Table 3.
As it was seen at 320 nm, the highest hydrogen production at 400 nm was obtained with the catalysts of 10 wt.% of silver loadings and higher surface areas. This is an indication that it could be possible to increase the amount of hydrogen at higher silver loadings. At 400 nm, the Ag@TiO
2 NW catalysts produced more hydrogen than the Ag@ZnO NW composites. This could be attributed to the marked difference in surface area between the catalysts (see
Table 1) and the band gap energies of the supports. ZnO has a bandgap energy of 3.37 eV, while for TiO
2, the bandgap is somewhat lower (3.2 eV, anatase); therefore, with a wavelength of 400 nm, it would be easier to promote the excitation of the electrons in the valence band of TiO
2 than those of ZnO [
42].
It is assumed that when irradiated with visible light (λ > 400 nm), photoexcitation of Ag NPs due to plasmon resonance occurs, and electrons from Ag are injected into the TiO
2 or ZnO conduction band, leading to the generation of holes in the Ag NPs [
46]. The water molecule gains the electrons in the conduction band and hydrogen is produced.
At 500 nm, the catalysts with a silver loading of 10% by weight (see
Figure 7C) obtained their highest hydrogen production, as seen at other irradiation wavelengths. The highest hydrogen production of the 10%Ag@TiO
2 NWs, 10%Ag@ZnO NWs, 10%Ag@TiO
2-P25, and 10%Ag@ZnO commercial was 1119, 921, 653, and 466 µmol/hg, respectively, representing an increase in hydrogen production of ca. 18, 2, 36, and 12 times compared to the bare TiO
2 NWs, ZnO NWs, TiO
2-P25, and ZnO commercial catalysts, respectively (see
Table 4). Furthermore, as seen at other wavelengths, the larger the surface area, the greater the hydrogen production. This is an indication of the synergism between the deposited Ag NPs and the surface area of the catalysts. As previously mentioned, at wavelengths above 400 nm (λ > 400 nm), the hydrogen production will depend mainly on the Ag NPs and their ability to inject photoexcited electrons into the conduction band of semiconductors.
Table 5 shows recent research on photocatalytic hydrogen production using silver-based catalysts (Ag@TiO
2 and Ag@ZnO). These investigations consider different parameters such as Ag loading, crystalline structure, morphology of the support and nanoparticles, reaction mixture, and reaction time, among others, when experiments are carried out. Considering the previous scientific literature (see
Table 5), the catalysts synthesized in this research gave rise to the highest hydrogen production values achieved by water splitting. However, it is important to note that the experimental parameters used in the literature were not exactly the same as those used in this research.
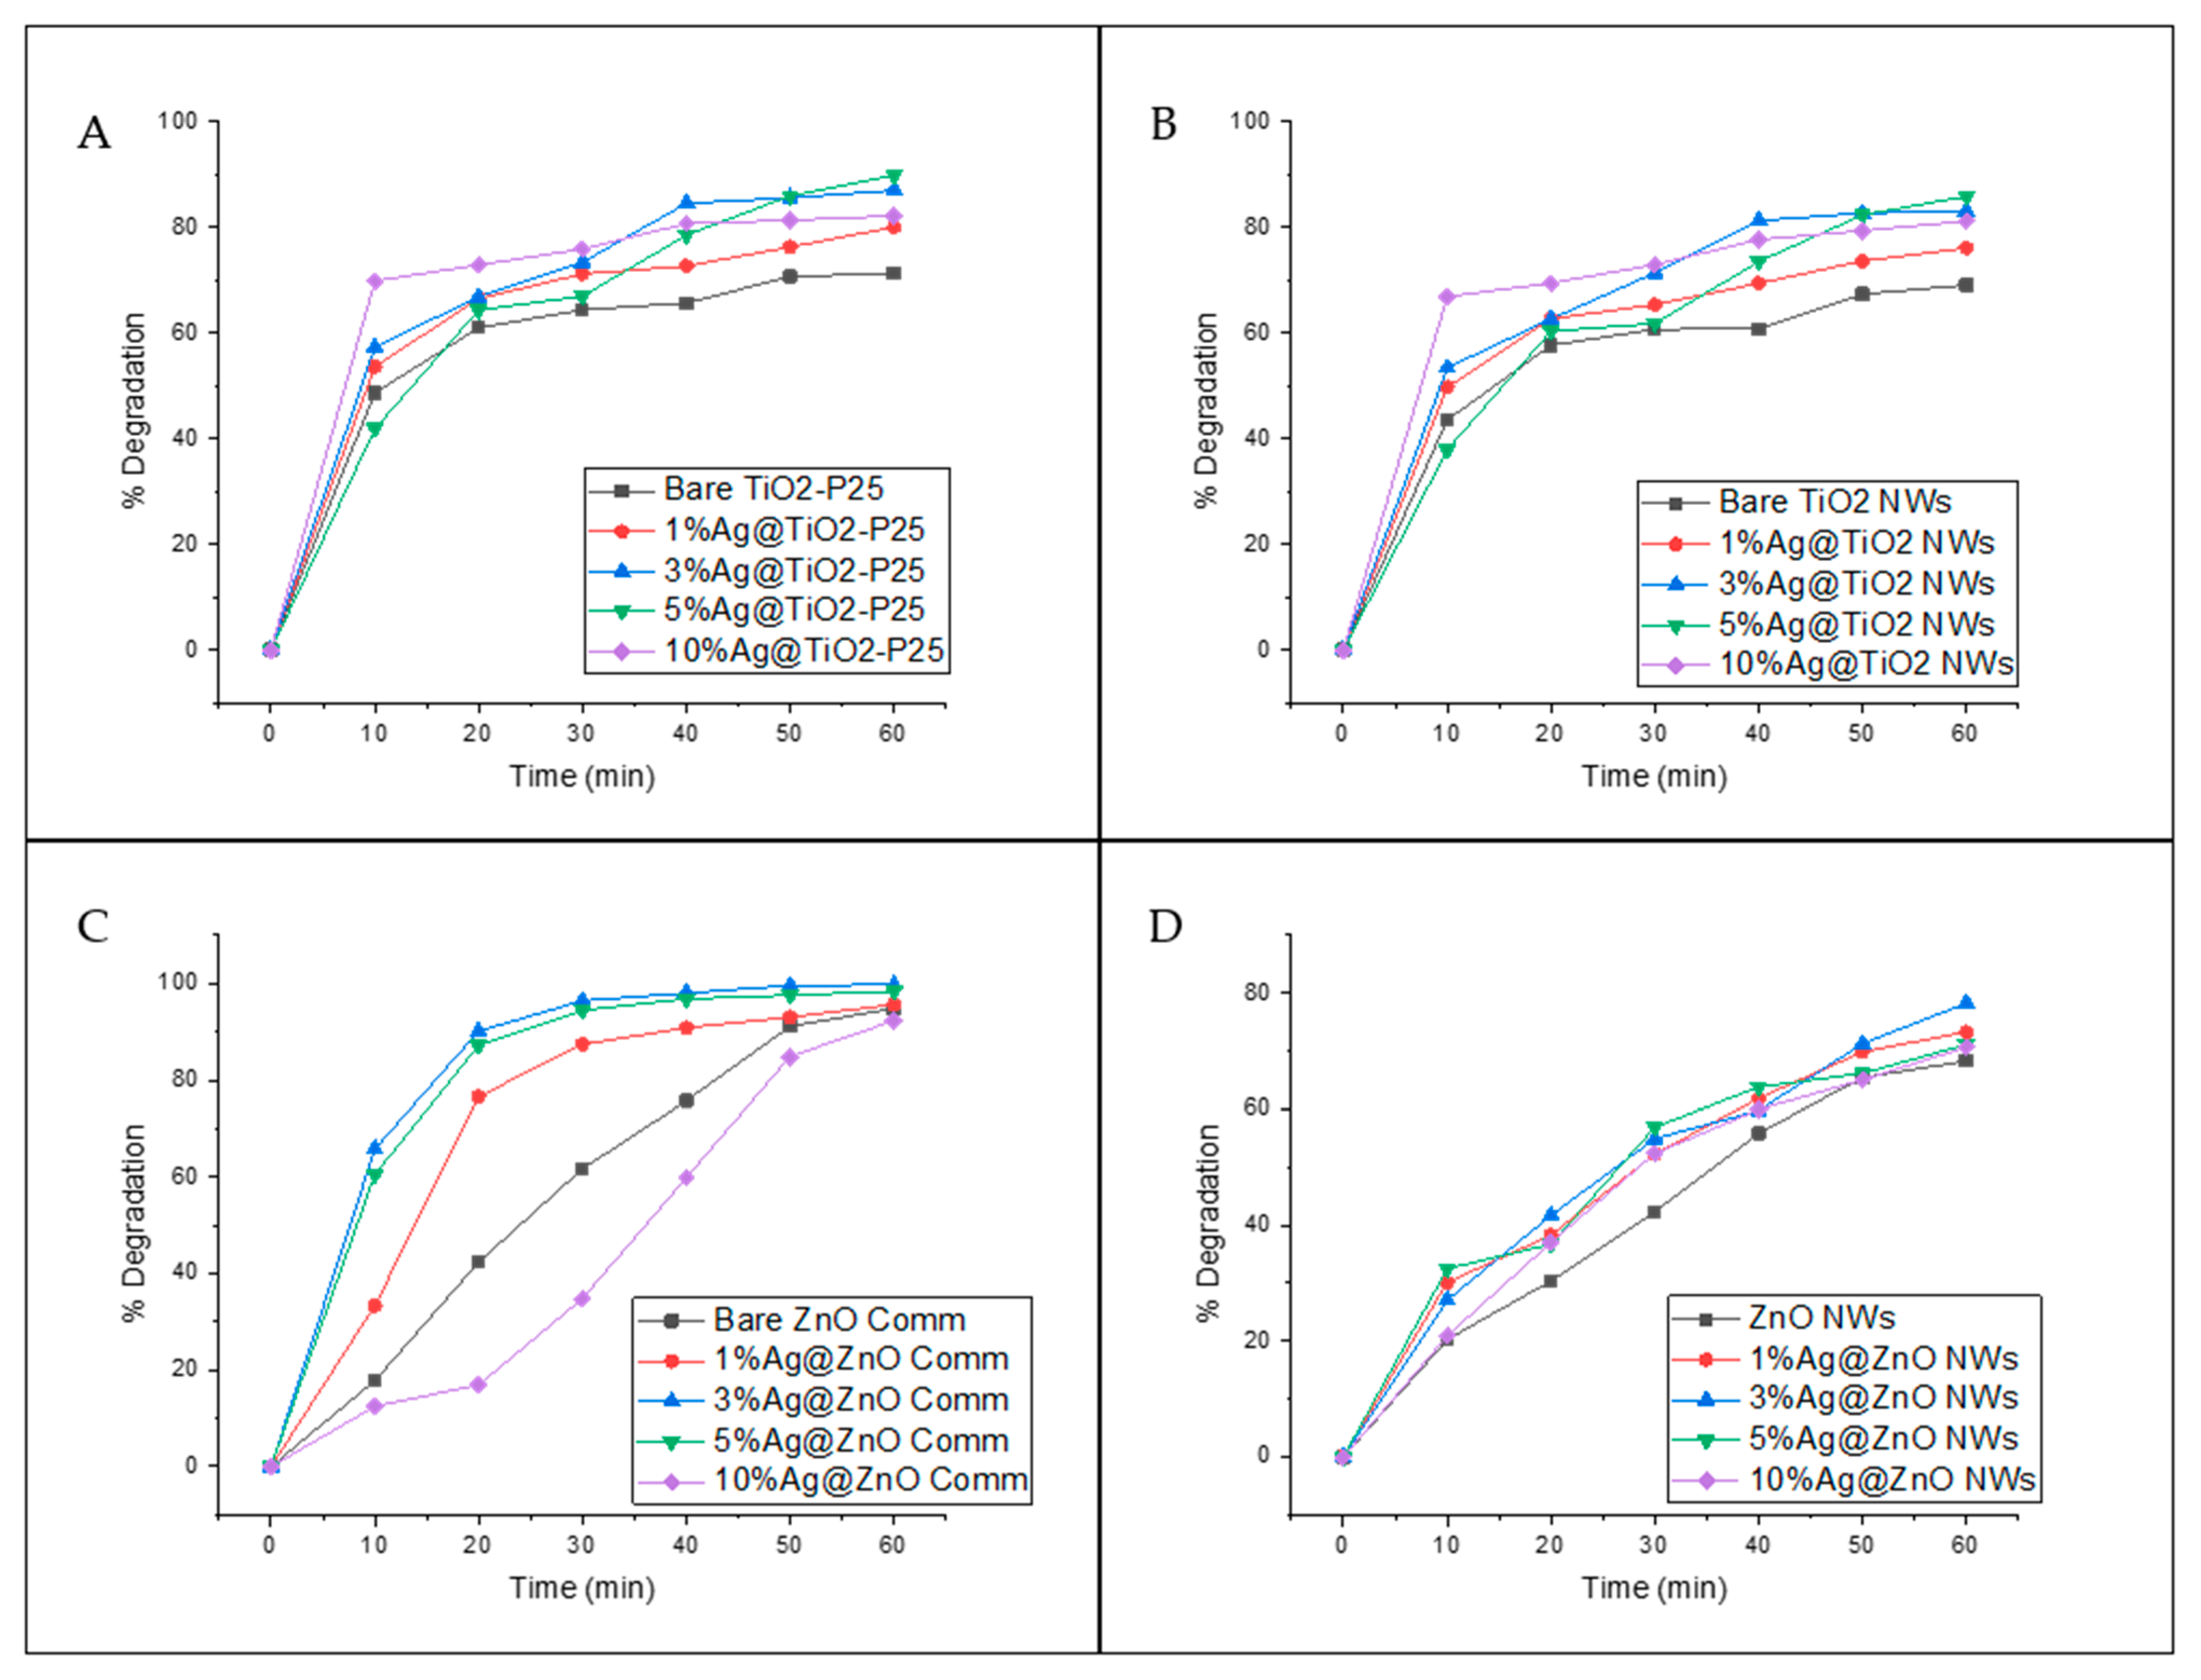
3.3. Photocatalytic Degradation of Ciprofloxacin
The photocatalytic activity of the silver-based catalysts was also studied by the degradation of the antibiotic ciprofloxacin (see
Figure 8 and
Table 6). The incorporation of Ag NPs increased the percentage of degradation in comparison with the unmodified catalysts. The superior performance of the silver-based catalysts is attributed to the combination of its smaller bandgap and plasmonic effects, which allow visible light energy harvesting and improved charge carrier lifetimes [
12]. For the Ag@TiO
2-P25 system (
Figure 8A), the higher degradation was obtained with 5%Ag@TiO
2-P25. However, it should be noted that with 3%Ag@TiO
2-P25, the degradation obtained was only ~3% below the maximum, which means that there is no significant difference between 3%Ag@TiO
2-P25 and 5%Ag@TiO
2-P25. In addition, 10%Ag@TiO
2-P25 degraded approximately 70% of the ciprofloxacin within the first 10 min of the reaction. After that time, less than 15% degradation was observed, possibly due to the lack of active sites on the catalyst’s surface [
48]. Moreover, 3%Ag@TiO
2-P25 showed ca. 85% degradation after 40 min of reaction and increased to only 87% at 60 min. According to these results, the water treatment could be stopped at 40 min. After this reaction time, 10% Ag@TiO
2-P25 did not show a significant increase in degradation, which could indicate that a saturation point was reached.
The Ag@TiO
2 NW system (
Figure 8B) yielded similar results to those mentioned above. The highest degradation percentage, 86%, was obtained with 5%Ag@TiO
2NWs and showed a continuous degradation pattern, suggesting that there is no saturation point. Similar results have been reported by other authors [
19]. Although all the Ag@TiO
2NWs catalysts have a higher surface area than Ag@TiO
2-P25, the degradation percentages were better for Ag@TiO
2-P25 catalysts. Some authors [
49] have reported similar results and have justified them as due mainly to the crystalline structure of the catalysts and not so much to the surface area, since it is well known that anatase exhibits better photocatalytic performance than the rutile-type structure. In this regard, TiO
2-P25 is composed of 70% anatase and 30% rutile, while TiO
2 NWs are 100% rutile (see
Figure 3A).
The Ag@ZnO commercial catalysts (bare ZnO commercial, 1%Ag@ZnO commercial, and 10%Ag@ZnO commercial) showed minor efficiency during the first 10 min of reaction (see
Figure 8C). However, after completing the 60 min of reaction, they showed better performance compared to TiO
2 catalysts. This behavior could be attributed to pH, since TiO
2 works better in an acidic environment due to the zero-point charge of this material [
50]. With 3%Ag@ZnO commercial, ~90% degradation was achieved only after 20 min of reaction. No significant difference was observed between 3%Ag@ZnO commercial and 5%Ag@ZnO commercial catalysts. Moreover, these samples degrade +60% of the ciprofloxacin in the first 10 min of reaction, while the bare ZnO took 30 min to reach this point, clearly indicating that the best performance is achieved when the material is doped with Ag.
Ag@ZnO NW (
Figure 8D) catalysts showed lower efficiency compared to the commercial catalyst. All catalysts showed a constant increase over time, suggesting that the catalyst still has active sites available, even after 60 min of reaction, and no saturation point is expected to occur. The highest degradation percentage (ca. 78%) was obtained with 3%Ag@ZnO NWs.
In the case of ZnO commercial and ZnO NWs, both exhibited the same wurtzite crystalline phase (see
Figure 3C,D) but demonstrated a significant difference in degradation percentages. These differences are attributed to the agglomeration of particles; the ZnO commercial consists of a finer powder compared to the as-synthesized material. This might cause agglomeration of the as-synthesized catalyst, enhancing the catalyst–catalyst contact instead of the catalyst–antibiotic contact, reducing the degradation efficiency of the system.
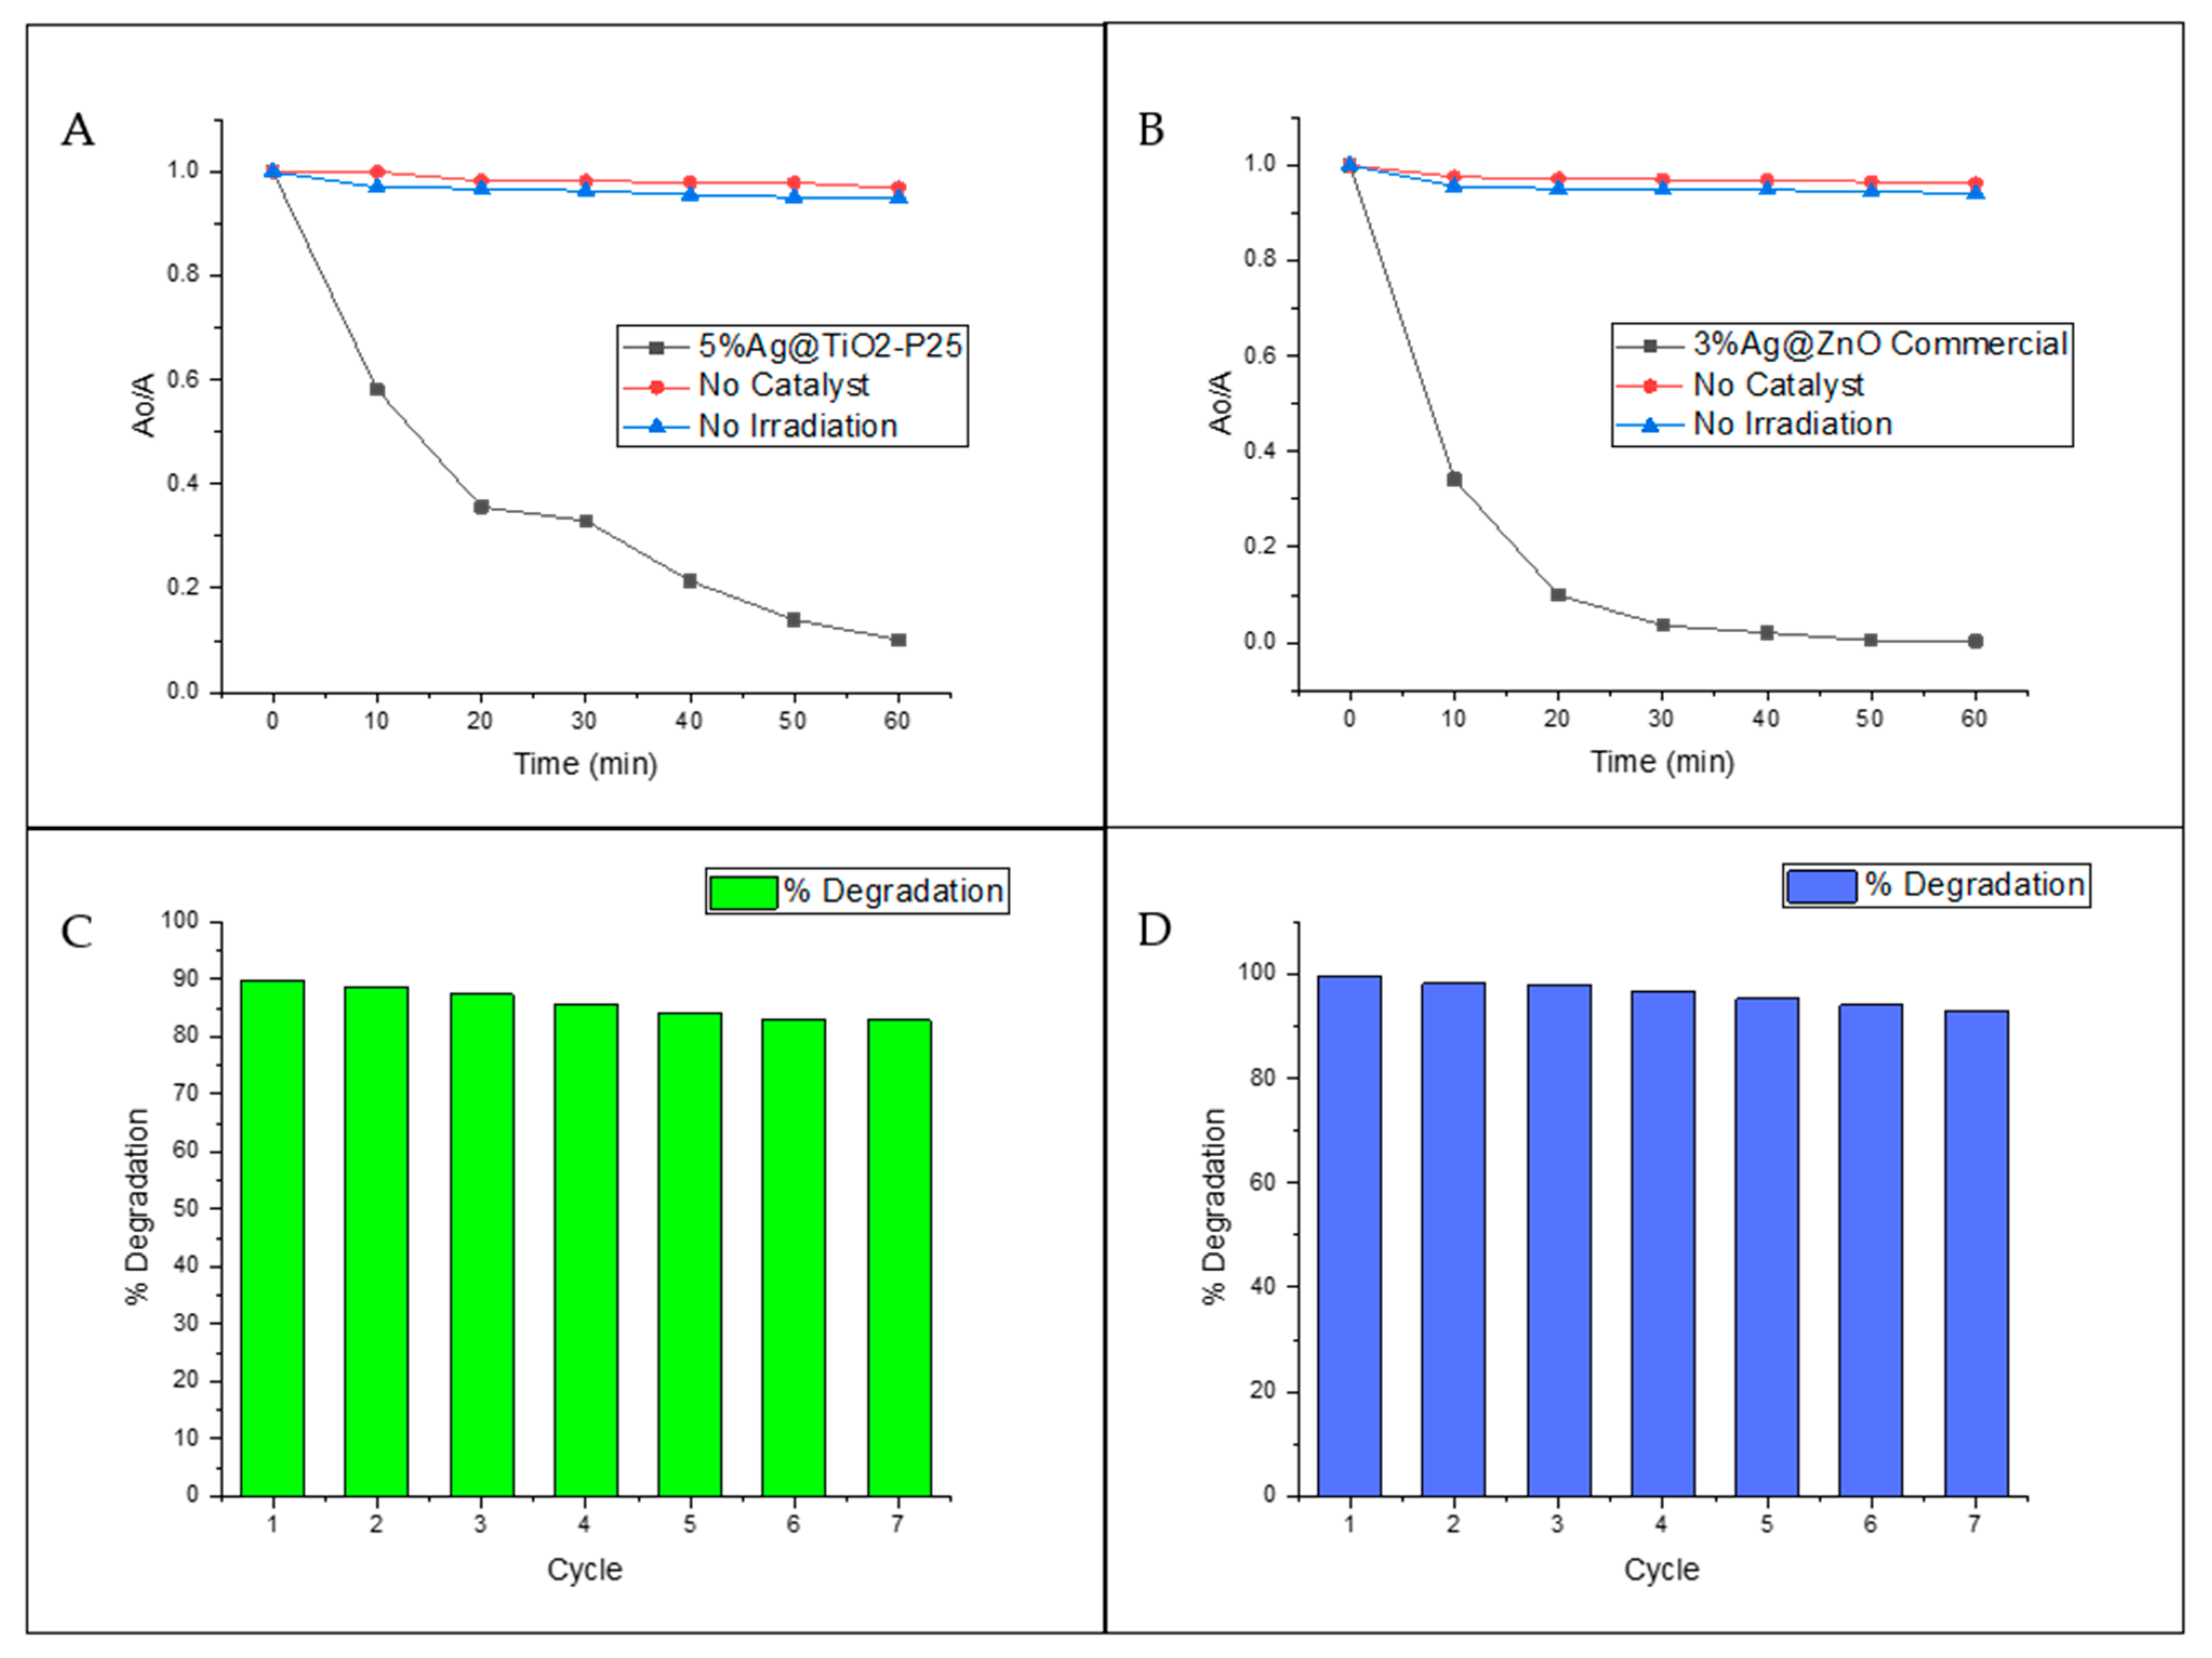
To further study the photocatalytic activity of the silver-based catalysts, control experiments and stability tests were conducted for the two catalysts with the highest percentage of degradation (5%Ag@TiO
2-P25, 3%Ag@ZnO commercial) (
Figure 9). The control experiments for both catalysts were similar (see
Figure 9A,B). After 60 min of reaction, it was observed that ciprofloxacin is highly recalcitrant and stable under normal or environmental conditions. This is evidenced by the fact that no degradation or significant changes in ciprofloxacin concentration are observed over time without the catalyst or radiation source. From the control experiments, it is shown that photocatalysis is the primary degradation route; this means that neither catalysis nor photolysis are enough to degrade the contaminant. Instead, degradation occurs due to a synergistic effect between the catalyst and the radiation source.
The stability tests (
Figure 9C,D) for both catalysts were also very similar. The results showed that even after 60 min of reaction, the catalysts were demonstrated to be highly stable and that no significant chemical change occurred that endangered the efficiency of the materials. After seven cycles, the degradation efficiency decreased by ~7%, which can be estimated as 1% per cycle of use. This rough estimate suggests that these catalysts could be employed for several more cycles without the need for resynthesizing. This means that these materials could decrease the environmental remediation costs if used in contaminated settings.
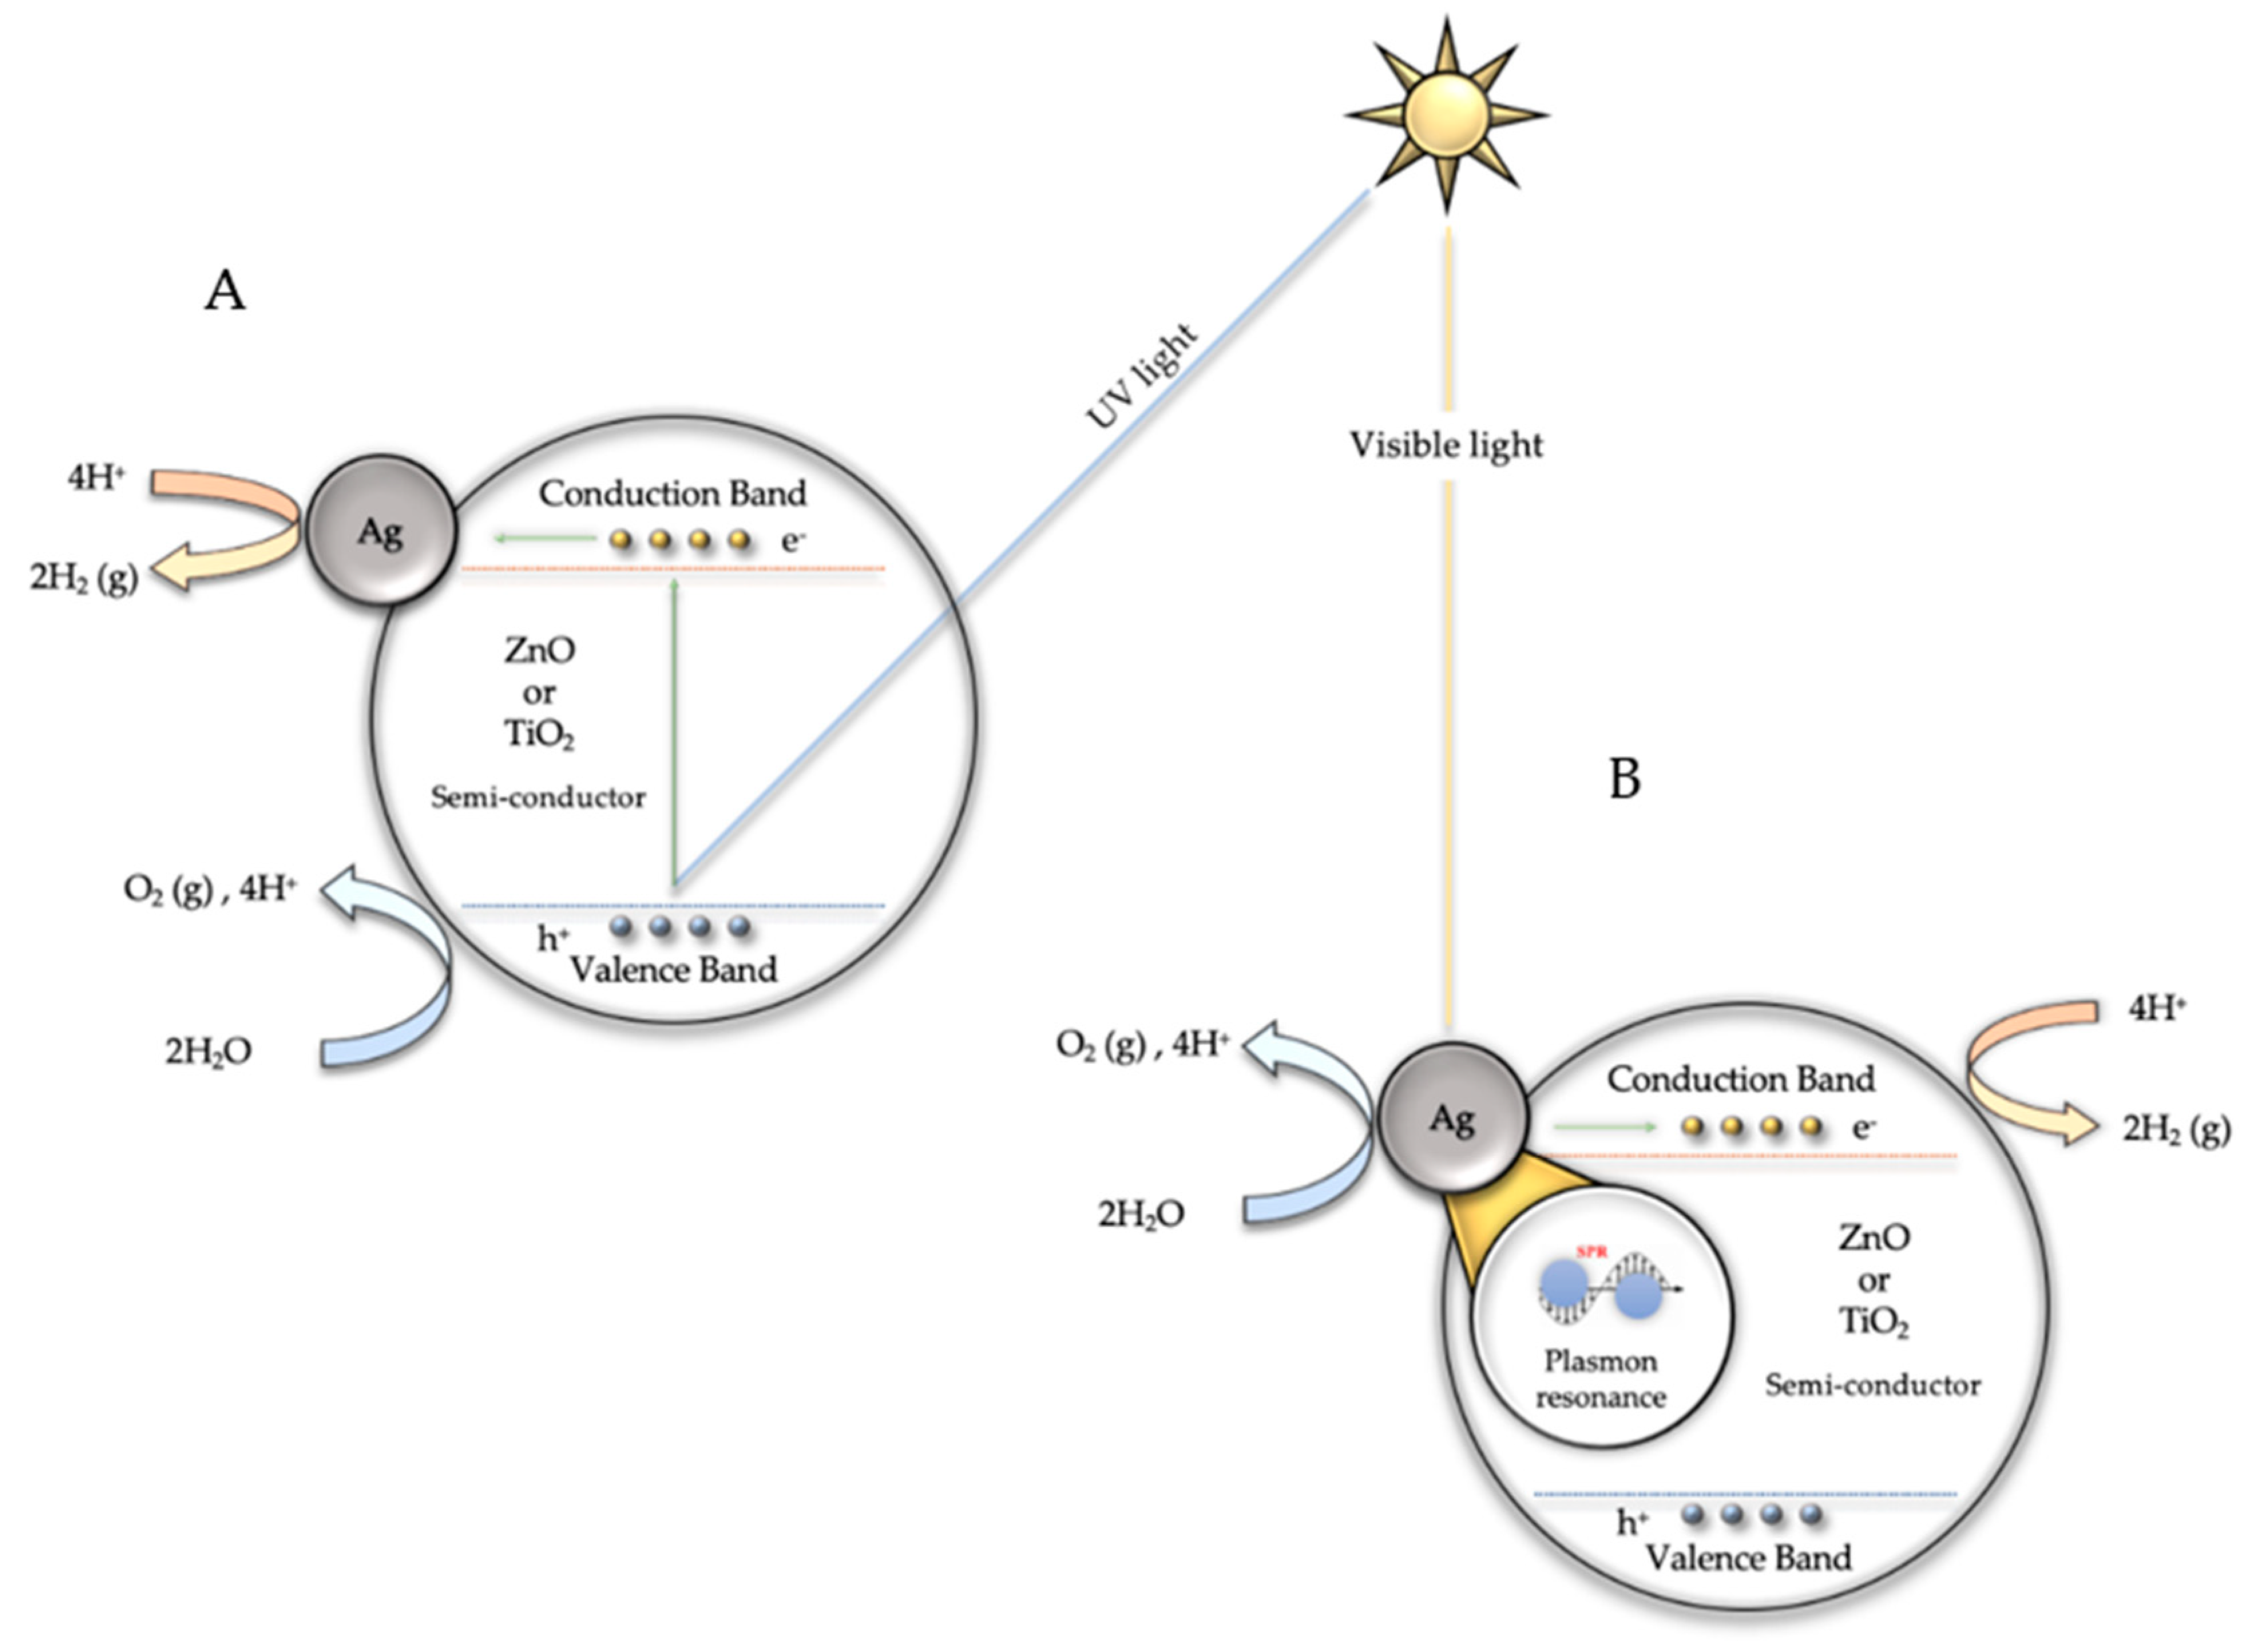
The results obtained have made it possible to establish the possible mechanisms involved in the two processes studied in this research.
Figure 10 shows a possible mechanism for the production of hydrogen via water splitting using Ag@TiO
2 or Ag@ZnO catalysts under visible and ultraviolet light. When irradiated with ultraviolet light (
Figure 10A), direct photoexcitation of TiO
2 or ZnO with photons with energy larger than the bandgap (λ < 380 nm) is assumed, leading to the generation of electrons in the semiconductor conduction band and electron holes in the valence band [
46]. The electron in the conduction band will move to the silver nanoparticles, acting as electron buffers and catalytic sites for hydrogen generation [
11,
12]. The electron holes will be quenched by the sacrificial electron donors (SO
32−/SO
42−). When irradiated with visible light (λ > 400 nm) (
Figure 10B), photoexcitation of Ag NPs occurs and electrons from the Ag are injected into the TiO
2 or ZnO conduction band, leading to the generation of holes in the Ag NPs and electrons in the TiO
2 or ZnO conduction band [
11,
12,
46]. The water molecule gains the electrons in the conduction band and hydrogen is produced. Holes in the Ag NPs will be quenched by the sacrificial electron donors (SO
32−/SO
42−). This proposed mechanism is an oversimplification since different studies [
11,
12,
13] have determined that, due to the silver/titania or silver/zinc oxide interfacial contact, the conduction band of the semiconductor undergoes a shift toward more negative potentials. Thus, the charge distribution between the Ag NPs and the semiconductor causes a shift in the Fermi level toward more negative potentials [
13].
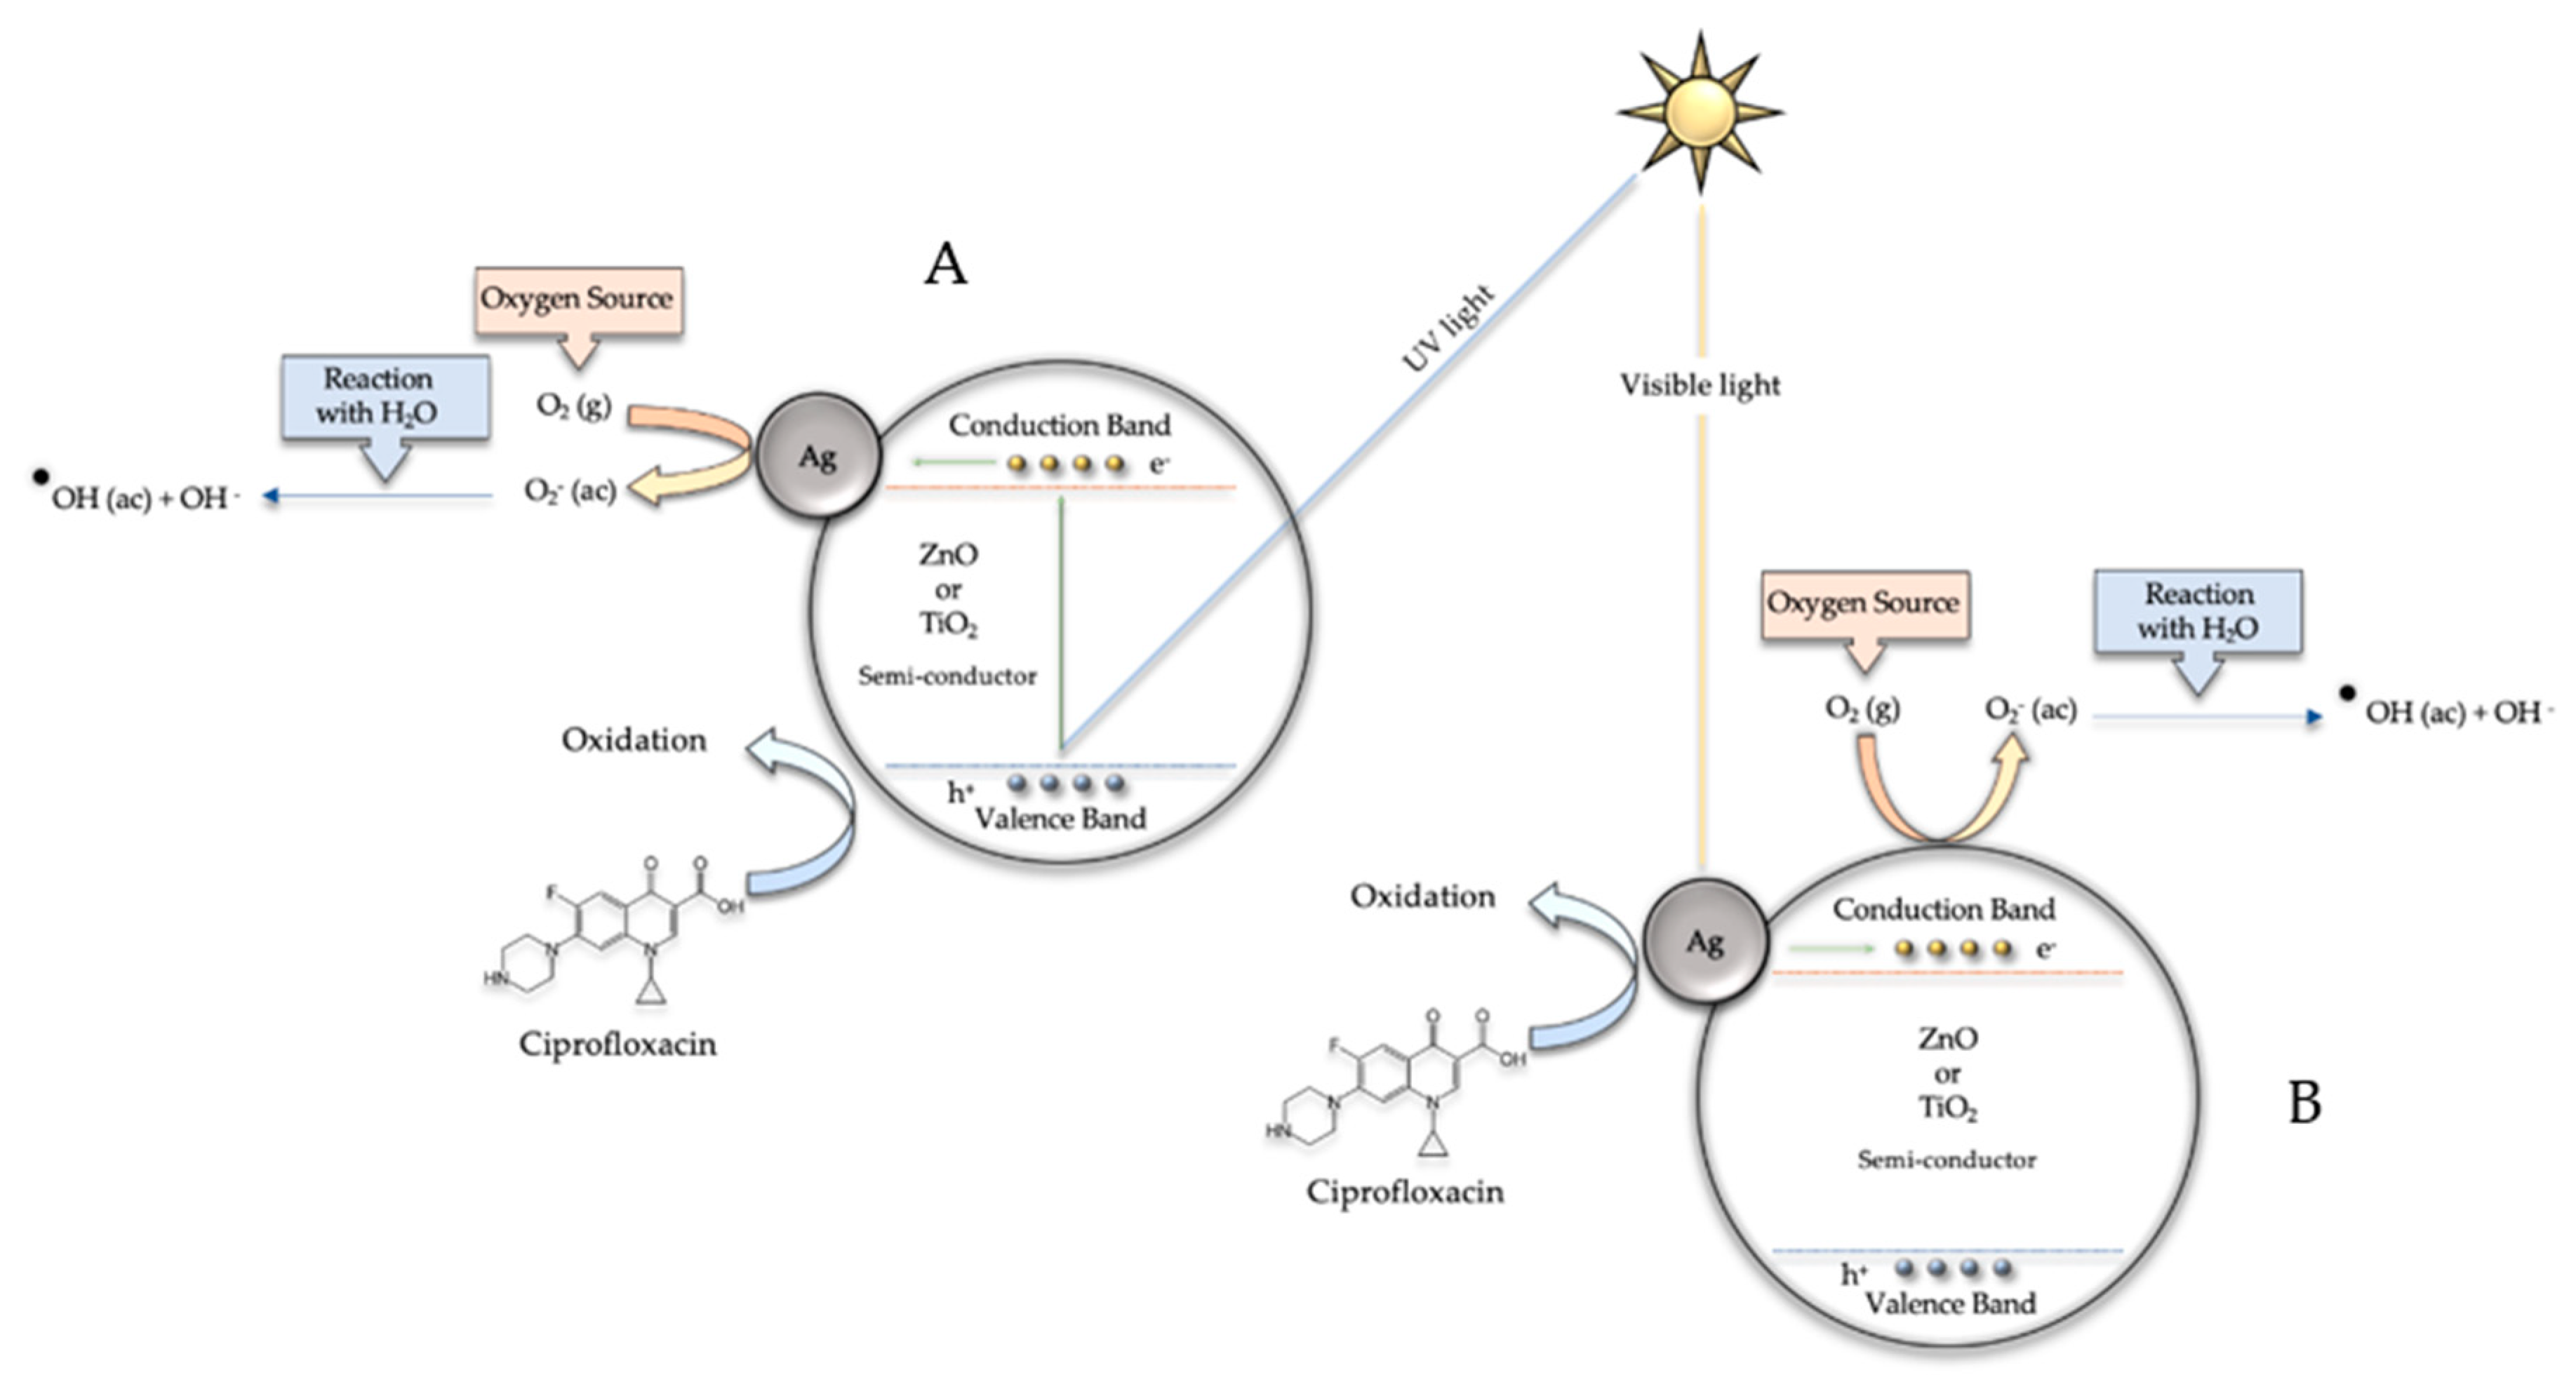
The mechanism for the degradation of ciprofloxacin using the silver-based catalysts is shown in
Figure 11. Under ultraviolet light (
Figure 11A), electrons from the valence band of TiO
2 or ZnO migrate to the conduction band of the semiconductors and holes in the valence band are formed. The electrons in the conduction band move to the Ag NPs, acting as an electron buffer, and these electrons may react with adsorbed molecular oxygen to generate superoxide anions, which in turn can react with water molecules to form hydroxyl radicals. These free radicals are very efficient in the photodegradation of organic pollutants such as ciprofloxacin [
12]. The holes formed in the valence band of the semiconductors then will promote the oxidation of ciprofloxacin and therefore lead to degradation. When irradiated with visible light (
Figure 11B), Ag NPs form an interface with semiconducting materials and a Schottky barrier is formed, resulting in a new Fermi level and a high number of electrons due to the presence of metallic Ag [
12]. Additionally, free electrons are stimulated through the silver surface plasmon resonance mechanism and can move into the conduction band of the partially reduced TiO
2 or ZnO [
12]. These conduction band electrons may react with adsorbed molecular oxygen to generate superoxide anions, then react with water molecules and form hydroxyl radicals that will eventually oxidize the ciprofloxacin. In future research, already under development, the different intermediate compounds generated during the ciprofloxacin degradation process will be analyzed, which will allow us to establish the catalytic photodegradation mechanisms that, eventually, will allow the process to be improved.

 ,
, 


