


An Investigation of a Biomimetic Optical System and an Evaluation Model for the Qualitative Analysis of Laser Interference Visual Levels
Abstract
1. Introduction
2. Biomimetic Eye Optical System
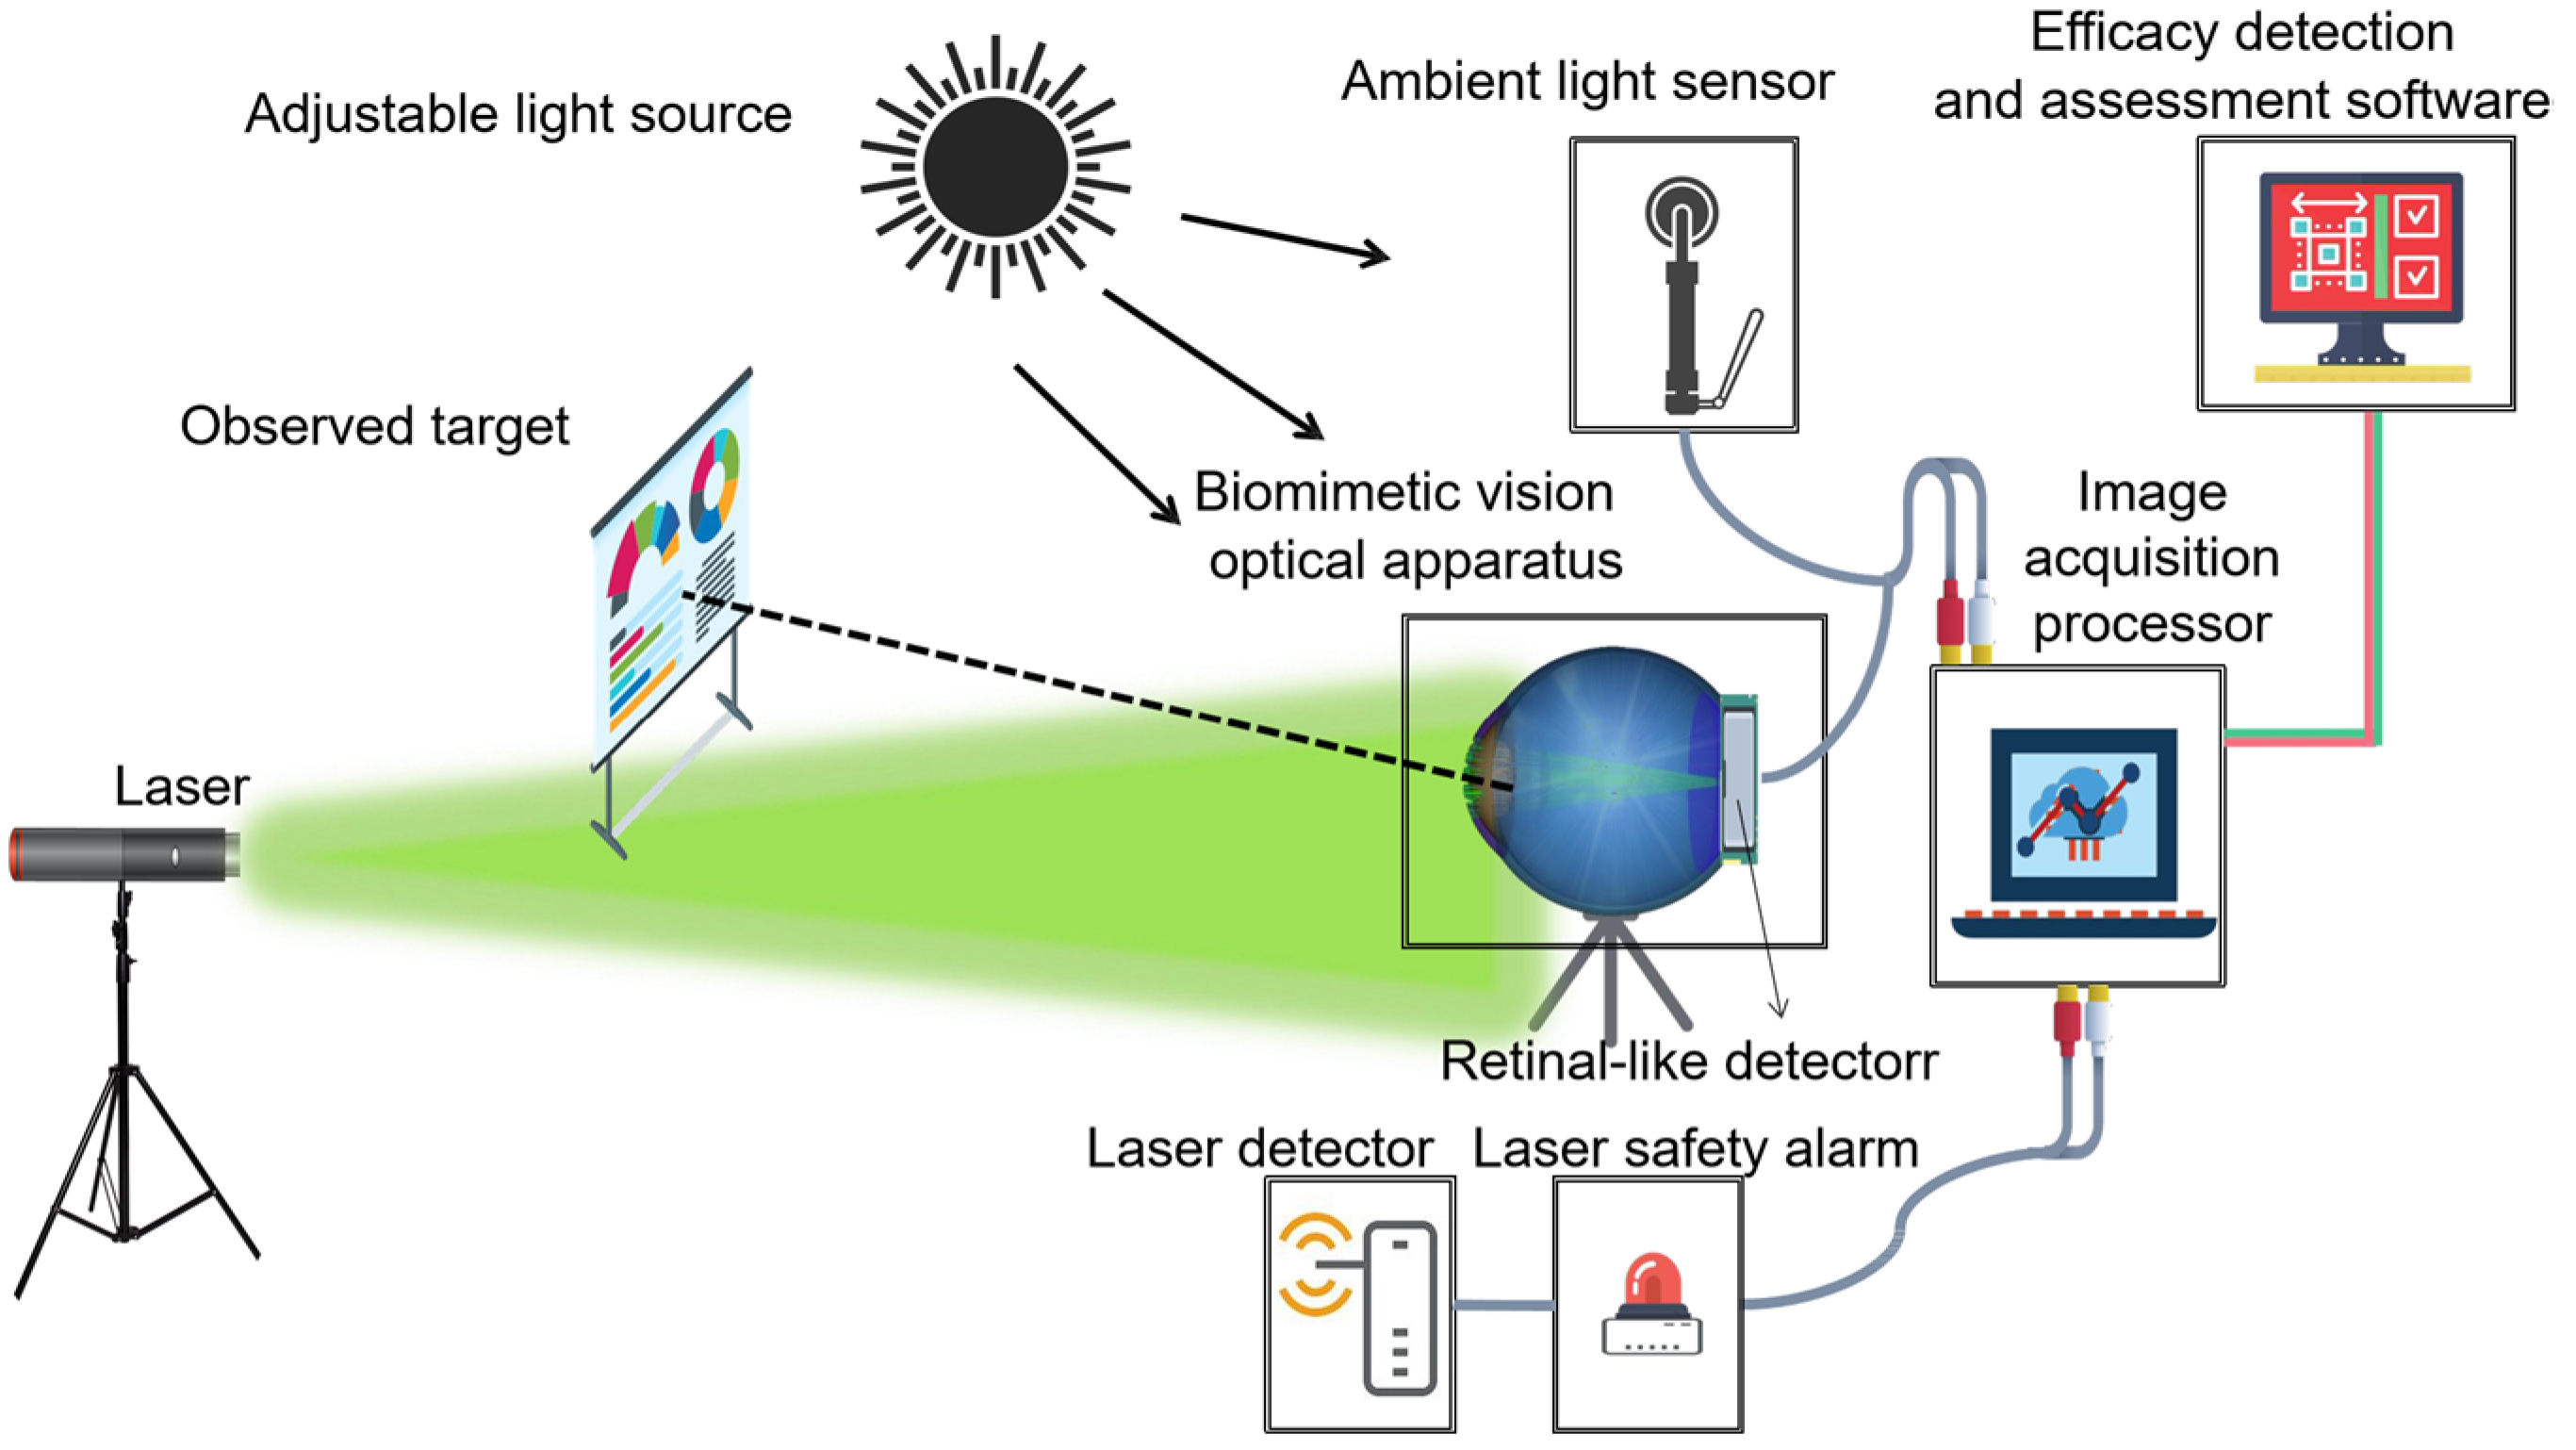
2.1. System Components and Functions
2.2. System Design
2.2.1. Biomimetic Eye Optical Model Design
- To preserve the imaging quality of the lens without compromising the detector’s capability, we replaced the glass material with a combination of MGF2-E, H-FK95N, H-QK3L, and H-FK95N. This maintained the relative refractive index difference between adjacent materials such that the deviation from the relative refractive index difference between any two adjacent layers (cornea and aqueous humor, aqueous humor and lens, lens and vitreous body) in the Gullstrand exact eye model was no greater than 1%.
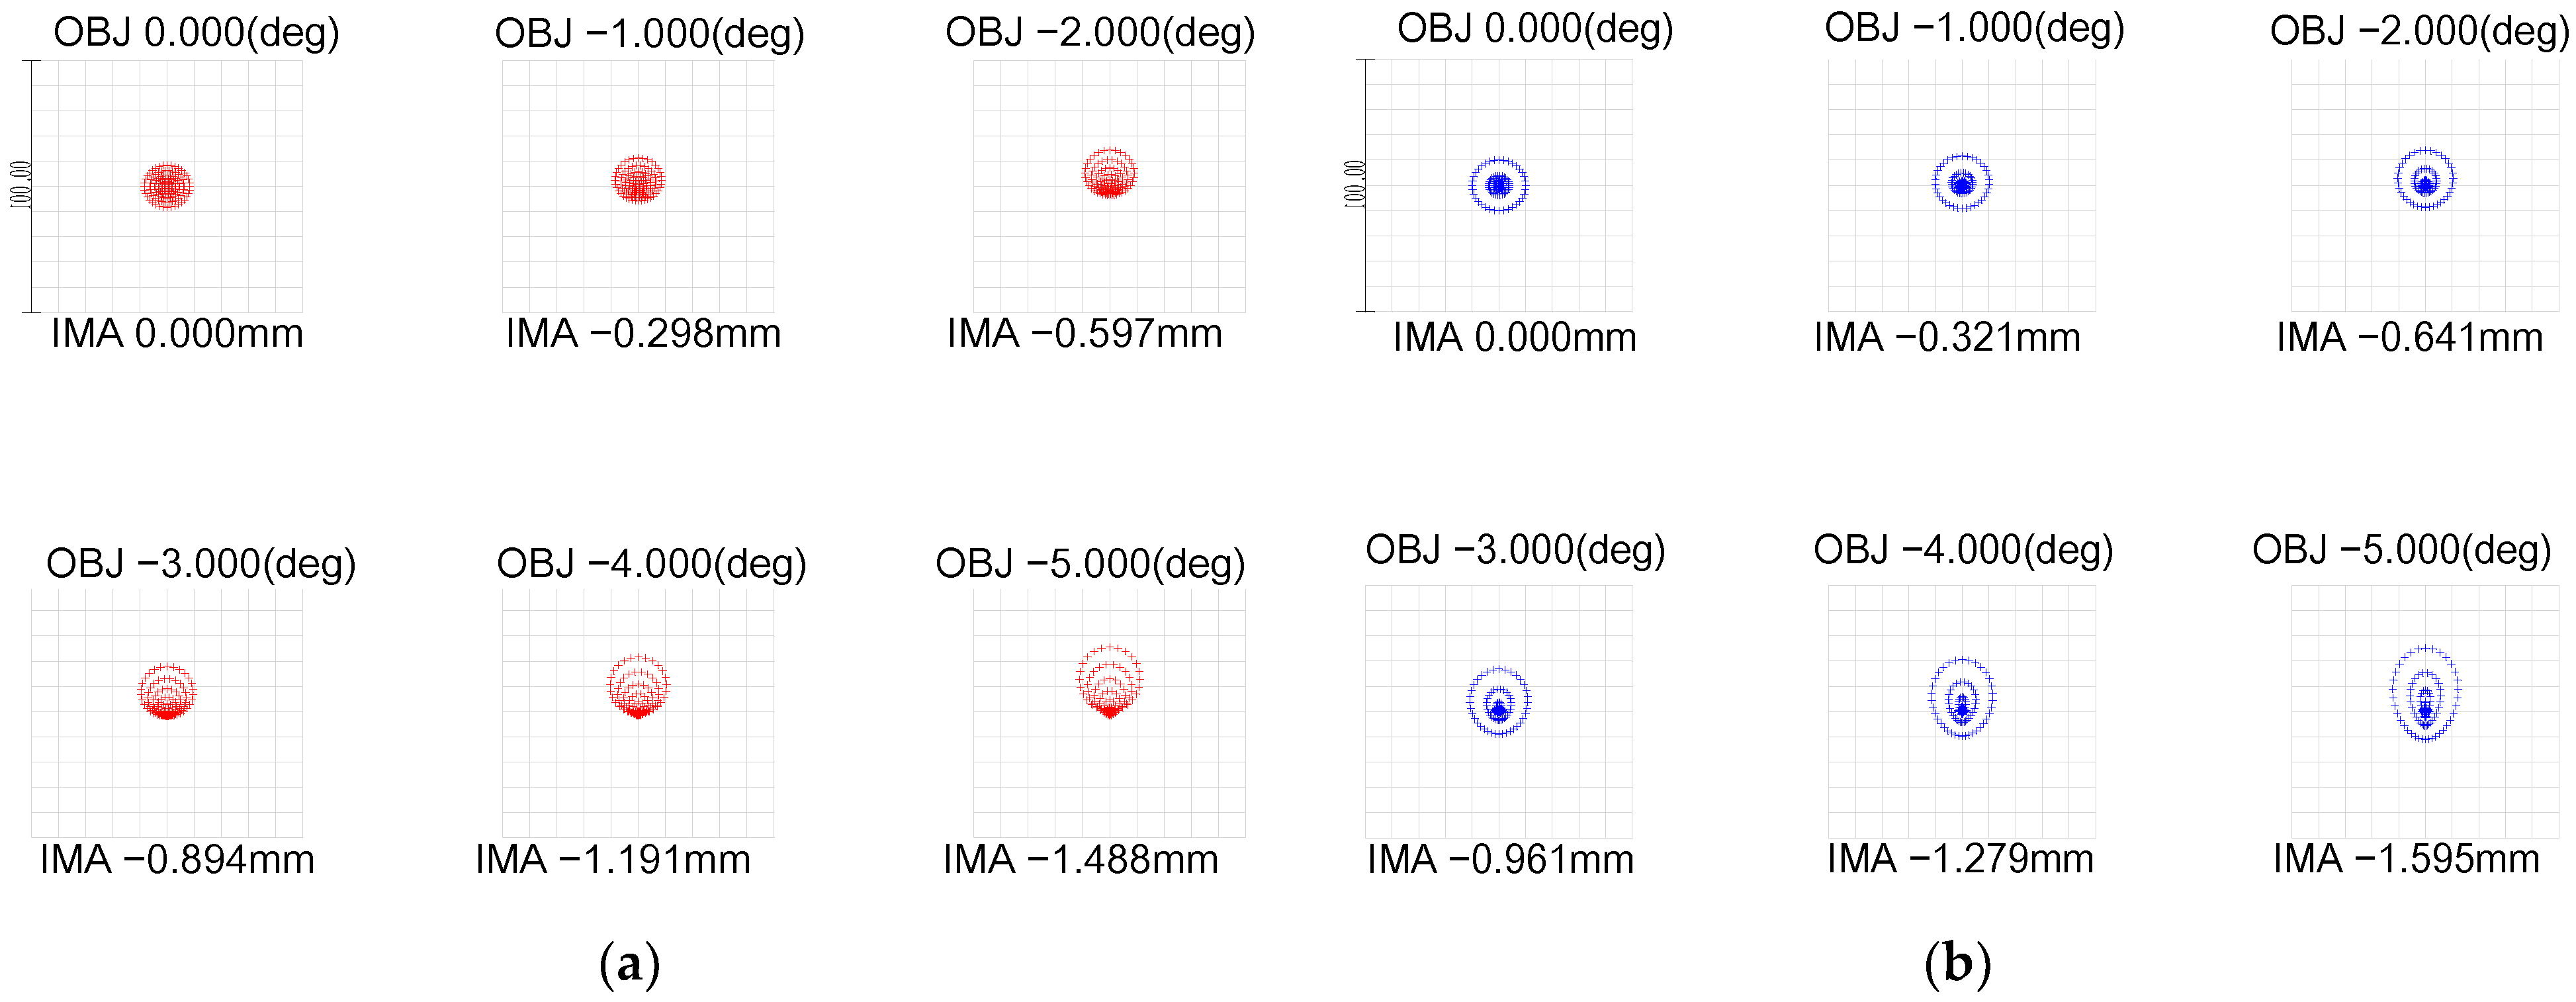
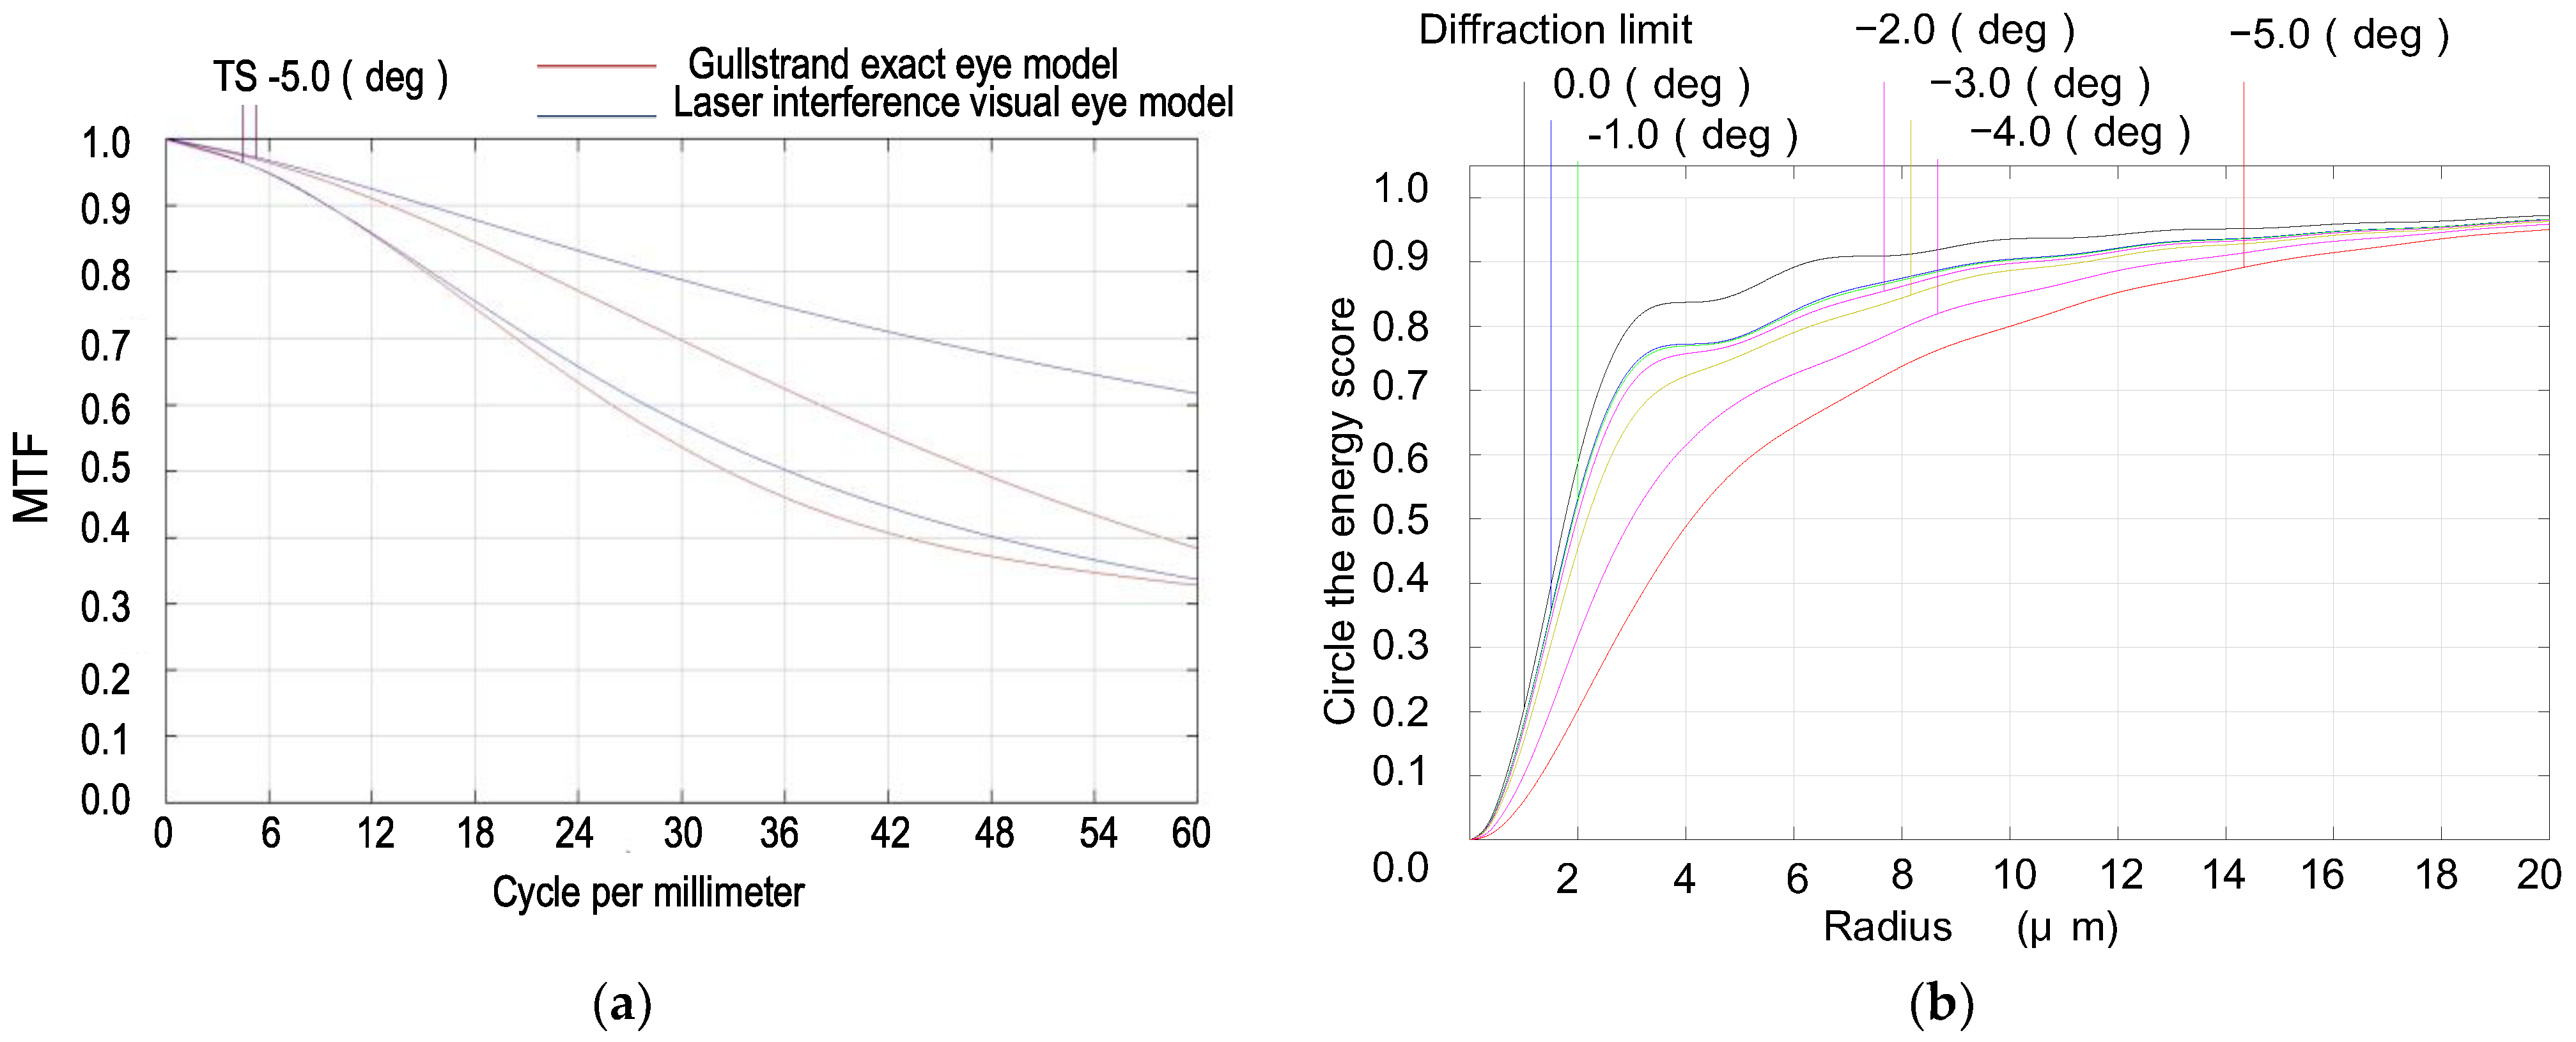
- With an incident pupil diameter of 3 mm (consistent with the normal human eye’s pupil diameter), we optimized the radius of the scattered spot within the paraxial region from −5° to 0° by adjusting structural parameters like curvature radii and glass spacing. Our design values deviated by no more than 10% from those in the Gullstrand exact eye model, as shown in Figure 2 and Table 1.
- Utilizing ZEMAX design software’s operands such as EFFL, AXCL, LACL, SPHA, FCUR, and DIST, we appropriately retained the inherent aberrations of the simulated human eye optical system. As depicted in Figure 3, the MTF (Modulation Transfer Function) of our laser interference visual eye model at a −5° angle of view is 0.32@60lp/mm, with 85.5% of the energy concentrated within a 12 μm radius circle around the centroid. The MTF value for near paraxial light in this model deviates by no more than 0.1 from that of the Gullstrand exact eye model.
- To maximize practical manufacturability, we opted for spherical lenses over aspherical designs. We also adjusted the distance between the aperture and the sixth surface to replicate the effects achieved with aspherical models. Balancing and modifying the thickness of individual lenses mitigated specific imaging discrepancies resulting from material dissimilarities between lenses and human eye tissues.
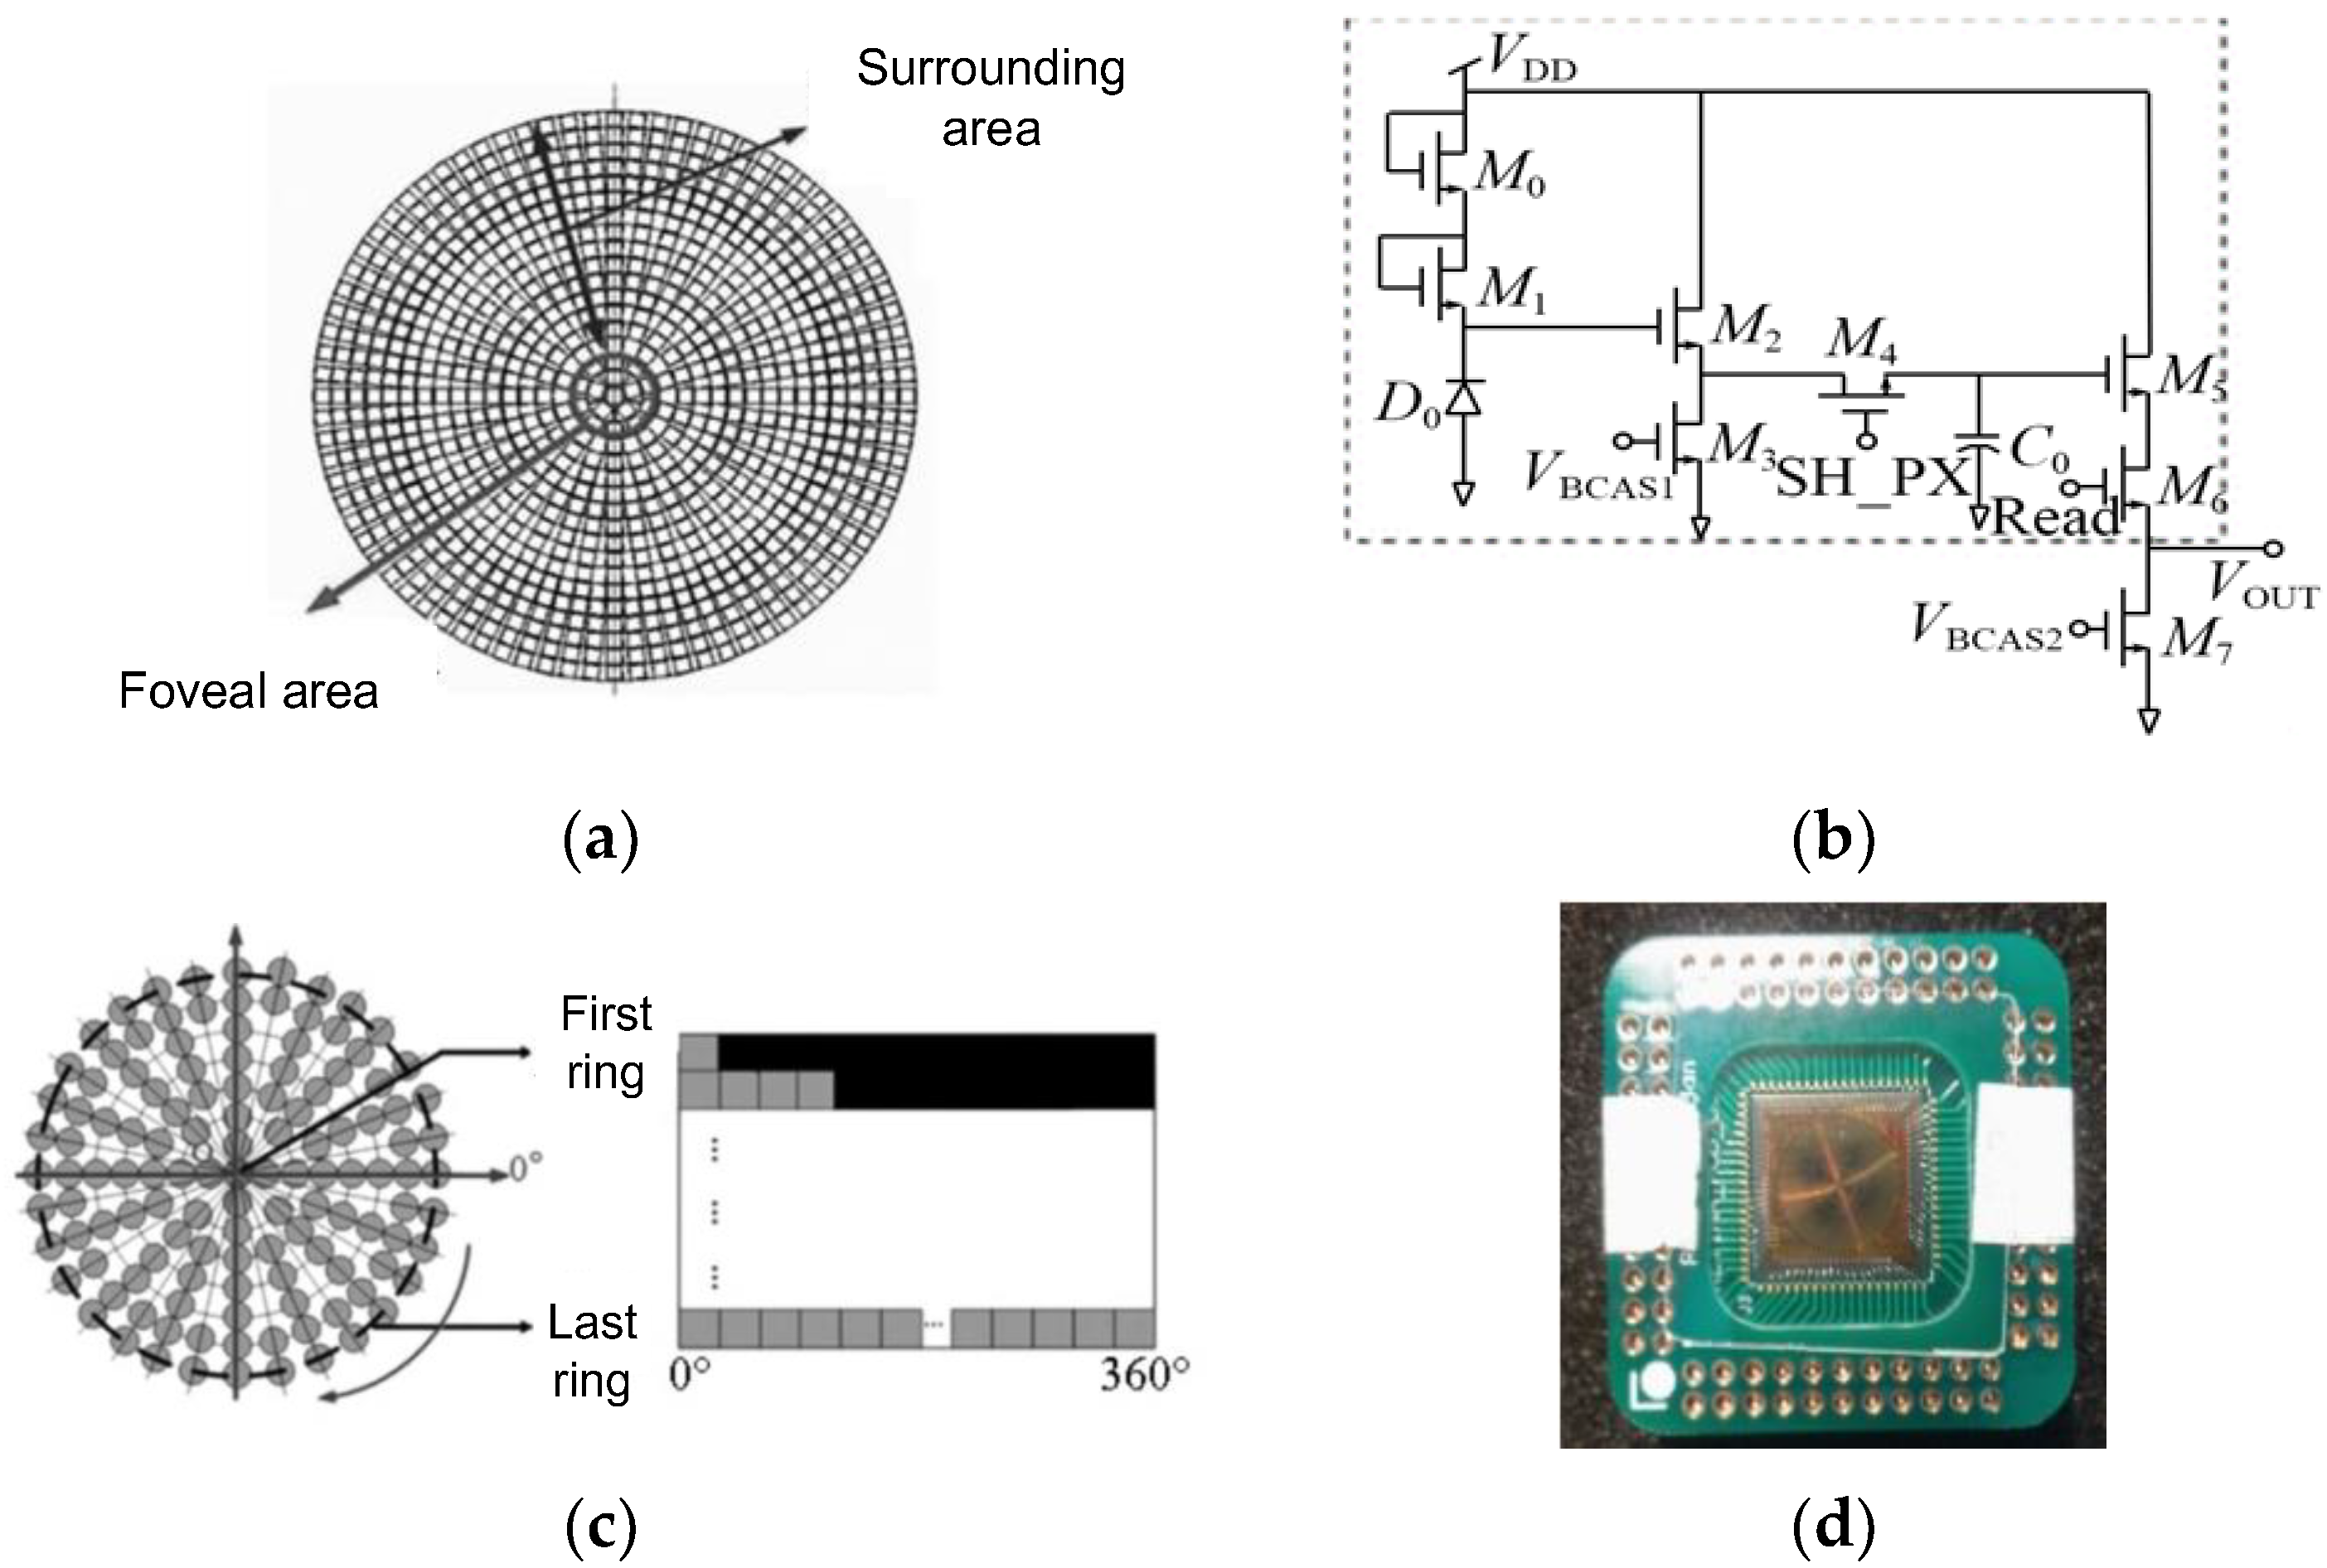
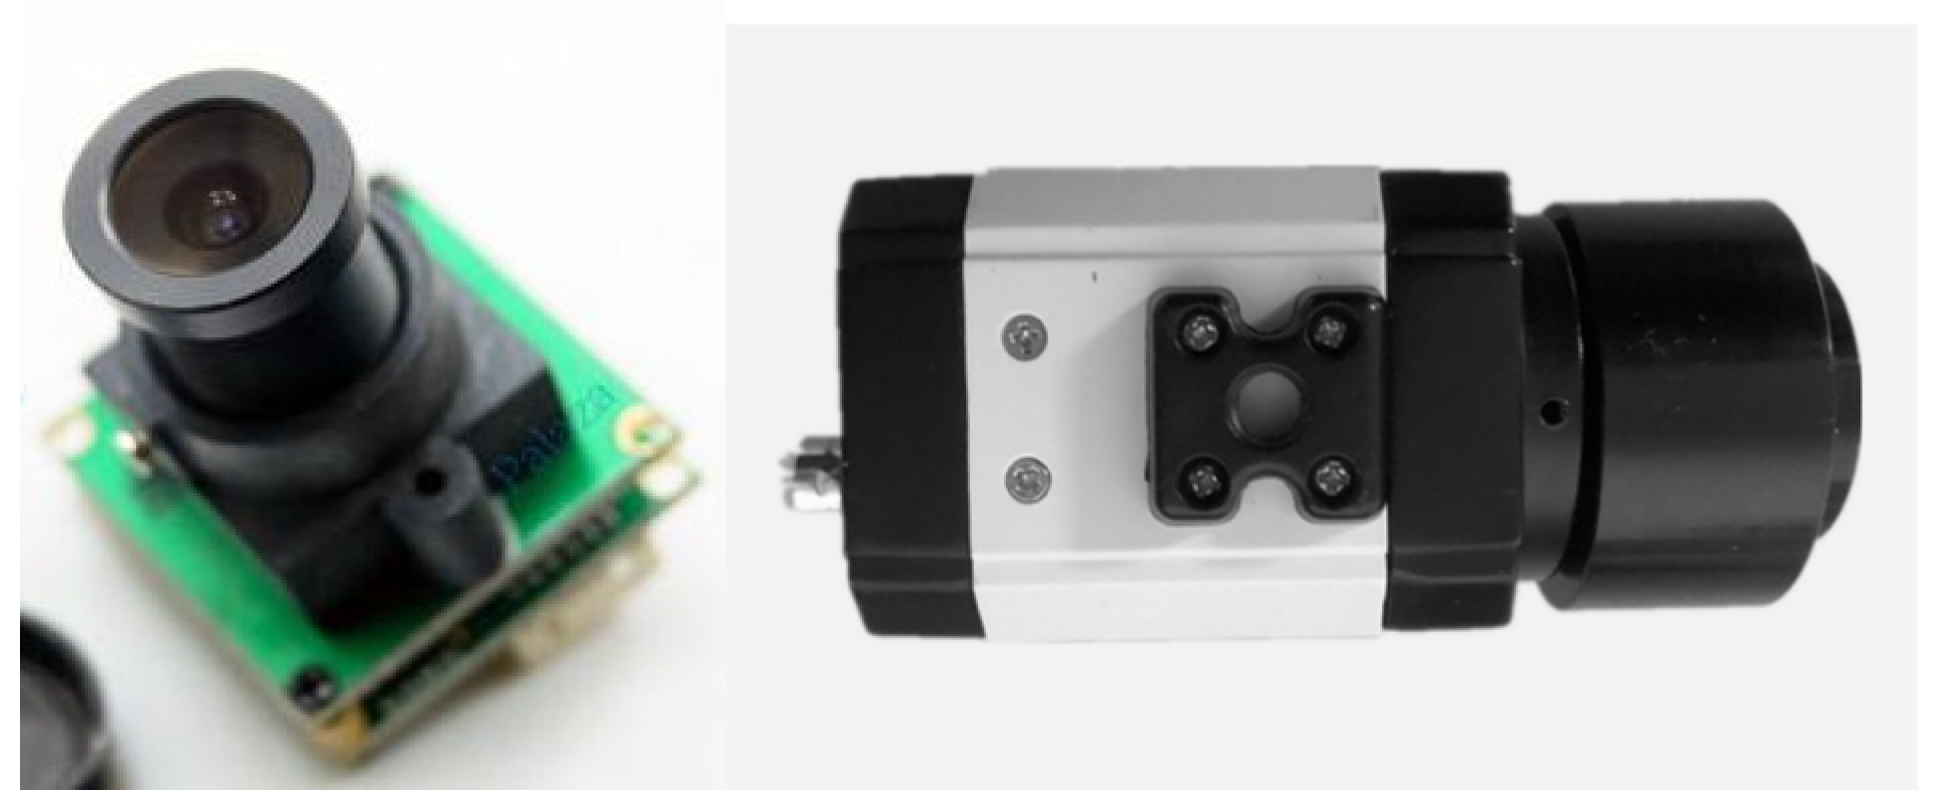
2.2.2. The Retina-like Detector Design
2.2.3. Biomimetic Processing of Laser Spot Images
- Primary Data Acquisition. To appraise the degree of visual disturbance induced by lasers impartially, the following primary data must be gathered: technical specifications of the laser source, individual ocular parameters of the subject, contextual elements, and the unaltered image of the retinal imaging light spot produced by the biomimetic eye. The central wavelength and energy output of the laser are detected by the laser sensor and entered into the testing software. Parameters such as operational distance and individual ocular variances can either be inputted manually by the examiner or selected from default settings, ambient lighting conditions are monitored by the ambient light sensor and fed into the testing software, and the pristine image of the light spot is captured by the biomimetic optical apparatus and transferred to an image processor.
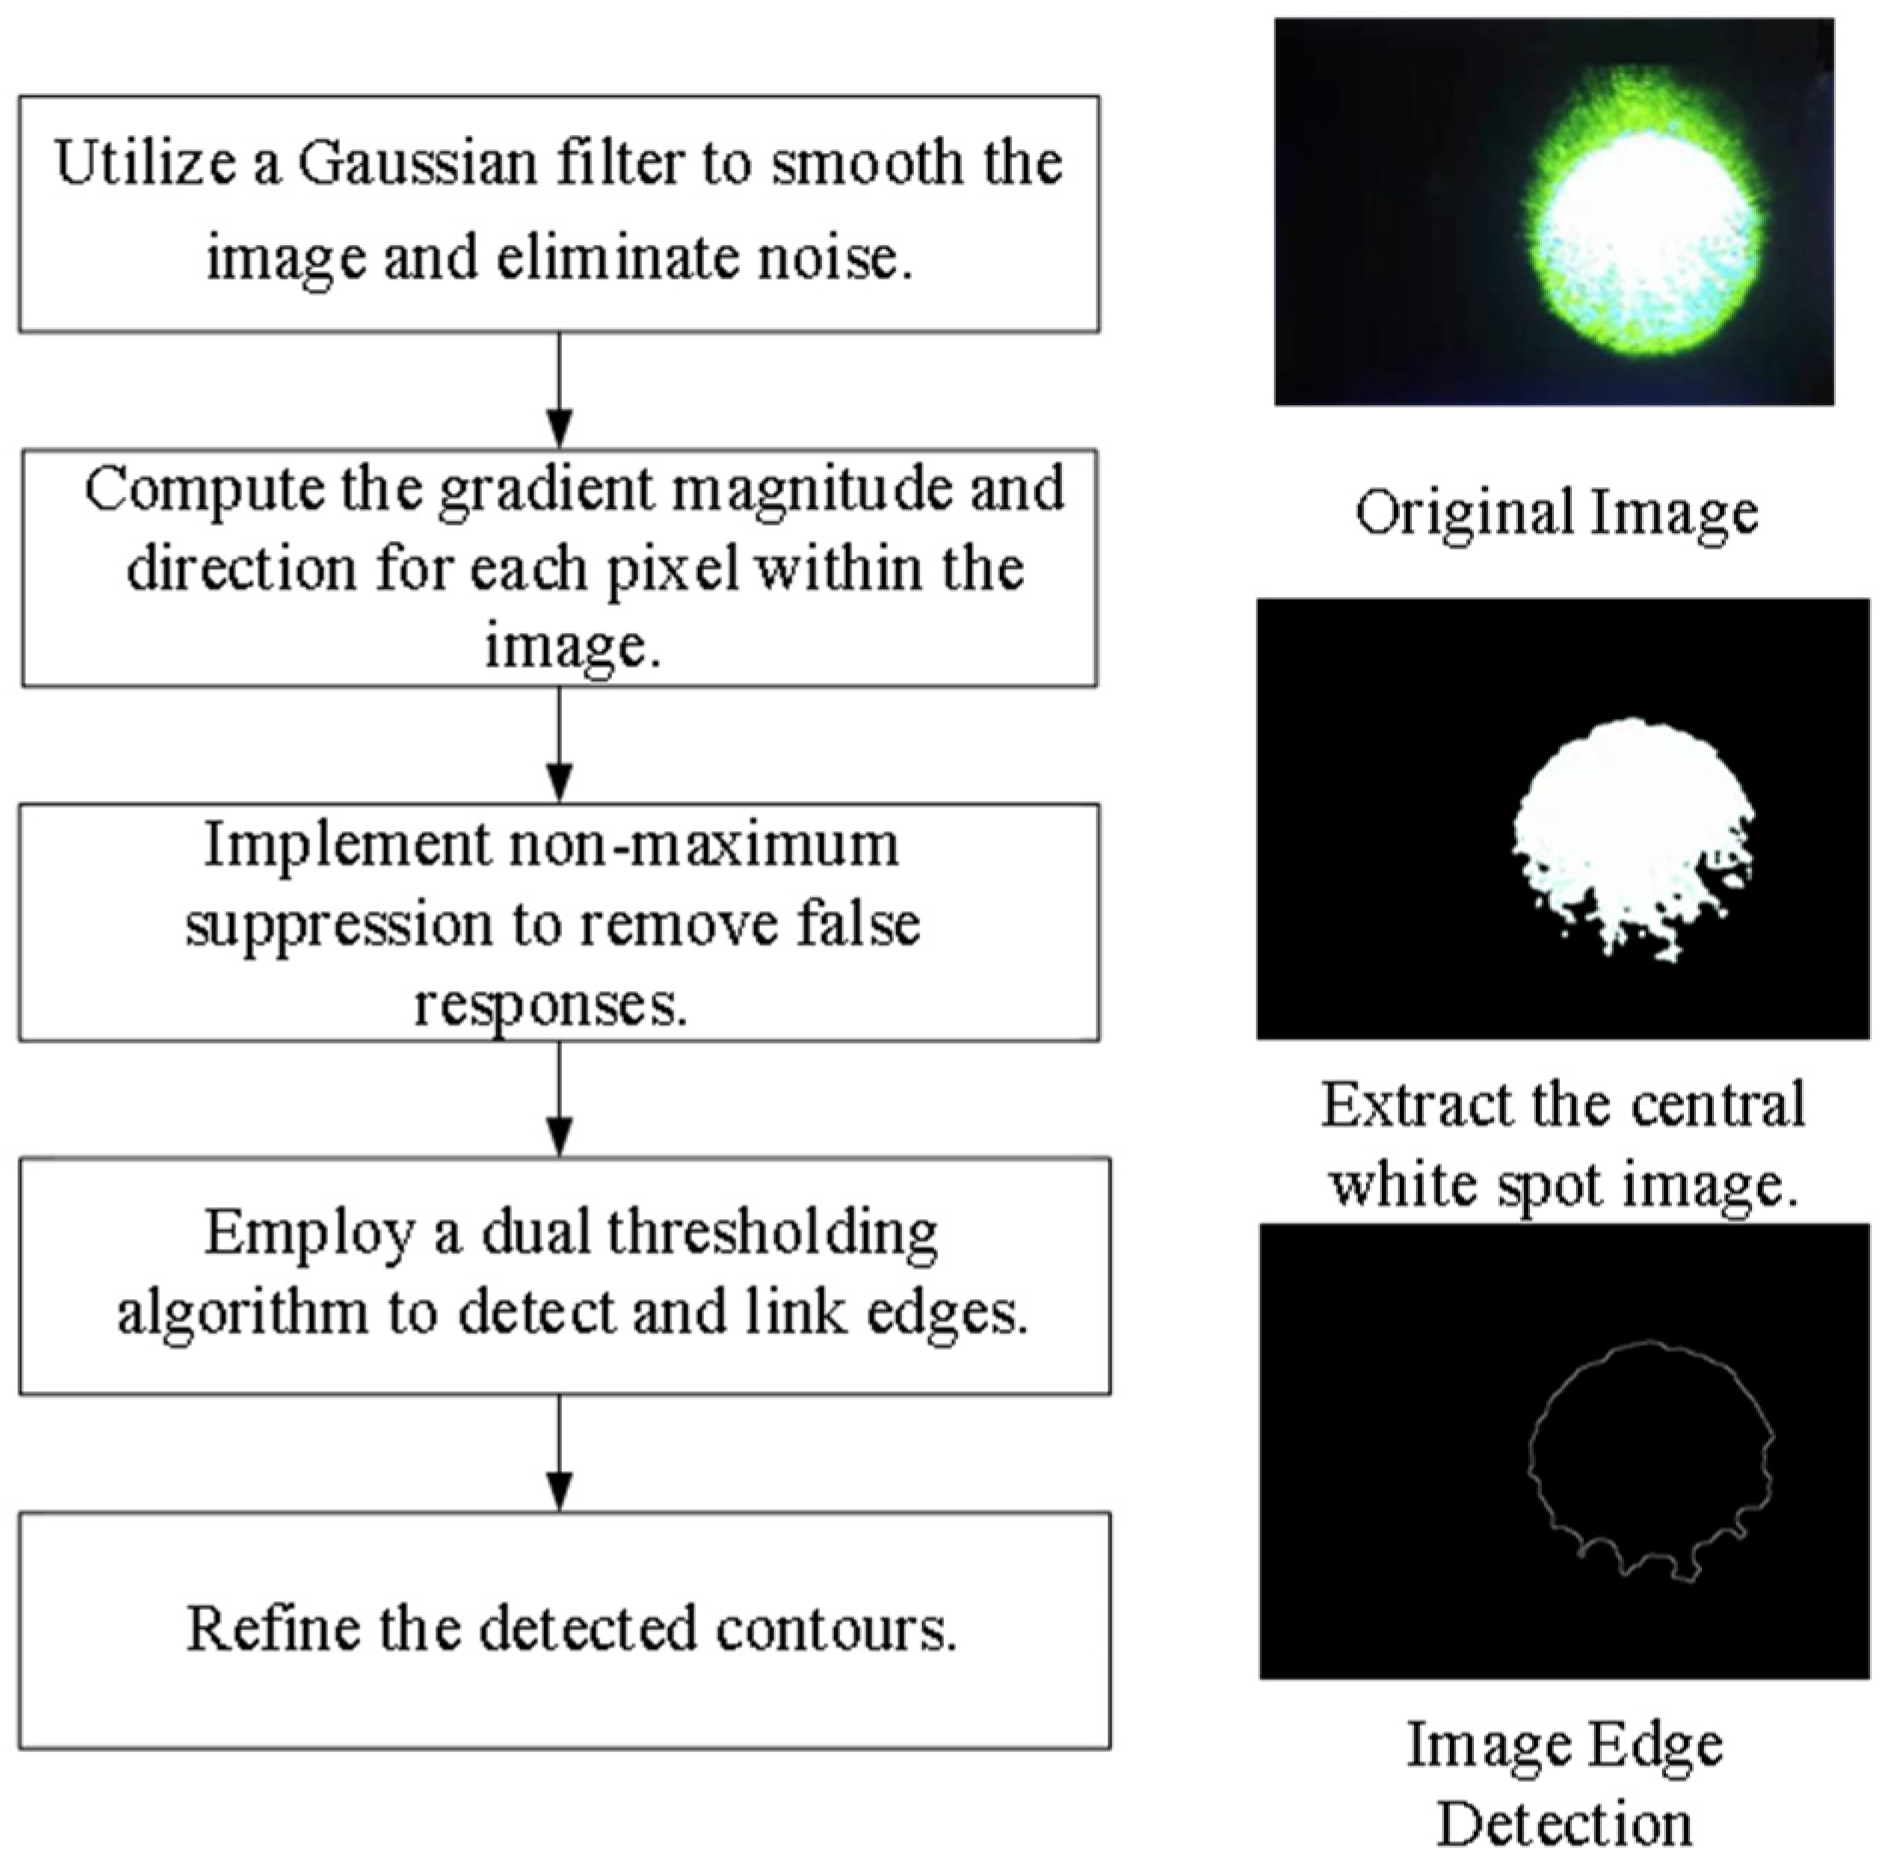
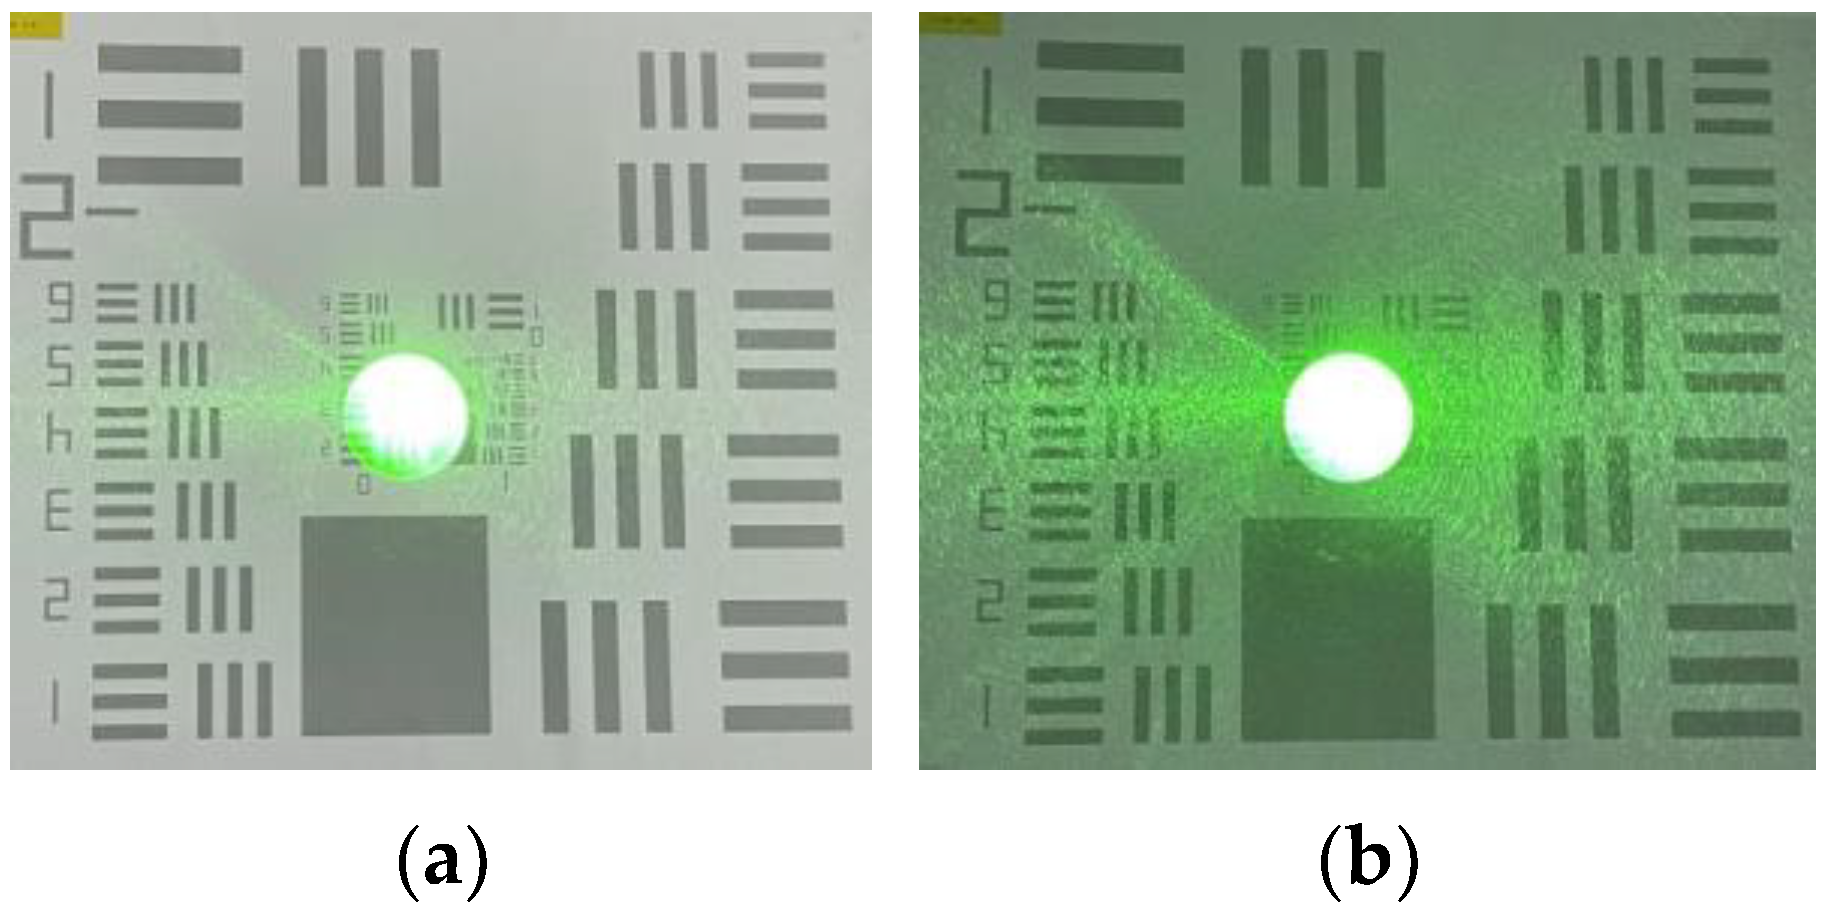
- Target Extraction from the Original Image. As the retina-like detector gathers real-time images of the original laser light spot, these images undergo binarization, allowing for the separation of the intended light spot from its environmental backdrop based on contrasting grayscale values. The isolation of the targeted light spot is executed with the Canny arithmetic [23], enabling continuous edge detection. The extraction procedure and corresponding light spot manifestation are illustrated in Figure 5. Concurrently, the calculation of the denoised laser light spot’s radius and centroid is finalized, guiding the ensuing biomimetic emulation of the laser light spot.
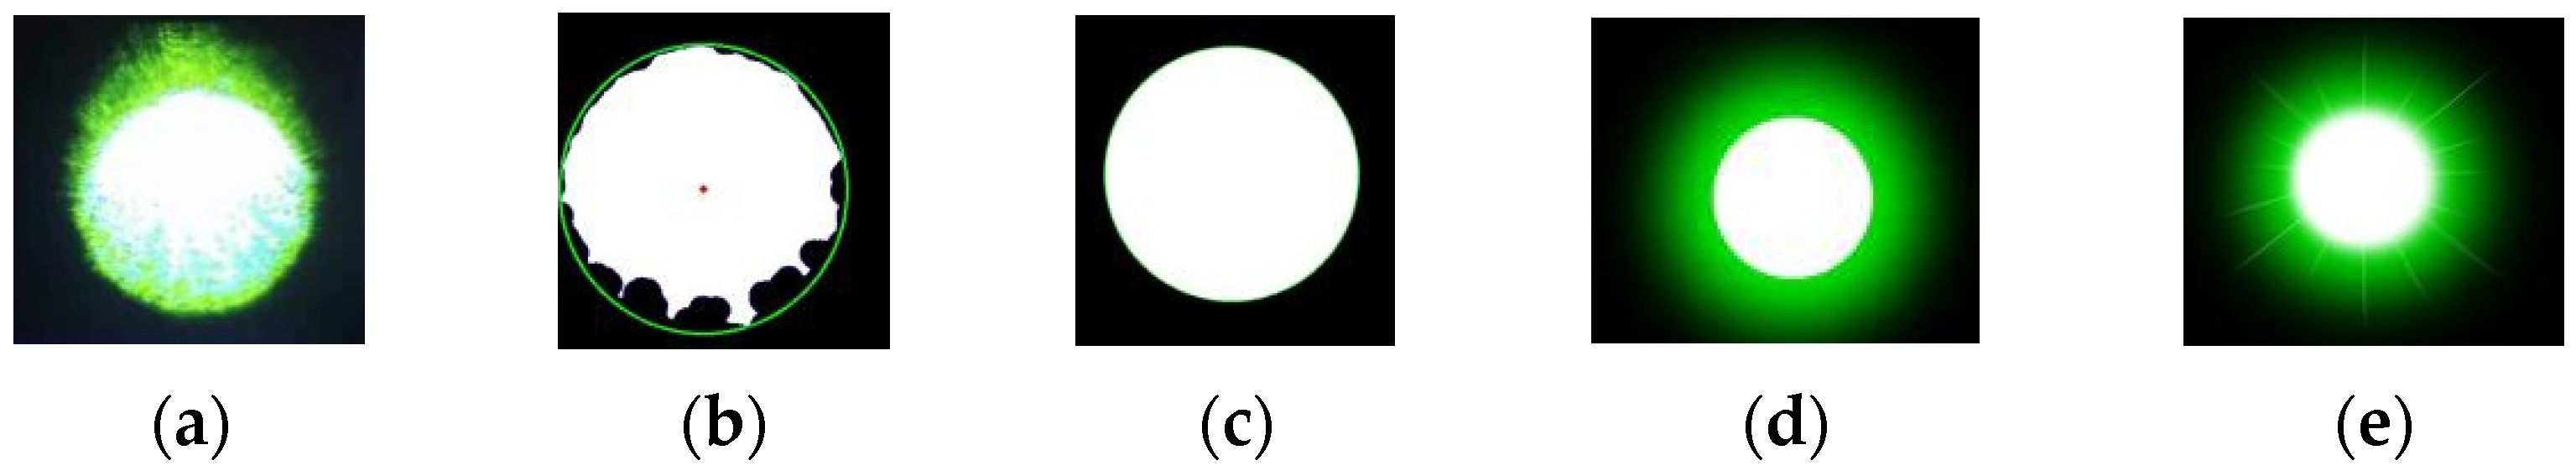
- Light Spot Bionic Fitting. We optimized the original image using the simplified human visual “Laser Glare Model” developed by Dr. Craig A. Williamson [24]. This model is based on the internationally recognized CIE disability glare standard equation [25], which intuitively illustrates the impact of laser glare on human vision, as shown in Formula (1).
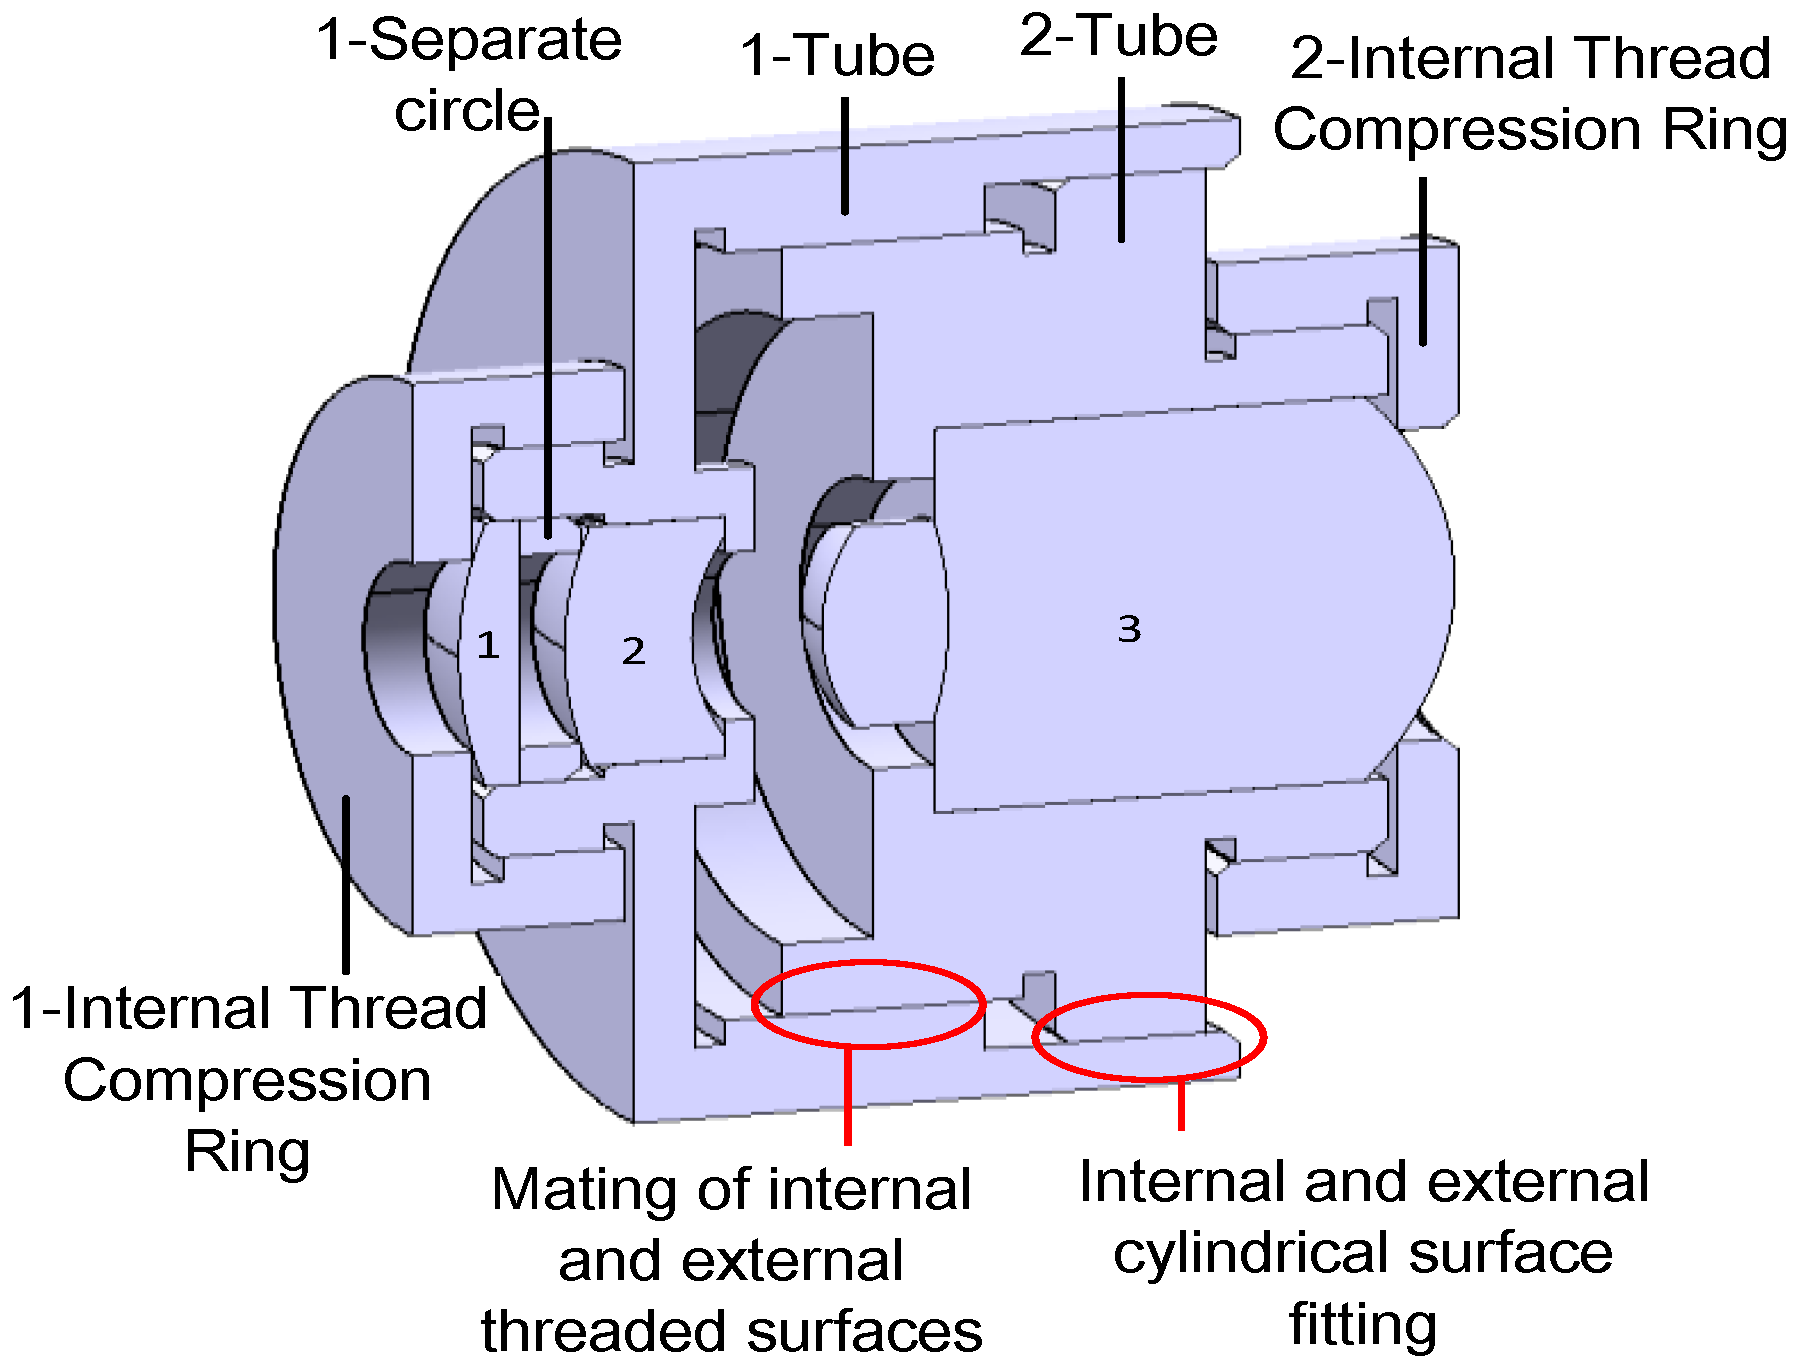
2.2.4. Simulation Eyeball Support Design
2.3. System Function Verification
3. Laser Interference Visual Level Test Evaluation Model
3.1. Laser Interference Vision Parameter System
3.2. A Comprehensive Evaluation Model Based on the G-AHP
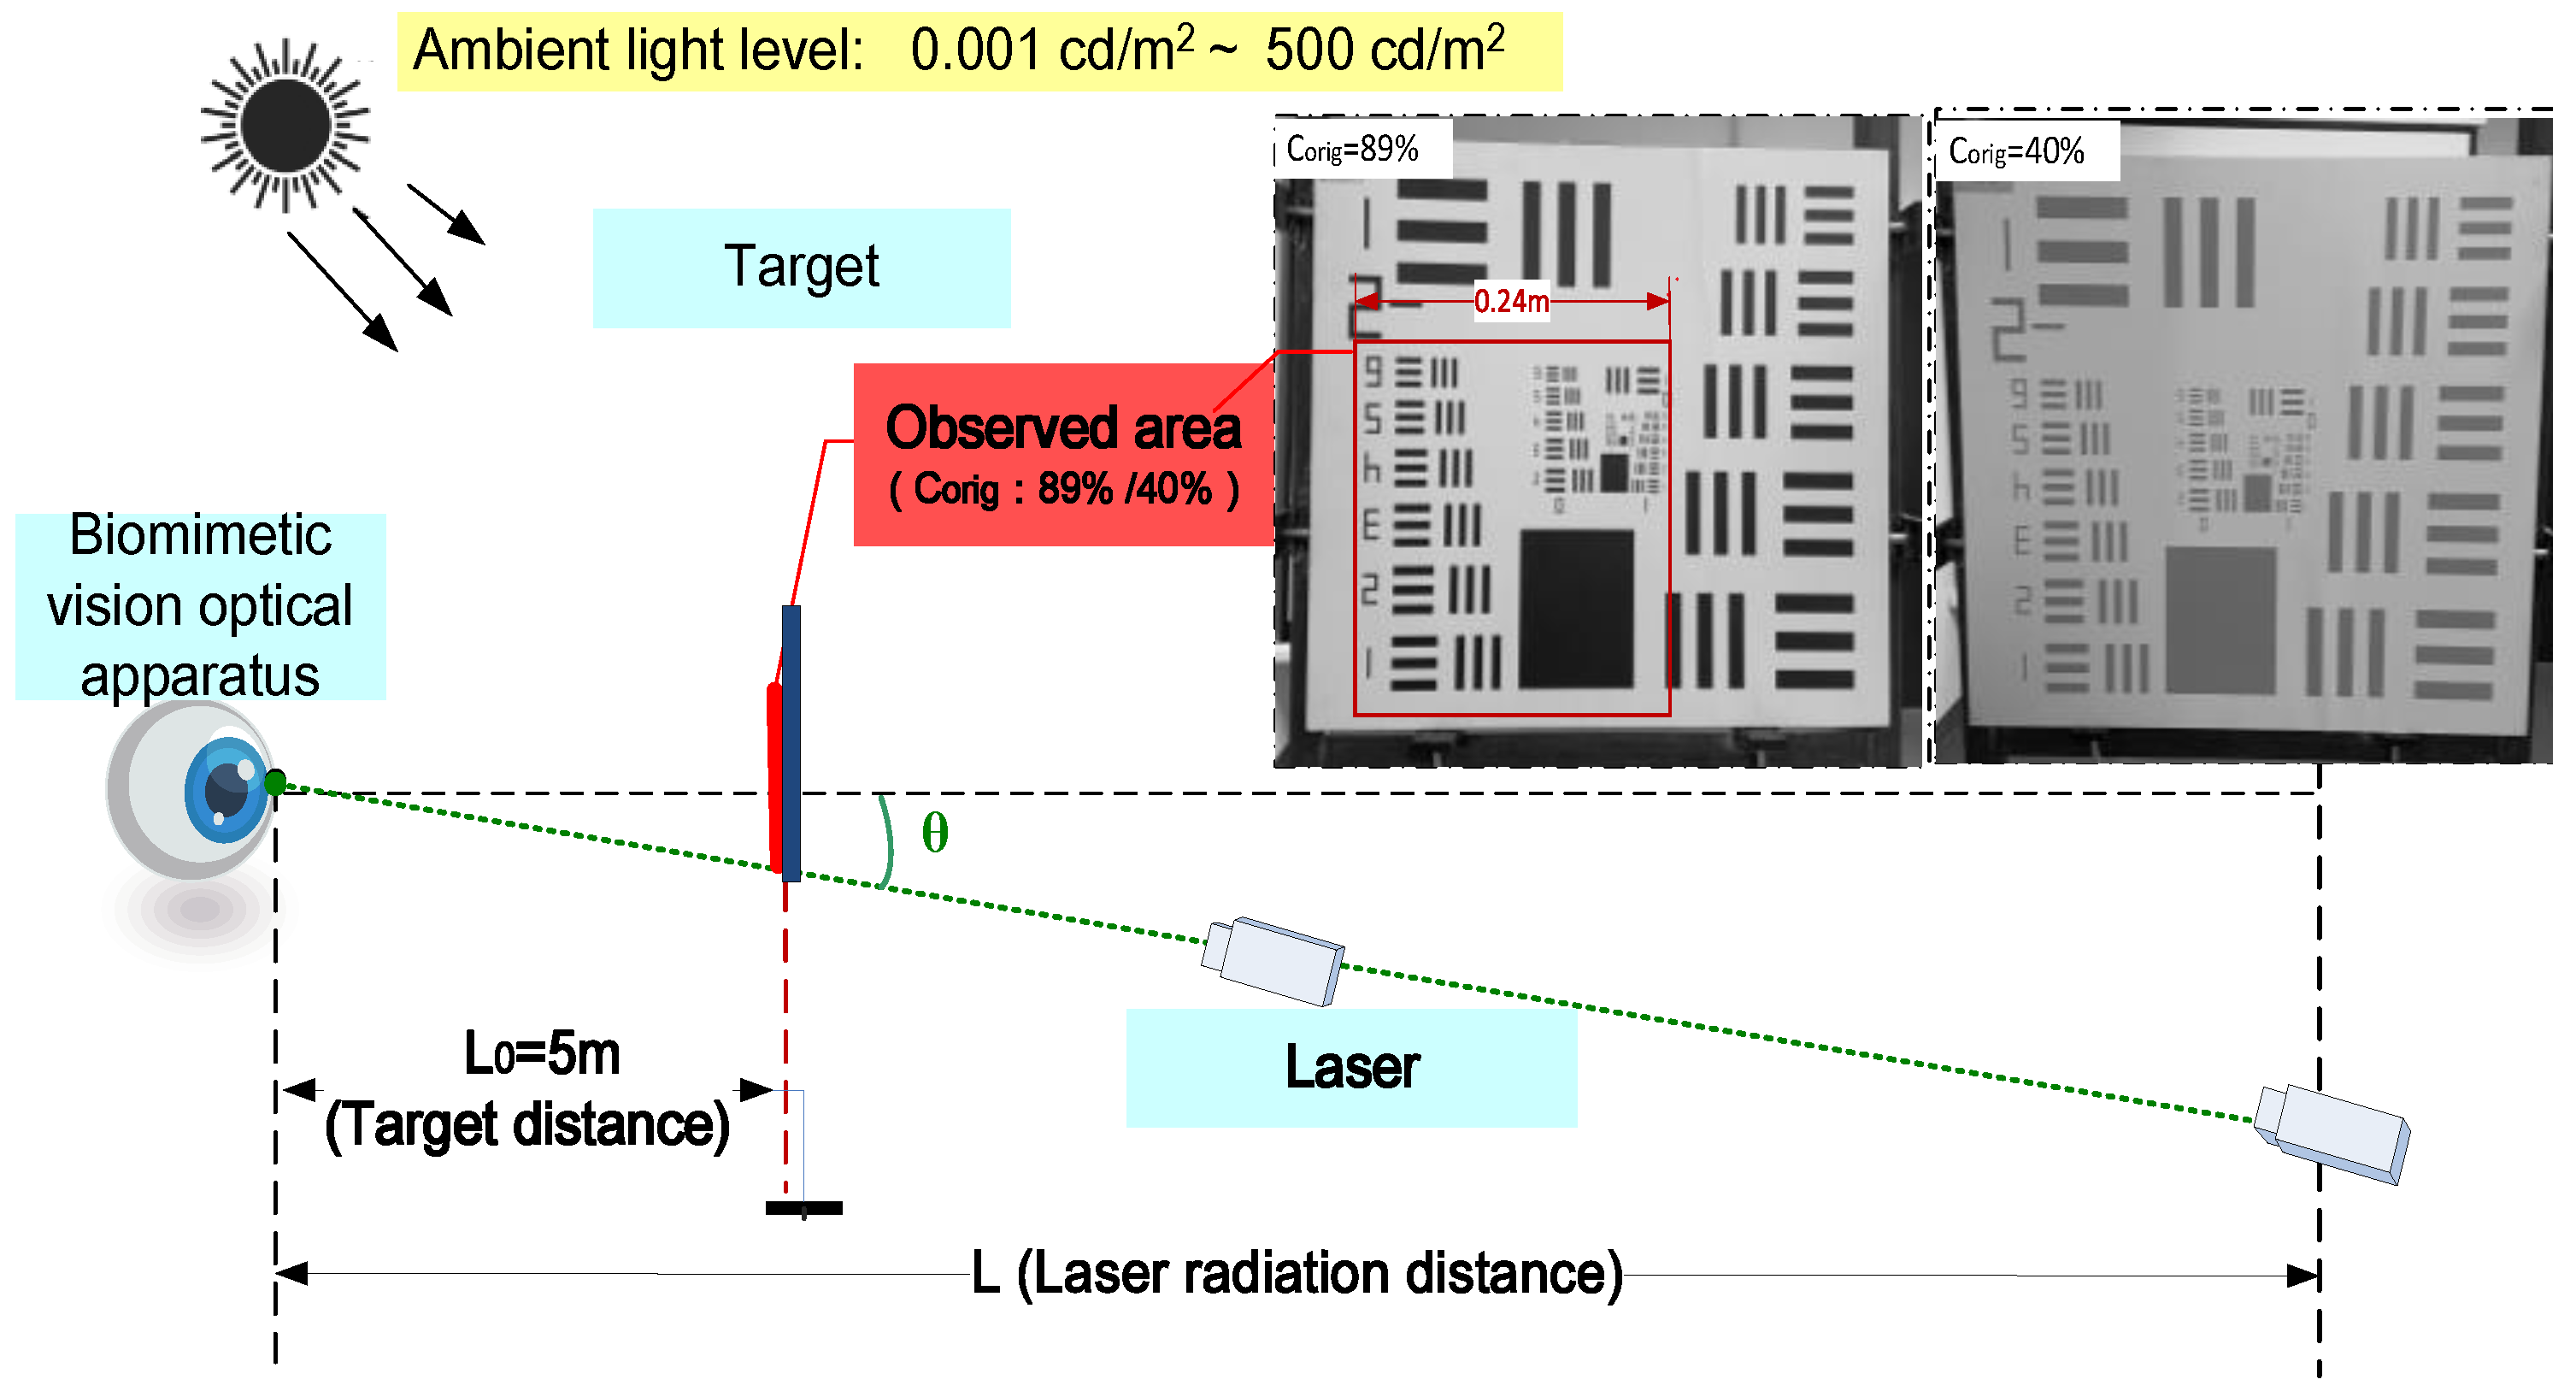
4. Laser Visual Interference Test
5. Results
6. Discussion
- The current imaging system employs a liquid lens that more accurately replicates the scattering effect inherent to the human eye, potentially reducing the intricacy of biomimetic image processing. This enhancement could plausibly improve the system’s congruence with human visual output by an additional 3% to 5%.
- Consideration must be given to defining the threshold range and selecting detectors with appropriate receiving wavelength ranges. It is also essential to investigate whether varying laser energies, spectra, or broad-spectrum sources induce deviations in imaging results due to photodetector interactions.
- The individual variations in human eyes, including refractive errors, cataracts, and other ocular pathologies that contribute to differences in straylight levels, should be further investigated. These variations may affect the extent of laser-induced visual perturbations. Straylight values for study participants can be obtained during volunteer testing sessions.
- The present study did not implement specific filtering measures for phase noise during laser spot image processing. To enhance the image quality more effectively, future research should conduct a comprehensive analysis of the noise model and devise tailored noise-filtering strategies.
- Tailoring designs to cater to specific application scenarios would broaden the system’s applicability across diverse fields, including scientific research, medical applications, military usage, and other investigative domains.
Author Contributions
Funding
Institutional Review Board Statement
Data Availability Statement
Conflicts of Interest
References
- Löfgren, S.; Thaung, J.; Lopes, C. 30 Laser pointers and eye injuries: An analysis of reported cases. In Strål Säkerhets Myndigheten; SSM—The Swedish Radiation Safety Authority: Stockholm, Sweden, 2013. [Google Scholar]
- Thaung, J.; Lopes, C.; Löfgren, S. 54 Retinal injuries from handheld lasers: An updated report. In Strål Säkerhets Myndigheten; SSM—The Swedish Radiation Safety Authority: Stockholm, Sweden, 2015. [Google Scholar]
- Birtel, J.; Harmening, W.M.; Krohne, T.U.; Holz, F.G.; Charbel Issa, P.; Herrmann, P. Retinal injury following laser pointer exposure-a systematic review and case series. Dtsch. Arztebl. Int. 2017, 114, 831–837. [Google Scholar] [CrossRef] [PubMed]
- Linton, E.; Walkden, A.; Steeples, L.R.; Bhargava, A.; Williams, C.; Bailey, C.; Quhill, F.M.; Kelly, S.P. Retinal burns from laser pointers: A risk in children with behavioural problems. Eye 2019, 33, 492–504. [Google Scholar] [CrossRef] [PubMed]
- Qutob, S.S.; O’Brien, M.; Feder, K.; McNamee, J.; Guay, M.; Than, J. Prevalence of laser beam exposure and associated injuries. Health Rep. 2019, 30, 3–9. [Google Scholar] [PubMed]
- Watch, H.R. Blinding Laser Weapons: The Need to Ban A Cruel and Inhumane Weapon; Human Rights Watch Arms Project: New York, NY, USA, 1995; Volume 7. [Google Scholar]
- Shi, L.; He, L.; Zhou, K.D.; Hang, X.Y.; Zhang, J.B. Experimental study on wounding effect of CW green laser nonlethal weapon. J. Ordnance Equip. Eng. 2019, 7, 46–50. [Google Scholar]
- Vandewal, M.; Eeckhout, M.; Budin, D.; Merella, L.; Santos, C.N. Estimation of laser dazzle effects on shooting performance. Hum. Factors Mech. Eng. Def. Saf. 2019, 3, 12. [Google Scholar] [CrossRef]
- Ma, Q.; Fan, Y.; Liang, J.; Ni, B.; Luo, Z.; Kang, H. Research on dazzling effects of human eyes induced by the visible band irradiation of supercontinuum Laser. Acta Laser Biol. Sin. 2020, 29, 75–79. [Google Scholar] [CrossRef]
- Ma, Q.; Fan, Y.; Kang, H. Quantitative evaluation of the supercontinuum laser eye dazzling effect: In Vivo experimental research. Laser Phys. Lett. 2022, 19, 105601. [Google Scholar] [CrossRef]
- Chen, B.; Oliver, J.; Dutta, S.; Rylander, H.; Thomsen, S.; Welch, A. Damage threshold of in vivo rabbit cornea by 2um laser irradiation—art. no. 64350B. In Proceedings of the SPIE—The International Society for Optical Engineering; SPIE: Bellingham, WA, USA, 2007. [Google Scholar] [CrossRef]
- Huang, M.; Wu, N.; Liu, X.; Tang, J.; Jin, L.; He, J. Observation of the injury and restoration of rabbit retina to semiconductor laser irradiation. Laser J. 2002, 233, 85–86. [Google Scholar] [CrossRef]
- Williamson, C.A. Simple computer visualization of laser eye dazzle. J. Laser Appl. 2016, 28, 012003. [Google Scholar] [CrossRef]
- McLin, L.N.; Smith, P.A.; Barnes, L.E.; Dykes, J.R.; Kuyk, T.; Novar, B.J.; Garcia, P.V.; Williamson, C.A. Scaling laser disability glare functions with “k” factors to predict dazzle. In Proceedings of the International Laser Safety Conference, Orlando, FL, USA, 21 March 2013. [Google Scholar] [CrossRef]
- Coelho, J.M.; Freitas, J.D.; Williamson, C.A. Optical eye simulator for laser dazzle events. Appl. Opt. 2016, 55, 2240–2251. [Google Scholar] [CrossRef]
- IEC 60825-1:2014; Safety of Laser Products-Part 1: Equipment Classification and Requirements. International Electrical Commission: London, UK, 2014.
- Schmidtmann, G. Visual Optics. In Clinical Vision Science: A Concise Guide to Numbers, Laws, and Formulas; Schmidtmann, G., Ed.; Springer International Publishing: Cham, Switzerland, 2020; pp. 37–52. [Google Scholar]
- Cao, J.; Hao, Q.; Zhang, F.H. Research progress in human-like retinal imaging technology. Infrared Laser Eng. 2020, 49, 1–8. [Google Scholar]
- Cao, J.; Hao, Q.; Zhang, F.; Cui, H.; Tang, M.; Cheng, Y.; Li, K.; Gao, Z.; Fang, Y. Research progress of bio-inspired retina-like imaging. Infrared Laser Eng. 2022, 498, 20201026-1–20201026-8. [Google Scholar] [CrossRef]
- Ning, Y.; Liu, H.; Zhao, Q.; Guo, H. High-frame frequency imaging system of large area CMOS image sensor. Opt. Precis. Eng. 2019, 2705, 1167–1177. [Google Scholar] [CrossRef]
- Vos, J.J. On the cause of disability glare and its dependence on glare angle, age and ocular pigmentation. Clin. Exp. Optom. 2003, 866, 363–370. [Google Scholar] [CrossRef] [PubMed]
- Cai, X.; Qiao, L.; Guan, Z.; Wang, X.; Wang, N. Mechanisms and measurement of glare in human eyes. Int. Rev. Ophthalmol. 2013, 5, 6. [Google Scholar] [CrossRef]
- Li, L.Y. Research on Realization of Digital Image Mosaic Based on Edge Detection. South. Agric. Mach. 2021, 52, 172–173+187. [Google Scholar]
- Williamson, C.A.; McLin, L.N.; Rickman, J.M.; Manka, M.A.; Garcia, P.V.; Kinerk, W.T.; Smith, P.A. Wavelength and ambient luminance dependence of laser eye dazzle. Appl. Opt. 2017, 56, 8135–8147. [Google Scholar] [CrossRef]
- Vos, J.; Cole, B.; Bodmann, H.; Elisa, C.; Takeuchi, T.; Berg, T. CIE equations for disability glare. CIE Collect. 2002, 135, 1–9. [Google Scholar]
- Nayakappa, P.A.; Gaurish, W.; Mahesh, G. Grey Relation Analysis Methodology and its Application. Math. Eng. 2019, 4, 409–411. [Google Scholar] [CrossRef]
- Xie, N.; Liu, S. Grey Analytic Hierarchy Process and Its Position-Solving. J. South. Yangtze Univ. Nat. Sci. Ed. 2004, 31, 87–89. [Google Scholar]
- Williamson, C.A.; McLin, L.N. Nominal Ocular Dazzle Distance (NODD). Appl. Opt. 2015, 54, 1564–1572. [Google Scholar] [CrossRef]


| Angle of View (°) | Speckle Size (μm) | Deviation (%) | |
|---|---|---|---|
| Laser Interference Visual Eye Model | Gullstrand Exact Eye Model | ||
| −5 | 9.823 | 10.006 | 1.8% |
| −3 | 7.11 | 7.604 | 6.5% |
| −1 | 5.882 | 6.119 | 3.9% |
| 0 | 5.736 | 5.91 | 2.9% |
| Name | Value |
|---|---|
| Number of central rings | 50 |
| Number of central pixels | 6306 |
| Number of edge pixels | 45,760 |
| Total number of rings | 138 |
| Total number of pixels | 52,066 |
| Minimum pixel size | 14 μm |
| R value | 7.07 |
| Q value | 731 |
| Radius of photosensitive area | 5113 μm |
| Lighting Conditions | System | Volunteers | Age | Visual Effects Match Situation |
|---|---|---|---|---|
| Bright (235 cd/m2) | 1 | NO.1 | 25 | Matched |
| 2 | NO.2 | 33 | Matched | |
| 3 | NO.3 | 35 (nearsighted) | When not wearing glasses, the match was good; when wearing glasses, the visual stimulus was slightly stronger. | |
| 4 | NO.4 | 42 | Matched | |
| 5 | NO.5 | 48 | Matched | |
| Dim (0.025 cd/m2) | 1 | NO.1 | 25 | Matched |
| 2 | NO.2 | 33 | Matched | |
| 3 | NO.3 | 35 (nearsighted) | Matched | |
| 4 | NO.4 | 42 | Matched | |
| 5 | NO.5 | 48 | Matched | |
| Visual Matching Degree | 90% | |||
| First Tier (Target Level) | Laser Interference on Vision | ||||
|---|---|---|---|---|---|
| Second Tier (Criterion Level) | Incident Laser Radiation Characteristics (U-A) | Extent of Retinal Physiological Damage (U-B) | Retinal Imaging Characteristics (U-C) | Degree of Laser Glare Perception (U-D) | |
| Third Tier (Alternative Level) | Indicator layer | A1–A5 | B1–B2 | C1–C3 | D1–D5 |
| Factor layer | A11–A13 A21–A23 A31–A32 A41–A42 A51–A53 | B11–B13 B21–B22 | C11–C13 C21–C22 C31–C32 | D11–D12 D21–D22 D31–D32 D41–D42 D51 | |
| Judgment Intervals | Contribution Rate | Level | Judgment Criteria | |||||
|---|---|---|---|---|---|---|---|---|
| Low | Moderate | High | Extremely High | Visual | Effect | Standard IEC 60825-1 | ||
| E(U-A) | 0–2 | 2–4 | 4–5 | 5–6 | Ⅰ | No discomfort; produces less visual obscuration. | very weak | Class 1 |
| E(U-B) | 0–3 | 3–5 | 5–6 | 6–9 | Ⅱ | Piercing; produces much visual obscuration. Self-healing without treatment. | weak | Class 1M |
| E(U-C) | 0–2 | 2–3 | 3–4 | 4–5 | Ⅲ | Piercing and dizziness; produces much visual obscuration. Self-healing without treatment. | moderate | Class 2 |
| E(U-D) | 0–2 | 2–3 | 3–4 | 4–5 | Ⅳ | Strong piercing, dizziness, and burning sensation; produces much or complete visual obscuration. Recoverable after treatment. | strong | Class 2M |
| Laser Parameter | Center Wavelength | Average Power | Radiation Divergence | Mode | Declared Distance of Temporary Dazzle | NOHD |
|---|---|---|---|---|---|---|
| Value | 532 nm | 100 mW | (1.5 × 1.5) mrad | CW | (50–300) m | 47.1 m |
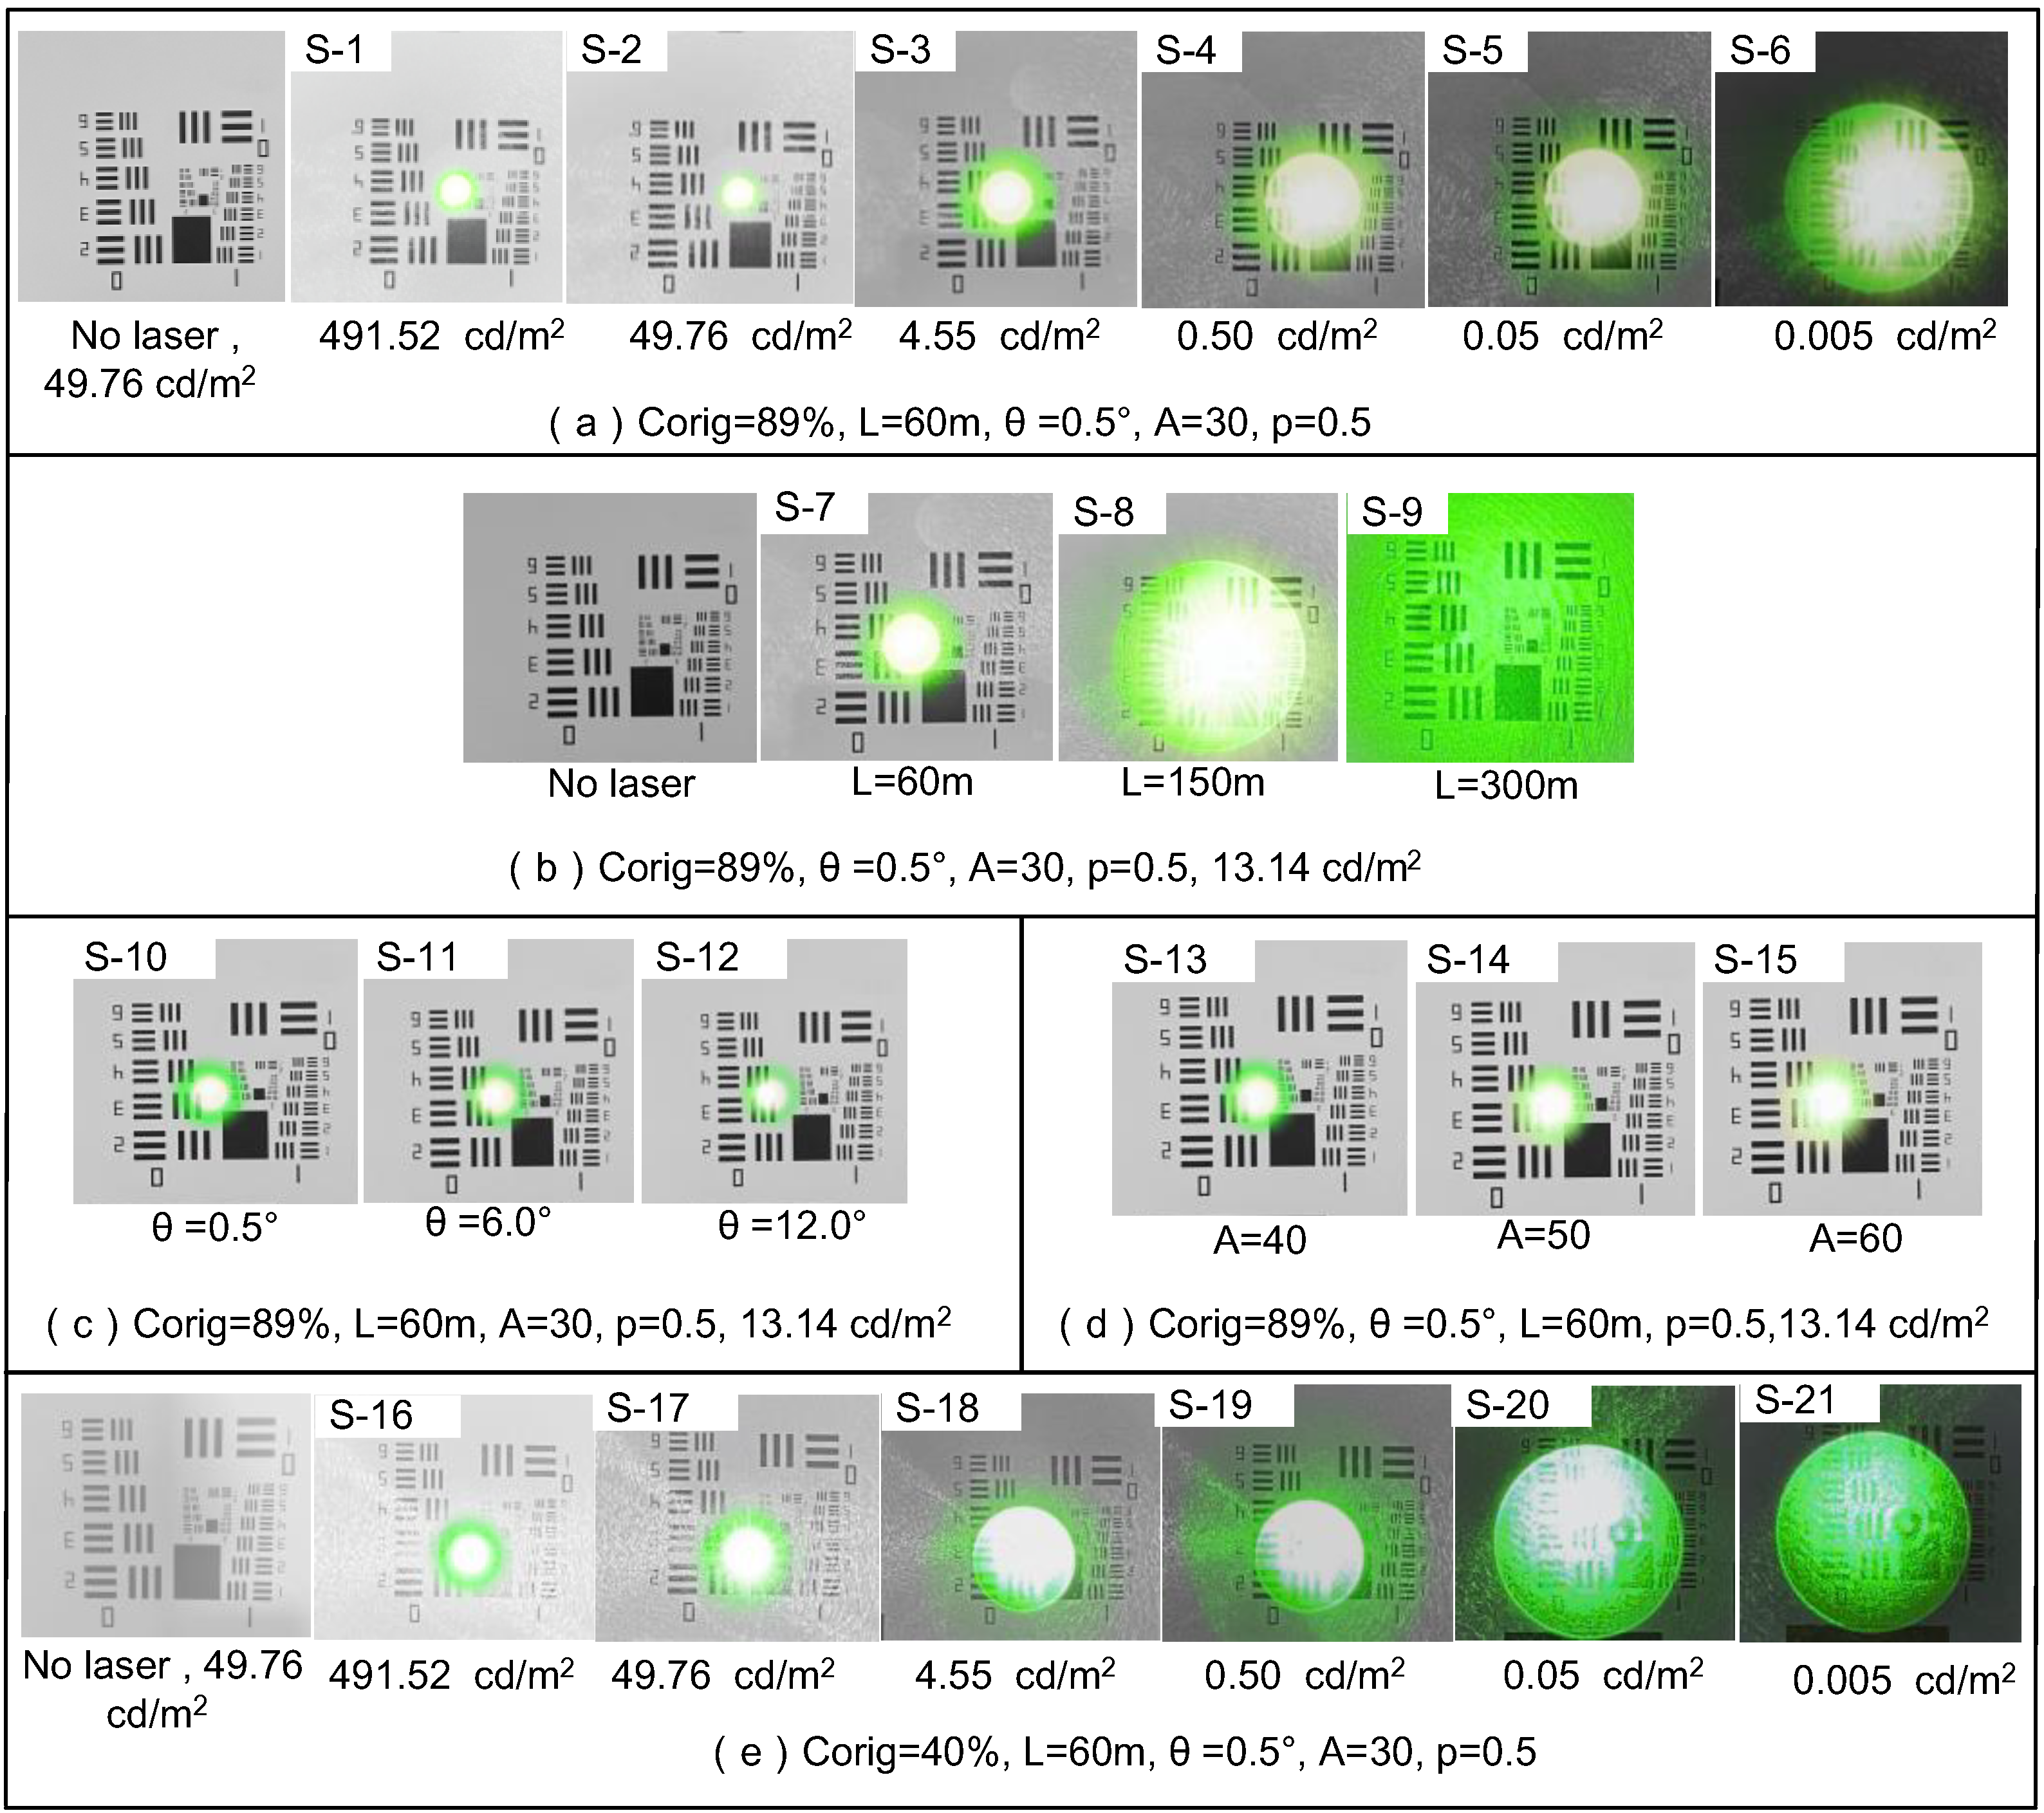
| Corig (%) | Lb (cd/m2) | θ (°) | A (Years) (p = 0.5) | ||||
|---|---|---|---|---|---|---|---|
| Scene Number | Value | Scene Number | Value | Scene Number | Value | Scene Number | Value |
| S-1~S-15 | 89 | S-1,S-16 | 0.005 | S-1~S-10, S-13~S-21 | 0.5° | S-1~S-12, S-16~S-21 | 30 |
| S-2,S-17 | 0.05 | ||||||
| S-3,S-18 | 0.50 | ||||||
| S-16~S-15 | 40 | S-4,S-19 | 4.55 | S-11 | 6.0° | S-13 | 40 |
| S-5,S-20 | 49.76 | S-14 | 50 | ||||
| S-6,S-21 | 491.52 | S-12 | 12.0° | S-15 | 60 | ||
| S-7~S-15 | 13.14 | ||||||
| Parameter | D (μm) | P (mW/cm2) | U (°) | Level |
|---|---|---|---|---|
| S-1 | 70.23 | 1.537 | 1.62 | II |
| S-2 | 54.15 | 1.537 | 1.52 | II |
| S-3 | 45.67 | 1.537 | 1.39 | III |
| S-4 | 23.63 | 1.537 | 0.88 | III |
| S-5 | 11.04 | 1.537 | 0.53 | III |
| S-6 | 9.69 | 1.537 | 0.47 | II |
| S-7 | 18.69 | 1.537 | 0.76 | II |
| S-8 | 54.35 | 0.249 | 2.81 | III |
| S-9 | All covered | 0.063 | 3.54 | Ⅰ |
| S-10 | 18.69 | 1.537 | 0.76 | Ⅰ |
| S-11 | 18.98 | 1.537 | 0.77 | Ⅰ |
| S-12 | 19.23 | 1.537 | 0.79 | II |
| S-13 | 18.82 | 1.537 | 0.77 | II |
| S-14 | 19.54 | 1.537 | 0.8 | III |
| S-15 | 19.97 | 1.537 | 0.85 | III |
| S-16 | 70.23 | 1.537 | 1.94 | II |
| S-17 | 54.15 | 1.537 | 1.79 | II |
| S-18 | 45.67 | 1.537 | 1.42 | III |
| S-19 | 23.63 | 1.537 | 1.33 | III |
| S-20 | 11.04 | 1.537 | 0.69 | III |
| S-21 | 9.69 | 1.537 | 0.51 | II |
Disclaimer/Publisher’s Note: The statements, opinions and data contained in all publications are solely those of the individual author(s) and contributor(s) and not of MDPI and/or the editor(s). MDPI and/or the editor(s) disclaim responsibility for any injury to people or property resulting from any ideas, methods, instructions or products referred to in the content. |
© 2024 by the authors. Licensee MDPI, Basel, Switzerland. This article is an open access article distributed under the terms and conditions of the Creative Commons Attribution (CC BY) license (https://creativecommons.org/licenses/by/4.0/).
Share and Cite
Niu, J.; Xu, X.; Pan, Y.; Duan, Z. An Investigation of a Biomimetic Optical System and an Evaluation Model for the Qualitative Analysis of Laser Interference Visual Levels. Biomimetics 2024, 9, 220. https://doi.org/10.3390/biomimetics9040220
Niu J, Xu X, Pan Y, Duan Z. An Investigation of a Biomimetic Optical System and an Evaluation Model for the Qualitative Analysis of Laser Interference Visual Levels. Biomimetics. 2024; 9(4):220. https://doi.org/10.3390/biomimetics9040220
Chicago/Turabian StyleNiu, Jin, Xiping Xu, Yue Pan, and Zhenhao Duan. 2024. "An Investigation of a Biomimetic Optical System and an Evaluation Model for the Qualitative Analysis of Laser Interference Visual Levels" Biomimetics 9, no. 4: 220. https://doi.org/10.3390/biomimetics9040220
APA StyleNiu, J., Xu, X., Pan, Y., & Duan, Z. (2024). An Investigation of a Biomimetic Optical System and an Evaluation Model for the Qualitative Analysis of Laser Interference Visual Levels. Biomimetics, 9(4), 220. https://doi.org/10.3390/biomimetics9040220