Article

Two Experimental Devices for Record and Playback of Tactile Data

1
Graduate School of Informatics, Nagoya University, Nagoya 464-8601, Japan
2
Faculty of Engineering, Kyushu Institute of Technology, Kitakyushu 804-8555, Japan
*
Author to whom correspondence should be addressed.
Philosophies 2021, 6(3), 54; https://doi.org/10.3390/philosophies6030054
Submission received: 20 May 2021 / Revised: 12 June 2021 / Accepted: 24 June 2021 / Published: 30 June 2021
(This article belongs to the Special Issue Tactileology: Background and Developments)

Abstract

:
A tactile record and playback system will progress tactileology—a new cross-disciplinary field related to tactile sensations—as it will enhance its use in the instruction, archiving, and analysis of human manipulation. In this paper, we describe two key devices for achieving tactileology: a tactile sensor capturing human tactile sense (fingernail color sensor) and a robotic tactile sensor, both of which can detect not only normal force but also tangential force. This is beneficial because people manipulate objects and tools in various ways, such as grasping, picking, and rubbing. The fingernail color sensor registers the three-dimensional (3D) force applied to a fingertip by detecting the fingernail color change caused by blood distribution under the fingernail, which can be observed with green illumination and a miniature camera. Since detecting this color change is more complicated than using a robotic sensor, the relationships between the image and 3D force are learned using a convolutional neural network (CNN). In the robotic sensor, the 3D force applied to a robotic finger transforms into a bright area using an illuminated acrylic core, a rubber robotic finger skin, and a miniature camera. We measure normal force and tangential force by the brightness and movement of the bright area, respectively. Using a force gauge or an electronic scale for measurement, we perform a series of evaluation experiments. The experimental results show that the precision of both the fingernail color sensor and the robotic tactile sensor are sufficient for our system.

1. Introduction

To progress the field of tactileology, tactile record and playback systems are promising for the instruction, archiving, and analysis of human manipulation. For example, if we can record and playback the manipulations of notable people, students can learn their manipulation at any time, even after they pass away. Furthermore, analyzing the relationship between input tactile sensory data and output manipulation data may engender new science and engineering insights related to the inclusive design and art/design of tactile sense.
The simple TECHTILE toolkit has two paper cups equipped with a speaker on the bottom; one of the cups acts as a sensor and the other acts as a vibrator [1,2] to achieve a concept similar to the abovementioned system. However, its usage is restricted to the virtual reality created on the cup. We want to expand the use of tactile record and playback based on robotics. Thus, we aim to develop two kinds of tactile sensors mounted on human fingertips and robotic fingertips, respectively. The former tactile sensor records tactile sensation during human manipulation; the latter records the playback manipulation performed by a robot equipped with a tactile sensor. As is evident from various tasks using hands, such as massage, pottery, and surgery, tactile sensors should obtain the tactile sensation of not only normal force but also the tangential force occurring during these tasks. Furthermore, we intend to incorporate the tactile score produced by Y. Suzuki and R. Suzuki [3] into our system in our future work because, in our research, we document an essential mechanism invoking a specific emotional effect by analyzing the tactile score rather than simply treating raw tactile data.
In this article, we describe two kinds of tactile sensors that are key parts of the tactile record and playback system based on robotics. These two tactile sensors can detect not only normal force but also tangential force, which is essential because people manipulate objects and tools in various ways, such as grasping, picking, and rubbing.
The tactile sensor for the human fingertip detects the three-axis force applied to the fingertip by the color change of the fingernail, as shown in Figure 1. Hereafter, we call this tactile sensor the fingernail color sensor. The fingernail color sensor obtains the three-dimensional (3D) force applied to the fingertip from the fingernail color change caused by blood distribution under the fingernail, which can be observed with green illumination and a miniature camera. Since this color change is complicated, the relationships between an image and the 3D force are learned using a convolutional neural network (CNN). There are several tactile sensors detecting human tactile sensations that are similar to the fingernail sensor, such as near-infrared light emitting diodes (LEDs) and photodiodes [4,5], deformation detection using strain gauges [6] and PPG (Photoplethysmogram) in the proximal part of a finger [7], and image data detection [8]. Compared to these methods, our sensor has an advantage in terms of the three-axis force detection precision because CNN captures the subtle changes in fingernail color caused by the three-axis force.
For the robotic tactile sensor, we used a transform mechanism of optical change to detect the 3D force applied to a robotic finger. This transform mechanism is an acrylic board illuminated by planar light and covered with a rubber sheet [9], as shown in Figure 2. When external force is applied to the rubber sheet, the contact portion between the rubber sheet and the acrylic board shines and can be observed with a camera. We changed the acrylic board (acrylic core) on the actual tactile sensor to a human fingertip shape and covered it with a rubber skin to create a humanoid robotic hand [10]. Applied force is observed as a bright area using the illuminated acrylic core, the rubber robotic finger skin, and a miniature camera. We use the brightness and movement of the bright area to measure the normal force and tangential force, respectively [11]. Although there are various tactile sensors using several physical phenomena, such as resistance variation of conductive rubber [12], static electricity [13], piezoelectricity [14], magnetism [15], and the micro-electro-mechanical System (MEMS) [16], an illuminated light-change-type sensor such as our tactile sensor has considerable superior advantages, including robustness against impact force and a soft sensing surface [17].
To evaluate these two tactile sensors, we developed two kinds of measurement devices that can simultaneously apply normal force and tangential force to a human fingertip or robotic finger. To evaluate the fingernail color sensor, we used an electronic scale, a loadcell, and a slider placed on a scale. The linear movement of the slider could change direction from 0° to 360° to measure any directional tangential force. The normal force applied to the fingertip is measured by the scale. To generate forces with human subjects, the allowance of tangential force and normal force were demonstrated on a liquid crystal display (LCD) panel with the present force level measured by the scale and loadcell as a red point. The human subjects were asked to adjust their force to keep the red point positioned within the allowance area.
For evaluation of the robotic tactile sensor, we measured the relationship between the brightness and normal force using a motorized x-table and a digital force gauge mounted on the table. This was because, in our previous study, we showed that tangential force did not influence the relationship between the brightness and normal force; therefore, the robotic tactile sensor was suitable as a normal force sensor after calibration. We then measured the relationship between the movement and tangential force under several normal force conditions. In this experiment, we changed the attitude of the robotic tactile sensor to adjust its longitudinal direction along the digital force sensor axis to measure the tangential force applied to the robotic tactile sensor. Based on the results of the two tactile sensors, we evaluated their potential as a tactile record and playback system.
Although our major issue is to develop two key parts for the tactile record and playback system in this article, we will attempt to assemble them to realize the tactile record and playback system in future work.

2. Fingernail Color Sensor for Human Fingertip

2.1. Outline

The fingernail color sensor is designed to measure and record tactile information from a technician’s fingertips. Although other researchers have produced a tactile sensing glove based on a similar idea [18], their glove prevents the person wearing it from directly touching an object. Some tactile measurements are capable of directly touching an object, such as detecting blood distribution under the fingernails using near-infrared LED and photodiodes [4,5], detecting heart rate from the base of a finger [6], and detecting fingertip deformation using strain gauges [7]. However, not only do these need enhanced detection precision, but they also, with the exception of detecting blood distribution under fingernails, cannot measure 3D force.
To enhance the precision compared to the abovementioned ordinal tactile sensors for the human finger, our fingernail color sensor estimates the applied force from fingernail images detected by a miniature camera attached to the fingertip based on deep learning. We used multi-task CNN [19] for this deep learning [20] to assume normal force and tangential force applied on the fingertip from fingernail images. We can expect enhanced precision with this method compared to the ordinal method because using a camera provides a great deal of image data and the recognition of local color pattern changes is possible with CNN.

2.2. Principle of Fingernail Color Sensor

In the fingernail color sensor, a fingernail image is obtained from a miniature Complementary Metal Oxide Semiconductor (CMOS) camera (PPV405NT2, Asahi Electronics Laboratory, Osaka, Japan) installed in the sensor to estimate the magnitude and direction of force applied to a fingertip with regression from machine learning. Since there is no interference between the finger surface and object surface in this method, live tactile data felt by a person can be quantitatively obtained in real time.
To use this method, we must carefully select the light source for illuminating the fingernail because the determination precision depends on the perceptibility of the change in fingernail color. In this study, we chose a light source by considering the light absorption characteristics of blood. Since a 500 [nm]-peak light length is considerably absorbed by hemoglobin in blood [21], we adopted a green LED as the light source. This green LED produces a darker image of the blood concentration under the fingernail and becomes brighter with a lesser concentration of blood. Since blood distribution varies with the deformation of the finger caused by applied force, we can estimate the force from the image data of the blood distribution.

2.3. Prototype of Fingernail Color Sensor

We developed a prototype of the fingernail color sensor based on the abovementioned principle. We produced a casing of the fingernail color sensor using a 3D printer to mount it on a human fingertip. The prototype was 35 [mm] in height, 26 [mm] in width, and 65 [mm] in length and is shown in Figure 1a. As shown in Figure 1a, aluminum foil was attached to the casing. This prevented any external light source such as a ceiling light or sunlight from affecting the images obtained from the camera. An image of a fingertip is shown in Figure 1b. The black crescent on the fingertip is a urethane sponge cover that fills the gap between the casing and the fingertip.

2.4. Creating the Data Set

For the deep learning, we prepared a data set with a series of experiments performed by volunteers. In the experiments, the volunteers wore the fingernail color sensor on their fingertip and touched a device measuring normal force, tangential force, and direction values to obtain images associating these force values. Nine people participated in the experiments.
The force measurement device is shown in Figure 3a. It is composed of an electronic scale, a slider with wheels, and a loadcell. Since the slider moves along two groves on the scale, it moves along a certain direction, θ . Normal force F z is measured by the scale and tangential force F r is measured by the loadcell. The direction θ is changeable with every 30°. Tangential force components F x and F y are calculated by the following equations:
F x = F r cos θ
F y = F r sin θ .
During measurement tests, volunteers sat facing the measurement equipment and touched the top surface of the slider with their right index finger pad while wearing the fingernail color sensor to apply normal and tangential force to the top surface. The volunteers tried to adjust their force to make the blue point match the red point on the LCD monitor, as shown in Figure 3b, where the blue and red points show the current measured force and reference force, respectively. The green line shows the trajectory within a 5 s interval. Since the update cycle of this graph is 40 [msec], the system acquires a fingernail image, normal force, and tangential force every 40 [msec]. The direction of the tangential force, θ , changed with every 30° increase and each volunteer performed the measurement test 12 times.
In the instructions appearing on the LCD monitor, the F z reference was varied according to sinusoidal motion in the range of 0 to F z m a x with a cycle T and the reference F r was varied with in-phase cycles. F z m a x and T were 5 [N] and 40 [sec], respectively.

2.5. Multi-Task CNN

We show the deep learning model used in this study in Figure 4. With this model, we obtained individually three regressions for F x , F y , and F z by inputting a grayscale image of a fingernail. We used VGG16 [19], previously trained using finetuning. Since it requires RGB image data as the input, we modified the grayscale image to an RGB image by assuming R and B to be zero using gray2BGR [22], shown in Figure 4. Then, we applied a Gaussian filter to the greyscale image to reduce the noise included in the grayscale image and Adaptive Histogram Equalization (AHE) to obtain a high-contrast image.
We used the cost function as follows:
L = λ x L x + λ y L y + λ z L z ,
where L x , L y , and L z are cost functions for F x , F y , and F z , respectively. Although λ x , λ y , and λ z are weighted to adjust the three terms to the same magnitude, we assumed λ x = λ y = λ z 1 in this study. Furthermore, we assumed the cost functions of L x , L y , and L z to be mean square error (MSE).
For hyperparameters, we assumed the epoch number and batch size to be 50 and 128, respectively. We also used Adam [23] for optimization using the following parameters: α = 1.0 × 10 4 , ε = 1.0 × 10 7 , β 1 = 0.9 , and β 2 = 0.999 . For learning rate decay, we adopted decay = 1.0 × 10 6 . The data set was divided into 85% to 15%; the former and latter were used for the learning and evaluation, respectively.

2.6. Results and Discussion

In order to show the CNN training process and results, Figure 5 shows the loss curves for training and validation. Results for F x , F y , and F z show that the losses tend towards zero; there are no significant differences between the losses of training and validation. The abovementioned results show that there is no overfitting.
For each component of force, the relationship between the estimated and true values for the evaluation data and root mean square error (RMSE) are shown in Figure 6 to demonstrate that fingertip force estimation is possible with deep learning. Figure 6 shows that fingertip force can be estimated by deep learning and that the estimation accuracy is better for shear force than for vertical force.
This is because the brightness variation of the fingernail is less than the blood distribution movement. Although it is possible to enhance the precision with the addition of participants, the value of RMSE for F z is almost the same as the previous study [7]. Compared to the normal force precision, the RMSE of the tangential force is around 1/3 of the previous study [4]. Therefore, our fingernail color sensor has comparable precision to a tactile sensor measuring the tactile sense felt when people use their hands.

3. Robotic Three-Axis Tactile Sensor Imitating Human Index Finger

3.1. Outline

This sensor measures and records tactile information from humanoid robotic fingertips. As with the fingernail color sensor described in the preceding chapter, three-axis tactile data acquisition is important. There are several tactile sensor designs based on various physical principles, such as resistance [12], static electricity [13], voltage generated by piezoelectric effect [14], magnetic field [15], and optical variations [10,11,17]. Physical phenomena are transduced through appropriate transducers to electric signals. With the recent production of a Piezoelectric Oxide Semiconductor Field Effect Transistor (POSFET)-based sensing chip [16] using MEMS technology, we expect to achieve artificial skin possessing human tactile sensation in the future. However, at present, actual working tactile sensors are required for several handling tests. Currently, we believe that the tactile sensors based on optical variation shown in the next section are the best solution because they have impact force robustness and external electromagnetic noise proofing.

3.2. Principle of Optical Tactile Sensor

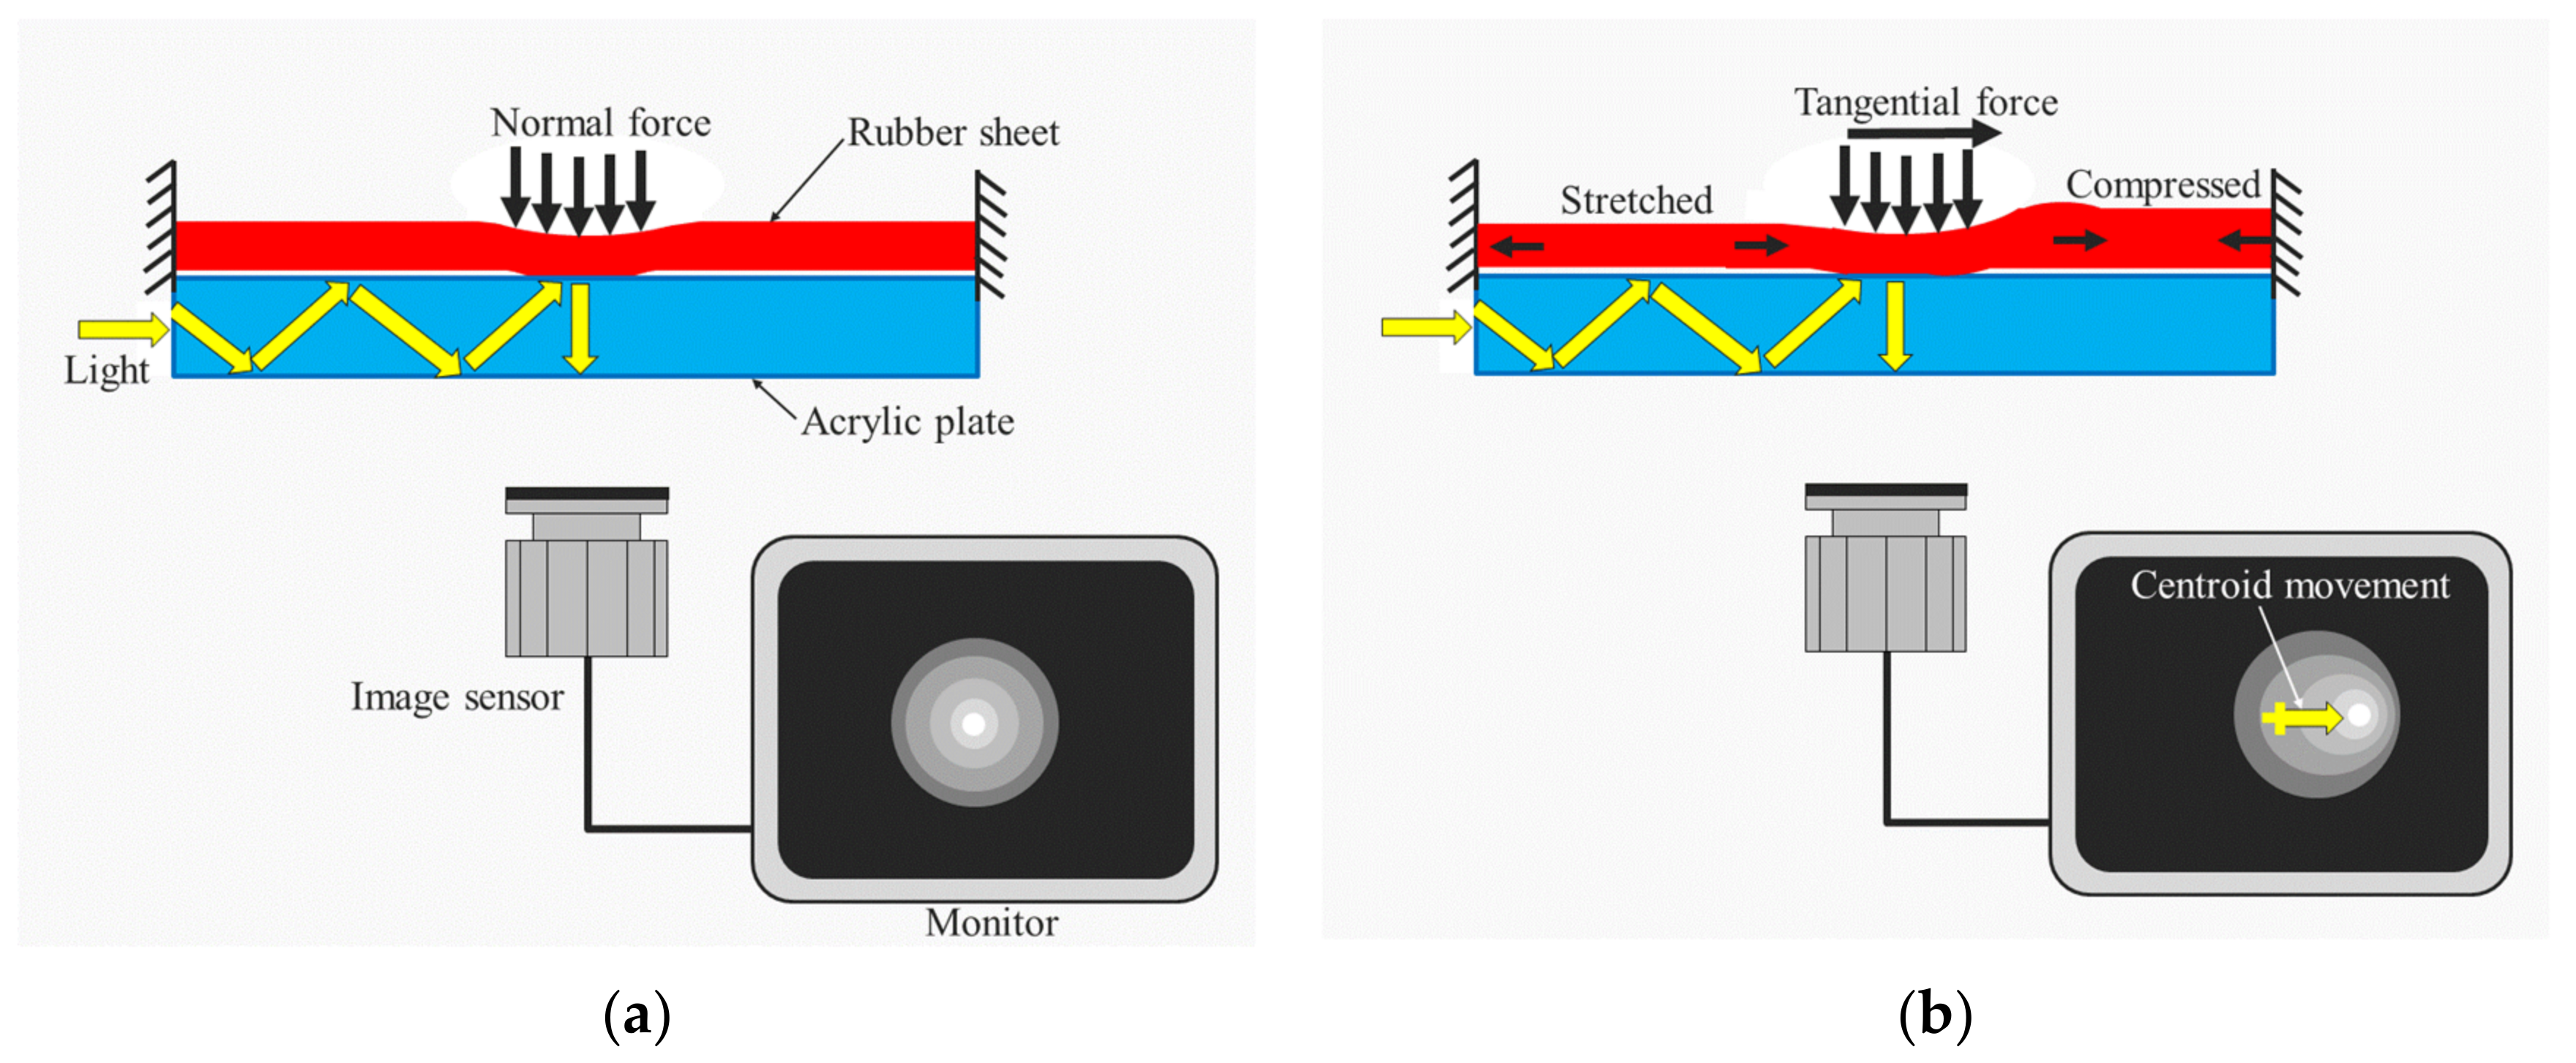
The sensing principle is shown in Figure 7. The simplest structure is composed of an acrylic plate, a rubber sheet, an image sensor, and a light source; the light from the light source is directed onto the end of the acrylic plate and the rubber sheet is placed on the acrylic plate. Since the refractive index of acrylic is different from that of air, the directed light causes total reflection on the inside surface of the acrylic plate. If the surface condition of the acrylic plate is not changed, the image sensor cannot capture any variance in the image data. However, if force is applied to the rubber sheet as shown in Figure 7, contact between the back surface of the rubber sheet and the acrylic plate occurs, changing the reflection condition. Thus, the contact area causes diffusion reflection, which is observed by the image sensor as a bright area. This normal force sensing principle is utilized in the previous paper [17]. Although this sensor is intrinsically capable of detecting tangential force, this capability has not been utilized so far because image data processing should be introduced to the sensor. In the sensor, tangential force causes centroid movement of the contact area because the rubber sheet is stretched or compressed by the tangential force, as shown in Figure 7b [10,11]. Therefore, normal force and tangential force are detected from the grayscale value and centroid movement of the image data if image data processing is introduced.

3.3. Prototype of Robotic Three-Axis Tactile Sensor

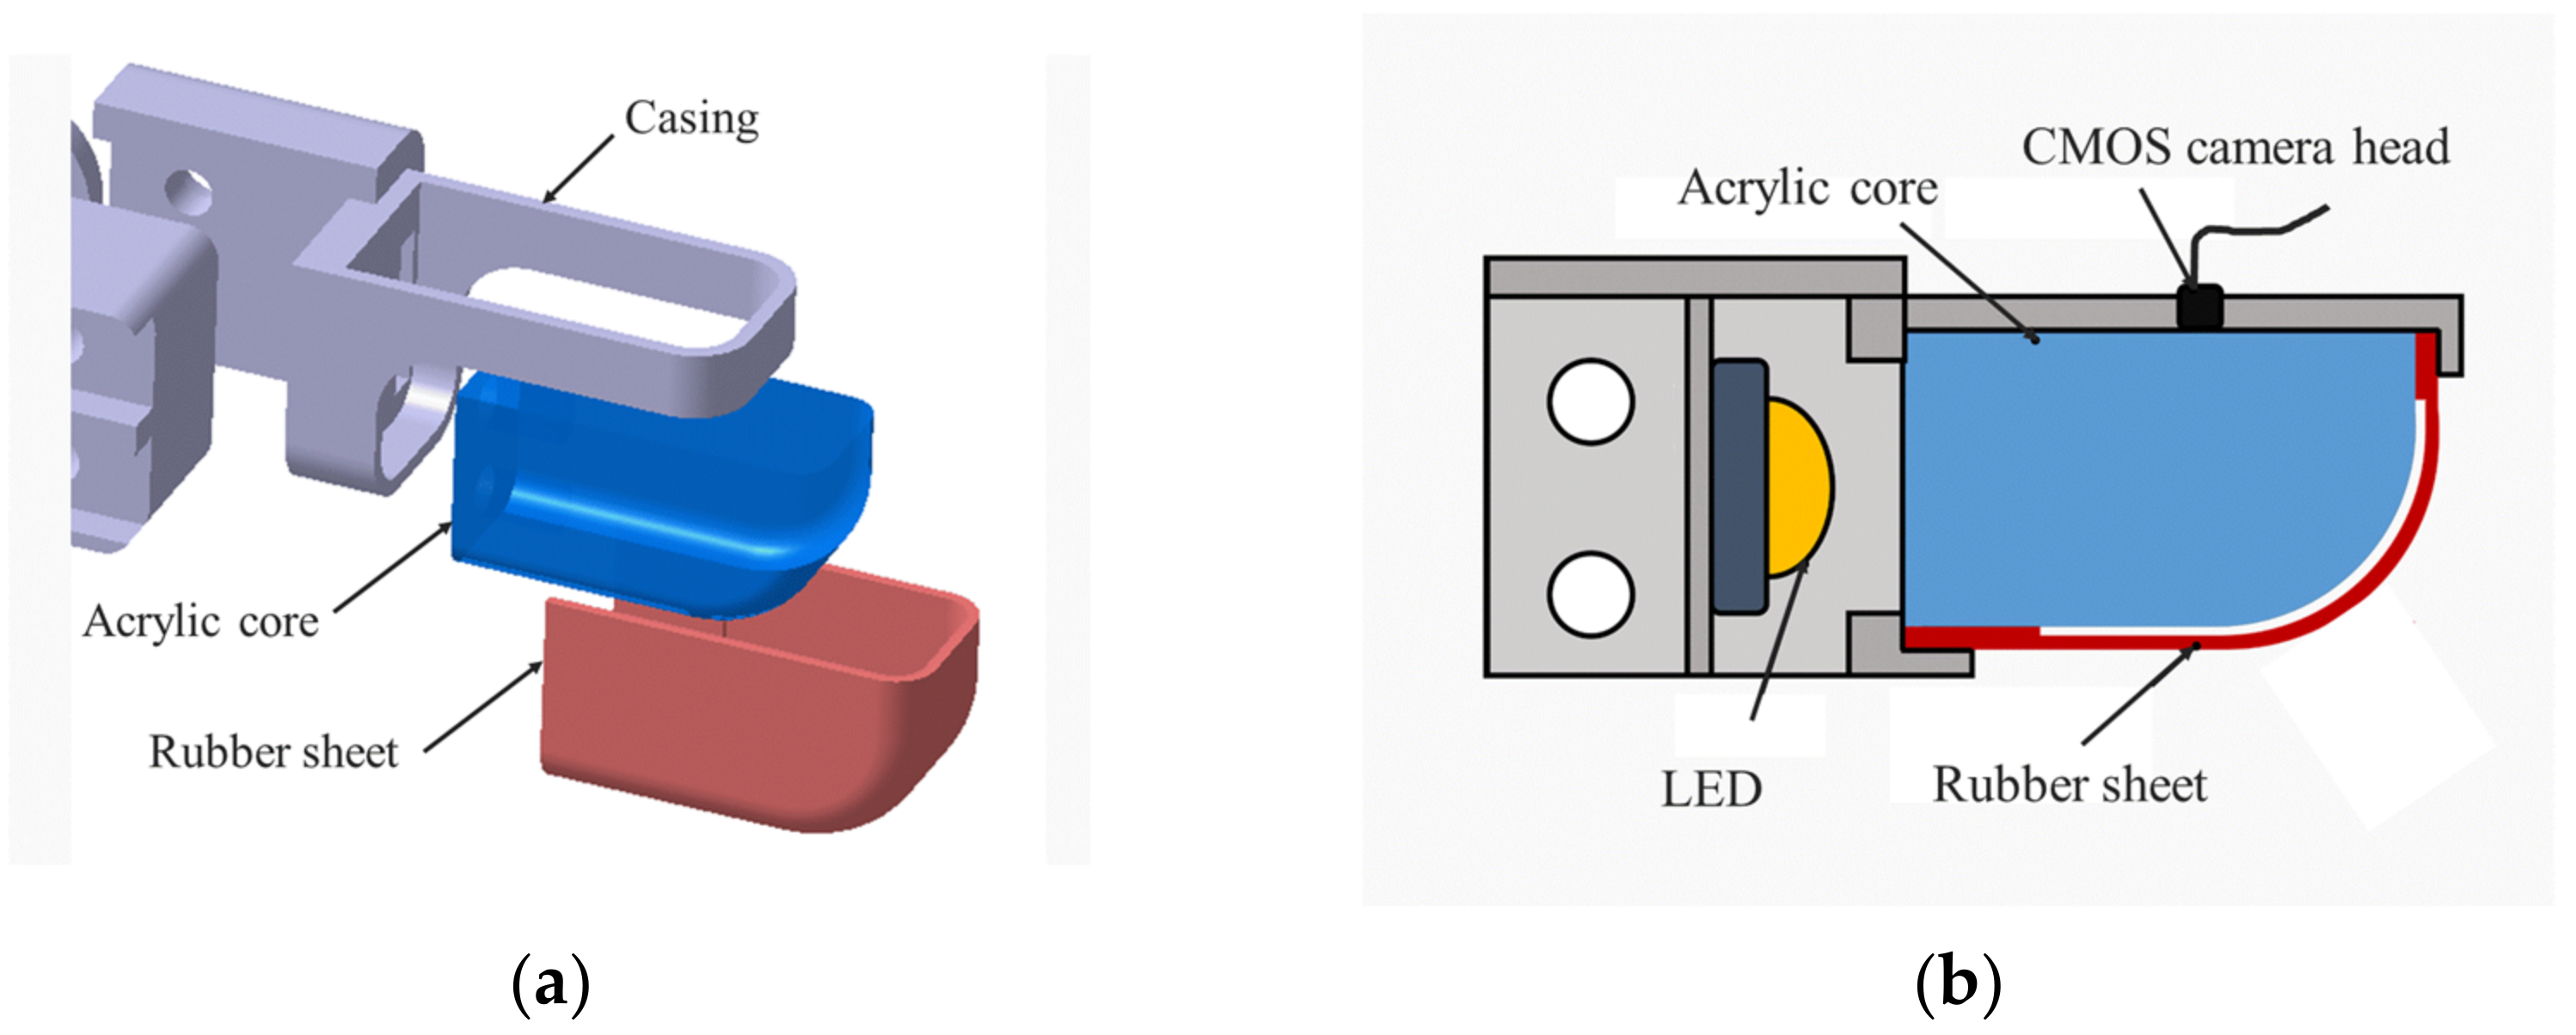
We developed a prototype of the robotic three-axis tactile sensor based on the abovementioned principle. Figure 2a shows the structure of the tactile sensor, which consists of an acrylic core, a rubber sheet, an LED, and a miniature CMOS camera. In the tactile sensor, the rubber sheet acts as a sensing element. Although an optical waveguide requires a thin shell structure as with previous waveguide-type tactile sensors [11,17], ours is equipped with a solid acrylic core. Since the acrylic shell weakens the structure against external forces, we designed a solid acrylic core [10].
The LED illuminates the end of the acrylic core. When external force is applied to the rubber sheet, contact between the back side of the rubber sheet and the acrylic core occurs. This principle will be explained in the next section. This contact appears as a bright area that is captured by the CMOS camera (ARTCAM-006MAT, Artray Co., Ltd., Tokyo, Japan). The tactile sensor is designed to be similar to a human index finger, as shown in Figure 2b. The width, length, and thickness of the distal phalanx are 15, 63, and 17 [mm], respectively. It was designed to be mounted on a humanoid robotic hand. As a result, when tactile data measured by the fingernail color sensor are reproduced on the robotic hand, this morphological similarity is convenient for the reproduction of human hand function.

3.4. Experimental Method

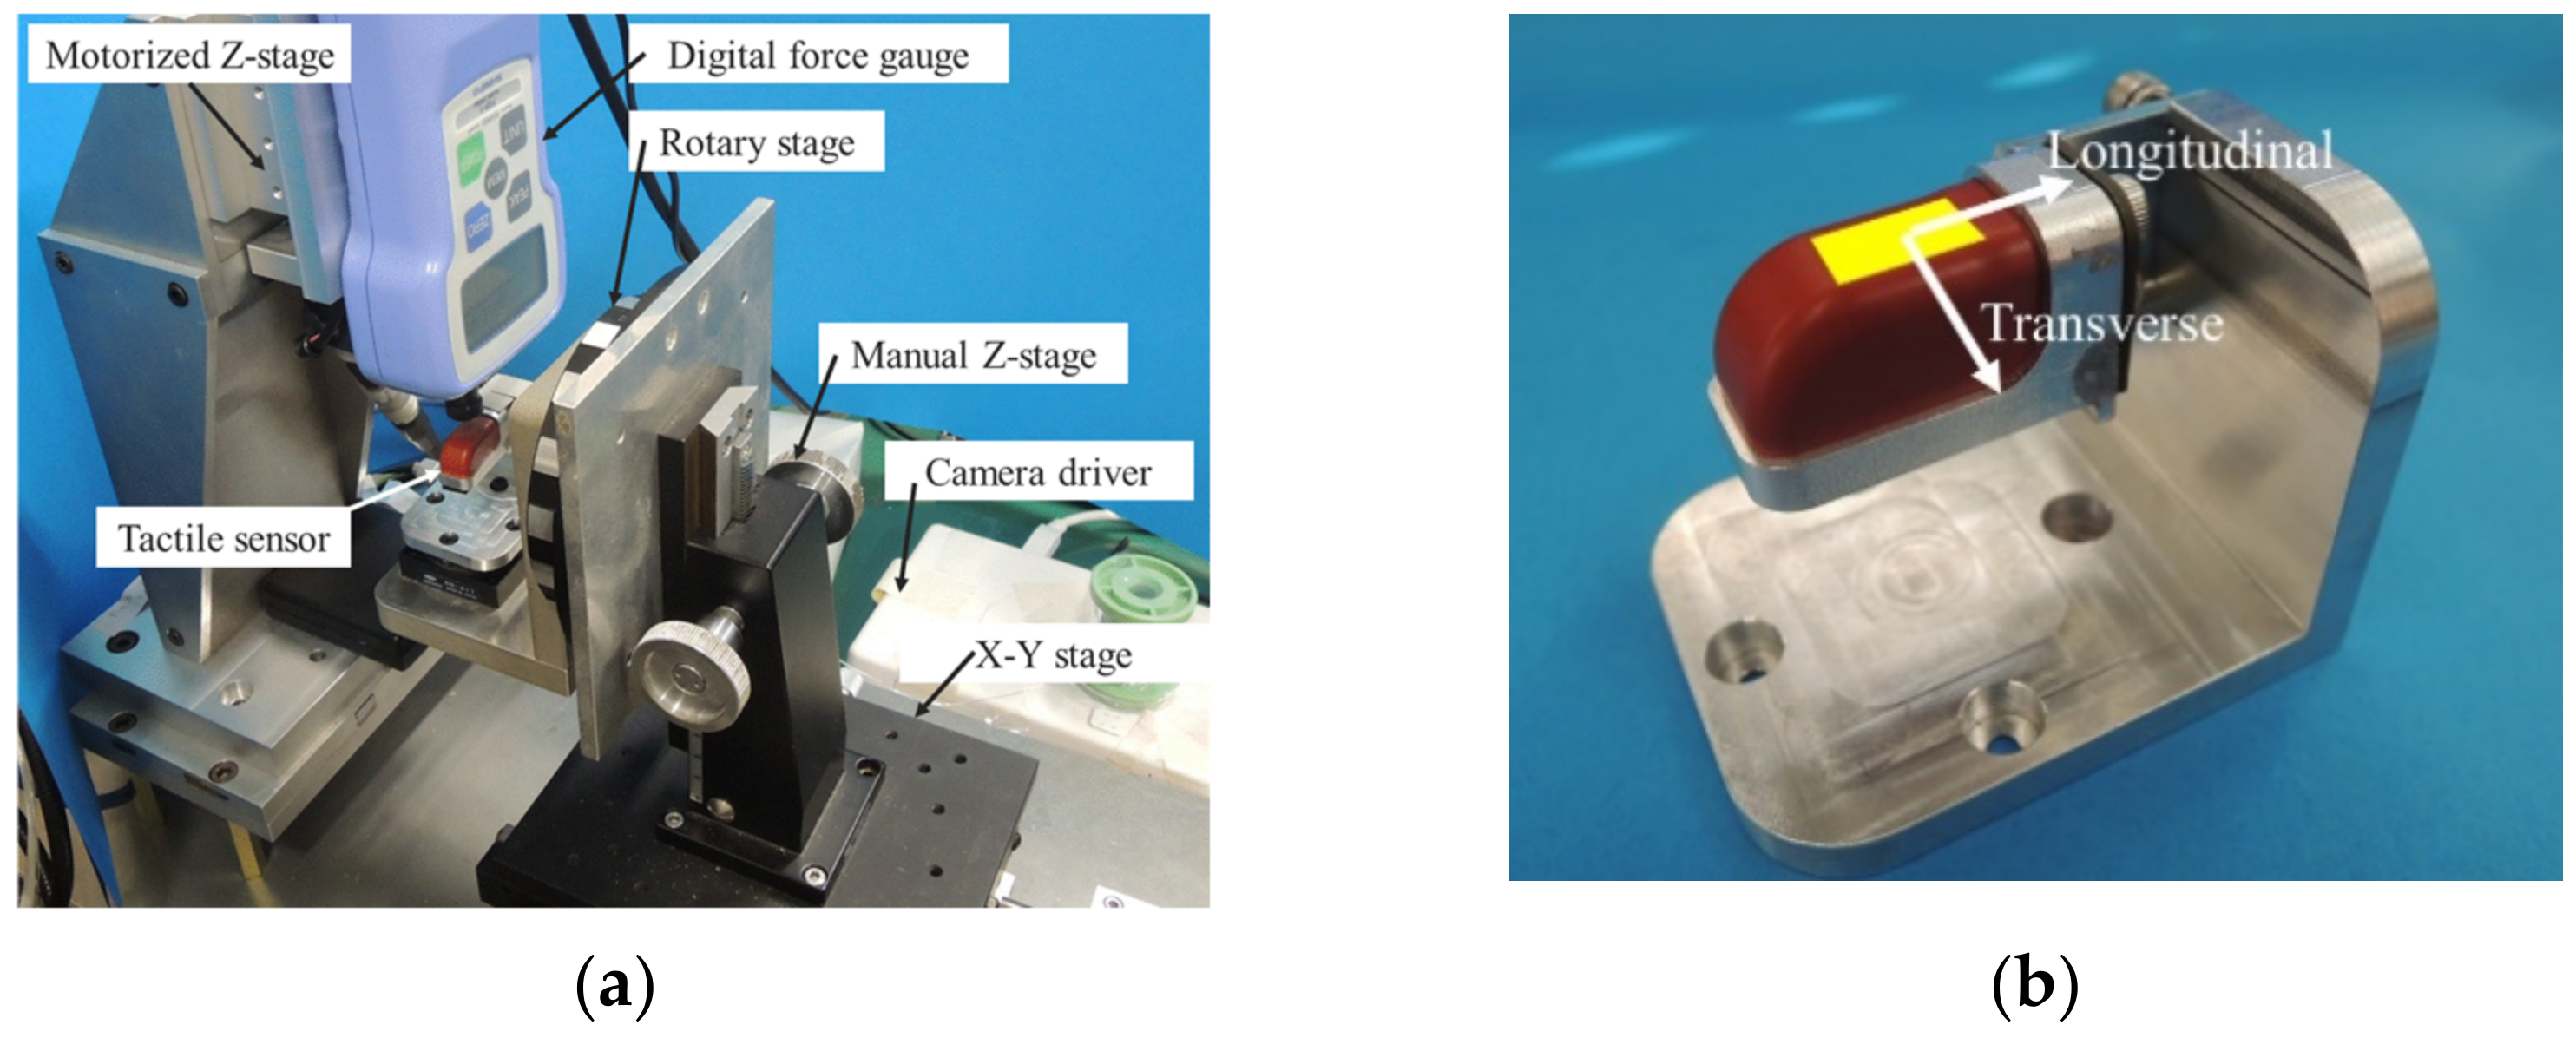
Our experimental loading apparatus is shown in Figure 8a. It comprises a digital force gauge (FGP-1, NIDEC-Shimpo Corp., Kyoto, Japan), a motorized z-stage (VSQ-601X, Chuo Precision Industrial Co., Ltd., Tokyo, Japan; used vertically as a z-table), a manual x-stage and manual z-stage (LS-241-C1 and LV-111, respectively, Chuo Precision Industrial Co., Ltd.), and the tactile sensor mounted on a holder. Figure 8b shows a magnified photograph of the tactile sensor attached to the holder of the rotary stage. The current force value was sent via RS-232C and the CMOS camera’s image data were sent via USB to a computer. To obtain normal and tangential forces, the maximum grayscale value and contact area centroid were calculated by the computer with our handmade program using OpenCV. Consequently, the data of measurement time, maximum grayscale value, coordinate of centroid, and applied force were recorded in an Excel file.
We assume the datum to be the 0 N force status just before the force increases. After turning on the LED, we executed our handmade program. At that time, the movement speed of the motorized z-table was 0.01 mm/s. To apply force, we used a 4-mm-diameter probe, which was used for testing the ordinal three-axis tactile sensor. Since probe size affects sensor sensing characteristics, we will examine this factor in our future work. The testing area is delineated in Figure 8b by a rectangle because we tested a flat region for this paper. A test of a curved surface will be conducted in our future research because a more advanced algorithm is required to modify the warped image.
For the normal force test, we used the motorized z-table to obtain the relationship between force and the grayscale value. On the other hand, for the tangential force test, both normal and tangential forces should be measured. Although introducing an additional force gauge is one solution, we used the tactile sensor as a force gauge because it was calibrated through the normal force test. Therefore, normal and tangential forces were measured by the tactile sensor and the force gauge, respectively. After normal force reached a specific level using the manual stage, tangential force was applied through the motorized stage.
Furthermore, in the tangential force test, we changed the probe mounted on the digital force gauge to a special L-shaped probe for the tangential force test and changed the tactile sensor posture using the rotary stage to measure the specific directional tangential force. Since the tactile sensor’s tangential force sensing characteristics seemed to vary according to the tangential force direction, we performed two tests to apply different tangential force directions to the tactile sensor—specifically, the longitudinal direction and transverse direction.

3.5. Results and Discussion

Figure 9 shows the relationship between the grayscale value and applied normal force, which is nonlinear. In the very low normal force range of 0 to 0.1 [N], the relationship is almost linear, with a high inclination of around 8.5 × 10 5 [1/N]. In the middle range of 0.1 to 1 [N], the relationship shows considerable large nonlinearity. After 1 [N], the relationship is treated as linear, with an inclination of around 2.2 × 10 4 [1/N]. As shown in Figure 9, although the relationship includes low noise, normal force is estimated from the grayscale value obtained from the tactile sensor if a suitable regression is applied to the relationship.
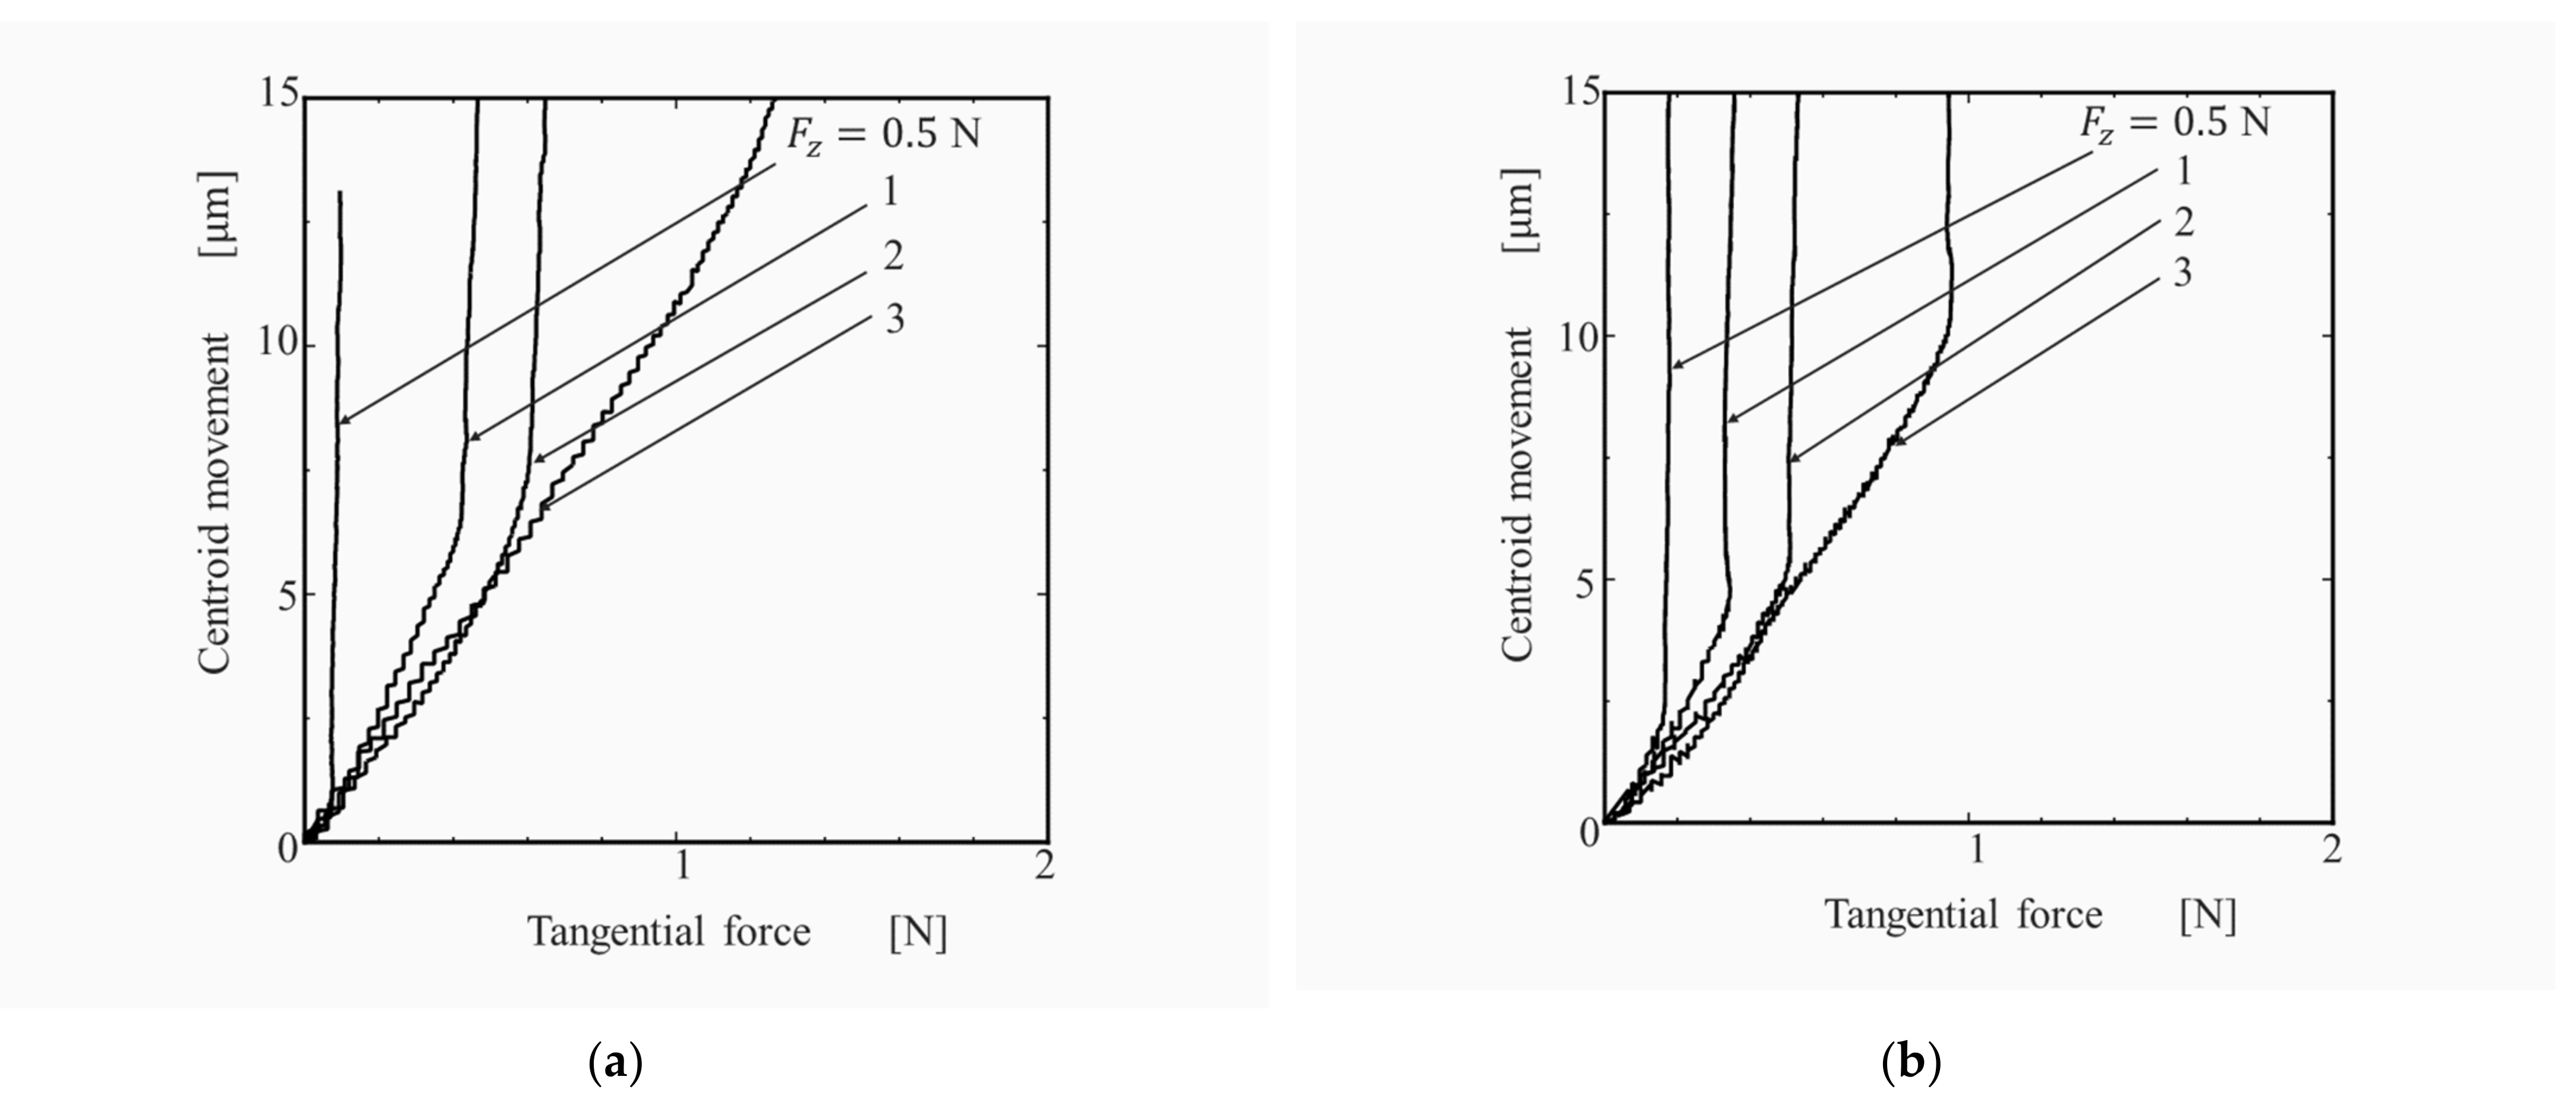
The result for the longitudinal tangential force test is shown in Figure 10a. There are four normal force conditions: F z = 0.5 , 1, 2, and 3 [N]. Looking at the case of F z = 3 [N], we notice that the relationship between the centroid movement and tangential force monotonicity increases. On the other hand, conditions F z = 0.5 , 1, and 2 [N] show that they bend upward and centroid movement increases under constant tangential force after the bending point. Furthermore, the tangential force at the bending point increases with an increase in normal force.
Figure 10b shows the result for the transverse tangential force test. The graph inclination bends upward, similarly to Figure 10a, to increase tangential force at the bending point with increasing normal force. The inclination occurs because the contact area moves on the acrylic core to deform the rubber sheet under low tangential force and the probe slips on the rubber sheet under tangential force that is greater than the critical tangential force. Since this phenomenon corresponds to laws of dry friction, the centroid movement will follow the first linear portion of F z = 3 [N] if the probe is glued on the rubber sheet. Therefore, we will use the present three-axis tactile sensor for the tactile recording and playback system because it can apply normal and tangential force to the robotic fingertip.

4. Contributions to Tactileology

Tactileology is a new cross-disciplinary research field that considers time-evolving tactile sensations. The proposed fingernail sensor and robotic three-axis tactile sensor make effective contributions to tactileology by means of acquiring time-evolving tactile data. If a person wore the fingernail sensors to record his/her manipulation skill, we could obtain time-evolving tactile sensations for use in the analysis of human tactile sensation. If a robot wore the robotic three-axis tactile sensors to control its finger forces via feedback of the human tactile sensations recorded by the fingernail sensors, it could reproduce the person’s hand-use skill. These tactile data will be used for a variety of studies, such as the meaning of tactile sensation as well as tactile art and culture. Although our project ultimately aims to develop a tactile data system with record-and-playback capability, the two devices will individually contribute to the progress of tactileology as described above.
When we achieve the development of such a record-and-playback tactile data system, we will apply it to tactileology in a wider range. With this system, since tactile data retrieved by the fingernail sensor are stored in a computer and then the tactile data are reproduced by a robot equipped with the robotic three-axis tactile sensors, we can study various issues related to tactile sensation within the general framework of tactileology as follows.
As described in the Introduction, we can record and playback the manipulations of specific people using the system, and thus students can learn their manipulations at any time, even after the modeled person passes away. Aside from this simple usage for instruction, the system can be used for analysis of human manipulation to retrieve the essence of tactile sensation. In other words, if we analyzed the recoded tactile data in a computer, we might reveal the knack of specific techniques possessed by noteworthy people. Moreover, for common manipulations such as cup handling, writing with a pencil, and picking up tissue paper, the recording and analysis provide important findings to enhance the manipulation controllability of robots. By analyzing the recorded tactile data stored in the computer, we will find particular cases of having the knack to perform common manipulations. Such obtained “knacks” could be effectively applied to produce masterpieces of art by humans, robots, and humans and robots working in collaboration.
Furthermore, we expect to analyze the emotions produced by tactile sensations using the record-and-playback capability of the tactile data system. In our future work, we will attempt to incorporate the tactile score developed by Y. Suzuki and R. Suzuki [3] into the computer’s operations because we intend to find new tactile conditions that can produce pleasant sensations from an analysis based on the obtained tactile score. Since a specific tactile score induces pleasant sensations according to Y. Suzuki and R. Suzuki, we might be able to find rules related to emotions through an analysis of the tactile score assigned to the tactile data stored in the computer. For example, if the record and playback of a tactile data system were applied to massage therapy, we would first collect tactile data from the massage technicians to produce a tactile score, which would then be tested through performing massage on a human subject using a robotic hand equipped with the robotic three-axis tactile sensors. We expect this new form of emotion management to have relevance for both psychology and art.

5. Conclusions

In this article, we attempted to develop the key parts of a tactile record and playback system for use in various fields such as instruction, archiving, and the analysis of human manipulation. We used two important devices in the creation of this system: a sensor capable of measuring the tactile sensation felt by a person during manipulation to record sensation and a robotic tactile sensor capable of measuring the tactile data occurring during contact between the robotic finger and an object to playback the recorded data. These two kinds of tactile sensors can detect not only normal force but also tangential force, which is essential because people manipulate objects and tools in various ways, such as grasping, picking, and rubbing.
In the former tactile sensor, we ascertained the 3D force applied to a fingertip with the fingernail color change occurring by blood distribution under the nail, which could be observed with green illumination and a miniature CMOS camera. Since this color change was more complicated than the robotic sensor, the relationships between the image and 3D force were learned using a CNN. The experimental results showed that the fingernail color sensor had better precision than similar tactile sensors. Notably, it had considerably better precision for tangential force sensing.
For the latter sensor, the 3D force applied to a robotic finger was transformed into a bright area using an illuminated acrylic core, a rubber robotic finger skin, and a miniature camera. Normal force and tangential force were measured with the brightness and movement of the bright area, respectively. Using a force gauge or an electric scale as a measuring device, we performed a series of evaluation experiments. The experimental results showed that the fingernail color sensor and robotic tactile sensor were sufficiently precise for our system.
In our future work, we will attempt to incorporate the tactile score because we intend to find new tactile conditions that produce pleasant sensations from analysis based on an obtained tactile score. After we develop the tactile record and playback system using the two devices described in this article, we will address this problem of achieving not only the archiving of tactile data but also the ability to induce emotional responses in people.

Author Contributions

Conceptualization, M.O. and H.K.; experiment and data curation of fingernail color sensor, K.W.; experiment and data curation of robotic three-axis tactile sensor, R.N.; validation, writing—original draft preparation, writing—review and editing, M.O. All authors have read and agreed to the published version of the manuscript.

Funding

This research was funded by the Toyoaki Scholarship Foundation, and the JSPS Kakenhi Grants Numbers JP19J15243 and 19K22869.

Institutional Review Board Statement

The study was conducted according to the guidelines of the Declaration of Helsinki, and approved by the Ethics Committee of Nagoya University.

Informed Consent Statement

Informed consent was obtained from all subjects involved in the study.

Data Availability Statement

The data presented in this study are available on request from the corresponding author.

Conflicts of Interest

The authors declare no conflict of interest.

References

  1. Techtile Tool Kit. Available online: http://www.techtile.org/en/techtiletoolkit/ (accessed on 19 April 2021).
  2. Nakatani, M.; Kakehi, Y.; Minamizawa, K.; Mihara, S.; Tachi, S. TECHTILE workshop for sharing haptic experience. TVRSJ 2014, 19, 593–603. (In Japanese) [Google Scholar]
  3. Suzuki, Y.; Suzuki, R. Tactile Score/A Knowledge Media for Tactile Sense; Springer: Tokyo, Japan, 2014; pp. 21–29. [Google Scholar]
  4. Mascaro, S.A.; Asada, H.H. Measurement of finger posture and three-axis fingertip touch using fingernail sensors. IEEE Trans. Robot. Autom. 2012, 20, 711–717. [Google Scholar] [CrossRef]
  5. Nomura, Y.; Maeda, T. The study of fingernail sensors for measuring finger forces and bending. TVRSJ 2001, 6, 210–215. (In Japanese) [Google Scholar]
  6. Hinatsu, S.; Yoshimoto, S.; Kuroda, Y.; Oshiro, O. Estimation of fingertip contact force by plethysmography in proximal part of finger. Med. Biol. Eng. 2017, 53, 115–124. (In Japanese) [Google Scholar]
  7. Nakatani, M.; Kawaue, T.; Shiojima, K.; Kotetsu, K.; Kinoshita, S.; Wada, J. Wearable Contact Force Sensor System Based on Fingerpad Deformation. In Proceedings of the 2011 IEEE World Haptic Conference, Istanbul, Turkey, 21–24 June 2011; IEEE: Piscataway, NJ, USA, 2011; pp. 323–328. [Google Scholar]
  8. Grieve, T.; Lincolon, L.; Sun, Y.; Hollerbach, J.M.; Mascaro, S.A. 3d force prediction using fingernail imaging with automated calibration. In Proceedings of the 2010 IEEE Haptics Symposium, Waltham, MA, USA, 25–26 March 2010; IEEE: Piscataway, NJ, USA, 2010; pp. 113–120. [Google Scholar]
  9. Ohka, M. Robotic Tactile Sensors. In Encyclopedia of Computer Science and Engineering; Wiley: Hoboken, NJ, USA, 2009; Volume 4, pp. 2454–2461. [Google Scholar]
  10. Ohka, M.; Nomura, R.; Yussof, H.; Zaharu, N.I. Development of human-finger-sized three-axis tactile sensor based on image data processing. In Proceedings of the 9th International Conference on Sensing Technology, Auckland, New Zealand, 8–10 December 2015; IEEE: Piscataway, NJ, USA, 2015; pp. 212–216. [Google Scholar]
  11. Ohka, M.; Mitsuya, Y.; Higashioka, I.; Kabeshita, H. An experimental optical three-axis tactile sensor for micro-robots. Robotica 2005, 23, 457–465. [Google Scholar] [CrossRef] [Green Version]
  12. Shimojo, M.; Namiki, A.; Ishikawa, M.; Makino, R.; Mabuchi, K. A tactile sensor sheet using pressure conductive rubber with electrical wires stitched method. IEEE Trans. Sens. 2004, 5, 589–596. [Google Scholar] [CrossRef]
  13. Tada, Y.; Inoue, M.; Kawasaki, T.; Kawahito, Y.; Ishiguro, H.; Suganuma, K. A flexible and stretchable tactile sensor utilizing static electricity. In Proceedings of the IEEE/RSJ International Conference on Intelligent Robots and Systems, San Diego, CA, USA, 29 October–2 November 2007; IEEE: Piscataway, NJ, USA, 2007; pp. 684–689. [Google Scholar]
  14. Tanaka, M.; Lévêque, J.L.; Tagami, H.; Kikuchi, K.; Chonan, S. The “haptic finger”—A new device for monitoring skin condition. Ski. Res. Technol. 2003, 9, 131–136. [Google Scholar] [CrossRef] [PubMed]
  15. Takenawa, S. A magnetic type tactile sensor using a two-dimensional array of inductors. In Proceedings of the IEEE ICRA 2009, St. Louis, MO, USA, 12–17 May 2009; IEEE: Piscataway, NJ, USA, 2009; pp. 3295–3300. [Google Scholar]
  16. Dahiya, R.S.; Adami, A.; Pinna, L.; Collini, C.; Valle, M.; Lorenzelli, L. Tactile sensing chips with POSFET array and integrated interface electronics. IEEE Sens. J. 2014, 14, 3448–3457. [Google Scholar] [CrossRef]
  17. Nicholls, H.R. Tactile sensing using an optical transduction method. In Traditional and Non-Traditional Robot Sensors; Henderson, T.C., Ed.; Springer: Berlin/Heidelberg, Germany, 1990; pp. 83–99. [Google Scholar]
  18. Sagisaka, T.; Ohmura, Y.; Nagakubo, A.; Kuniyoshi, Y.; Ozaki, K. High-density conformable tactile sensing glove. J. Robot. Soc. Jpn. 2012, 30, 711–727. (In Japanese) [Google Scholar] [CrossRef] [Green Version]
  19. Adbulnabi, A.H.; Wang, G.; Jia, K. Multi-task CNN model for attribute prediction. IEEE Trans. Multimed. 2015, 17, 1949–1959. [Google Scholar]
  20. Simonyan, K.; Zisserman, A. Very deep convolutional network for large-scale image recognition. arXiv 2015, arXiv:1409.1556. [Google Scholar]
  21. Maeda, Y.; Sekine, M.; Tamura, T.; Suzuki, T.; Kameyama, K. Position dependency in photoplethysmographic sensor—Comparison of adjoining ppg signals in light sources and measurement sites. J. Life Support Eng. 2011, 23, 124–129. [Google Scholar] [CrossRef]
  22. OpenCV/Color Conversions. Available online: https://docs.opencv.org/3.4/de/d25/imgproc_color_conversions.html (accessed on 28 April 2021).
  23. Kingma, D.P.; Ba, J.L. Adam: A method for stochastic optimization. arXiv 2017, arXiv:1412.6980v9. [Google Scholar]
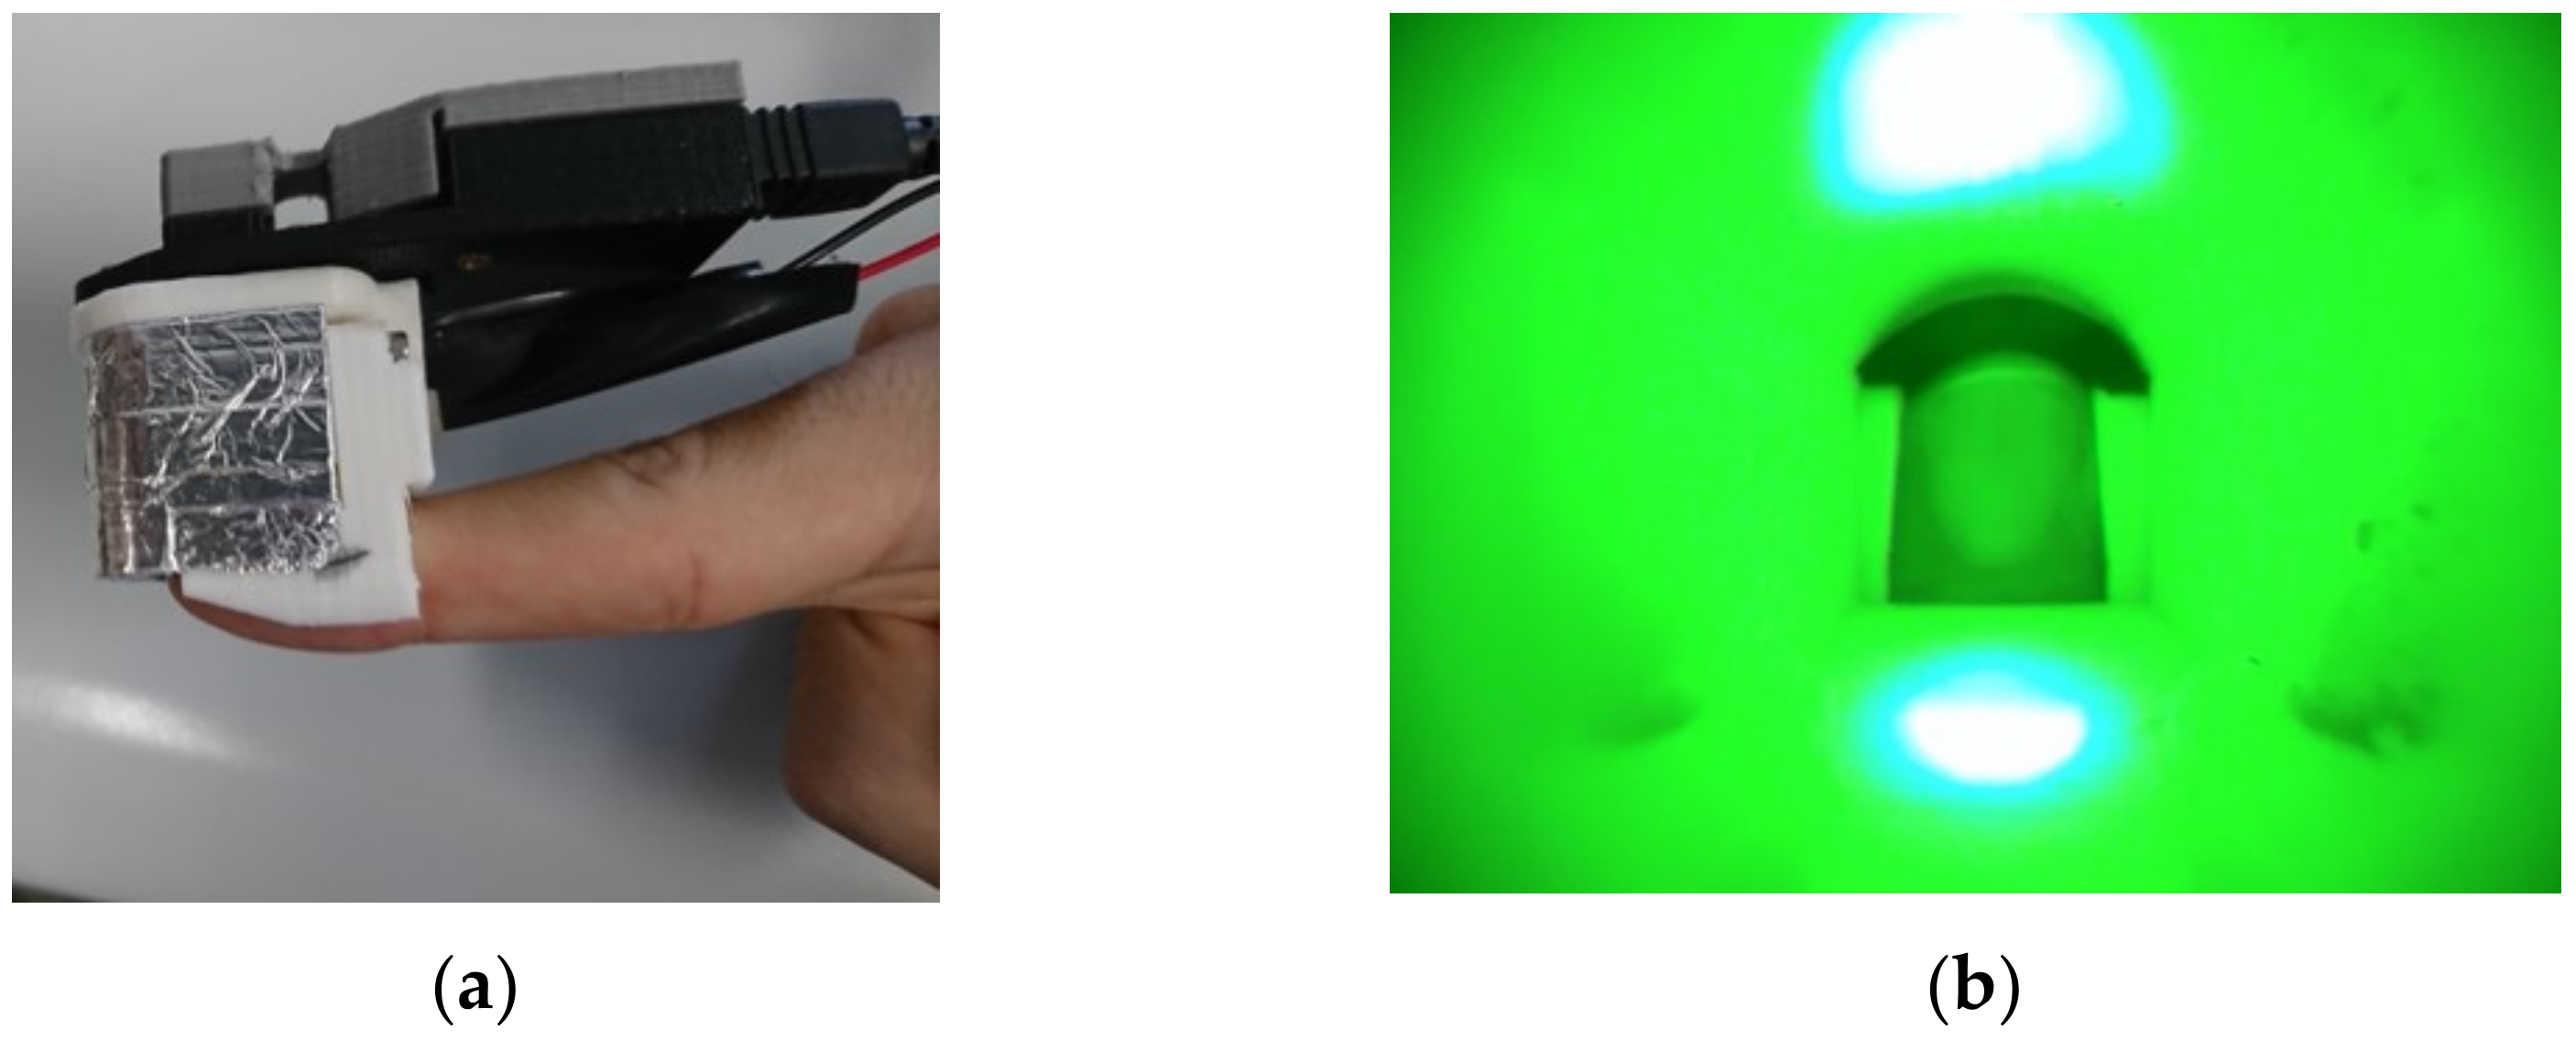
Figure 1. Prototype of the fingernail color sensor: (a) appearance of the fingernail color sensor and (b) image captured by CMOS camera installed in the sensor.
Philosophies 06 00054 g001
Figure 2. Schematic view of robotic tactile sensor: (a) assembly of casing, acrylic core, and rubber sheet and (b) structure of tactile sensor, which is composed of an LED, acrylic core, rubber sheet, and miniature CMOS camera head.
Philosophies 06 00054 g002
Figure 3. Measurement equipment and force generation instruction: (a) A volunteer touches the top of a slider with his right index finger while simultaneously applying normal force and tangential force to it according to instructions shown on an LCD monitor. (b) The LCD monitor shows the force reference with the red point and the instruction history by the green line within 5 s. The volunteer adjusts the force applied to the top surface of the slider to match the current force shown by the blue point to the red point.
Philosophies 06 00054 g003
Figure 4. Structure of deep learning model. Input image data are processed by gray2BGR to obtain RGB data, which are sent to VGG16 and the fully connected layers to obtain the three-axial forces.
Philosophies 06 00054 g004
Figure 5. Variation in loss: (a) Fx; (b) Fy; (c) Fz.
Philosophies 06 00054 g005
Figure 6. Correlation between estimated and true values: (a) Fx; (b) Fy; (c) Fz.
Philosophies 06 00054 g006
Figure 7. Sensing principle of fingertip-mounted tactile sensor: (a) For normal force sensing, since the contact area expands according to the applied normal force, the normal force value is calculated from the integrated grayscale value. (b) For tangential force sensing, since movement of the contact area increases with an increase in tangential force, the tangential force value is estimated from the contact area movement.
Philosophies 06 00054 g007
Figure 8. Loading apparatus: (a) structure of apparatus, which comprises manual xyz stages, a rotary stage, a motorized z-stage, a digital force gauge, a camera driver, and a tactile sensor; (b) tactile sensor mounted on a holder; sensing area and directions of applied force are indicated by the yellow square and arrows, respectively.
Philosophies 06 00054 g008
Figure 9. Result of normal force test: In the very low normal force range of 0 to 0.1 [N], the relationship is almost linear, with high inclination; in the middle range from 0.1 to 1 [N], the relationship shows considerably large nonlinearity. Over the 1-N range, the relationship is treated as a linear curve; normal force is estimated from the grayscale value obtained from the tactile sensor if suitable regression is applied to the relationship.
Philosophies 06 00054 g009
Figure 10. Results of tangential force test: (a) longitudinal tangential force and (b) transverse tangential force. Since the critical tangential force, which causes the bending point, increases with an increase in normal force, this tactile sensor follows the famous physical phenomenon of the laws of dry friction.
Philosophies 06 00054 g010
Publisher’s Note: MDPI stays neutral with regard to jurisdictional claims in published maps and institutional affiliations.