Article

Continuous Nonintrusive Mobile Device Soft Keyboard Biometric Authentication

Department of Electrical and Computer Engineering, Iowa State University, Ames, IA 50011, USA
*
Author to whom correspondence should be addressed.
Cryptography 2022, 6(2), 14; https://doi.org/10.3390/cryptography6020014
Submission received: 25 February 2022 / Revised: 18 March 2022 / Accepted: 21 March 2022 / Published: 23 March 2022
(This article belongs to the Special Issue Cryptography: A Cybersecurity Toolkit)

Abstract

:
Mobile banking, shopping, and in-app purchases utilize persistent authentication states for access to sensitive data. One-shot authentication permits access for a fixed time period. For instance, a username/password-based authentication allows a user access to all the shopping and payments data in the Amazon shopping app. Traditional user passwords and lock screens are easily compromised. Snooping attacks—observing an unsuspecting user entering passwords—and smudge attacks—examining touchscreen finger oil residue—enable compromised user authentication. Mobile device interactions provide robust human and device identity data. Such biometrics enhance authentication. In this paper, behavioral attributes during user input constitute the password. Adversary password reproduction difficulty increases since pure observation is insufficient. Current mobile continuous authentication schemes use, among others, touchscreen–swipe interactions or keyboard input timing. Many of these methods require cumbersome training or intrusive authentication. Software keyboard interactions provide a consistent biometric data stream. We develop biometric profiles using touch pressure, location, and timing. New interactions authenticate against a profile using a divergence measure. In our limited user–device data sets, the classification achieves virtually perfect accuracy.

1. Introduction

Mobile devices serve as a repository for large chunks of private information such as wallets, identities for shopping and financial domains, and private correspondences, among many others. It is important to limit access to this trove of information. One-shot authentications using textual passwords or fingerprint scanners provide device and data access for a fixed period of time. Inauthentic users acquiring the device during this time period gain access to sensitive data. Applications in an authenticated state are exposed to misuse. Continuous authentication based on natural behavioral interactions of the user with the device offer a way out of this situation.
Modern UIs engage the user through the touchscreen, voice, or device movement. Sensor-rich mobile devices capture unique user behavior. How a user touches specific soft keyboard keys, speaks commands, or moves physically are learned behaviors.
In this paper, we characterize a soft-keyboard-based biometric profile—a user behavior identity. A profile is constructed from past soft keyboard interactions. It is dynamically updated using the most recent soft keyboard interactions. Validating the most recent soft keyboard interactions against this profile results in continuation or denial of device access.
Touch interactions produce electrical current flow change in a sensor grid. Capacitive or resistive touchscreens use an array/grid of electronics capable of measuring capacitive or resistive change induced by touch. These CMOS transistors exhibit the same variability that has been exploited in the traditional silicon physical unclonable functions (PUFs). In addition, there is sensing circuitry that detects the row and column number where the touch-induced capacitance or resistance change occurs. The sensing logic is replicated into a grid of touchscreen regions so that the events in multiple regions can be detected in parallel. The size of this grid keeps increasing to support fine-grained multiple gestures. This sensing logic is another source of variability in the touch-screen-based PUF. It is plausible that the same silicon fabrication processes that lead to variability in the traditional silicon PUF will induce similar variability in the measured current and voltages resulting from touch actions on touchscreens. Walker [1] provided a survey of various touchscreen technologies.
The current change magnitude depends on learned user behavior—users apply varying pressure at specific grid points. Current change magnitude also varies between devices due to silicon manufacturing variations. Touch current sensors report pressure values in the range [ 0 , 1 ] . This value is a composite signature of user behavior and device silicon variation. We develop a user profile from these pressure token streams over a period of time.
These pressure token stream profiles are surprisingly robust. Even a profile derived from about 4000 pressure tokens results in over 70% user identification accuracy. In our experiments based on 13 user–device data sets, a 10,000 token profile provides up to 93% accuracy, whereas a 12,800 token profile provides almost 100% accuracy in user and device identification. Clearly, this observation does not guarantee user and device identification accuracy levels with an order of 4000–12,800 touch events. It only points to the fact that a good level of accuracy is achievable within an order of 10,000 touch interactions. In other words, it is unlikely that a good touch-based model requires of the order of 100,000 or a million touch interactions.
Most available user-behavior-based authentication/identification methods use only the behavioral attributes, limiting themselves to user-based identities. The proposed method, as alluded to earlier, also identifies a device, generating a more robust combined user–device identity. Adversaries cannot trivially separate the user identity from the device identity. User–device association is persistent for typical mobile applications, such as Google Wallet, making a combined user–device identity more meaningful than a user identity alone.
There are two broad user authentication methods. One-shot authentication, such as a user password, establishes the user identity periodically; an authentication token persists for some time period, such as 24 h. One could argue that one-shot authentication persists only in between device sleep events which result in intervening lock screen authentications. Reliance on lock screen authentications is unreliable. Snooping and smudge attacks render these protections impotent [2,3,4]. Most users neglect the lock screen entirely [5]. Continuous authentication verifies the user identity periodically, such as every 5 min. This alleviates the shortcomings of one-shot and lock screen authentications.
One-shot biometric schemes also enhance authentication. Facial recognition, fingerprint scanners, and swipe-based biometric authentications are available. Facial recognition succeeds erroneously on legitimate user pictures [6] and videos [7]. It also fails on database attacks, presenting a large number of images [8]. Fingerprint scanners can fail on printed fingerprints [9]. Lifting an authentic fingerprint from touchscreen oil residue enables fingerprint reproduction from the mobile device alone [10]. Swipe-based authentications require explicit and cumbersome enrollment.
Physical unclonable functions (PUFs) further enhance biometric schemes. A PUF is a challenge response function. Providing a challenge produces a response. Unique reproducible chip identities result from response variability between chips. A typical PUF is a distinct system component having no functional purpose, unlike the proposed touchscreen PUF as a side-effect of the touchscreen interactions. Touchscreen current sensors exhibit PUF properties [11,12]. Their data are therefore unique to a user–device combination [12]. Responses generated on one device are invalid on another.
A continuous biometric authentication scheme is proposed. Software–keyboard–touchscreen interactions provide biometric data. Data PUF properties—variability and reliability—enhance authentication security. User profiles are n-gram approximations to model nth-order Markov processes. This simplifies profile authentication computations using a divergence measure. The profile data structure is optimized using a prefix tree to reduce the profile size and to accelerate profile authentication computations.

1.1. User Profiles

A sequence of curated pressure tokens is parsed into n-grams: a sequence of ( n 1 ) tokens followed by the probability of the nth token over the entire alphabet. Each n-gram occurs with a frequency in a user profile. This collection of (n-grams, frequency) tuples from a sequence of touchscreen interactions is a user profile. This profile depends both on the user context and app dictionary— what kind of words over the app alphabet are used in the soft keyboard interactions. For example, a user might be more excited playing a game with a virtual XBOX controller instead of using a shopping app.
Admittedly, per-app profiles derived from the soft keyboard interactions within the dictionary and context of a single app will be more accurate. However, modern mobile apps tend to have persistent app authentication given the device-level authentication for user convenience. Given this, a device-level unified profile over the user–keyboard interactions over multiple apps also makes sense as a reinforcement for device-level single-shot authentication. This is what we have chosen to implement and evaluate. Note that the authentication accuracy of a unified dictionary and context profile is likely to be a lower bound on the authentication accuracy of a per-app dictionary and context profile. Hence, our work should be treated as a floor in this direction.

1.2. Contributions

Identity Mapping—Universally and naturally generated input pressure token streams are mapped to a profile. Profiles are a set of n-grams. These n-grams contain an n 1 token window prefix of the pressure token sequences with the outgoing transition probability of each token in the alphabet as the nth token. Tokens are a function of soft keyboard key location and sensor current magnitude (user pressure); they capture unique user and device characteristics.
Divergence Measure—Authentication utilizes a profile divergence measure defined between profile n-gram sets.

1.3. Paper Organization

Section 2 elaborates existing mobile biometric authentication approaches. Section 4 describes the two key data structures used in this paper: n-gram and prefix tree. Section 5 gives algorithms for raw pressure value tokenization, profile generation, reduction of a pressure token sequence to an n-gram set, divergence computation between two n-gram sets, and the authentication of an input activity n-gram set against a user profile. Section 6 provides accuracy and computation time efficiency results. Section 7 contextualizes results.

2. Related Work

The National Information Assurance Partnership (NIAP) common criteria report [13] outlines mobile device security requirements. It outlines the security goals and standardizes the terminology. Our intent is alignment with authentication security goals from this report.
Ratha et al. [14] proposed sensor biometrics for authentication. Examples include interkeystroke timing [15], accelerometer-based signatures [16], MEMS sensors [17], gait sensors [18], touchscreen–swipe interactions [19,20,21], and broader sensor sets [22]. These works extract a user identity. We use touchscreen current sensor measurements resulting from soft keyboard interactions to create user–device identities. Tying identities to both user and device characteristics is suitable for many common applications, such as Google Wallet. A keystroke dynamics survey [23] cites mobile device typing behavior as an interesting research direction, suggesting the novelty of our approach.
Touchscreen sensors exhibit PUF properties. Rosenfeld et al. [11] integrated hardware-level PUF into sensors. Sensed values become challenges. Responses authenticate sensed values. Thus, PUF properties—variability and reproducibility—must exist in sensed values. Scheel and Tyagi [12] proposed a so-called User–Device PUF (UD-PUF): Challenges are polylines presented to the user; the user traces this line. Data undergo statistical concentration forming a response. Response PUF properties are tested at length. Near perfect (same user, same device) reproducibility was shown with variability sufficient to detect user or device changes. Hence the name UD-PUF—an identity tied to both user and device with PUF properties. Our work utilizes the combined user–device identity idea. We apply it to continuous, as opposed to one-shot, authentication. These contributions confirm the PUF properties of touchscreen current sensors.
Patel et al. [24] surveyed continuous mobile user authentication schemes to reveal open research challenges. Touch dynamics—approaches using touchscreen data—are most commonly employed. Most touch dynamics use touchscreen–swipe interactions as a data source. All cited touchscreen/soft-keyboard-based methods employ machine learning classification. Ours is a key-based approach utilizing n-grams. Such models are generative, as opposed to discriminative, allowing training without known classifications. This approach is more applicable to single-user mobile devices producing continuous input streams.
Mondal and Bours [25] also surveyed key-and-mouse-dynamics-based continuous authentication (CA) techniques. They also argued that for CA systems that are not periodic, the performance metrics more meaningful than false positive rate (FPR), false negative rate (FNR), and equal error rate (EER) could be average number of imposter actions (ANIA) and average number of genuine actions (AGIA). Their CA system assesses every keyboard and mouse action. Our CA system is periodic in the touchscreen motion event space. An authentication assessment is performed for every N such events, and the recommended period is 2400 events. We believe that the traditional FPR, FNR, and EER are reasonable performance indicators for our system.
SenSec [26] utilized accelerometers, gyroscopes, and magnetometers. A textual state representation depends on all sensor values. An n-gram Markov language model profiles user behavior as a token sequence. User identification achieved 75 % accuracy. Online anomaly detection achieved 71.3 % accuracy with 13.1 % false positive rate. We employ a similar n-gram model. Higher accuracy and lower false positive rate are achieved. Our system necessitates only touchscreen sensors. These have guaranteed availability, whereas accelerometers, gyroscopes, and magnetometers can fail without compromising device usability.
Feng et al. [20] developed touchscreen-interaction-based authentication. A user profile combines two data streams: (1) touchscreen current sensors and (2) a glove containing accelerometers and gyroscopes. This leads to an accuracy higher than 95 % . However, the necessity of glove use is cumbersome. We show touchscreen current sensors alone are sufficient and achieve higher accuracy.
Frank et al. [27] used two machine learning classifiers, k-nearest-neighbors and a support-vector machine with an rbf-kernel. 30 features were extracted from touchscreen interactions. A median equal error rate of 0 % was achieved; this dropped to 4 % a week after enrollment. Implementation complexity is high. Extracting 30 touchscreen interaction features and applying machine learning are computationally expensive. Our scheme is comparatively simple, computationally less expensive, and achieves comparable accuracy.
Xu et al. [28] described touch biometrics as a promising continuous authentication method. Strong biometric properties of touchscreen interactions were shown. A continuous authentication system was implemented. However, its high error rate makes it impractical. We show almost 0 % error with as few as 12,800 touch interactions.
Dey et al. [22] used an accelerometer as the device fingerprint. The challenge is a certain-level signal applied to the vibrator, which activates the accelerometer to generate a response signature. Aysu et al. [17] used MEMS as a fingerprint PUF for a low-cost embedded solution in place of relatively more expensive ring oscillators or arbiters. Boneh’s crypto group was also in news [29] for developing fingerprinting techniques for mobile devices. Zhang et al. [30] developed a device fingerprinting technique based on multiple sensors that bypasses Android and iOS privacy guards.
Ouadjer et al. [31] identified a most relevant machine learning feature set from touch gestures using extreme gradient boosting. Ackerson et al. [32] used recurrent neural networks for biometric authentication and anomaly detection. Ryu et al. [33] gave a survey of continuous multimodal biometric authentication systems. Another recent development [34] proposed a zero-knowledge proof protocol for biometric authentication.
Another interesting direction of research is in natural language processing (NLP) or forensic NLP [35], particularly aided by deep learning [36]. A recent success story [37] in this context is possible identification of “Q” from QAnon through forensic NLP. A combination of techniques proposed in this paper along with the forensic NLP techniques may offer even a more robust user-level identification.
A PUF provides a physical security basis useful for biometric systems. Current solutions neglect the device characteristics in favor of user features. We provide an identity inseparable from user or device in contrast to only the user-based variability-induced identities deployed in other approaches.
Our authentication approach is unique. Most current solutions use machine learning. We employ an n-gram model; this contributes to available solution diversity. Further, we use soft keyboard interactions–a single existing data stream requiring no additional generative effort. Other works require many sensors which may or may not be available on a given device.
Key-based continuous mobile authentication has heretofore received little attention. We advance this research area by providing a continuous authentication system utilizing touchscreen pressure data. Touchscreen pressure values have been shown to have strong PUF and biometric properties.

3. Big Picture

Capacitive or resistive changes induced by touch are captured in a capacitive/resistive grid by the current change sensors along the edges of the grid. Silicon foundry statistical variability induces device-level variability in the sensed current change. Users also have unique biometric variability in interacting with a touchscreen. When a user interacts with a mobile app through a soft keyboard, Android framework captures it as a MotionEvent object consisting of its (x,y) coordinates, a pressure value [0, 1] proportional to the sensed current change, and a time stamp. A long touch can create multiple such MotionEvent objects.
A user profile is created from a history of user keyboard interactions within an app on a mobile device. A profile consists of a set of n-gram transition vectors. A 3-gram transition vector can look like ( a b , ( ( 0.5 , a ) , ( 0.2 , b ) , ( 0.3 , c ) ) ). This transition says that a sequence of tokens a b is followed by the token a with probability 0.5 , by token b with probability 0.2 , and by token c with probability 0.3 for this user on this device. These 3-gram transition vectors are derived from a history of 2400–12,800 user–keyboard interactions.
The profile is the model a given user is authenticated against. When a long enough sequence of user interactions is gathered, typically 2400 MotionEvent objects, it is also reduced to a set of 3-gram transition vectors. This interaction set is compared to the stored user profile through a profile divergence measure. If divergence is low, the user is authenticated. The user profile can also be incrementally updated with the latest 2400 interactions and their corresponding 3-gram transition vectors.
This authentication is continuous since it is performed every 2400 or so interaction touch events.

4. n-Grams and Prefix Trees

An n-gram is defined over an alphabet Σ . In natural language processing, for an alphabet Σ = { a , b , c } , a 2-gram is any sequence of two symbols from Σ . a a , a c , b b are 2-gram examples. Figure 1a shows such an example of a 2-gram. An n-gram is similarly a sequence of n symbols. For our work, we enhance this definition of an n-gram slightly. Let the cardinality of alphabet Σ , | Σ | , be m. We add a probability vector v = [ p 0 , p 1 , , p m 1 ] to the ( n 1 ) -token sequence window W = T i 0 T i 1 T i n 2 as an n-gram N G = ( W = T i 0 T i 1 T i n 2 , v = [ p 0 , p 1 , , p m 1 ] ) . Let Σ = { σ 0 , σ 1 , , σ m 1 } . p i captures the probability of word T i 0 T i 1 T i n 2 σ i given T i 0 T i 1 T i n 2 . Figure 1b shows this version of a 3-gram. Given the frequency of a a a being double that of a a b , with frequency of a a c equal to 0, the probability vector is [ 2 / 3 , 1 / 3 , 0 ] with window W = a a giving the n-gram N G = ( a a , [ 2 / 3 , 1 / 3 , 0 ] ) . We use a set of n-grams as a user-profile-based identity to capture the soft keyboard interaction of a user.
In this work, soft keyboard input is processed as n-grams. The raw pressure value, p, and key location, ( x , y ) , are mapped to a unique token σ i Σ . Tokenization of continuous attributes ( p , ( x , y ) ) into a small number of discrete tokens in Σ reduces the complexity of user profiles. An n-gram predicts the next token probability given ( n 1 ) previous tokens.
In order to authenticate a user, a stored user profile needs to be matched against a computed profile. This is conducted through a user profile divergence computation. A divergence measure utilizes differences between next token probabilities for matching n-token prefixes to compare profiles. Storing n-grams in a prefix tree (1) accelerates this divergence computation and (2) reduces n-gram memory size requirements.
Note that an n-gram approximates an ( n 1 ) st-order Markov process to predict the last element in a string of n tokens. n-gram advantages are relative simplicity and generative modeling. Simplicity improves computation speed and implementation difficulty. A discriminative model as in machine learning, as opposed to a generative model as in n-grams, requires training samples from all classes. Generative modeling enables classification using exclusively positive training samples. A discriminative model requires keyboard interaction data from multiple users, whereas a generative model can function with the keyboard interaction data only from one user. Hence, generative models are more applicable to typical single-user mobile devices.

Prefix Tree

A user’s keyboard interaction can be viewed as a string on the alphabet Σ . A user profile breaks up this interaction data string into a set of n-grams. A prefix tree data structure stores these n-gram strings as a tree path, see Figure 2. A node’s string value is the concatenation of edge values along the path from the root node. n-grams are stored as prefix tree strings. In Figure 2, we show the string represented at a node—the node at bottom left encodes the string “at”. In reality, the node does not maintain the string encoded by it explicitly, unlike what is shown in Figure 2. Each node maintains the number of times that string occurs in the set and a successor count vector from which the probability vector is derived. The successor count vector counts the number of times each token succeeds an n-gram. In Figure 2, the count of n-gram “at” is shown to be 2 with two successors—“ata” with count 1 and “ate” with count 1—resulting in successor count vector { c ( a ) = 1 ; c ( e ) = 1 } . The count vector of each node ought to be the sum of count vectors of all its successor edges. Note that successor count vector over the English alphabet would have 26 components giving a count for each symbol.
Algorithm 1 function GEN_TREE generates a prefix tree with root node p r e f i x _ t r e e from an input token sequence t o k e n . Consecutive token windows of length n g r a m _ s i z e are inserted into the prefix tree if they create a valid window. A valid window does not have “time breaks” or “pressure breaks” as described in Section 5. Inserting an n-gram requires traversing the prefix tree. For instance, in Figure 2, inserting the 2-gram “at” will traverse the prefix tree with a path labeled “a” “t”. Beginning at the root node, the first n-gram token determines the successor edge taken. The subsequent token indicates the edge to be taken from the first successor node. This continues until there are no tokens remaining in the n-gram. At each traversed node, the occurrence count stored on that node is incremented. This is shown in italics in Figure 2.
Algorithm 1 Prefix tree generation from input token sequence.
  • const int t i m e _ t h r e s h o l d ;
  • typedef struct{
  •      int o c c u r r e n c e ;
  •      node_t * s u c c e s s o r [ | Σ | ] ;
  • } node_t;
  • function gen_tree(Token[] t o k e n , int n g r a m _ s i z e , node_t * p r e f i x _ t r e e )
  •     for ( i = 0 ; i < t o k e n . l e n n g r a m _ s i z e ; i + + ) do
  •         if (!valid_window( t o k e n , n g r a m _ s i z e , i)) then
  •            continue;    ▹ valid_window has no “time breaks” or “pressure breaks” (Section 5)
  •         end if
  •         node_t ** n o d e _ p ;
  •          n o d e = & p r e f i x _ t r e e ;
  •         for ( j = 0 ; j < n g r a m _ s i z e ; j + + ) do
  •            (** n o d e ) . o c c u r r e n c e + = 1 ;
  •             n o d e = & ( ** n o d e ) . s u c c e s s o r [ t o k e n [ i + j ] ] ) ;
  •            if ( n o d e = = n u l l p t r ) then         ▹ Create new node
  •                 n o d e = n e w n o d e _ t ;
  •            end if
  •         end for
  •     end for
  • end function
An example prefix tree node appears in Algorithm 1 as struct node_t. It holds the number of occurrences and an array of pointers to successor node_t nodes. Initially, the prefix tree consists of only a root node. When inserting an n-gram, a token may indicate an edge be taken to a successor which does not exist. In this case, a new node is created and a pointer to this node is inserted into the successor vector.
Comparing profiles utilizes next token probabilities. Computing next token probabilities requires only the information contained in prefix tree nodes. Information retrieval requires (1) navigation to node and (2) reading the successor vector. Navigation requires n lookup steps within the prefix tree for an n-gram. This is constant in the size of the profile—the number of n-grams within the profile set. Reading a successor vector of size m for | Σ | = m may require time proportional to m, which is also independent of profile size. Absence of a prefix tree path corresponding to an n-gram denotes its absence in the profile. This is a frequent case when comparing profiles. Path or n-gram absence can be determined in n steps.

5. Implementation

Section 4 describes the key data structures of n-grams and prefix trees. This section describes algorithms that utilize them for profile generation and profile matching. Software keyboard interactions generate data. Data tokenization converts it into an interaction token sequence. An n-gram model predicts next token probabilities given this sequence. Authentication uses a divergence metric to classify an unknown user interaction profile against a known user profile, where profiles constitute a set of n-grams.

5.1. Data

Software keyboard interactions result in data derived from user–application interactions. Each interaction creates a MotionEvent object in the Android framework. A MotionEvent object contains a variety of information about the touch event—pressure, ( x , y ) location of touch, and time—a subset of which is used in model generation.
MotionEvent touch pressure fidelity is device-dependent. Pressure value range and resolution vary. This variation might result from physical sensors or hardware drivers. Nexus 7 tablets, used in this work, provide high fidelity pressure measurements. Pressure ranges from 0.0 to 1.0 in steps of 0.096 .
We modified a software keyboard application to collect MotionEvent objects. Four users completed at least 5000 interactions on three Nexus 7 tablets. This gives us 12 distinct (user, device) ( U i , D j ) data sets. One additional user generated a similar data set on only one device, leading to an overall count of 13 distinct ( U i , D j ) data sets. Users played two typing games. One game from Google Play Store, Typeracer, provides random quotes from books and poems. It is designed for typing practice. In our context, this provides a diverse set of dictionaries for user profile generation, modeling multiple app experiences. A similar second game, Typing Champ, from Google Play Store was also used. However, it presents only single words from a dictionary rather than phrases as in Typeracer.

5.2. Profile Generation

5.2.1. Input Tokenization

The raw pressure values are more or less continuous, creating a large, sparse space of pressure tokens. It is unlikely that user behavior will repeat in this token space, generating exactly the same pressure value multiple times. Bucketing of pressure values into ranges makes it more likely that the user behavior will be repeatable. Moreover, it reduces the resource needs for a token-based model.
Tokens contain ( x , y ) location ranges to identify the spatial span of an individual key in the soft keyboard—Figure 3. Pressure ranges divide the pressure value associated with each location into a number of pressure intervals/ranges—each of these intervals results in a unique token T i . The set of pressure values associated with a location is captured as a probability distribution to identify pressure ranges for tokenization. T N tokens are created for pressure values at a specific key location ( x , y ) as follows. Only the pressure values in the range μ ± 2 σ are tokenized into valid tokens, where μ is the mean and σ is the standard deviation of the pressure values associated with this location. Ignoring pressure values below μ 2 σ and above μ + 2 σ excludes outliers, increasing reproducibility. Note that μ ± 2 σ contains 95.45 % of profile pressure values [38]. The tokenization intervals are chosen with a step size s σ where scales s = 0.5 , 1 , 1.5 , 2.0 have been explored. For a given scale s, intervals [ μ s σ , μ ) , [ μ , μ + s σ ) , [ μ 2 s σ , μ s σ ) , [ μ + s σ , μ + 2 s σ ) , are used for tokenization. For μ = 0.5 with σ = 0.1 and s = 1 , T N = 4 ranges [ 0.3 , 0.4 ) , [ 0.4 , 0.5 ) , [ 0.5 , 0.6 ) , and [ 0.6 , 0.7 ] are used to generate 4 possible token values T 0 , T 1 , T 2 , and T 3 . Figure 4 shows these tokenization ranges.
Tokenization maps raw MotionEvents to these model tokens.

5.2.2. n-Grams Are Token Sequences

Soft keyboard input tokenization produces a token sequence; n-grams are constructed from this. An ( n 1 ) -sized window slides along the input token sequence. The beginning and end indices increment for each n-gram. The first n-gram begins at token 1. For example, in Figure 5, for 3-gram generation, the 2-sized window spans the left-most two tokens “at”. This step will add 3-gram “at” to the prefix tree, as described in Figure 2 with a successor vector probability entry for transition to “e” assumed to be 0.5 . The second n-gram begins at token 2, which results in 3-gram “te” with a successor edge to “p”. Figure 5 demonstrates such n-gram generation.
When a pressure value outside the range μ ± 2 σ is encountered, we call it a “pressure break”. The assumption is that the same user is continuing to interact with the same app (context), but through some environmental disturbance, an unusual pressure value was input. In this case, only the abnormal token is dropped. Starting with the following token, a new token sequence belonging to the same context is assumed, which is parsed for new n-grams as in Figure 5.
We also consider the time stamp of each keyboard MotionEvent in a token sequence to decide if a “break” is needed. If the difference in the time stamps of two successive tokens exceeds a Time Threshold, we consider it a “time break”. Time Threshold is the maximum allowable time in between tokens belonging to the same context session. When a user takes a break from an app interaction, say, Gmail, and resumes the same app after some time exceeding Time Threshold, we start the token sequence parsing for n-grams as in Figure 5 anew. On the other hand, if the user resumes keyboard interaction with a different app, say, Chrome, after a time period larger than Time Threshold, we can associate the following token sequence with the new context (Chrome). Android contains APIs to extract the active task or activity ID to assign to the contexts. Note that we have not implemented multicontextual profiles, but it is feasible to do so. It may improve authentication accuracy.

5.2.3. Next Token Probabilities

In an n-gram, a token, T i + n 1 , succeeds the first ( n 1 ) token window W i , i + n 2 = T i T i + 1 T i + n 2 . Token sequence T i T i + 1 T i + n 2 occurs O C C ( T i T i + 1 T i + n 2 ) times. Next token probability for T i + n 1 occurring after W i , i + n 2 is P ( T i + n 1 | W i , i + n 2 ) ; this is the number of occurrences of T i + n 1 after W i , i + n 2 is divided by O C C ( W i , i + n 2 ) . Figure 2 computes the probability vector from the successor count vector using Equation (1).
P ( T i + n 1 | W i , i + n 2 ) = O C C ( W i , i + n 2 T i + n 1 ) O C C ( W i , i + n 2 ) = O C C ( T i T i + 1 T i + n 2 T i + n 1 ) O C C ( T i T i + 1 T i + n 2 ) .

5.3. Comparing Profiles—Divergence

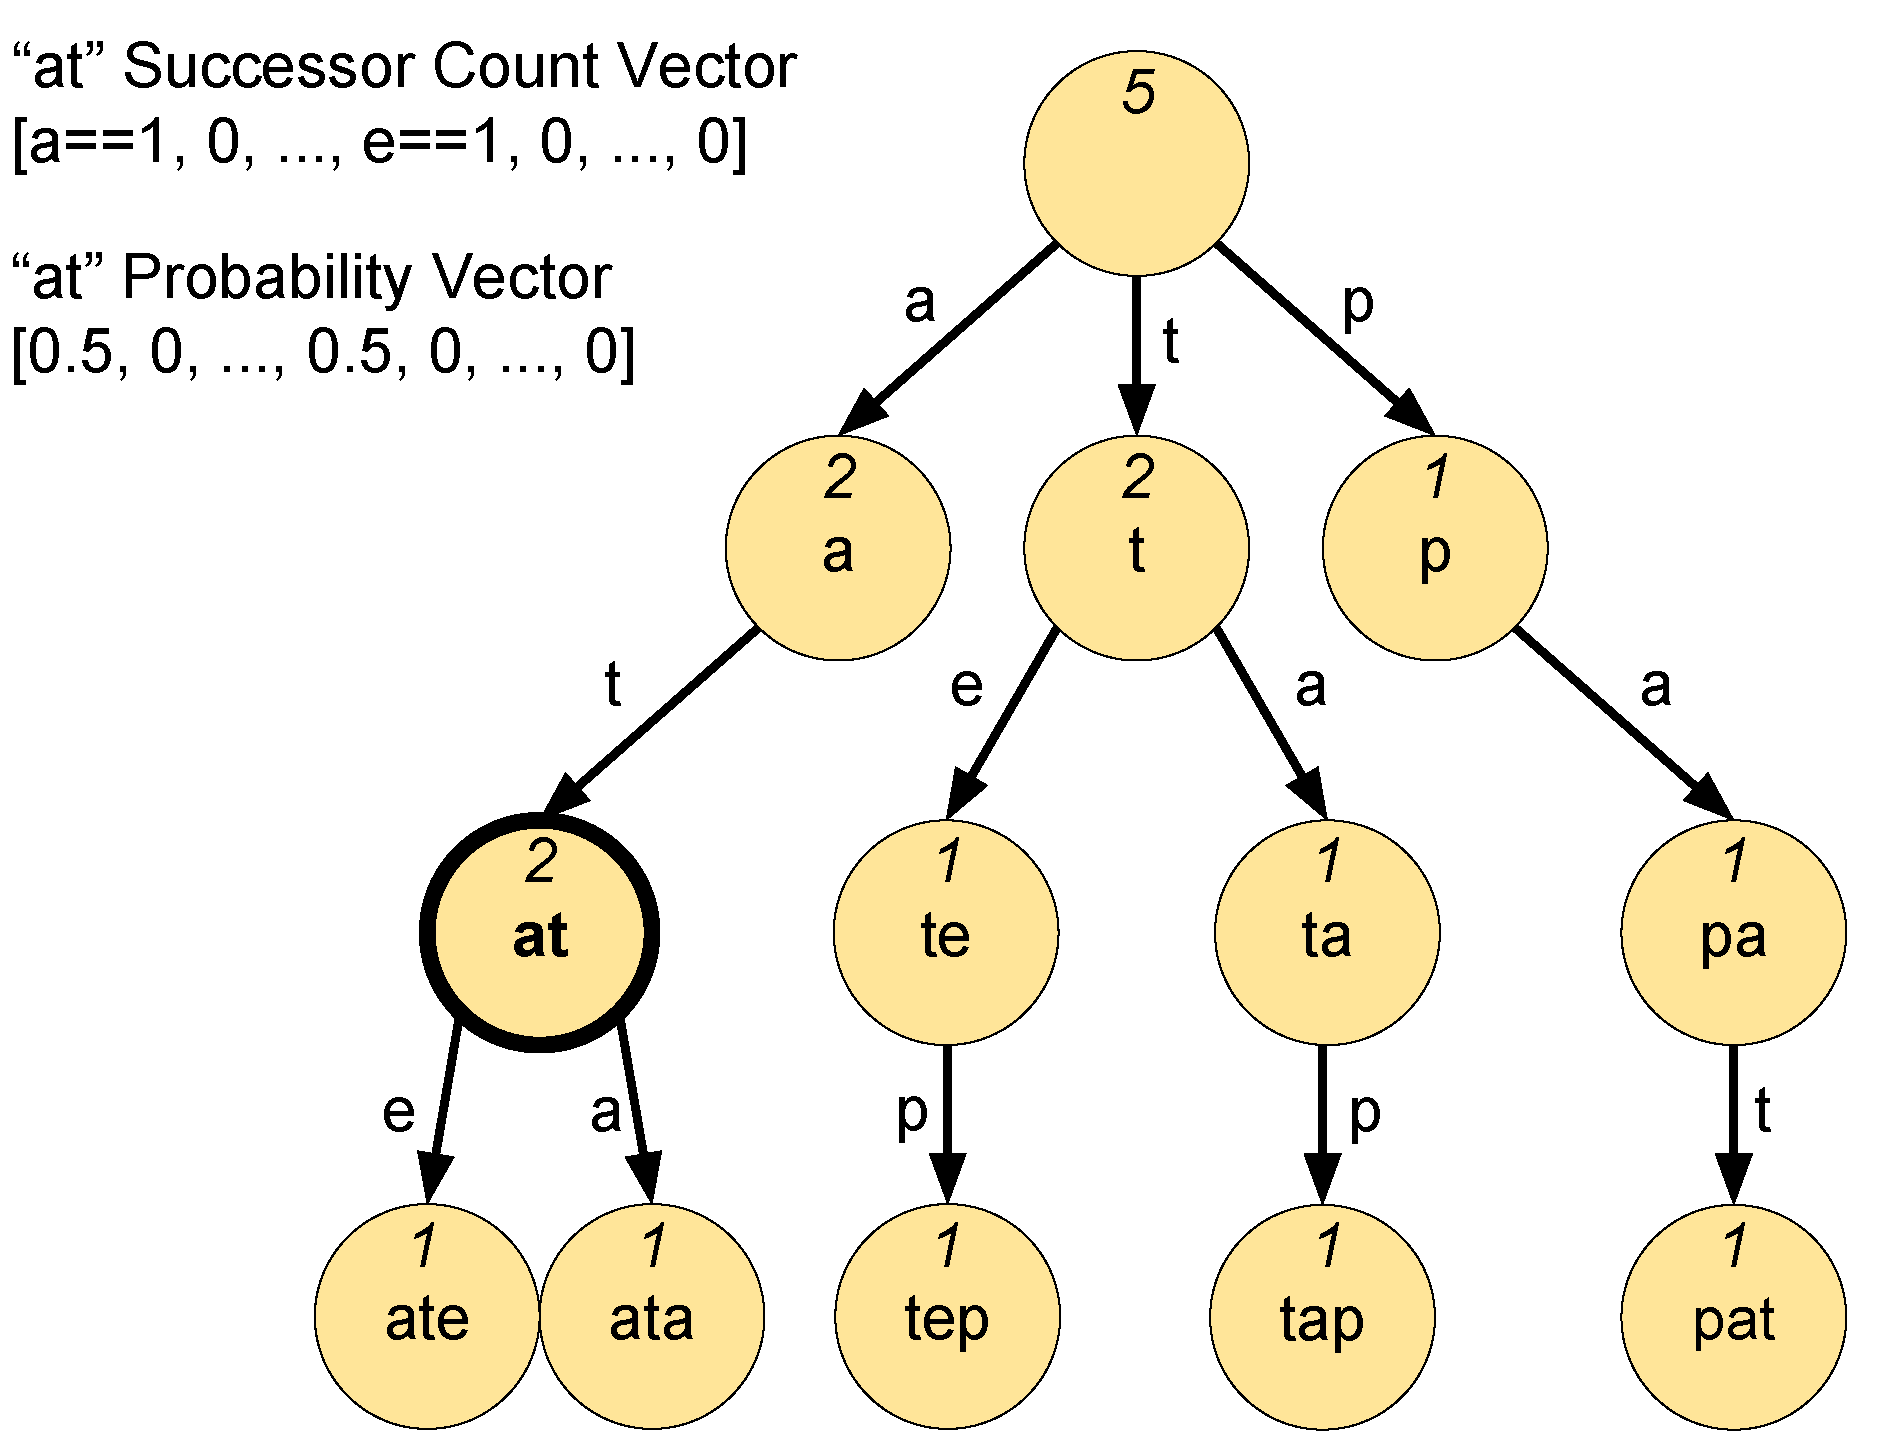
User profiles are sets of n-grams with frequency vectors. An n-gram N G consists of a window of ( n 1 ) token sequence W along with a successor frequency vector v represented as N G ( W , v ) . The successor frequency vector captures the transition frequency from W to all possible tokens in the token alphabet Σ —the result of tokenization described earlier. N G . W ( N G . v ) refers to the window (vector) component of the n-gram N G . An n-gram N G i P . W occurs with frequency f i P in a user profile P = { ( N G 0 P , f 0 P ) , ( N G 1 P , f 1 P ) , , ( N G k P , f k P ) } computed as O C C ( N G i P . W ) / | P | . Equation (2) defines a profile divergence; it is a weighted sum of next token probability differences.
D p r o f i l e ( B , P ) is the divergence between profiles B and P, or more accurately, divergence of B from P.
D n g r a m ( N G 1 , N G 2 ) is the divergence between n-grams N G 1 = ( W 1 , v 1 ) and N G 2 = ( W 2 , v 2 ) .
We define a search function N G ( P , W ) to denote the n-gram with window W in profile P. If an n-gram with window W does not exist in profile P, this function returns a null n-gram with vector v = [ 0 , 0 , , 0 ] .
Interaction profile B is authenticated against user profile P. An interaction profile B is generated from a set of recent keyboard transaction touch events. A user profile P is a model of a user’s touch keyboard interactions. For each n-gram N G i B in B, D p r o f i l e takes the divergence between N G i B and its twin n-gram in profile P given by N G ( P , N G i B . W ) . This divergence between n-grams, D n g r a m ( N G i B , N G ( P , N G i B . W ) ) , is further weighted by the frequency of N G i B . W in B. Note that this weight selection from profile B makes this divergence metric asymmetric.
D n g r a m ( N G 1 , N G 2 ) computes the divergence over all transitions or entries in the vector N G 1 . v , which is computed as absolute value | ( N G 1 . v [ i ] N G 2 . v [ i ] ) | which is further weighted by the frequency of the transition on token T i leading to | ( N G 1 . v [ i ] N G 2 . v [ i ] ) | N G 1 . v [ i ] . This expression is summed up over each token T i Σ .
D p r o f i l e ( B , P ) = Σ i = 0 | B | 1 D n g r a m ( N G i B , N G ( P , N G i B . W ) ) f i B D n g r a m ( N G 1 , N G 2 ) = Σ i = 0 | Σ | 1 N G 1 . v [ i ] N G 2 . v [ i ] N G 1 . v [ i ] .
The divergence ranges from 0.0 to 1.0 ; it describes how much the interaction profile B deviates or diverges from user profile P. D p r o f i l e = 0.0 is maximally close.
Order matters— D p r o f i l e ( P , B ) D p r o f i l e ( B , P ) . The former compares n-grams in a user profile P to equivalent n-grams in an interaction profile B, whereas the latter compares an interaction profile B against a user profile P. Note that each summand in the divergence computation is multiplied by the frequency of that N G in the first argument profile of D. If a given n-gram N G is not in the first argument profile, its frequency is zero. Hence, regardless of the frequency of that N G in the second argument profile, it will be suppressed, not counted, in the divergence computation. A side-effect of this usually is that many n-grams in a user profile do not contribute to the divergence for the following reason. Usually the user profile would contain many more n-grams than an interaction profile, since a user profile is built over multiple contexts and sessions, whereas an interaction profile is typically from a single session.
Note that our divergence definition is based on the notion of statistical divergence between two probability distributions on the same probability space X . Kullback–Leibler divergence [39] is a good example of this concept. For two discrete probability distributions P ( x ) , Q ( x ) , Kullback–Leibler divergence is defined as D K L ( P , Q ) = x X p ( x ) log P ( x ) Q ( x ) . There is a similar definition with an integral for continuous probability distributions. Note that since this is a weighted sum with p ( x ) ; it is asymmetric. This also motivates our use of f i B weight in Equation (2). In addition, note that in computing P’s divergence from Q, if p ( x ) is zero for some probability space element x, the corresponding element x in Q ( x ) , even with q ( x ) > 0 , is not counted. This is akin to not counting the n-grams in user profile P if the corresponding n-gram does not exist in the interaction profile B.
Figure 6 computes D p r o f i l e ( B , P ) . The left side of the figure shows 3-grams in a user profile P. The right side shows 3-grams from an interaction profile B. For this example, Σ = { t 0 , t 1 , t 2 } . The top left 3-gram N G 0 P in user profile P has a window N G 0 P . W = t 0 t 1 with a successor vector N G 0 P . v [ ] . Similarly, the 3-gram N G 0 B in the top right of the figure from the interaction profile B has the same window N G 0 B . W = t 0 t 1 and a successor vector N G 0 B . v [ ] . Hence, in the divergence computation for D p r o f i l e ( B , P ) , there will be a term for D n g r a m ( N G 0 B , N G 0 P ) . That term expands into difference terms by each successor token, resulting in Axis-0 difference term | ( N G 0 P . v [ 0 ] N G 0 B . v [ 0 ] ) | . However, this difference is further weighted by the probability of Axis-0 in the interaction profile B’s successor vector captured by N G 0 B . v [ 0 ] . This leads to the weighted Axis-0 difference term ( | ( N G 0 P . v [ 0 ] N G 0 B . v [ 0 ] ) | ) N G 0 B . v [ 0 ] . This results in the weighted average difference of ( | ( N G 0 P . v [ 0 ] N G 0 B . v [ 0 ] ) | ) N G 0 B . v [ 0 ] + ( | ( N G 0 P . v [ 1 ] N G 0 B . v [ 1 ] ) | ) N G 0 B . v [ 1 ] + ( | ( N G 0 P . v [ 2 ] N G 0 B . v [ 2 ] ) | ) N G 0 B . v [ 2 ] . However, this term is further weighted by the frequency of window t 0 t 1 in the interaction profile B. If t 0 follows t 0 t 1 in the interaction strings for c 0 times, t 1 follows t 0 t 1 in the interaction strings for c 1 times, and t 2 follows t 0 t 1 in the interaction strings for B c 2 times, the total count of W = t 0 t 1 occurrences is O C C ( t 0 t 1 ) = c 0 + c 1 + c 2 . The relative frequency of N G 0 B . t 0 t 1 in B is f 0 B = O C C ( t 0 t 1 ) / ( O C C ( t 0 t 1 ) + O C C ( t 1 t 2 ) . This will lead to the term [ ( | ( N G 0 P . v [ 0 ] N G 0 B . v [ 0 ] ) | ) N G 0 B . v [ 0 ] + ( | ( N G 0 P . v [ 1 ] N G 0 B . v [ 1 ] ) | ) N G 0 B . v [ 1 ] + ( | ( N G 0 P . v [ 2 ] N G 0 B . v [ 2 ] ) | ) N G 0 B . v [ 2 ] ] f 0 B .
The computation excludes the 3-gram N G 1 P in P from this divergence computation since the corresponding 3-gram window t 0 t 2 does not exist in the interaction profile B. This demonstrates profile divergence computation asymmetry.
Authentication, A U T H ( B , P ) , compares an interaction profile B against a user profile P. Authentication compares D p r o f i l e ( B , P ) against a threshold profile divergence value.
A U T H ( B , P ) = 1 D p r o f i l e ( B , P ) > t h r e s h o l d .

5.4. Authentication Model Parameters

Our authentication model consists of user and interaction profiles, which contain n-grams, and n-grams depend on token sequences, whose lengths depend on various parameters. The token sequences themselves are affected by tokenization parameters such as number of pressure steps within μ ± 2 σ . The profile divergences are compared against a threshold. This illustrates the richness of the parametrization space. Table 1 enumerates these parameters. Section 6 discusses parameter tuning. Authentication accuracy and computation overhead depend strongly on parameter tuning.

5.5. Comparing Profiles—Machine Learning

Machine learning provides an alternative profile comparison method to the divergence measure. It uses a set of features to predict a class. Training a machine learning classifier involves providing a set of feature vectors with known classes for supervised learning. Unsupervised learning techniques do not use class labels. Instead, they create clusters of associated feature vectors. We use supervised machine learning classification schemes.
Raw (location, pressure) data are mapped to machine learning features using a z-sequence scheme. Raw input sequences are parsed into all z-sized subsequences—similar to the n-gram sliding window. Z i is the ith raw data sequence element having location ( Z i . l ) and pressure ( Z i . p ) values. A 1-sequence provides the machine learning classifier with features ( Z i . l , Z i . p ) and a class that is the combined user–device identity similar to user profile P. The 2-sequence features are ( Z 0 . l , Z 0 . p , Z 1 . l , Z 1 . p ). Likewise, z-sequence features are ( Z 0 . l , Z 0 . p , Z 1 . l , Z 1 . p , …, Z z 1 . l , Z z 1 . p ). Providing a z-sequence allows machine learning classifiers to make predictions based on input token sequences.
Our divergence measure utilizes statistical techniques to map pressure values to tokens. Following this, probabilities for each n-gram and each token succeeding that n-gram window are computed. Analogous tokenized data are provided to machine learning classifiers for a fair comparison against our divergence metric. We employ a second z-sequence scheme with raw pressure values transformed into token indexes. These token indexes correspond to the μ ± 2 σ range containing the pressure value. These ranges are discussed in Section 5. In another scheme, we provide the machine learning classifier with n-gram frequency and successor vector as well. Table 2 summarizes these schemes.

5.6. Android Incorporation

In an Android implementation, a background service collects the soft keyboard MotionEvent object stream. A profile is established over time. New input is compared to the existing profile; this happens periodically. An interaction profile that successfully authenticates is set aside for later incorporation into the corresponding user profile. A rejected interaction profile is discarded. Such incremental profile updates converge towards a more robust user profile. Unsuccessful authentications lead to more intrusive authentication methods such as password entry.
Initially, when this continuous authentication framework is adopted, the size of profile-building data is small. This leads to low authentication accuracy in the beginning, which does not add much to the system security. In this mode, the system frequently falls back to password authentication. The authentication accuracy and derived security increase over time, given more interaction data.

6. Results

A user profile is generated from touchscreen pressure token sequences. The size of this token sequence and the value of n in n-grams used in the profile have a significant bearing on the authentication accuracy. Parametrized profile space exploration is performed to maximize the authentication accuracy from the resulting profiles. An interaction input token sequence is also reduced to an n-gram set for authentication against a user profile. A parametrization space, similar to the user profile generation parametrization space, exists for this step as well.
Authentication accuracy is quantified as false negative rate ( F N R ) and false positive rate ( F P R ). FPR is the number of interaction profiles incorrectly classified as the targeted user divided by the the number of attempted nonuser interaction profiles. F P R quantifies illegitimate user access frequency. F N R is the number of interaction profiles incorrectly classified as not the targeted user divided by the the number of attempted user interaction profiles. FNR quantifies legitimate user access denial. Authentication computation times on Nexus 7 tablets are provided. Authentication accuracy and computation time are positively correlated. Reducing computation time reduces accuracy. Our parametric space is rich enough to allow an exploration of a broad range of values for (authentication accuracy, computation time).

6.1. Parameter Tuning

Parameter tuning maximizes authentication accuracy. Note, however, that increased accuracy comes at a cost of increased computation overhead. Varying one parameter while holding others constant generates locally optimal values. Figure 7 provides locally optimal values to maximize authentication accuracy, which minimizes F P R + F N R . Testing all parameter combinations in a range around locally optimal values generates globally optimal values. Globally optimal values, shown in Table 3, occur when all ϵ -neighborhood perturbations around a local optimum provide a negligible increase to authentication accuracy. Total Model Size is most strongly correlated with authentication accuracy; Figure 10 provides this relationship; 100 % accuracy is achieved at 12,800 interactions. Note that all of the points in Figure 10 are above the line y = x , establishing a monotonically increasing dependence of accuracy on Total Model Size as long as relative ratio of b a s e m o d e l s i z e and a u t h m o d e l s i z e is maintained constant. Accuracy does not always increase with Total Model Size, particularly with varying b a s e m o d e l s i z e to a u t h m o d e l s i z e ratios. Lower accuracies also occur when User Model Size or Auth Model Size is small, 400 to 800 interactions. At least 1600 profile interactions and 1600 observed input interactions provide consistent accuracies. Authentication accuracy declines at Time Threshold  1000 ; no change exists at Time Threshold  1000 . Note that an inactivity period longer than Time Threshold results in a time break. TN = 2 maximizes authentication accuracy. The pressure range μ ± 2 σ is divided into T N tokens.
Ideal Authentication Threshold varies based on system constraints. Adjusting Authentication Threshold determines F N R and F P R . F N R = F P R at Authentication Threshold  0.88 , which determines the equal error rate (EER) point for authentication accuracy. This provides a balance between rejecting authentic users and accepting inauthentic users. Decreasing Authentication Threshold increases false accepts ( F P R ) and decreases false rejects ( F N R ). Increasing Authentication Threshold increases false rejects ( F N R ) and decreases false accepts ( F P R ). Figure 8 shows the F P R vs. F N R tradeoff.
Globally optimal Window Size for n-grams is 1. The previous interaction most accurately predicts the next interaction. This seems to indicate that the transition probability vector is a better user–device indicator than the context given by the n-gram. Multiple mobile applications create varying input contexts. Users may adopt different language use patterns in each context. This may increase same-user variability of n-grams for n > 1 . Alternatively, 3-grams may become more predictive given more data. The set of possible 3-grams is larger than the set of possible 2-grams. Perhaps user input and profile have insufficient overlapping 3-grams for reliable comparison.
Figure 8. F N R vs. F P R for four configurations: (same user, same device), (same user, diff device), (diff user, same device), and (diff user, diff device). Total Model Size is fixed at 4800. Authentication Threshold is varied to achieve variable authentication accuracy. Aggregate accuracy across all configurations is 89.04 % . Points closest to the bottom left represent lowest error.
Cryptography 06 00014 g008
Globally optimal TN is 2. The μ ± 2 σ pressure range for each location is divided in half, dividing each location into two distinct tokens. This is more predictive than each location mapping to one token—making it relatively independent of pressure. Thus, pressure sensitivity increases accuracy.

6.2. Authentication

For authentication purposes, the goal of an adversary is to obtain a specific, falsely authenticated ( U i , D j ) profile. There are three attack vectors to accomplish this: (1) (same user, different device) configuration: an adversary is able to obtain the targeted user’s profile from a different device and wishes to pass it off as a ( U i , D j ) profile on device D j . (2) (different user, same device) configuration: an adversary has access to the targeted device D j but wishes to pass off a ( U i , D j ) profile as a ( U i , D j ) profile on device D j . (3) (different user, different device) configuration: the adversary has access to only a different device D j to be able to generate a ( U i , D j ) profile and then pass it off as a ( U i , D j ) profile on device D j .
Collectively, these three attack vectors define the attack surface for our adversary model, which we call (same user, same device) configuration. The goal of the adversary in this configuration is to misrepresent itself as a ( U i , D j ) profile through any of the three attack vectors. The (different user, same device) attack vector occurs more naturally in practice where the adversary shares access to the same device as the targeted user, and hence, it may have greatest practical significance. A thief attempting access to a stolen device exemplifies this scenario.

6.2.1. ROC: FPR, FNR, and Authentication Threshold Trade-Offs

False positive error rates can be traded for false negative error rates, which defines the operating characteristics of the authentication framework. For example, F P R indicates illegitimate user access frequency. Receiver Operating Characteristic (ROC) curves relate F P R and F N R error rates; these relations are interpreted as trade-offs in system behavior. Varying Authentication Threshold value provides a new ( F P R , F N R ) point along the ROC curve.
For each attack vector, the following describes the ( F P R , F N R ) point computation. Consider the (different user, same device) attack vector.
  • We start with multiple touch/token sequences for a user–device pair of length 30,000+, typically. These sequences are parsed into multiple user–device profiles of 2400 tokens each. Note that the raw data set of 30,000+ for ( U i , D j ) results in multiple 2400 token profiles for ( U i , D j ) . The total model size of 2400 was chosen for local optimality, as described later.
  • At this point, we have created many different profiles p l ( U i , D j ) for 0 l L . We compute pairwise profile divergences between these profiles as ( p l , p m , D p r o f i l e ( p l , p m ) ) tuples for all profile pairs ( p l , p m ) .
  • Given an Authentication Threshold, say 0.1 , to determine F P R we look for those tuples ( p l , p m , D p r o f i l e ( p l , p m ) ) , where D p r o f i l e ( p l , p m ) 0.1 , the Authentication Threshold, p l . u s e r p m . u s e r , and p l . d e v i c e = = p m . d e v i c e , where p . u s e r and p . d e v i c e indicate the user or device parameter of a profile p. Note that ( D p r o f i l e ( p l , p m ) 0.1 ) ( p l . u s e r p m . u s e r ) ( p l . d e v i c e = = p m . d e v i c e ) equals 1 if all the three Boolean conditions are satisfied and 0 otherwise. With this, F P R = l , m ( ( D p r o f i l e ( p l , p m ) 0.1 ) ( p l . u s e r p m . u s e r ) ( p l . d e v i c e = = p m . d e v i c e ) ) / l , m ( ( p l . u s e r p m . u s e r ) ( p l . d e v i c e = = p m . d e v i c e ) ) .
  • Similarly, to define F N R , we look for tuples ( p l , p m , D p r o f i l e ( p l , p m ) ) with matching user and device that have profile divergence greater than the Authentication Threshold and hence are falsely rejected. F N R = l , m ( ( D p r o f i l e ( p l , p m ) > 0.1 ) ( p l . u s e r = = p m . u s e r ) ( p l . d e v i c e = = p m . d e v i c e ) ) / l , m ( ( p l . u s e r p m . u s e r ) ( p l . d e v i c e = = p m . d e v i c e ) ) .
Authentication Threshold is varied in the range [ 0 , 1 ] to generate the four ROC curves in Figure 8. The curves represent the error rate F P R + F N R as Authentication Threshold is varied. The conditions to capture each attack vector change. For (different user, different device), we use ( ( p l . u s e r p m . u s e r ) ( p l . d e v i c e p m . d e v i c e ) ) . (same user, different device) is captured with ( ( p l . u s e r = = p m . u s e r ) ( p l . d e v i c e p m . d e v i c e ) ) . Note that the attack surface (same user, same device) configuration curve can be derived with ( ( p l . u s e r = = p m . u s e r ) ( p l . d e v i c e = = p m . d e v i c e ) ) . D p r o f i l e should be lowest for the (same user, same device) configuration among all four configurations. This implies that the (same user, same device) configuration D p r o f i l e forms a lower bound on Authentication Threshold to differentiate a (same user, same device) profile from another user or another device configuration. The (same user, same device) configuration curve compares the (same user, same device) configuration against all other configurations.
F N R and F P R error rates are quantified in Figure 8. It provides four configuration ROC curves, one for each configuration. The Total Model Size, sum of interaction and user profile sizes, is fixed at 4800. A relatively small Total Model Size is chosen to illustrate differing performance across configurations. At larger Total Model Size values, all curves approach 0 % error. In Figure 8, a curve closer to the origin minimizes the error rate F P R + F N R and hence maximizes the authentication accuracy. The (different user, different device) configuration has the highest accuracy. It indicates the profile difference metric is a function of both user and device uniqueness. This confirms that user and device characteristics both contribute to the profile divergence computation. The (different user, same device) configuration has lowest error rate. The (same user, same device) configuration curve illustrates the ability to differentiate a (same user, same device) profile from interactions arising from any other configuration. Aggregate accuracy across all configurations is 89.04 % , as indicated in Figure 8 by the labeled point on the (same user, same device) configuration curve. All the other curves also show the point that maximizes accuracy for that configuration.

6.2.2. Machine Learning

Recall that we perform machine learning with (1) raw (location, pressure) data (2) raw (location, tokenized pressure) data, and (3) n-grams including the n-gram frequency and successor vector data.
Raw (location, pressure) input sequences of length 1000 are taken from 13 user–device configurations. This provides 13,000 total interactions on which to perform classification. The same machine learning accuracy values are displayed in both Table 4 and Figure 9. These values are estimated using k-fold cross validation. We use k = 10 folds, splitting the data into 10 subsets. Each subset is held out in turn while a classifier is trained with the remaining subsets. Each classification is equally represented in each fold. Accuracy estimates are derived by predicting the classifications of the data in the held-out subset. The accuracy estimates for each subset are averaged to produce the values in Table 4. We are using 10-fold cross validation on a data set of 13,000 interactions. This results in 11,700 interactions in the training set and 1300 held out for classification.
Raw z-sequence, token z-sequence, and successor vector schemes are evaluated for a Support Vector Machine (SVM) with linear, radial, and polynomial kernels. Token z-sequence data use T N = 2 as a model parameter. Successor vector data use model parameter values: n = 1 , T N = 2 , U s e r M o d e l S i z e = 3200 , and A u t h M o d e l S i z e = 3200 . Note that accuracy increases with increasing z values with significant improvements at z 496 . The token z-sequence accuracies are worse than that of the raw z-sequence for comparable z across all classifiers. Hence, we do not consider token z-sequence dependence on large z values. We experiment with large z values only for raw z-sequence data. Raw z-sequence accuracies reach 100 % at z = 1000 . Increasing z beyond this point can yield minimal further increase in accuracy. Therefore, we do not evaluate larger z values. The accuracy of token z-sequence and successor vector approaches is, in general, poor, perhaps because machine learning is unable to distill differentiating features from these data sets.

6.3. Computation Time

An Android program evaluates authentication time on a Nexus 7 tablet. Computation time increases with Total Model Size according to Equation (4). Figure 10 provides authentication accuracy given Total Model Size. Together they elucidate the trade-off between Total Model Size and computation time. Computations require 1 second per 3333.33 touch interactions for our data sets, on average. Accuracy of 80 % is achievable in under 2 s of authentication time, 90 % in under 3 s, and 100 % in under 4 s. This implies that model learning is very quick and deployable almost in real time.
m i l l i s e c o n d s = ( 0.3 ) ( T o t a l M o d e l S i z e ) + 1 3
Figure 10. Authentication accuracy depends on the number of touchscreen interactions. Total Model Size is b a s e m o d e l s i z e + a u t h m o d e l s i z e .
Cryptography 06 00014 g010
Machine learning requires time for training and classification. Training time is how long it takes to train a classifier. There are 11,700 touch interactions in the training set. Classification time is how long it takes to classify one feature vector. The classification times given in Table 5 are derived by averaging classification time for a single feature vector over 20 classifications.
Machine learning performs poorly in computation time relative to our divergence metric. The SVM with a linear kernel requires 2563.369 s for training and 2.132 s for classification on a desktop to achieve 100 % classification accuracy. However, our divergence metric requires < 4 s to perform both training and classification on a Nexus 7 tablet. Machine learning is especially infeasible when online training of the biometric model is desirable to keep up with recent user interactions. Note that there are other machine learning techniques that will have lower training time than SVM. However, more often than not, lower training time is traded for lower classification accuracy. Data set complexity makes organizing raw data into feature sets computationally expensive, and without the additional features identified by us, classifications are expensive and difficult.
Machine learning classification uses a feature vector. The relative input token ordering is a robust user characteristic which is difficult to capture using this data representation. In light of this, the value of our divergence computation is further highlighted. It provides an approach for a problem without an easy machine-learning-based solution.

6.4. Some Observations

Summary observations on the results include the following.
  • Given the simplicity of the profile divergence method and fairly similar accuracy levels of the profile divergence threshold and machine learning, we recommend the profile divergence method.
  • We recommend a model size of 2400 tokens. Note that the period of authentication is elongated for larger model sizes since the authentication system has to wait for that many tokens to accumulate followed by an authentication step. Larger models may lead to marginally better accuracy. We believe a size of 2400 tokens provides a good balance. Assuming an average interaction rate of 100 interactions per minute for a game-like environment, it will take 24 minutes to collect sufficiently many tokens to authenticate. This is in contrast to [25], where continuous authentication was performed with each keyboard and mouse interaction. A 24-minute authentication period is continuous authentication in the context of single-shot authentication models.
  • Raw touch event data have user- and device-level variability for PUF-like characteristics. In order to retain the raw variability, the touch pressure data should be discretized into small granularity tokens. This increases the model and profile size. A larger model is needed to observe repeatable user behavior at this granularity. Profile size increases due to increased alphabet size. This work evaluated 3-step tokenization. Given that our evaluation of 13 user–device data sets broken down into hundreds of user–device interaction sets could be differentiated both on user and device axes, we do believe that some elements of PUF properties have persisted. However, a demonstration of PUF characteristics is not conclusive.

7. Conclusions

Protecting the authenticated mobile device state requires continuous security measures. Inauthentic users on an authenticated device should have restricted access. A continuous biometric mobile device authentication scheme is proposed to achieve this access control. Soft keyboard interactions provide biometric data. Profiles are n-gram sets that are stored as a prefix tree. A prefix tree reduces profile size and accelerates computation.
A mobile device environment provides additional challenges. Energy and computation are limited; minimal security overhead is valuable. Our n-gram and prefix tree data structures decrease overhead. User convenience is paramount; requiring explicit user action for authentication sharply degrades the user experience. Continuously authenticating in the background maximizes convenience for a transparent authentication.
Recent user input interactions are compared against existing profiles. Classification achieves 100% accuracy in 2132 milliseconds on Nexus 7 tablets.
Future enhancements to this framework could exploit available machine learning accelerators on modern mobile devices to explore deep-learning-based authentication. Another interesting direction could be to establish orthogonality of various biometric features, such as gait, touchscreen pressure, or facial feature set. Do they collectively enhance the authentication accuracy, either due to disjoint use cases or disjoint feature sets, or are they extremely correlated?

Author Contributions

Project is overseen by A.T. Manuscript Writing: T.D. and A.T.; Data Collection: T.D. and I.R.; Approach Evaluation Scripts: T.D. and I.R.; Data Analysis Scripts: T.D.; Markov Chain Library: T.D.; Android Applications: T.D. and I.R. All authors have read and agreed to the published version of the manuscript.

Funding

This project was supported by the Dept. of Homeland Security, Science and Technology Directorate under Contract # Dl 5PC00158 and by NSF Grant CNS 1441640. Study design, data collection, data analysis, interpretation of data, and manuscript writing occurred independent of the funding agency.

Conflicts of Interest

The authors declare no conflict of interest.

Abbreviations

The following abbreviations are used in this manuscript:
EEREqual Error Rate
FNRFalse Negative Rate
FPRFalse Positive Rate
PUFPhysical Unclonable Function
ROCReceiver Operating Characteristic
SVMSupport Vector Machine
UD-PUFUser–Device Physical Unclonable Function

References

  1. Walker, G. A review of technologies for sensing contact location on the surface of a display. J. Soc. Inf. Disp. 2012, 20, 413–440. [Google Scholar] [CrossRef]
  2. Schaub, F.; Deyhle, R.; Weber, M. Password entry usability and shoulder surfing susceptibility on different smartphone platforms. In Proceedings of the 11th International Conference on Mobile and Ubiquitous Multimedia, Ulm, Germany, 4–6 December 2012; p. 13. [Google Scholar]
  3. Hafiz, M.D.; Abdullah, A.H.; Ithnin, N.; Mammi, H.K. Towards identifying usability and security features of graphical password in knowledge based authentication technique. In Proceedings of the 2008 Second Asia International Conference on Modelling & Simulation (AMS), Kuala Lumpur, Malaysia, 13–15 May 2008; pp. 396–403. [Google Scholar]
  4. Aviv, A.J.; Gibson, K.; Mossop, E.; Blaze, M.; Smith, J.M. Smudge Attacks on Smartphone Touch Screens. WOOT 2010, 10, 1–7. [Google Scholar]
  5. Harbach, M.; von Zezschwitz, E.; Fichtner, A.; De Luca, A.; Smith, M. It’sa hard lock life: A field study of smartphone (un) locking behavior and risk perception. In Proceedings of the Symposium On Usable Privacy and Security (SOUPS 14), Menlo Park, CA, USA, 9–11 July 2014; pp. 213–230. [Google Scholar]
  6. De Freitas Pereira, T.; Anjos, A.; De Martino, J.M.; Marcel, S. Can face anti-spoofing countermeasures work in a real world scenario? In Proceedings of the 2013 International Conference on Biometrics (ICB), Madrid, Spain, 4–7 June 2013; pp. 1–8. [Google Scholar]
  7. Hadid, A. Face biometrics under spoofing attacks: Vulnerabilities, countermeasures, open issues, and research directions. In Proceedings of the IEEE Conference on Computer Vision and Pattern Recognition Workshops, Columbus, OH, USA, 23–28 June 2014; pp. 113–118. [Google Scholar]
  8. McCool, C.; Marcel, S. Parts-based face verification using local frequency bands. In Advances in Biometrics; Springer: Berlin/Heidelberg, Germany, 2009; pp. 259–268. [Google Scholar]
  9. Cao, K.; Jain, A.K. Hacking Mobile Phones Using 2D Printed Fingerprints; Technical Report; Computer Science and Engineering, MSU-CSE-16-2; Michigan State University: East Lansing, MI, USA, 2016. [Google Scholar]
  10. Chaos Computer Club. Instructions Detailing How to Create Fake Finger Prints Capable of Passing Finger Print Scanner Authentication, October 2004, Chaos Computer Club. Available online: http://dasalte.ccc.de/biometrie/fingerabdruck_kopieren.en (accessed on 9 April 2016).
  11. Rosenfeld, K.; Gavas, E.; Karri, R. Sensor physical unclonable functions. In Proceedings of the IEEE International Symposium on Hardware-Oriented Security and Trust (HOST), Anaheim, CA, USA, 13–14 June 2010; pp. 112–117. [Google Scholar]
  12. Scheel, R.; Tyagi, A. Characterizing Composite User-Device Touchscreen Physical Unclonable Functions (PUFs) for Mobile Device Authentication. In Proceedings of the ACM International Workshop in Trusted Embedded Devices, TRUSTED 15, Denver, CO, USA, 16 October 2015. [Google Scholar]
  13. (NIAP), N.I.A.P. Protection Profile for Mobile Device Fundamentals, v3.1, 2017-04-05. Available online: https://www.niap-ccevs.org/MMO/PP/-417-/ (accessed on 12 June 2018).
  14. Ratha, N.K.; Connell, J.H.; Bolle, R.M. Enhancing Security and Privacy in Biometrics-based Authentication Systems. IBM Syst. J. 2001, 40, 614–634. [Google Scholar] [CrossRef]
  15. Syed, Z.; Banerjee, S.; Cukic, B. Leveraging Variations in Event Sequences in Keystroke-Dynamics Authentication Systems. In Proceedings of the Ninth IEEE International Symposium on High-Assurance Systems Engineering (HASE’05), Miami Beach, FL, USA, 9–11 January 2014; pp. 9–16. [Google Scholar] [CrossRef]
  16. Liu, J.; Zhong, L.; Wickramasuriya, J.; Vasudevan, V. uWave: Accelerometer-based Personalized Gesture Recognition and Its Applications. Pervasive Mob. Comput. 2009, 5, 657–675. [Google Scholar] [CrossRef]
  17. Aysu, A.; Ghalaty, N.F.; Franklin, Z.; Yali, M.P.; Schaumont, P. Digital Fingerprints for Low-cost Platforms Using MEMS Sensors. In Proceedings of the Workshop on Embedded Systems Security; WESS’13; ACM: New York, NY, USA, 2013; pp. 1–6. [Google Scholar] [CrossRef]
  18. Choi, S.; Youn, I.H.; LeMay, R.; Burns, S.; Youn, J.H. Biometric gait recognition based on wireless acceleration sensor using k-nearest neighbor classification. In Proceedings of the International Conference on Computing, Networking and Communications (ICNC), Honolulu, HI, USA, 3–6 February 2014; pp. 1091–1095. [Google Scholar] [CrossRef]
  19. Feng, T.; Yang, J.; Yan, Z.; Tapia, E.M.; Shi, W. Tips: Context-aware implicit user identification using touch screen in uncontrolled environments. In Proceedings of the 15th Workshop on Mobile Computing Systems and Applications, Santa Barbara, CA, USA, 26–27 February 2014; p. 9. [Google Scholar]
  20. Feng, T.; Liu, Z.; Kwon, K.A.; Shi, W.; Carbunar, B.; Jiang, Y.; Nguyen, N. Continuous mobile authentication using touchscreen gestures. In Proceedings of the IEEE Conference on Technologies for Homeland Security (HST), Waltham, MA, USA, 13–15 November 2012; pp. 451–456. [Google Scholar] [CrossRef] [Green Version]
  21. Sae-Bae, N.; Memon, N.; Isbister, K.; Ahmed, K. Multitouch Gesture-Based Authentication. Inf. Forensics Secur. IEEE Trans. 2014, 9, 568–582. [Google Scholar] [CrossRef]
  22. Dey, S.; Roy, N.; Xu, W.; Nelakuditi, S. ACM HotMobile 2013 Poster: Leveraging Imperfections of Sensors for Fingerprinting Smartphones. SIGMOBILE Mob. Comput. Commun. Rev. 2013, 17, 21–22. [Google Scholar] [CrossRef]
  23. Banerjee, S.P.; Woodard, D.L. Biometric authentication and identification using keystroke dynamics: A survey. J. Pattern Recognit. Res. 2012, 7, 116–139. [Google Scholar] [CrossRef] [Green Version]
  24. Patel, V.M.; Chellappa, R.; Chandra, D.; Barbello, B. Continuous user authentication on mobile devices: Recent progress and remaining challenges. IEEE Signal Process. Mag. 2016, 33, 49–61. [Google Scholar] [CrossRef]
  25. Mondal, S.; Bours, P. A study on continuous authentication using a combination of keystroke and mouse biometrics. Neurocomputing 2017, 230, 1–22. [Google Scholar] [CrossRef]
  26. Zhang, J.; Wang, X.; Wu, P.; Zhu, J. SenSec: Mobile security through passive sensing. In Proceedings of the International Conference on Computing, Networking and Communications (ICNC), San Diego, CA, USA, 28–31 January 2013; pp. 1128–1133. [Google Scholar] [CrossRef]
  27. Frank, M.; Biedert, R.; Ma, E.D.; Martinovic, I.; Song, D. Touchalytics: On the applicability of touchscreen input as a behavioral biometric for continuous authentication. Inf. Forensics Secur. IEEE Trans. 2013, 8, 136–148. [Google Scholar] [CrossRef] [Green Version]
  28. Xu, H.; Zhou, Y.; Lyu, M.R. Towards continuous and passive authentication via touch biometrics: An experimental study on smartphones. Symp. Usable Priv. Secur. SOUPS 2014, 14, 187–198. [Google Scholar]
  29. Bojinov, H.; Michalevsky, Y.; Nakibly, G.; Boneh, D. Mobile Device Identification via Sensor Fingerprinting. arXiv 2014, arXiv:cs.CR/1408.1416. [Google Scholar]
  30. Zhang, J.; Beresford, A.R.; Sheret, I. SensorID: Sensor Calibration Fingerprinting for Smartphones. In Proceedings of the IEEE Symposium on Security and Privacy, San Francisco, CA, USA, 19–23 May 2019; pp. 638–655. [Google Scholar] [CrossRef] [Green Version]
  31. Ouadjer, Y.; Adnane, M.; Bouadjenek, N. Feature Importance Evaluation of Smartphone Touch Gestures for Biometric Authentication. In Proceedings of the 2020 2nd International Workshop on Human-Centric Smart Environments for Health and Well-being (IHSH), Boumerdes, Algeria, 9–10 February 2021; pp. 103–107. [Google Scholar] [CrossRef]
  32. Ackerson, J.M.; Dave, R.; Seliya, N. Applications of Recurrent Neural Network for Biometric Authentication and Anomaly Detection. Information 2021, 12, 272. [Google Scholar] [CrossRef]
  33. Ryu, R.; Yeom, S.; Kim, S.H.; Herbert, D. Continuous Multimodal Biometric Authentication Schemes: A Systematic Review. IEEE Access 2021, 9, 34541–34557. [Google Scholar] [CrossRef]
  34. Tran, Q.; Turnbull, B.; Wang, M.; Hu, J. A Privacy-Preserving Biometric Authentication System With Binary Classification in a Zero Knowledge Proof Protocol. IEEE Open J. Comput. Soc. 2022, 3, 1–10. [Google Scholar] [CrossRef]
  35. Ainsworth, J.; Juola, P. Who Wrote This?: Modern Forensic Authorship Analysis as a Model for Valid Forensic Science. Wash. Univ. Law Rev. 2019, 96, 1159. [Google Scholar]
  36. Young, T.; Hazarika, D.; Poria, S.; Cambria, E. Recent Trends in Deep Learning Based Natural Language Processing. IEEE Comput. Intell. Mag. 2018, 13, 55–75. [Google Scholar] [CrossRef]
  37. Kirkpatrick, D.D. Who Is Behind QAnon? Linguistic Detectives Find Fingerprints. The New York Times. Available online: https://www.nytimes.com/2022/02/19/technology/qanon-messages-authors.html (accessed on 20 March 2022).
  38. Pukelsheim, F. The Three Sigma Rule. Am. Stat. 1994, 48, 88–91. [Google Scholar] [CrossRef] [Green Version]
  39. Kullback, S.; Leibler, R.A. On Information and Sufficiency. Ann. Math. Stat. 1951, 22, 79–86. [Google Scholar] [CrossRef]
Figure 1. (a) A generic 2-gram. (b) Our enhanced 3-gram with transition probabilities to each alphabet element as the third token.
Cryptography 06 00014 g001
Figure 2. A node’s value concatenates edge values along the path from the root node. Storing n-gram windows in a prefix tree reduces profile size and accelerates computation. The successor count vector and corresponding probability vector for “at” are given. The italicized number on each node indicates the number of times it is traversed in prefix tree generation.
Cryptography 06 00014 g002
Figure 3. Tokenization utilizes location and pressure. Key positions are ( x , y ) location ranges. Location pressure distributions determine pressure ranges. This example depicts three pressure ranges per location.
Cryptography 06 00014 g003
Figure 4. Profile pressure distributions determine pressure ranges. Tokens are created for pressure range μ ± 2 σ . Touches with pressure values p > μ + 2 σ and p < μ 2 σ are thrown out. This eliminates outliers, increasing reproducibility.
Cryptography 06 00014 g004
Figure 5. A sliding window transforms raw input into 3-grams. This input sequence produces the prefix tree shown in Figure 2. This example uses English alphabet as a token set. Our model uses tokens which are a tuple of user interaction location and pressure values.
Cryptography 06 00014 g005
Figure 6. Computes D p r o f i l e ( B , P ) comparing n-grams in B to equivalent n-grams in P. The computation excludes N G 1 P , demonstrating its asymmetry.
Cryptography 06 00014 g006
Figure 7. FPR is held constant. Modifying parameters affects FNR. Tested parameter values are normalized to range [ 0 , 1 ] . Minimum achieved FNR is plotted. User model size and auth model size point values are 400 , 800 , and 1600 (left to right). Threshold values are 100 , 500 , and 1000. Token size values are 1 , 2 , 3 , and 4. Window size values are 1 , 2 , 3 , and 4.
Cryptography 06 00014 g007
Figure 9. Classification accuracy using raw z-sequence feature vectors.
Cryptography 06 00014 g009
Table 1. Consider A U T H ( B , P ) ; it compares input sequence B against user profile P.
ParameterDescription
Base Model SizeTokens in P.
Auth Model SizeTokens in B.
Total Model SizeSum of tokens in P and B.
Authentication ThresholdValue above which B authenticates in P. Increasing Authentication Threshold increases required closeness. Equation (3) provides the relationship to A U T H ( B , P ) .
TNLocation pressure distributions determine token pressure ranges. TN is the number of pressure ranges. Ranges have equal numerical size.
Time ThresholdSoft keyboard input is tokenized into a token sequence. n-grams are n-sized token sequences. Consecutive n-gram tokens must occur within Time Threshold. Consecutive tokens exceeding Time Threshold are excluded from all n-grams. No n-grams cross this temporal divide.
Window SizeThe ( n 1 ) in n-gram, which captures the window size. Number of tokens predicting next token probabilities.
Table 2. Schemes to map raw data to machine learning features with class corresponding to the combined user–device identity, user profile P. An n-gram N G i P . W occurs with frequency f i P in a user profile P. N G i P . v is the successor frequency vector. T i is a token as utilized in our divergence metric.
SchemeFeatures
Raw z-sequence Z 0 . l , Z 0 . p , Z 1 . l , Z 1 . p , …, Z z 1 . l , Z z 1 . p
Token z-sequence Z 0 . l , T 0 , Z 1 . l , T 1 , …, Z z 1 . l , T z 1
Successor Vector N G i P . W , f i P , N G i P . v [ 0 ] , N G i P . v [ 1 ] , …, N G i P . v [ | Σ | 1 ]
Table 3. Varying one parameter while holding others constant generates locally optimal values. Testing all parameter combinations near locally optimal values generates globally optimal parameter values.
ParameterLocally Optimal ValueGlobally Optimal Value
Base Model Size16006400
Auth Model Size8006400
Total Model Size240012,800
Authentication Thresholdvaries0.88
TN22
Time Threshold1000 ms1000 ms
Window Size11
Table 4. Classifier accuracy estimated using k-fold cross validation with varying z-sequence size.
zSVM LinearSVM RadialSVM Poly
Raw z -sequence
1 16.76 % 20.33 % 14.04 %
2 21.01 % 25.95 % 15.84 %
3 23.54 % 27.32 % 17.54 %
9 31.10 % 35.27 % 28.32 %
27 40.01 % 44.01 % 38.90 %
81 50.34 % 57.47 % 54.95 %
243 68.53 % 76.14 % 75.54 %
496 91.96 % 86.94 % 88.99 %
750 88.86 % 87.39 % 88.66 %
1000 99.80 % 92.57 % 97.40 %
Token z -sequence
1 13.85 % 14.12 % 13.84 %
9 21.25 % 22.29 % 20.32 %
Successor Vector
- 2.49 % 0.18 % 2.25 %
Table 5. Classifier training|classification time with varying z-sequence size. All values are given in milliseconds (ms).
zSVM Linear (ms)SVM Radial (ms)SVM Poly (ms)
Raw z -sequence
124,9191992,26814072,489106
230,1962283,66911677,414120
329,6222277,08012277,823117
952,5183688,239154116,545172
27111,54476130,380221183,437280
81213,256166225,028480276,101493
243395,521388439,0571223384,258836
496371,013536769,6952398504,9181228
7501,841,81014853,159,56074662,404,0624426
10002,563,36921325,053,84411,4712,868,6535083
Token z-sequence
127,43021102,49714274,115103
962,72838135,000212116,696177
Successor Vector
-19541294293397887201
Publisher’s Note: MDPI stays neutral with regard to jurisdictional claims in published maps and institutional affiliations.

