3.1. Optics
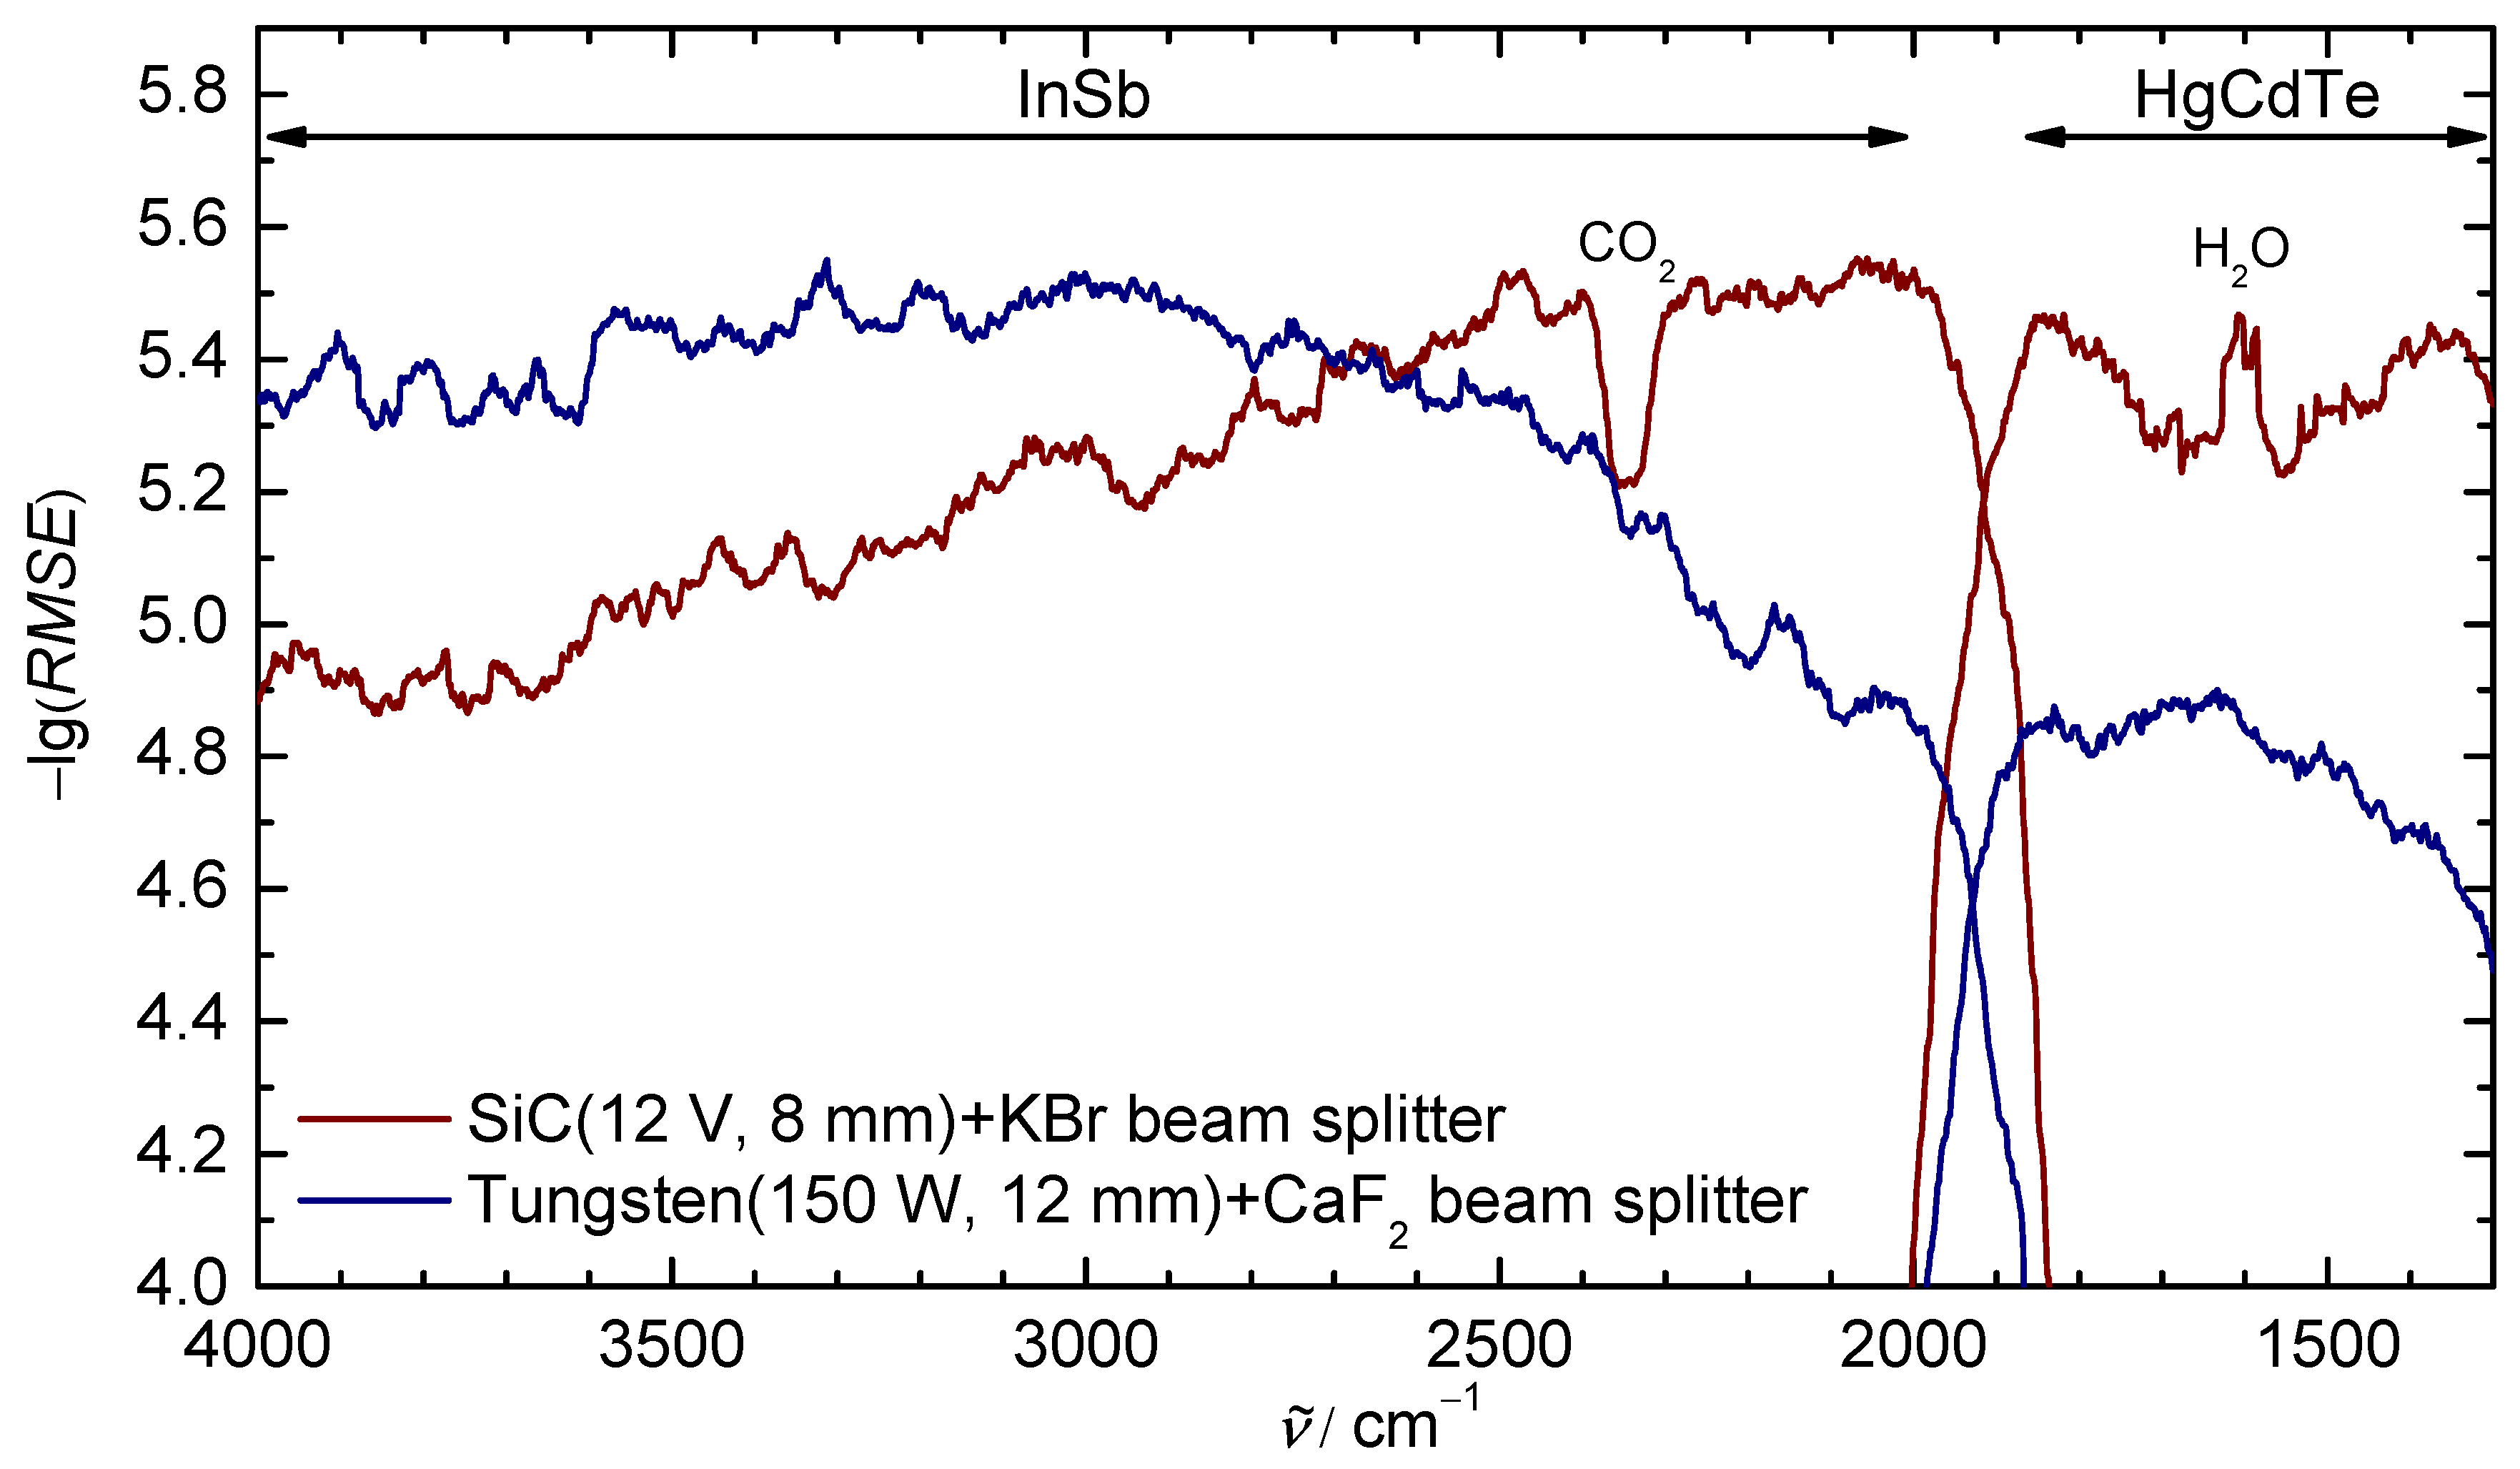
To optimize the signal-to-noise ratio (S/N) in different spectral regions, several combinations of light sources, apertures, and beam splitters were tested with the InSb/HgCdTe sandwich detector and CaF windows at the spectrometer, jet chamber, and detector chamber. The spectral bandwidth of the light reaching the detector was limited to 4200–1200 cm with an optical filter installed in the detector chamber. The performance of the different combinations was then determined by analyzing the noise levels in empty spectra. For this, the so-called Noise Test Challenge (NoTCh) routine is used: 1 minute of background spectra are measured through the empty jet chamber, followed by 1 minute of sample spectra under the same conditions. In the resulting absorbance spectra, the noise level is determined as the root-mean-square error () with respect to a quadratic fit of the spectral baseline in a moving 50 cm window. The negative decadic logarithm of the , , is then plotted against the corresponding wavenumber.
The
plots for the two configurations with the best performance in the relevant spectral regions are shown in
Figure 5. As expected, the combination of a SiC rod and a KBr beamsplitter (red) offers the lowest noise level (higher values for
) for the HgCdTe detector element and the lower part of the spectral region probed with the InSb detector element. Uncompensated bands and lines of atmospheric carbon dioxide and water are counted as noise, thus reducing the
at their spectral positions (marked in
Figure 5). For the OH and CH stretching regions, the combination of a 150 W tungsten filament and a CaF
beam splitter leads to the lowest noise level (blue). The cross-over point between the two combinations shown in
Figure 5 is located around 2700 cm
. Thus, for measurements with a focus on the OH stretching region of the spectrum, as discussed below, the combination of the tungsten filament and CaF
beam splitter is employed.
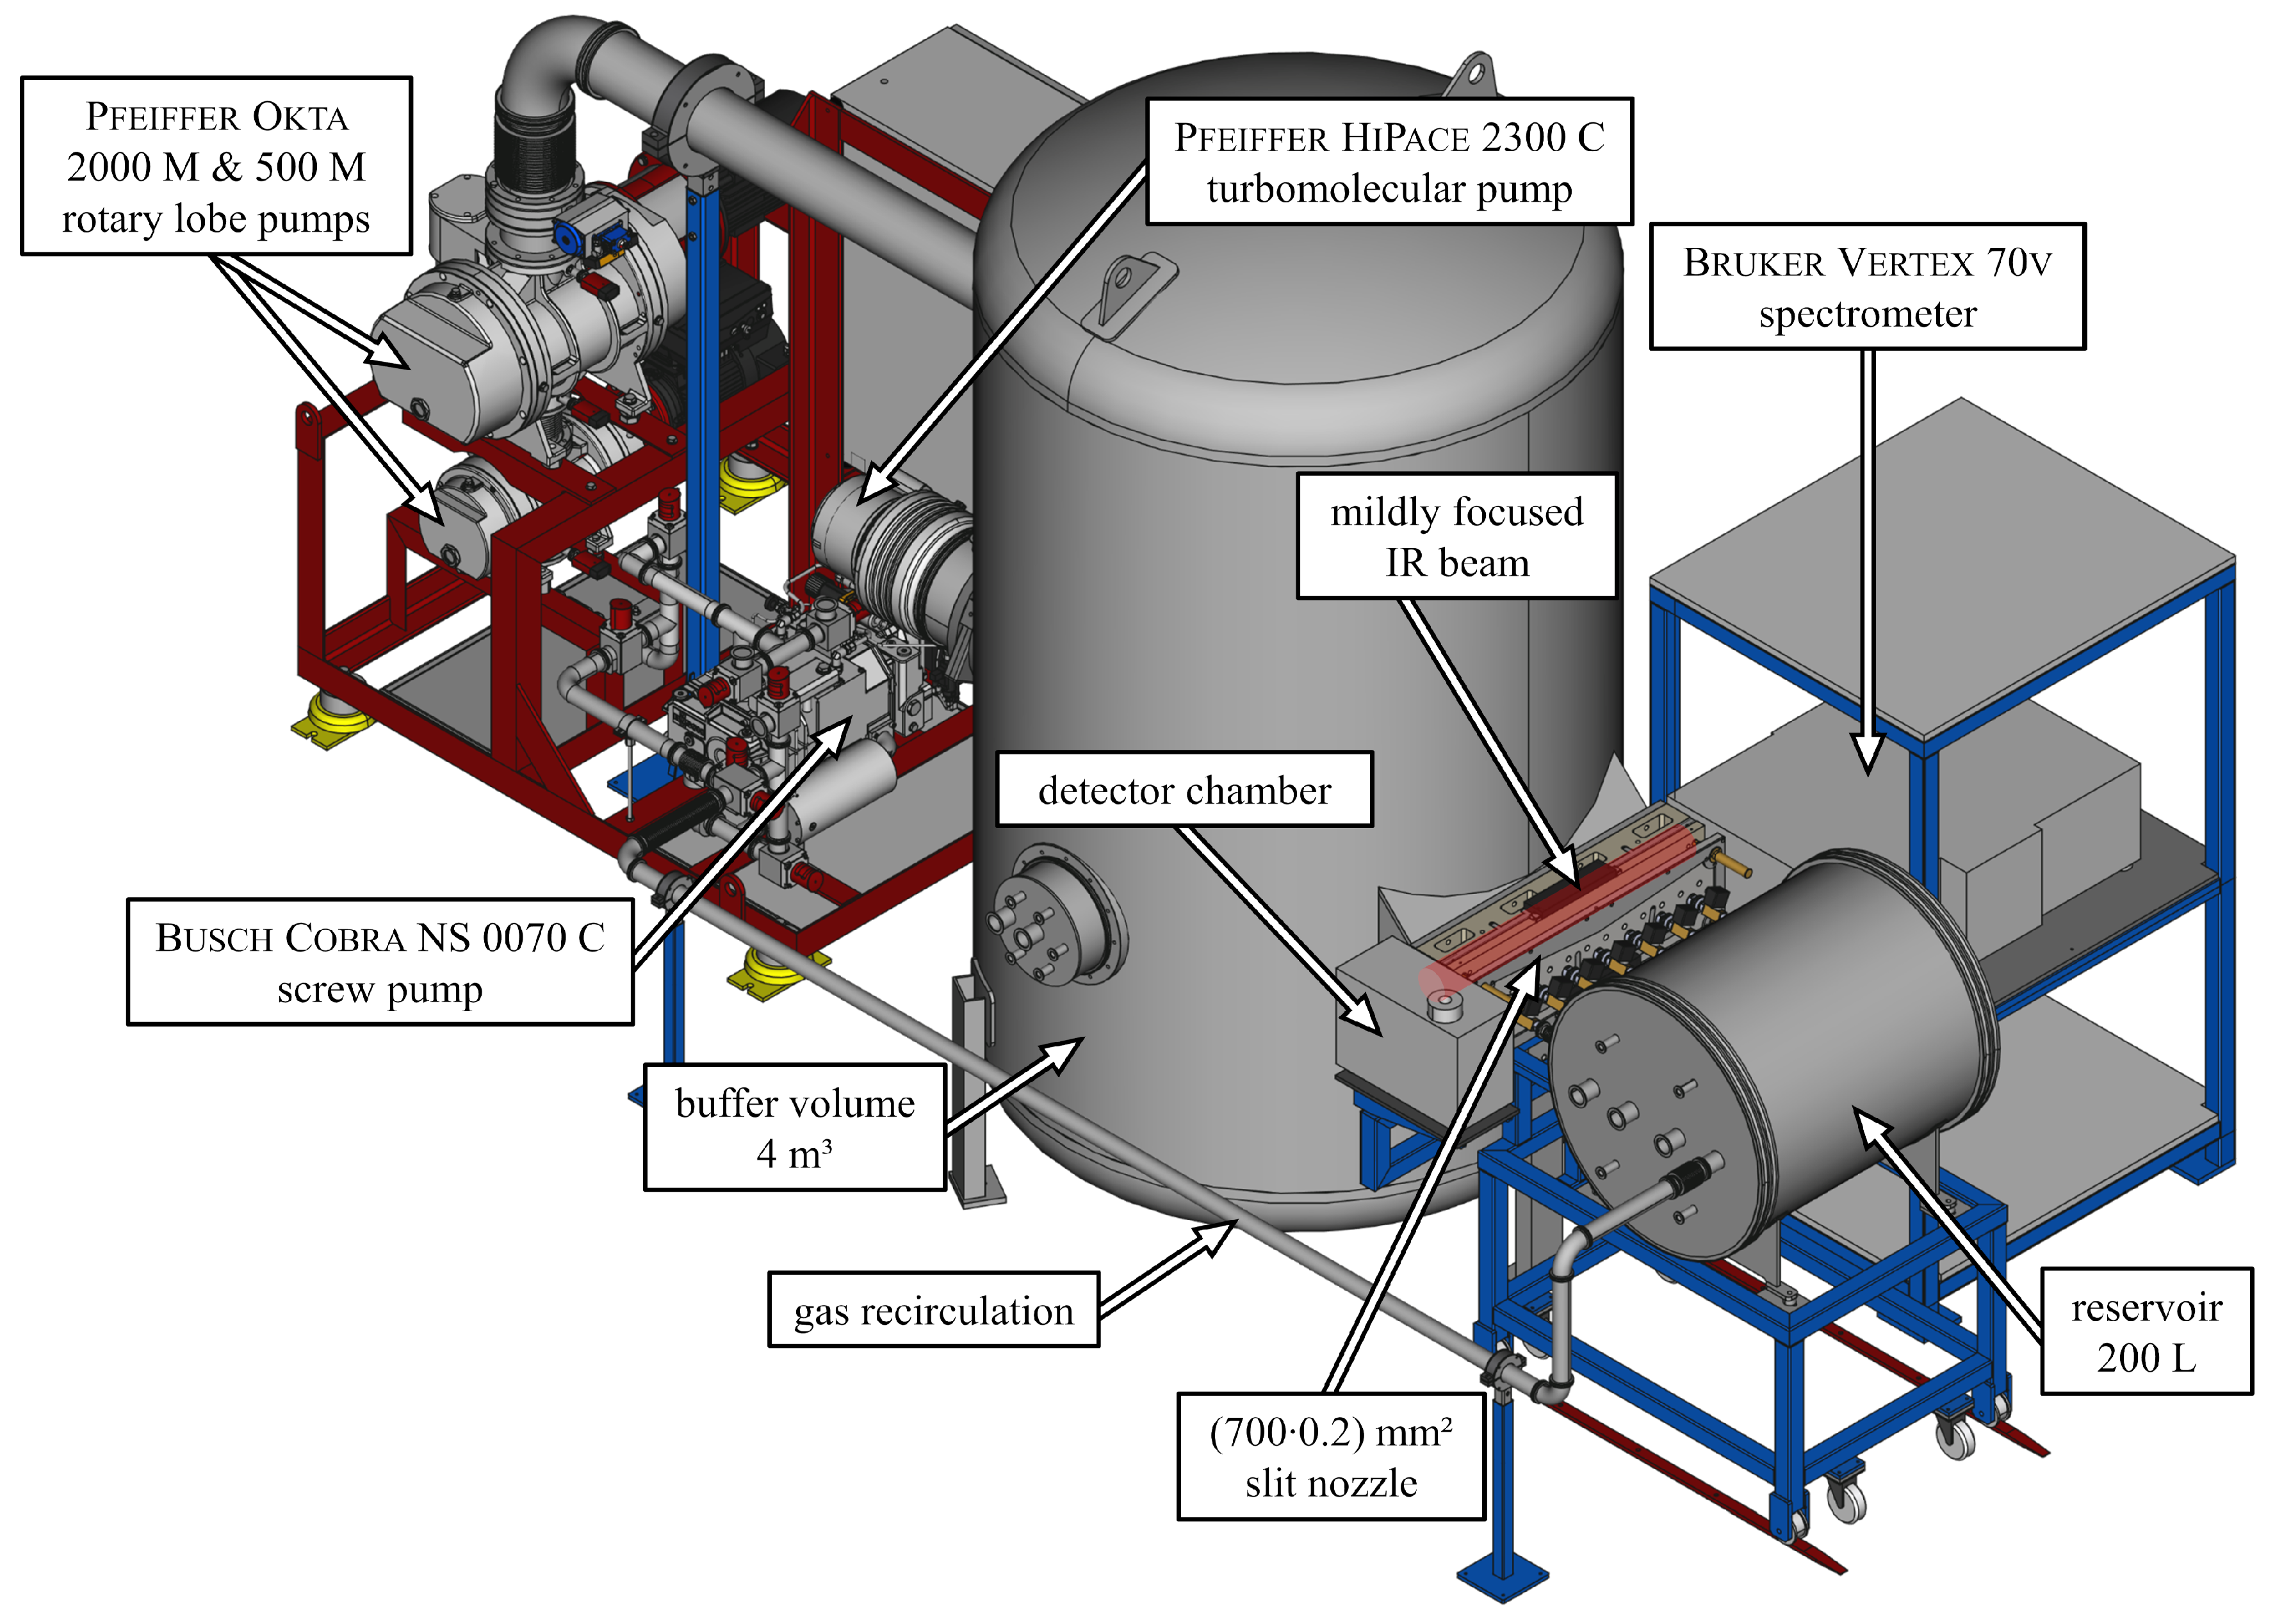
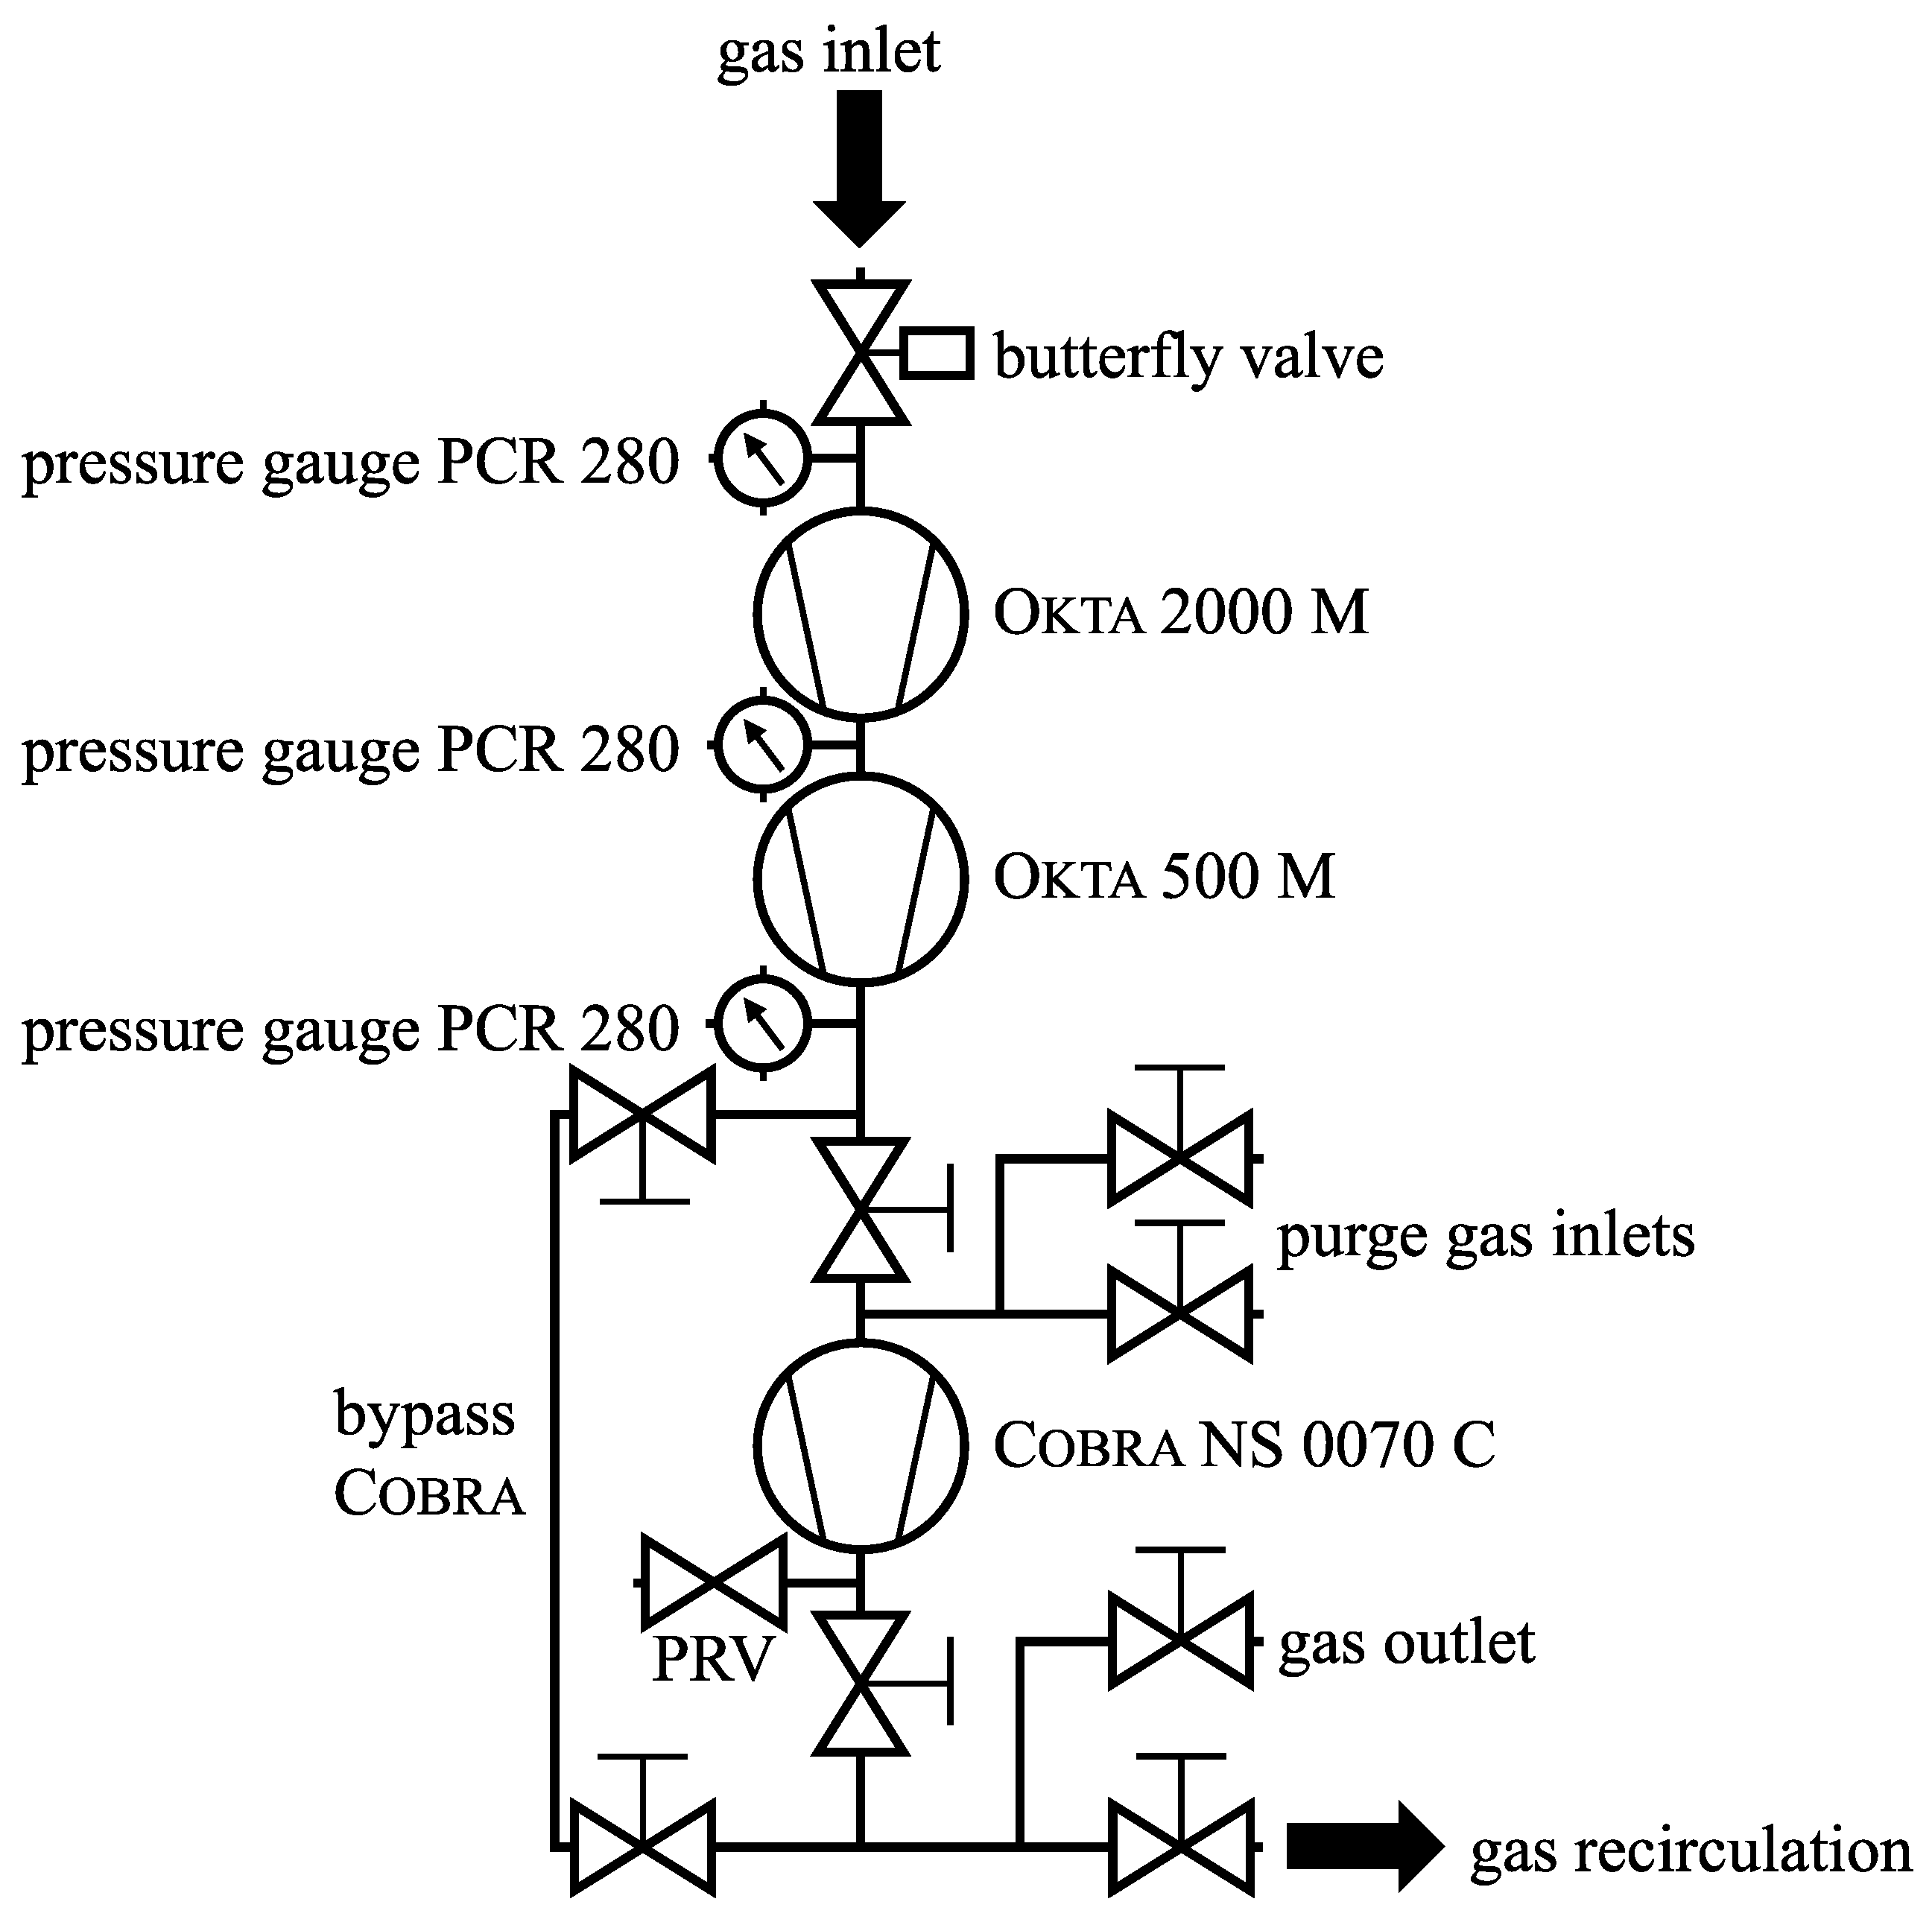
3.2. Gas-Recycling
The gratin jet setup is used in a gas-recycling mode, where the expanded gas mixture is recompressed and routed back to the reservoir after being expanded through the slit nozzle (vide supra). If a fraction of the gas in the reservoir is expanded in a single pulse, the recycling factor for gas pulses is . Typical values for are 0.05 for helium and 0.02 for neon, whereas can substantially exceed 1000, as will be shown below. Therefore, this mode leads to a significant decrease in substance consumption compared to single use operation. However, impurities entering the gas mixture via a leak or wall desorption can accumulate within the mixture over time.
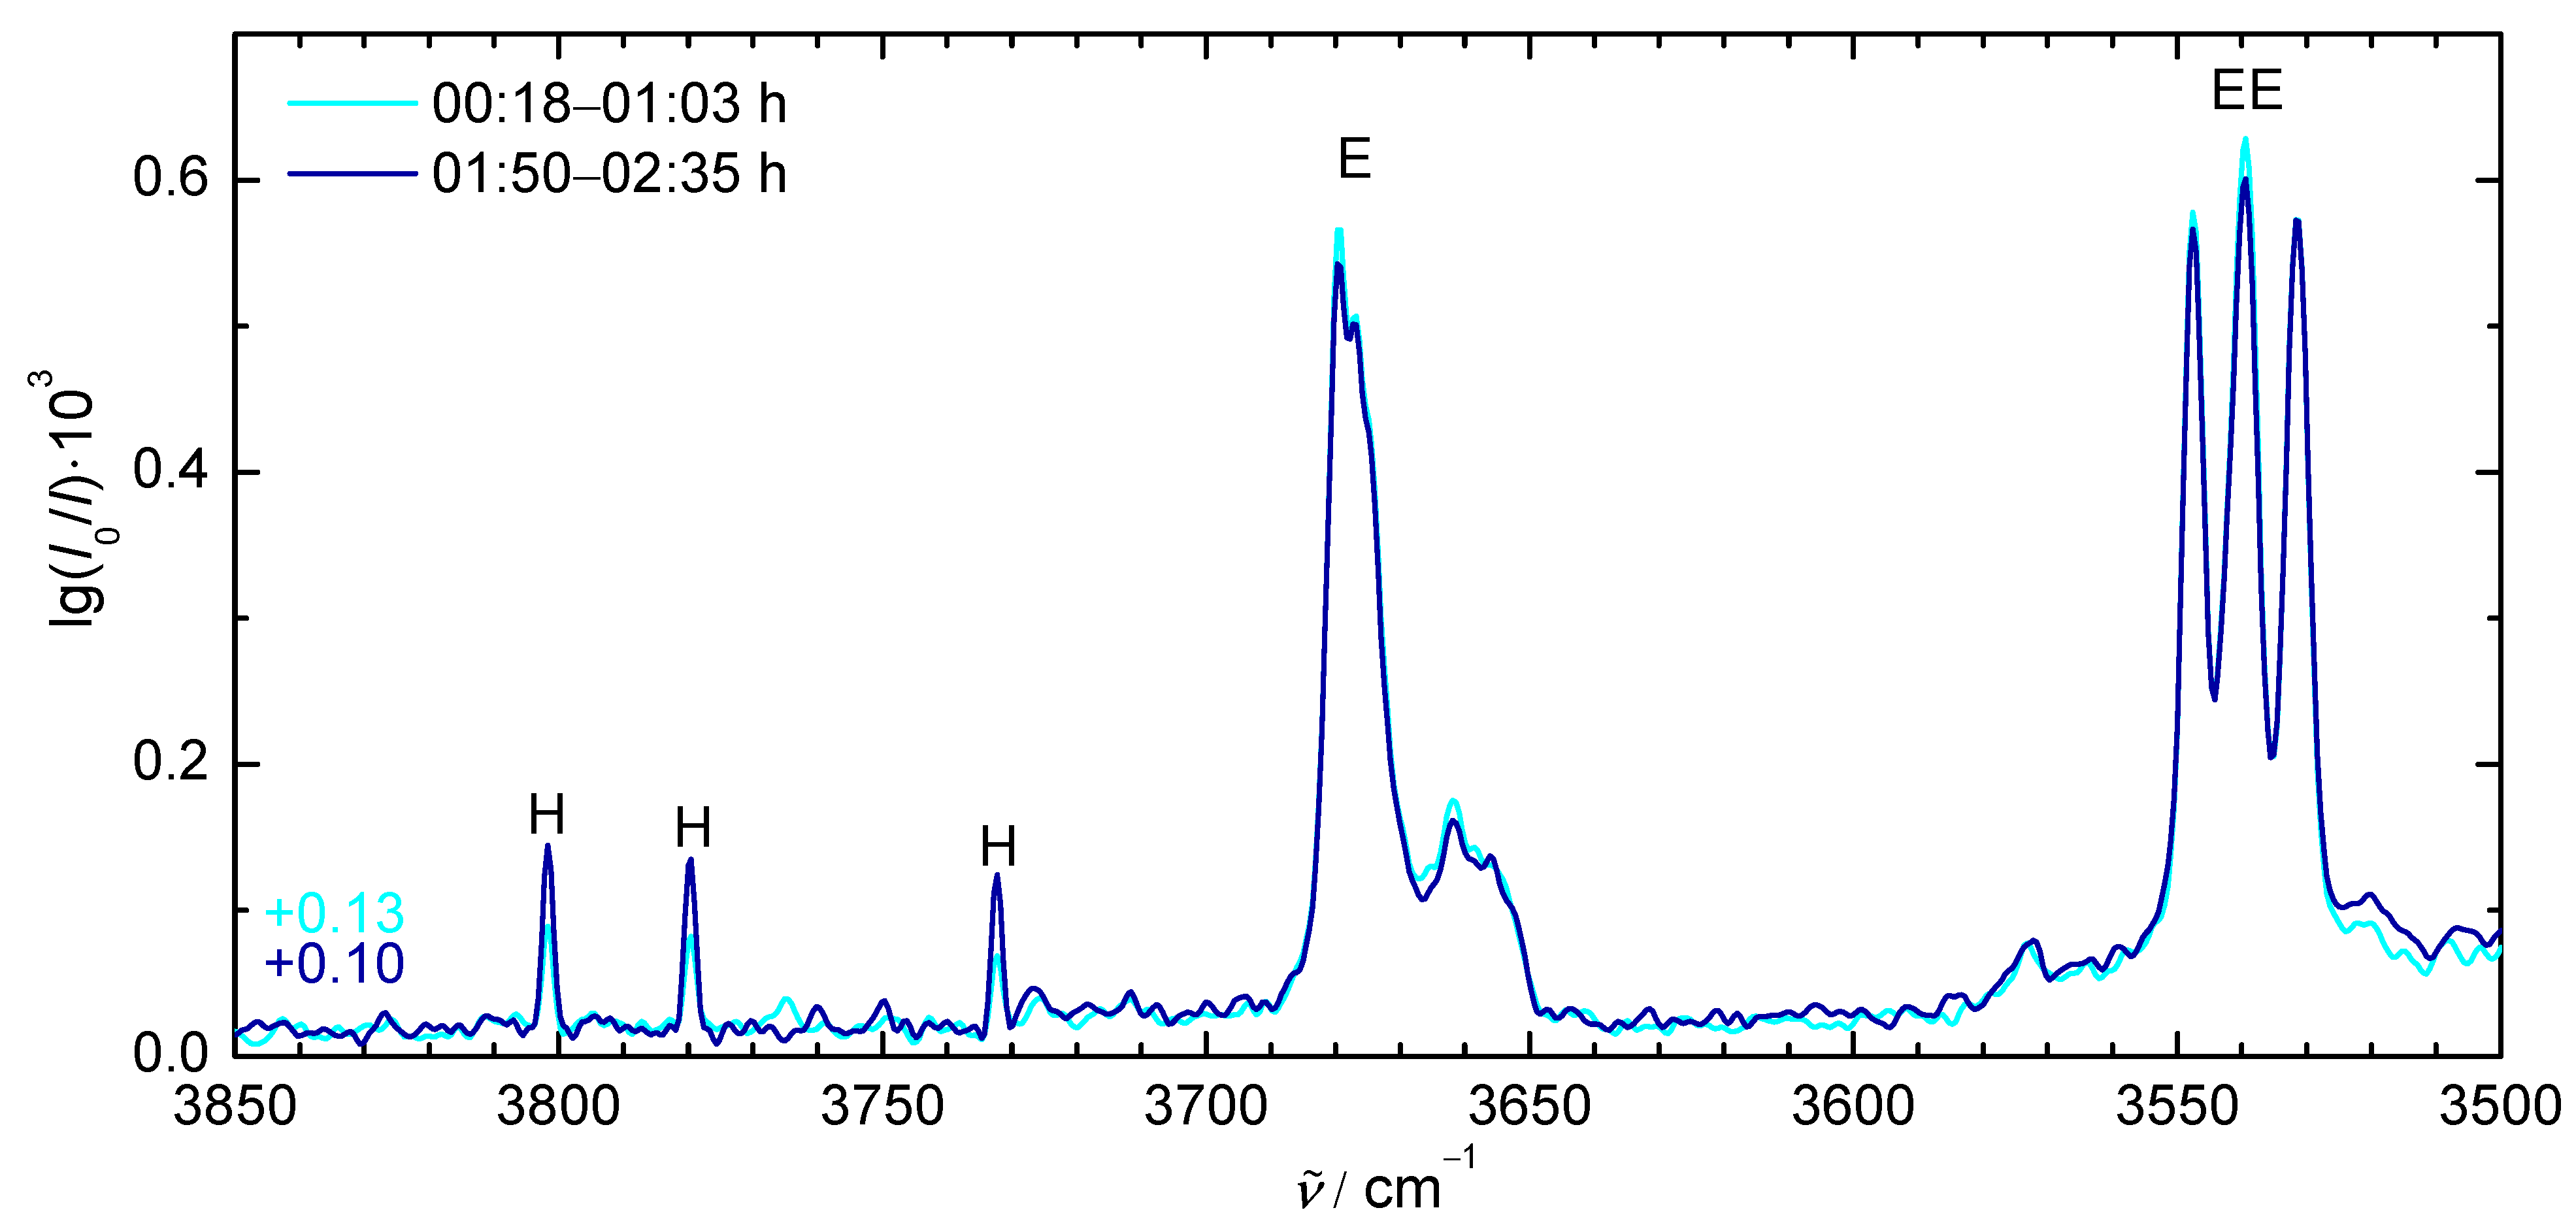
When measuring in the gas-recycling mode over several hours, such an accumulation can indeed be observed (see
Figure 6). In the OH stretching region of the jet spectra, three distinct lines rising in intensity with increasing gas-recycling duration can be observed (from light blue to dark blue). These lines can be assigned to ro-vibrational transitions (see
Table 3) typical for jet-cooled water (H). Their full width at half maximum is close to the nominal resolution despite the large aperture used. In unfavorable cases, such as the dilute ethanol spectrum shown in
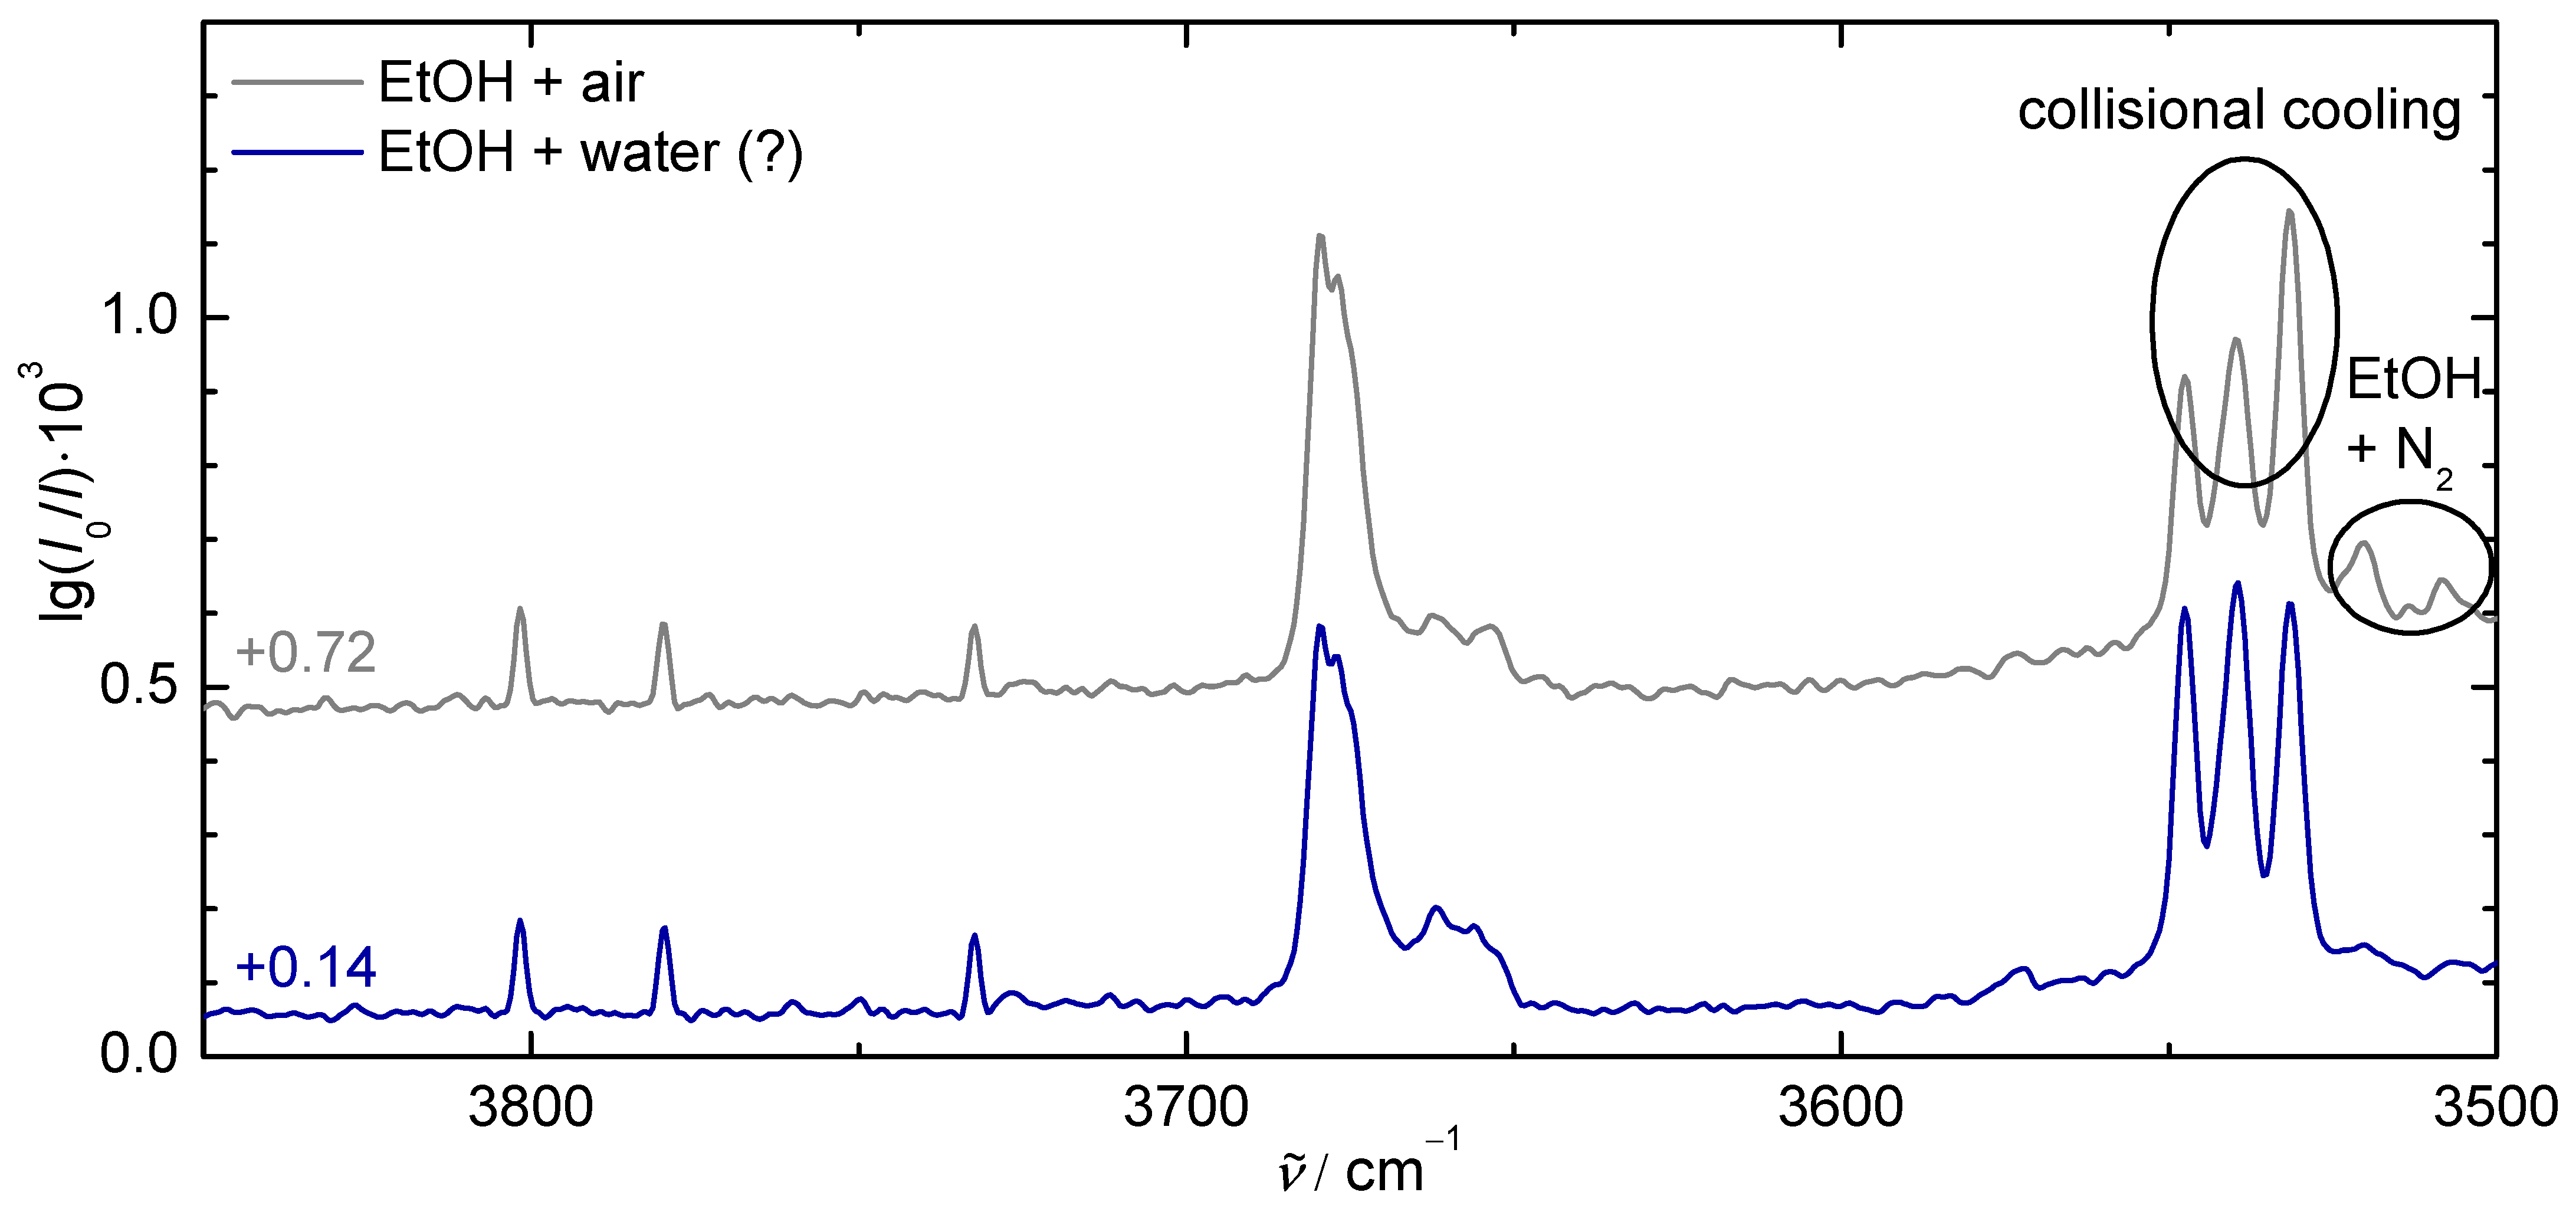
Figure 6, this leads to significant amounts of water in the gas mixture already after short periods of time, thus limiting the maximum usable duration of the recycling operation. Therefore, we tried to trace the dominant origin of the water accumulating in the gas mixture.
One possible source is a leak of environmental air. Whereas the vibrations of oxygen and nitrogen are not visible in the IR spectrum and the fundamental vibrational transitions of carbon dioxide lie outside the spectral region initially probed at the
gratin jet (4200–2450 cm
), the humidity entrained in the air could lead to the lines observed in the OH stretching region of the jet spectrum. This is confirmed by deliberately adding 7.5 hPa of environmental air to a mixture of 1.3 hPa ethanol (EtOH) and 741 hPa He (grey trace in
Figure 7). At 3801, 3780, and 3732 cm
, jet water lines appear in the spectrum, similar to those observed after ∼2 h of recycling operation without air admixture (blue trace). However, at lower wavenumbers, the spectra differ significantly. The admixture of air leads to two major spectral effects in the OH stretching range that are not visible in the spectrum with the water-containing impurity: 1. relaxation into the most stable ethanol dimer (homochiral all-
gauche conformer) [
40,
89,
90] due to more efficient collisional cooling because of the heavier molecules in the air; 2. bands at 3520 and 3508 cm
, which can be assigned to EtOH+N
clusters [
40]. A major air leak can thus be ruled out as the main source of the rising water amount in the circulating gas mixture.
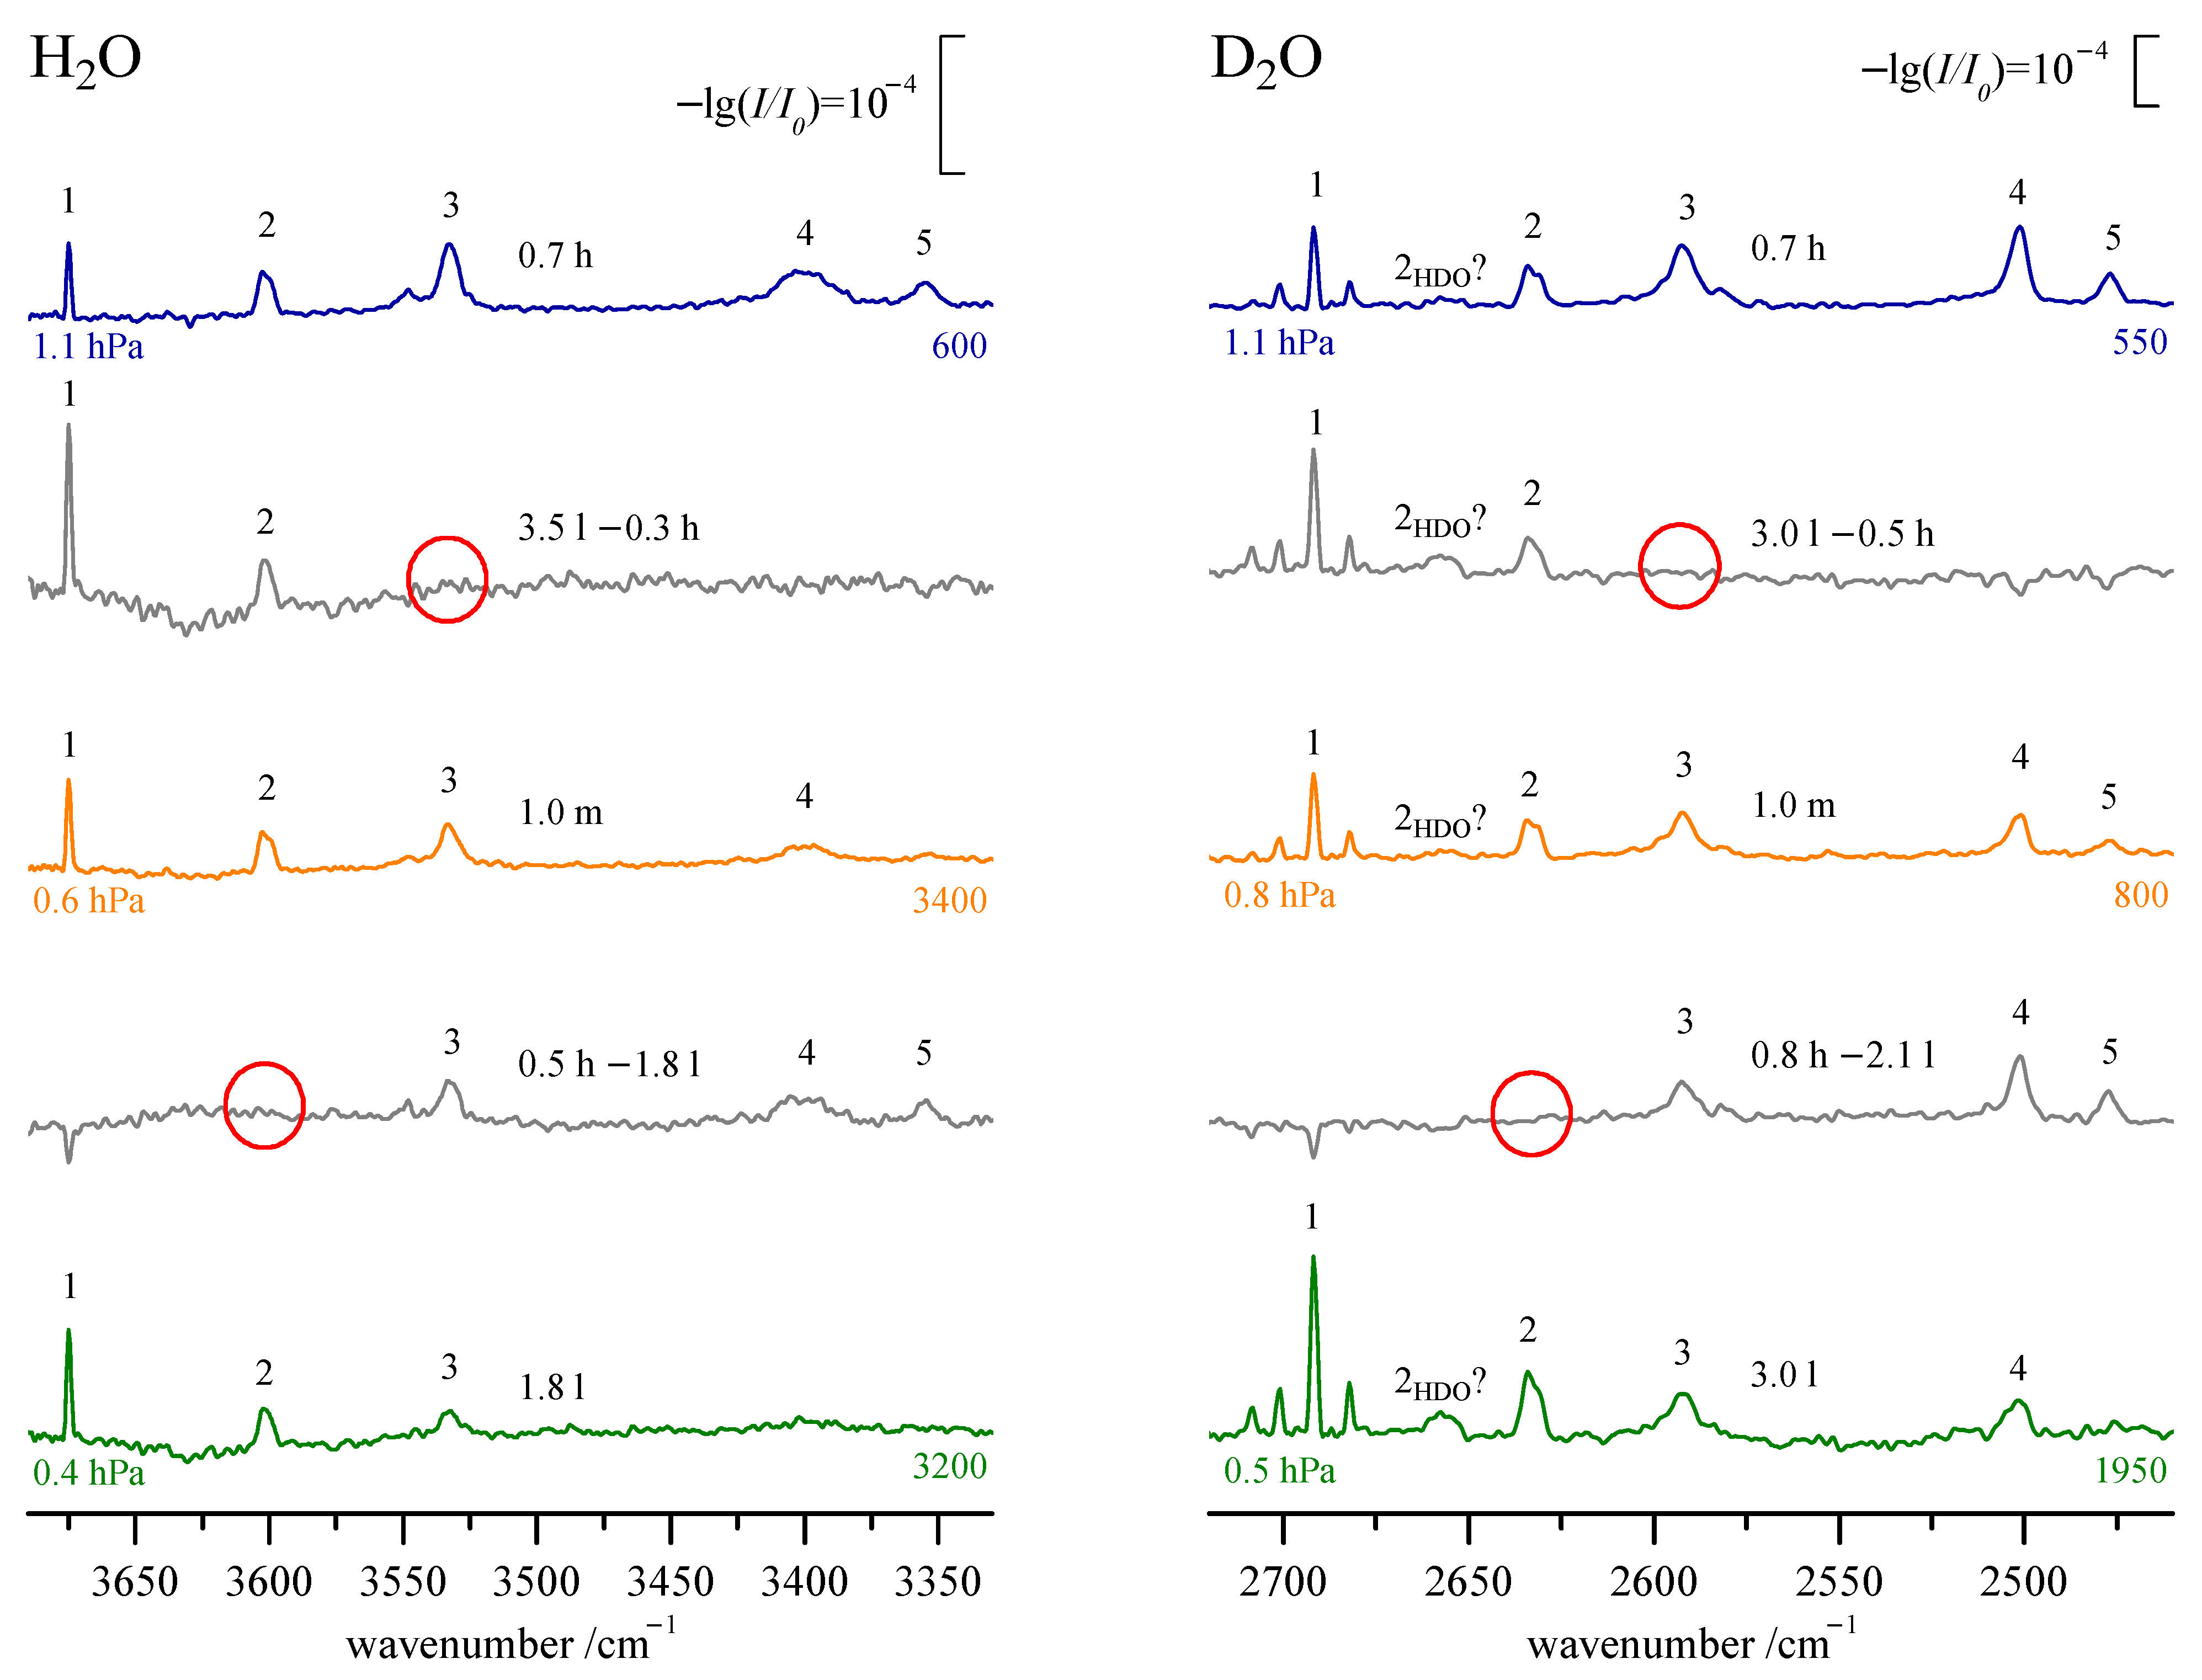
Another possible source for water would be a direct water leak from the internal cooling circuit of the screw pump. This pump uses a mixture of ethylene glycol and water as coolant. However, ethylene glycol was not detected in the jet spectra. Additionally, after partly deuterating the water in the coolant, neither HDO nor DO were detected in the jet spectra, either. Since the screw pump is the only location with a direct contact between (liquid) water and the vacuum system, a direct water leak can also be ruled out as a source for the rising water amount observed in the jet spectra.
The most likely source of the water thus is desorption from the elastomeric seals and the walls of the vacuum chambers, tubes, and pumps. Several observations support this hypothesis:
The water increase seems to be slower when the screw pump is bypassed. However, this is difficult to judge since only warm expansions with stagnation pressures of up to 30 hPa are possible without the screw pump (vide supra). The screw pump is suspected to be one of the main sources for desorption, since it can only be flushed with inert gases and not be baked out under high vacuum conditions.
Since the initial start of the operation of the
gratin jet in December 2018, the growth rate of the water trace impurity has dropped considerably. Based on comparisons to jet spectra with a known amount of water (or to isolated bands of other compounds of known concentration within a spectrum), we estimate the increase rate in recent spectra to typically be <0.5 mg/h. First quantifications in March 2019 showed increase rates of ∼2 mg/h (cf.
Figure 6). This reduction in trace water buildup could be explained by a lower water desorption rate due to the increasing time since the last full purging of the vacuum system.
The new measurements show an initial release of 1–5 mg of water, depending on whether the preceding experiment involved high water concentrations. This initial release could be caused by the new analyte molecules replacing adsorbed water molecules at the walls and seals. After this initial release, the aforementioned water increase rate of <0.5 mg/h sets in. Indeed,
Figure 6 indicates a slight depletion of gaseous ethanol with water impurity buildup.
After several hours, a saturation of the water concentration possibly sets in. However, this is difficult to judge due to the limited spectral resolution which does not allow for an exact quantification of two orders of magnitude more narrow rovibrational lines.
The increasing water amount effectively limits the duration for which the gas-recycling can be upheld before the reservoir needs to be refilled with new gas mixture. In favorable cases, the gas-recycling operation can be kept up over a whole workday with only tolerable amounts of water (and thus water clusters) accumulating in the gas mixture. This results in a significant decrease of substance consumption compared to the conventional single use operation at the filet jet.
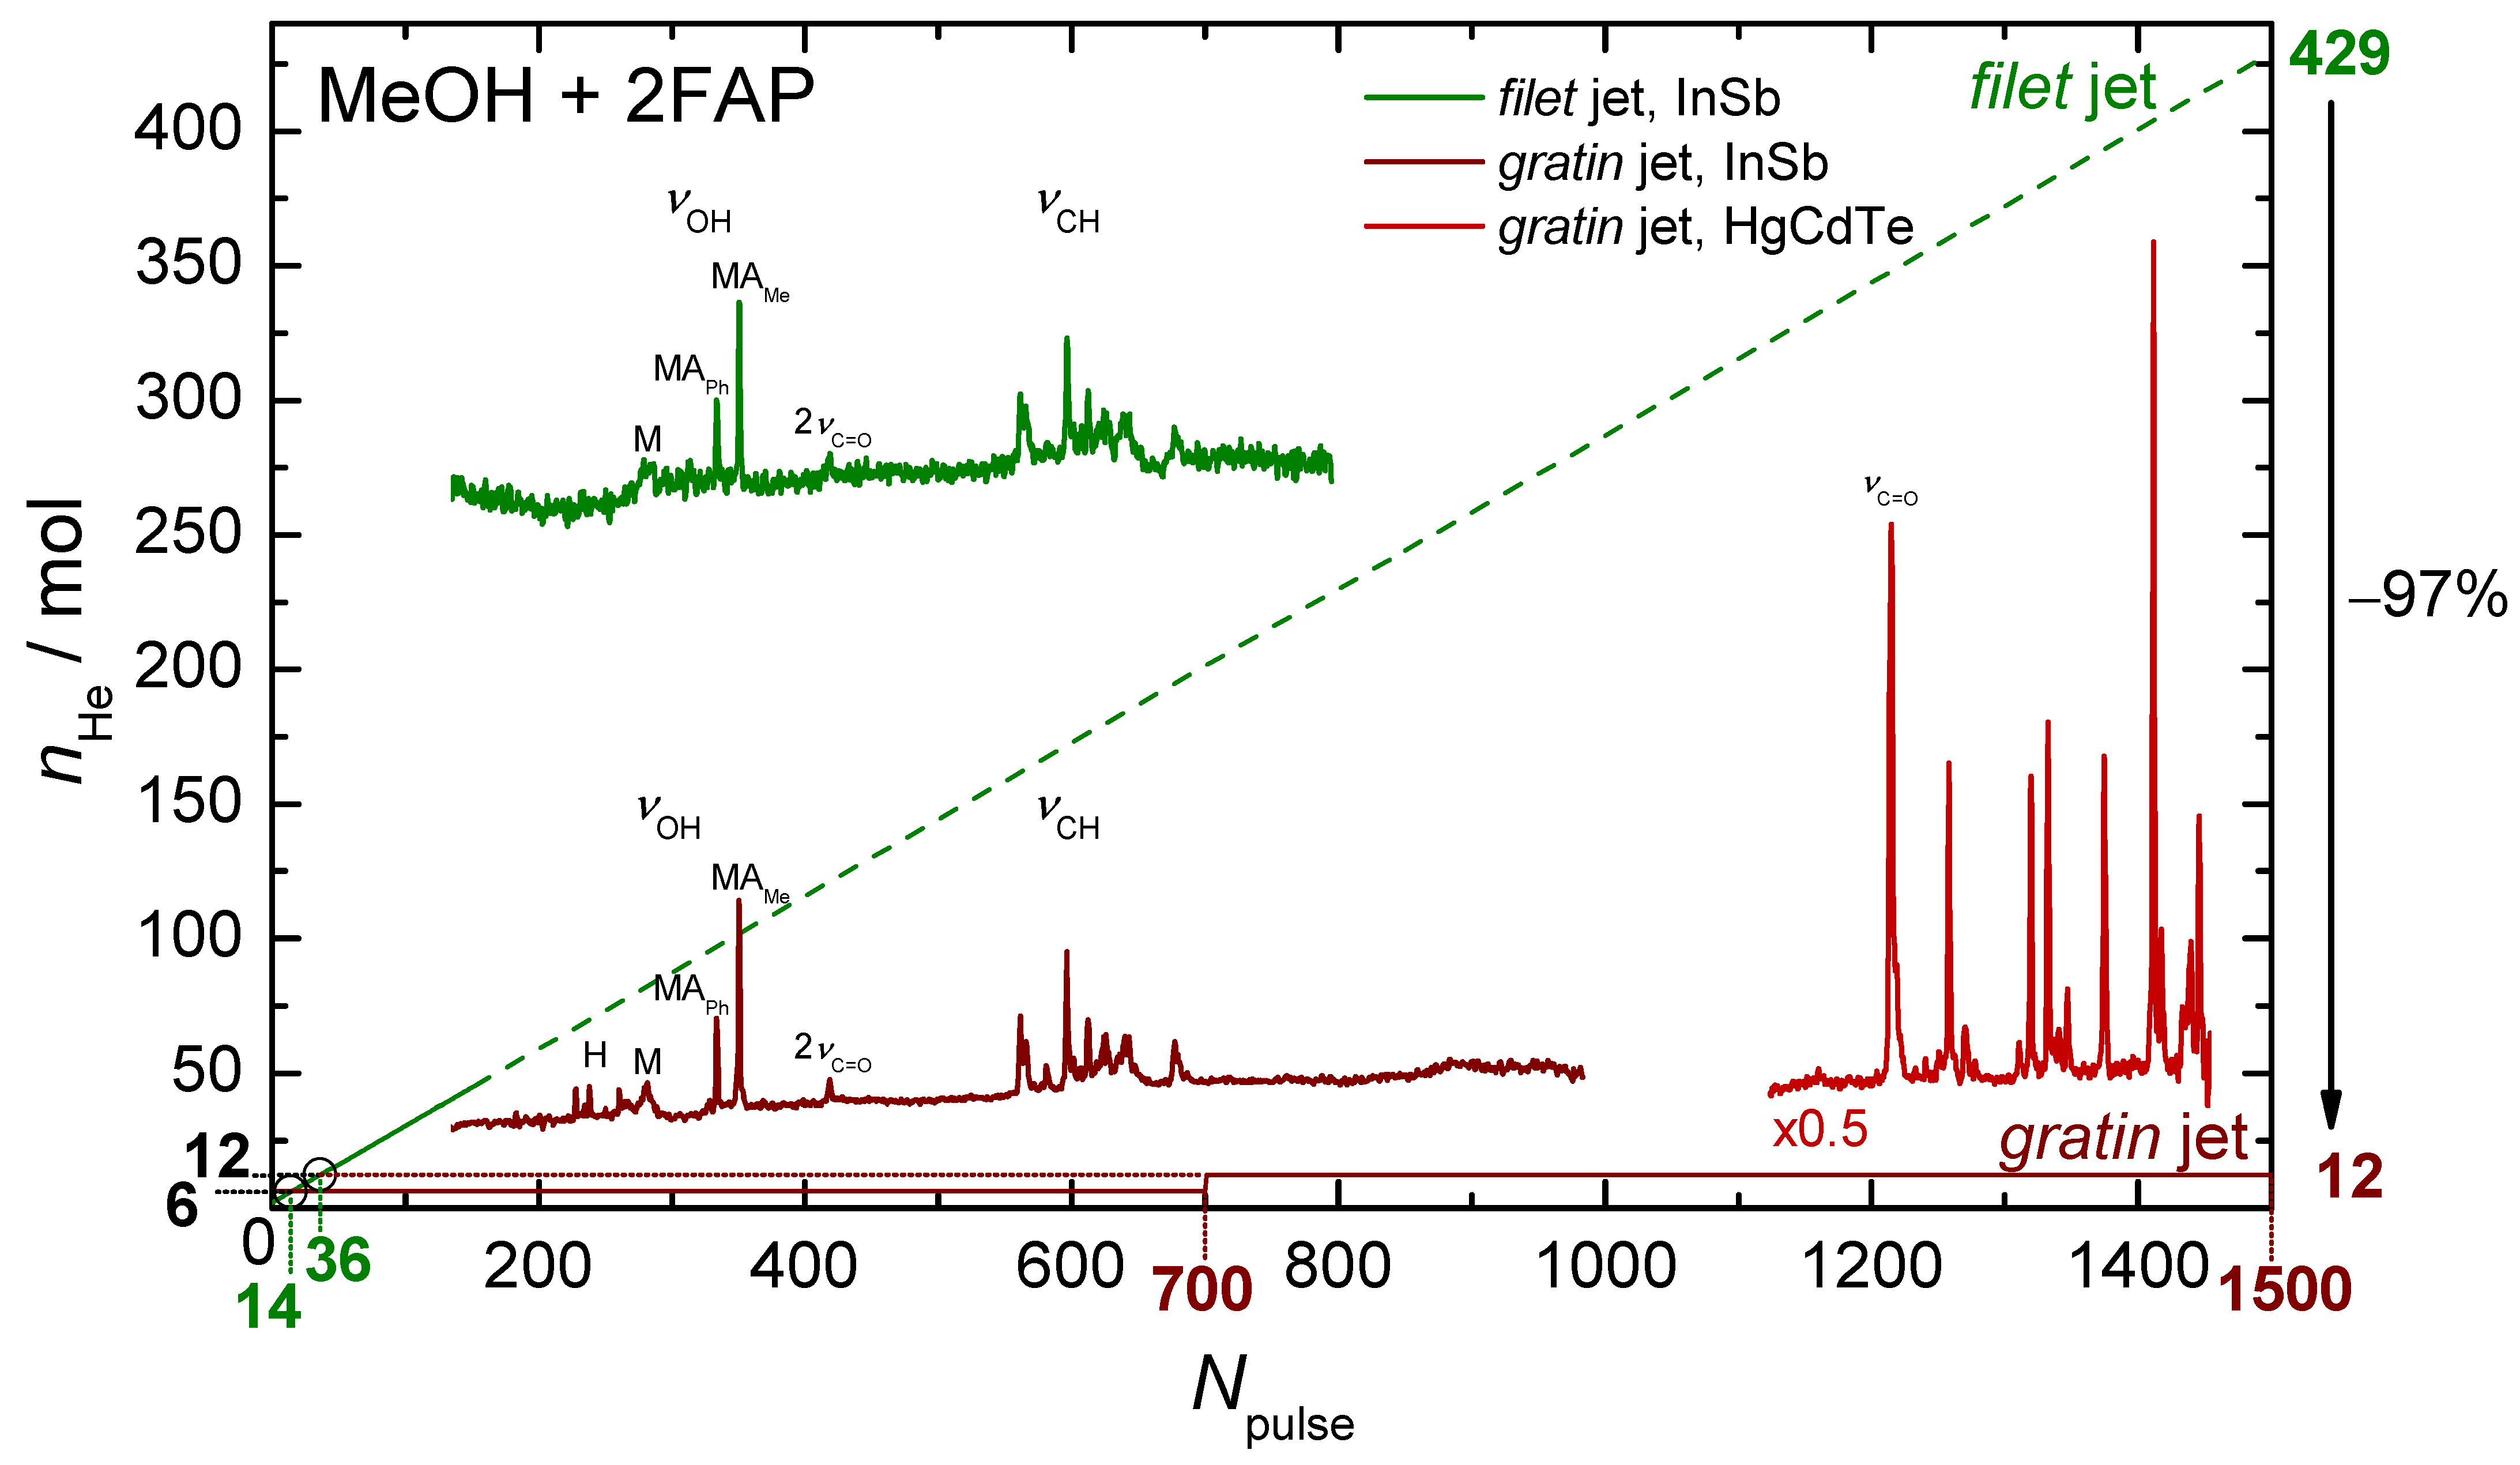
Such a favorable case is the mixture of methanol (MeOH) and 2-fluoroacetophenone (2FAP) in the carrier gas helium (He).
Figure 8 shows the substance consumption
n dependent on the number of gas pulses
, measured at the
filet (green) and
gratin (red) jet setups at a stagnation pressure of 750 hPa, respectively. Since He makes up more than 99.9% of the gas mixture, the He consumption
is used as a representation. For all calculations of the helium amount of substance, ideal gas behavior is assumed. At the
filet jet setup, approximately 2.0 mol He are needed to initially fill the reservoir (
m
) to the desired stagnation pressure. Subsequently, an additional 0.28 mol He is needed to refill the reservoir after each pulse, resulting in a linear increase of He consumption with increasing number of pulses (solid green line). At the
filet jet, 150 gas pulses were measured, resulting in a total He consumption of 44.8 mol. For comparison purposes, the He consumption is extrapolated (dashed green line) to the number of pulses (1500) measured at the
gratin jet, which would result in a He consumption of 429 mol at the
filet jet.
At the
gratin jet, approximately 6.2 mol He are needed to fill the reservoir (
m
). Due to the gas-recycling operation, after the initial filling no additional gas supply is required for measurements (red line), until the concentration of water in the gas mixture becomes problematic. In the example, the reservoir was evacuated and refilled after 700 pulses, and an additional 800 pulses were measured with this second filling. This results in a He consumption of 12 mol for measuring 1500 pulses. Compared to the 429 mol of He needed to carry out the same number of pulses at the
filet jet, this corresponds to a decrease in substance consumption by 97%. Conversely, with the amount of He needed to measure 1500 pulses at the
gratin jet (12 mol), only 36 pulses (2% of 1500) can be carried out at the
filet jet. The spectra recorded with this He consumption are plotted in the figure. The most important signals in the OH (
) and CH (
) stretching ranges of the spectra measured with the InSb detector elements (
filet: green,
gratin: dark red) are marked. Additionally, the spectrum simultaneously measured with the HgCdTe detector element of the
gratin jet setup is displayed in light red. A simultaneous InSb/HgCdTe measurement is not possible at the
filet jet (
vide supra). As can be seen from the spectra, a significantly better S/N per substance consumption is achievable at the
gratin jet. However, when measuring several hundreds of pulses in the gas-recycling mode, water lines (H) become visible in the
gratin jet spectrum. An attempt to quantify the improved S/N, but also the influence of the water impurity on relevant MeOH+2FAP spectral features, is made in the following
Section 3.3.
In summary, the source of the slowly increasing water amount in the circulating gas mixture has been carefully explored. A leak from the internal cooling circuit of the screw pump was ruled out by its partial deuteration. A dominant leak of environmental air was ruled out by the spectroscopic and spectrometric absence of other air components. We think that it is a sum of elastomeric seal and wall desorption, in particular from those parts of the screw pump which can only be flushed with dry gases, rather than baked out under high vacuum. Some saturation of the trace water influx appears to set in after many hours but is difficult to quantify due to the low resolution of the spectrometer. With this water influx being the limiting factor for the maximum duration of gas-recycling, the substance consumption for jet FTIR measurements can still be reduced by nearly two orders of magnitude compared to the conventional operation mode. This allows for the use of more expensive carrier gases, such as neon, and analyte substances, such as isotopologues or custom-made compounds.
3.3. Fundamental Performance
To examine the influence of the water impurity on the spectrum of the (binary) analyte combination of interest, one possibility is to look at the spectra of water with the individual analytes. Another possibility is to use water-free reference spectra of the analyte combination. For this purpose, the combination of MeOH and 2FAP can again serve as an example. Acetophenones, such as 2FAP, offer two attractive hydrogen bond docking sites for donors such as MeOH: the two lone pairs at the carbonyl oxygen atom. By substitution at the phenyl ring or the methyl group of the acetophenone, e.g., fluorination in the 2’-position of the phenyl ring (2FAP), the hydrogen binding preference between the lone pairs on the methyl (Me) and phenyl (Ph) sides can be influenced. This gives rise to a so-called intermolecular energy balance [
44,
54,
57], which can be used to benchmark quantum chemical energy differences by determining the abundance ratio of the Me- and Ph-bound mixed dimers in the supersonic expansion [
44]. Therefore, the MeOH+2FAP donor OH stretch dimer bands MA
(methyl side) and MA
(phenyl side) are of particular interest and we will focus on these bands to discuss the influence of the water impurity on the quality of the jet spectrum.
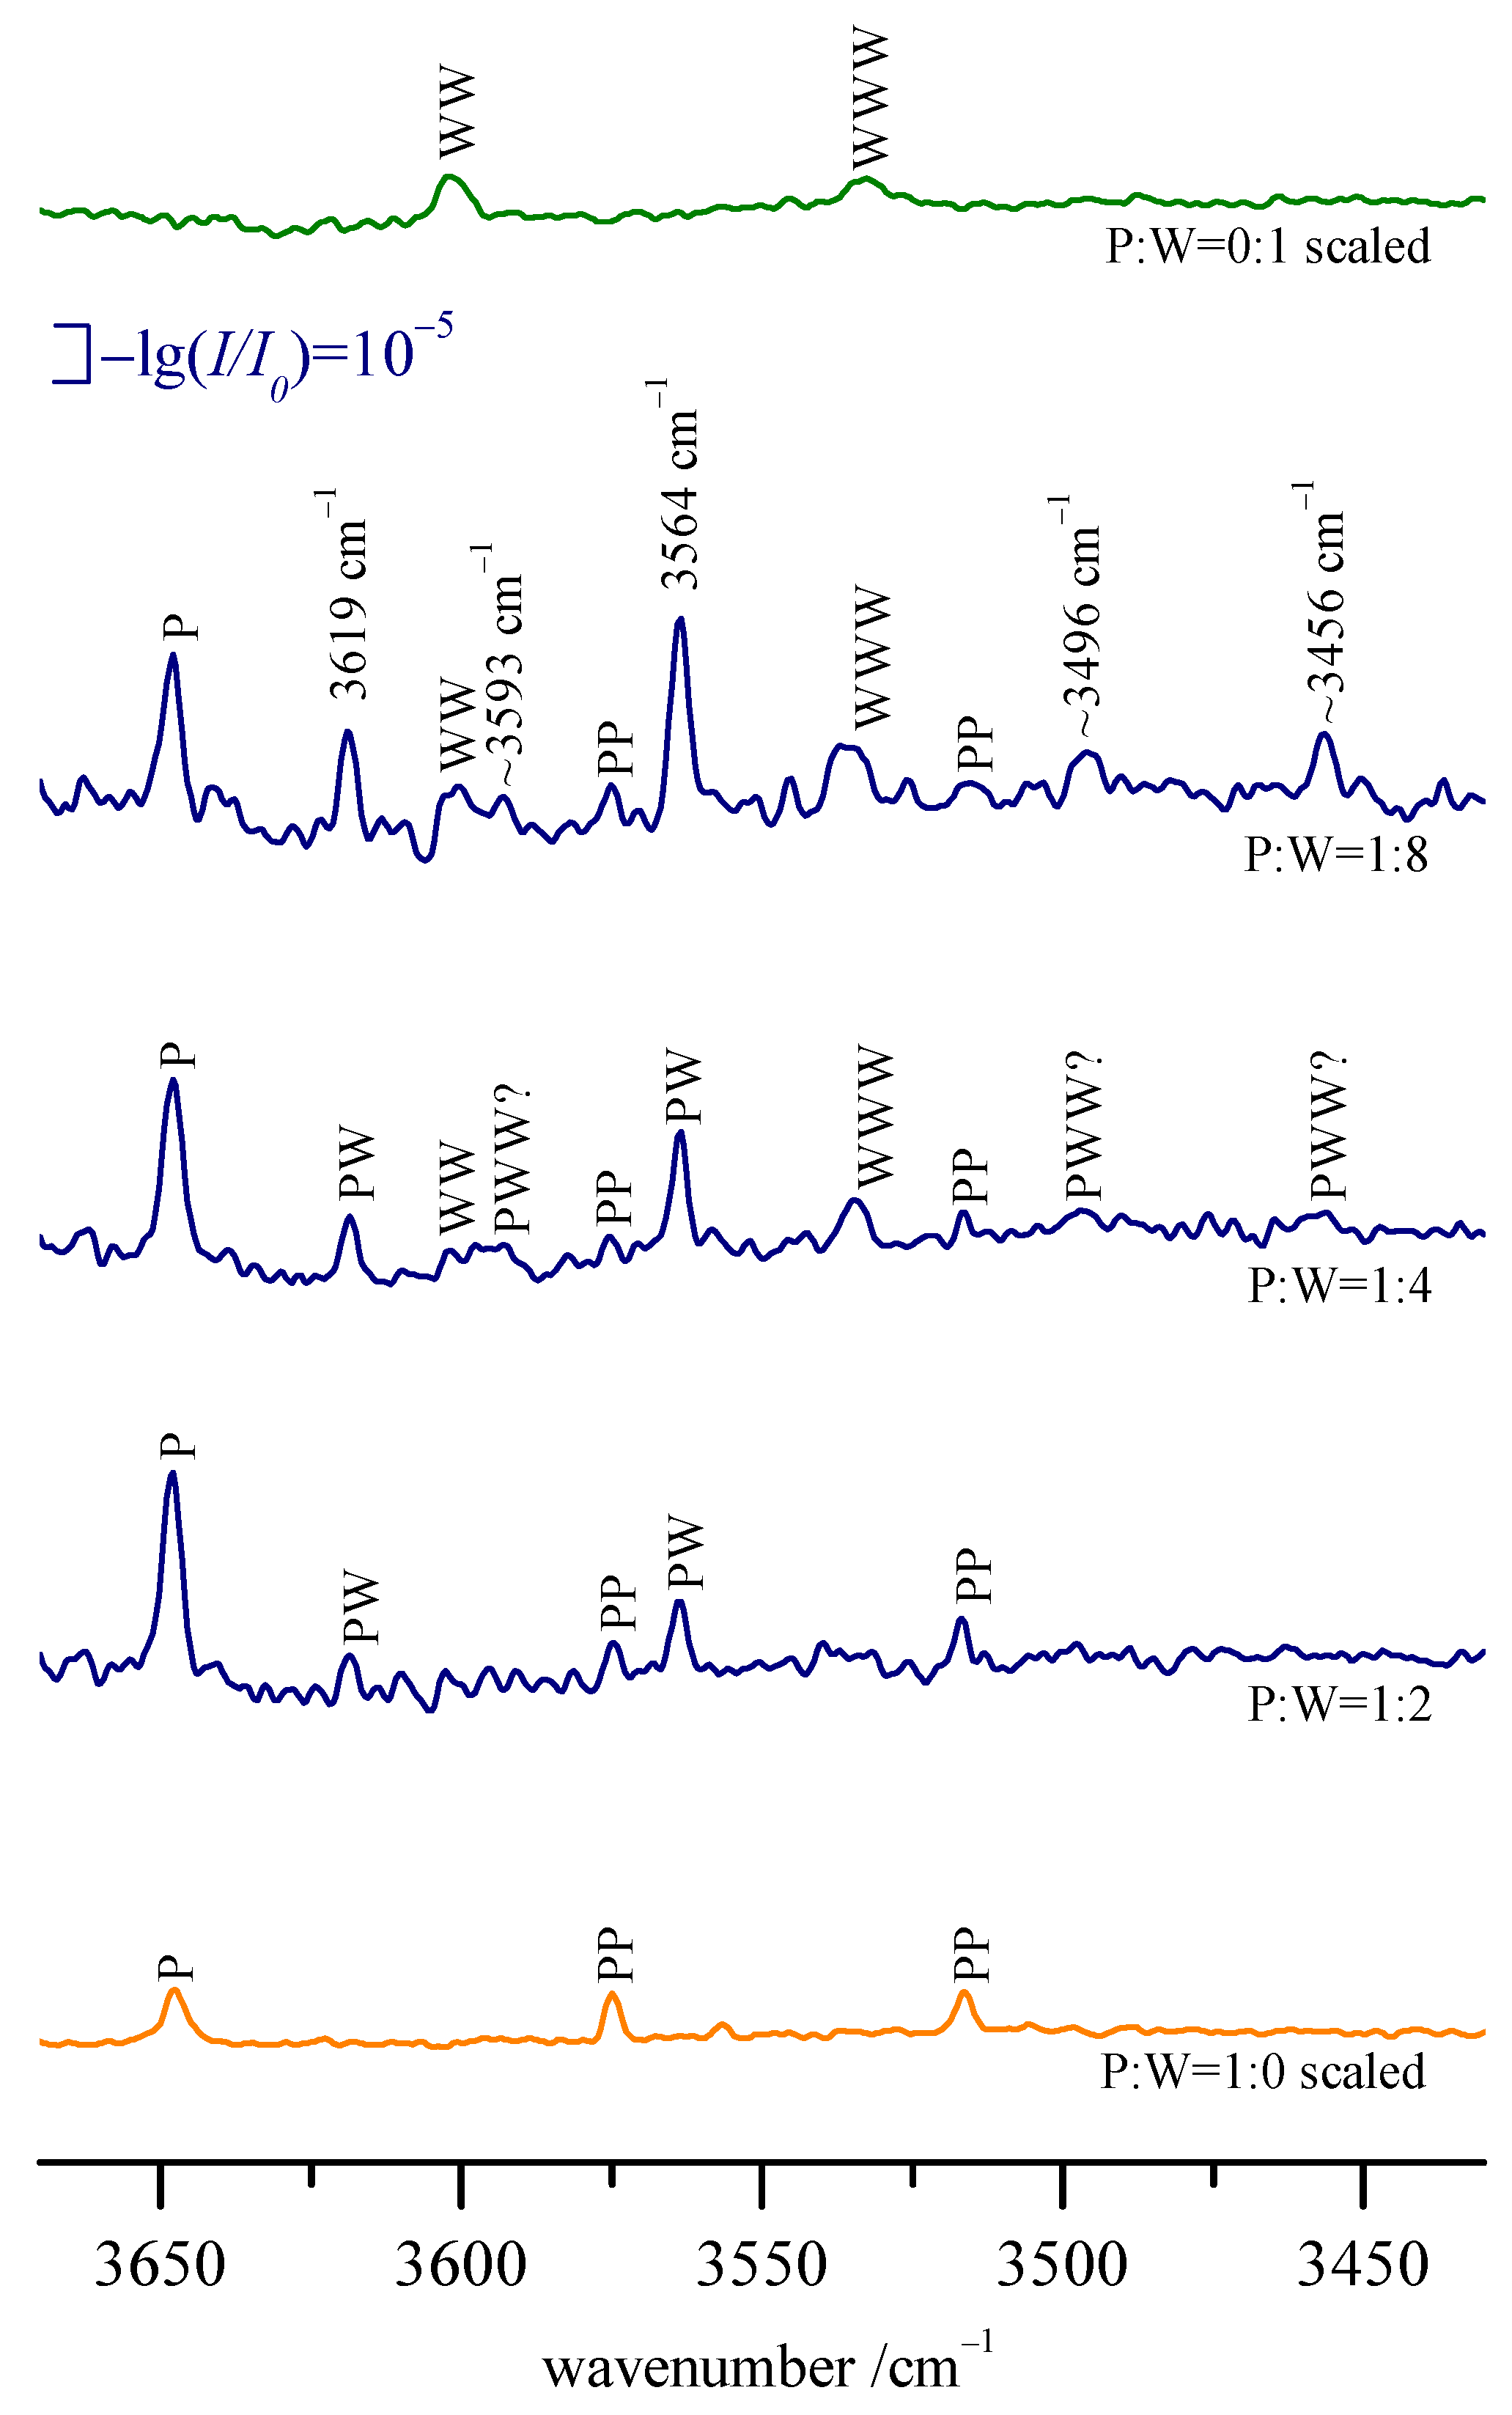
Panel (a) of
Figure 9 shows the OH and CH stretching ranges of the spectrum of MeOH+2FAP recorded at the
gratin jet (red) in comparison to a spectrum of 2FAP of similar concentration with water (blue), also recorded at the
gratin jet. As can be seen, the dimer bands of H
O with 2FAP (HA
and HA
) partially overlap with those of MeOH with 2FAP (MA
and MA
), thus subtly distorting the latter’s intensities. This is due to the similar spectral OH stretching position of methanol and water complexes of ketones [
31,
91]. Note that the water concentration in the H
O+2FAP spectrum in a) is significantly higher than in the corresponding MeOH+2FAP spectrum, as evidenced by the intensities of the water lines marked “H”. As a consequence, the intensities of the HA dimer bands in the H
O+2FAP spectrum are also higher than in the MeOH+2FAP spectrum.
To quantify the degree of distortion of the MA
and MA
band intensities by the water aggregates with 2FAP, difference spectra can be formed. For this, subsets of the H
O+2FAP and MeOH+2FAP spectra with similar water concentrations are selected from the complete spectra (
Figure 9b)). For the H
O+2FAP spectrum, the 200 scans with the lowest water concentration are used. Since the rate of the water increase was slower when recording the MeOH+2FAP spectrum, 700 scans of similar water concentration can be used for its subset. The difference spectrum (purple trace) results from subtracting the H
O+2FAP spectrum from the MeOH+2FAP spectrum. As evidenced by the absence of the water lines (H) in the difference spectrum, the water compensation works well, whereas 2FAP is slightly overcompensated. Bands specific to 2FAP, such as the carbonyl stretch overtone 2
and the CH stretch
, show small negative contributions to the difference spectrum.
By calculating the intensity ratio
/
of the mixed dimer bands, the influence of the water impurity can now be quantified. The ratio and its error are calculated as described in the
supplementary material (IR) of Ref. [
55]. However, instead of two researchers determining ratios based on integrations and peak heights independently, one researcher determines each ratio twice, using more narrow and wider bounds for the integrations, and peak heights with lower and upper bounds of the surrounding baseline as reference points.
Table 4 lists the resulting ratios for the full
filet jet spectrum of MeOH+2FAP (150 co-added scans), the corresponding full
gratin jet spectrum (1500 scans), and the difference spectrum described above. Compared to the esentially water-free reference spectrum recorded at the
filet jet, the
gratin jet spectrum displays a slightly lower intensity ratio, although the difference is not significant and lies within the error bars. The difference spectrum, for which the contributions of the water impurity were subtracted, shows an intensity ratio closer to the water-free reference, suggesting the reduction observed for the uncorrected
gratin jet spectrum may have a real, non-statistical component and be caused by the water impurity. Note, however, that the noise introduced by the small number of scans in the difference spectrum largely washes out this small effect. Nevertheless, this highlights the fact that the influence of the increasing water amount on relevant spectral features of the analyte mixture has to be analyzed carefully, if the gas-recycling operation of the
gratin jet setup is kept up over longer periods of time without refilling the reservoir.
The upside of the gas-recycling operation is the greatly reduced substance consumption (
vide supra). The data in
Table 4 illustrates this: While using less than a third of the amount of substance, 10 times more scans can be recorded at the
gratin jet, compared to the
filet jet. This leads to a reduction of the error bars by a factor of 3, again at less than 1/3 of the substance consumption, albeit at the price of a greatly increased time demand for the measurement and the possible distortion of the intensity ratio by the accumulating water impurity.
Table 5 compares some relevant parameters of the FTIR measurements and the cycle of gas pulse and recovery period at the
filet and the
gratin jets. The time for one scan, i.e., the IR spectroscopic measurement of the sample (the gas mixture in the supersonic expansion), at the
filet jet amounts to 100 ms with the typical settings for measurements in the OH stretching range (80 kHz,
single sided, resolution 2 cm
, InSb detector). At the
gratin jet, with the optimized settings for measurements in this spectral range, each scan takes 108 ms (140 kHz,
double sided, resolution 2 cm
, HgCdTe/InSb detector in sandwich operation). Despite this longer scan time, the duration of the gas pulse,
, could be shortened (133 ms) compared to the
filet jet (147 ms). This is due to an optimization of the pre-measurement time, which allows for the supersonic expansion to fully develop before the sample measurement starts (
vide supra). The shortened pulse also benefits the recovery period, i. e. the time needed for the pumps to reestablish a sufficiently low background pressure in the vacuum buffer before the next pulse. This applies despite the 17% longer slit nozzle in the
gratin jet experiment. The total real-time for a complete cycle of helium gas pulse, measurements, and recovery time could be reduced by nearly 10%, from 31 s at the
filet jet to 28 s at the
gratin jet. As a result, the duty cycle (
/
) increases from 0.32% to 0.39%.
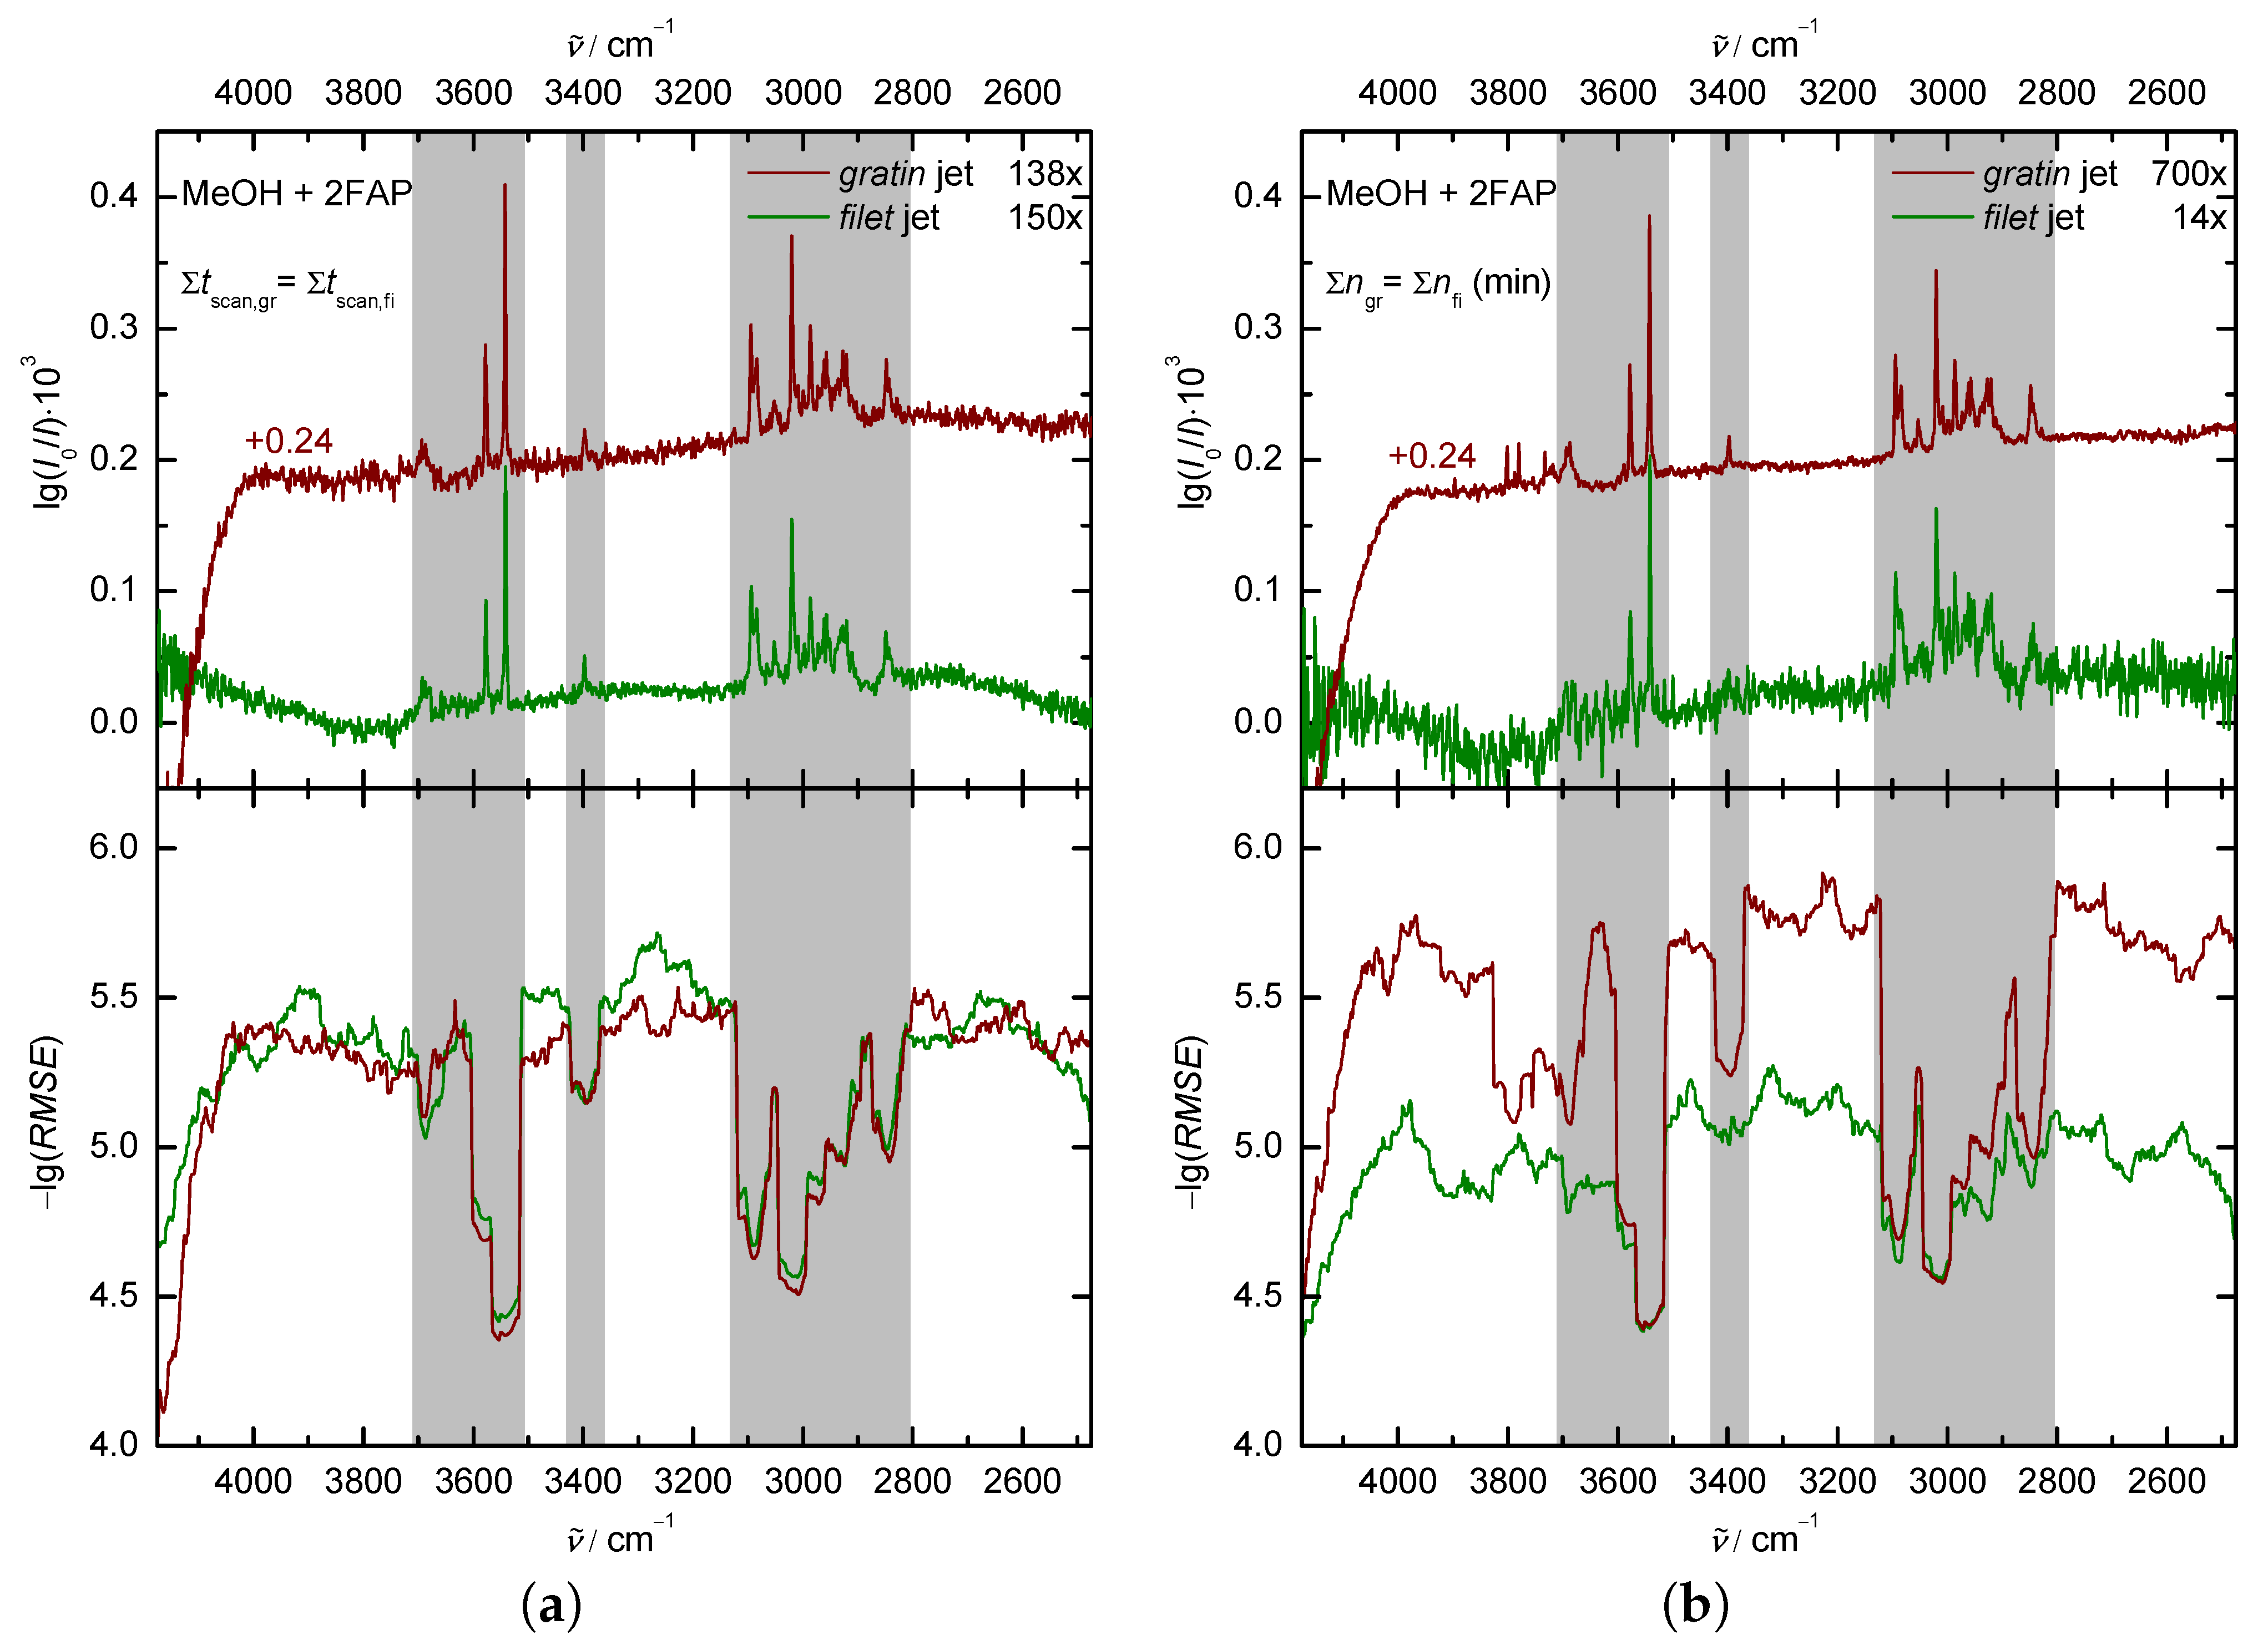
To further compare the performance of the new gratin jet and the existing filet jet, the noise level in the example jet spectra of MeOH+2FAP in He can be analyzed. Since the two setups are not fully equivalent regarding the scan time per pulse, real-time per pulse, or substance consumption per pulse, a comparison of spectra with the same number of co-added spectrometer scans (and thus gas pulses) is not meaningful. Instead, we “scale” the gratin and filet jet spectra to the same value for one of those three quantities by taking a suitable subset of the recorded gas pulses.
The least advantageous comparison for the
gratin jet is at the same total scan time,
, since the improvements regarding duty cycle, and—more importantly—substance consumption are ignored for this comparison. Due to the scan time per pulse being longer at the
gratin jet, only the first 138 pulses of the
gratin jet spectrum can be used to reach the same total scan time (15 s) as in the full
filet jet spectrum (150 pulses). The upper panel of
Figure 10a) displays the according spectra of MeOH+2FAP in He, measured at the
gratin (red) and
filet jet (green). For the quantitative comparison of the noise level, the regions of the spectrum occupied by analyte bands can of course not be used (grey areas). However, signals of unwanted impurities such as water are counted as noise. As a measure of the noise level, we again use
(see
Section 3.1). The lower panel of
Figure 10a) shows this quantity for both spectra. Overall, the
filet jet offers a slightly better noise level per scan time than the
gratin jet, especially between 3500 and 3100 cm
. This might be blamed on the sum of many subtle differences between the two jet spectrometers, such as the optical and scanner setup, the optical transmission, the beamsplitter properties, the electronic filtering and digitization, the scanning method, the detector and preamplifier response, electronic or mechanical perturbations, to name a few. It is partly offset by a larger absorption signal due to the longer slit nozzle and should not be considered very significant.
This changes drastically if all of the improvements of the
gratin over the
filet jet setup are taken into account by comparing at the same substance consumption,
.
Figure 10b) shows the comparison between
gratin (red) and
filet jet (green) for the lowest possible substance consumption at the
gratin jet (one filling of the reservoir). With this amount of substance, 700 scans of individual gas pulses can be recorded at the
gratin jet, compared to only 14 scans at the
filet jet (
vide supra). As expected, this leads to a significantly better noise level in the
gratin jet spectrum, as is visible in the
values as well as in the spectrum itself. However, if the jet water lines are classified as unwanted noise, the noise level in the vicinity of these lines is aggravated almost to the
filet jet level. This again highlights the fact that individual compromises between the highest possible savings regarding substance consumption (longest possible gas recycling duration) and the tolerable amount of water accumulation has to be found at the
gratin jet. Further comparisons between
gratin and
filet jet performance can be found in the
Supplementary Materials repository for this article [
92].


 ,
, 


