Article

Multipulse Optical-Rectification-Based THz Source for Accelerator Applications

Department of Physics and Astronomy, University of California at Los Angeles, 475 Portola Plaza, Los Angeles, CA 90095, USA
*
Author to whom correspondence should be addressed.
Instruments 2023, 7(4), 39; https://doi.org/10.3390/instruments7040039
Submission received: 30 September 2023 / Revised: 26 October 2023 / Accepted: 28 October 2023 / Published: 9 November 2023

Abstract

:
THz sources offer the potential for higher frequencies and higher breakdown thresholds in accelerating structures in comparison with conventional RF sources. They also benefit from larger field strengths, field gradients, better beam synchronization and compactness. In this work, we first present the development of a 49 μ J single-cycle THz source centered at 0.6 THz that provides fields over 30 MV/m. With further modifications, multicycle pulses were produced, narrowing the bandwidth of the source and potentially easing the coupling of THz radiation to relativistic electron beams and increasing the usability in other areas of research.

1. Introduction

THz sources provide strong electric fields at higher frequencies than conventional RF sources. The breakdown thresholds inside structures allow for accelerating gradients that cannot typically be achieved through RF fields while maintaining compact structures [1,2,3,4,5]. The challenge of achieving high peak fields is being overcome through increasing efforts [6,7,8,9,10,11,12], opening up promising applications of THz sources in accelerator science [13,14,15,16]. With laser-based THz sources, the electron bunches and THz pulses can be generated by a single-laser system, eliminating temporal jitter when coupling the radiation to the beam. This simplifies beam synchronization significantly, providing a key advantage in comparison with RF sources. In this work, we first present the recent development of a high-power THz source at the UCLA Pegasus laboratory, followed by the diagnostics used to characterize the THz pulses. We then discuss a scheme to narrow the bandwidth by pumping the source with an infrared pulse train, creating multicycle THz pulses.

2. THz Source

Optical rectification is the process in which a short optical multicycle visible or near-infrared laser pulse becomes rectified, producing lower-frequency single-cycle pulses. This effect occurs in nonlinear media in which the bound electrons lie in an asymmetric potential well. Excitation of these electrons offsets the center of motion of the particles, creating a quasi-DC polarization in the medium that is on the timescale of the envelope of the pump pulse [7]. In Fourier space, this DC polarization can be quantified as [17]
P NL ( Ω ) = χ ( 2 ) E ( ω ) E ( ω + Ω ) d ω ,
in which χ ( 2 ) is the nonlinear coefficient of the medium, E , ω the electric field and frequency of the pump pulse and Ω the frequency at THz levels. The THz fields are then obtained by solving Maxwell’s equations in the polarized medium [17].
Stoichiometric Mg:LiNbO 3 (LN) is a nonlinear medium that provides optical-rectifying properties with a relative high nonlinear coefficient and high damage thresholds compared with other crystals. Cooling to < 100 K can furthermore increase the infrared light (IR) to THz conversion efficiencies by nearly a factor of two due to the suppression of phonon absorption at low temperatures [6,7,17,18]. One problem with LN is the strong difference in the group velocity of IR pump pulses and the phase velocity of the generated THz fields ( n g r IR 2 , n THz 5 ), causing incoherent pulse buildup and lower pump to THz conversion efficiencies [7,17,18].

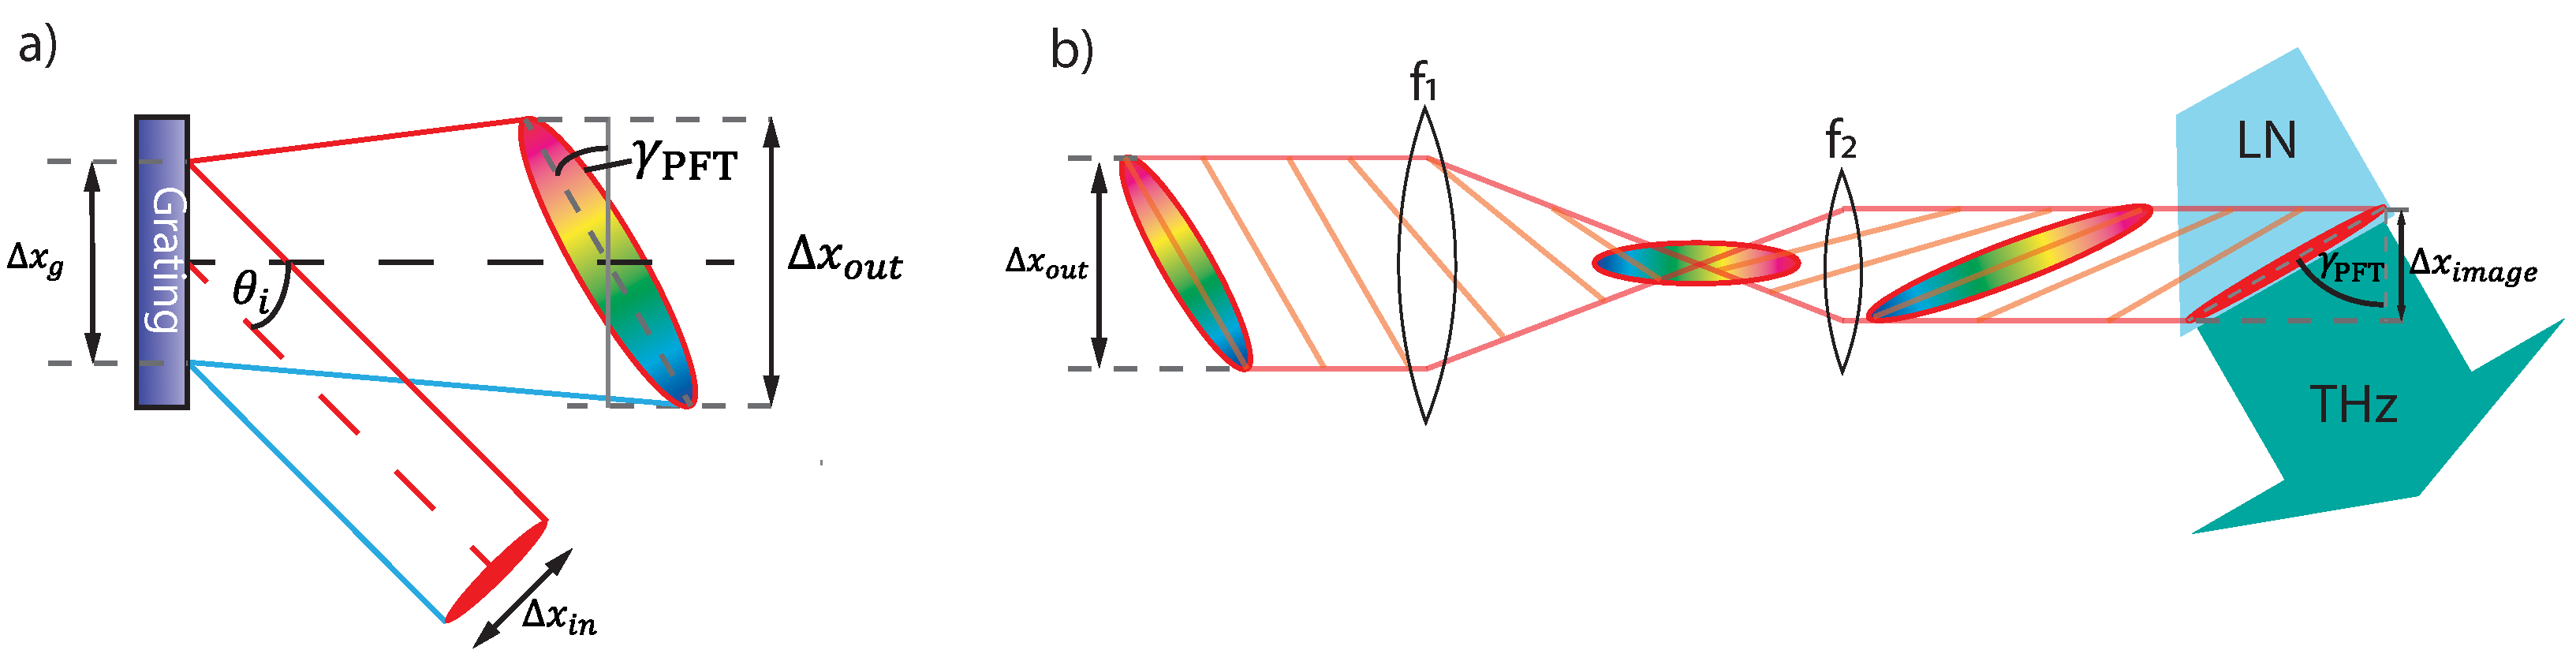
2.1. Tilted Pulse Fronts

In order to combat the issue of phase mismatch, one can use tilted pulse fronts in which the pulse front is tilted in respect to its propagation direction, causing the pump velocity and THz velocity to be matched. Pulse-front tilts (PFTs) can be obtained with a grating imaging system, as depicted in Figure 1. The non-zero-order reflections off the grating have a temporal delay across the transverse profile of the pulse, creating a PFT that is described mathematically as
sin ( θ i ) + sin ( θ d ) = m λ 0 d ,
tan ( γ PFT ) = λ 0 M n IR gr d cos θ d ,
in which γ PFT is the PFT angle in respect to the transverse plane, and θ i , θ d are the incoming and outcoming angles off the grating with grating line separation d. λ 0 describes the central pump laser wavelength and n IR gr the group refractive index of the pump inside LN. Additionally, a group-delay dispersion (GDD) is induced, creating longitudinal stretching of the pulse and weakening of the pump field. To compensate this pulse stretching, the grating can be imaged within the LN crystal, recombining all the rays to a compressed pulse [7,18].

2.2. Optical Setup

For calculating the pump pulse at the imaging plane, standard 2 × 2 ray-transfer matrices give the magnification of our pulse, but to further examine broad-bandwidth short pulses, we extend the ray vector to ( x , θ , ν , t ) with frequency ν and time t and use 4 × 4 Kostenbauder matrices. These matrices include dispersive behavior for extensive pulse propagation though optics and are used to analyze the spot size, pulse length and PFT of our pulse at any given position within our imaging system [19].
At the UCLA Pegasus laboratory, 785 nm, 130 fs laser pulses are obtained from a chirped-pulse-amplified Ti:Sa laser with variable energies between 1 and 30 mJ that are used to pump the LN crystal. The phase-matching condition for the PFT is calculated to be 62 . 8 at 293 K and 61 . 4 at 82 K from the refractive indices [20,21]. To generate the PFT, we use a 830 lines/mm ruled grating with a measured efficiency of 70% for our first-order reflection. In order to reduce optical aberrations at the imaging plane, the outgoing angle off the grating is set to 0 [22], which fixes our PFT to the magnification as the sole adjustable variable (3). This is determined to be M = 0.147 at room temperature and 0.156 for a cooled LN crystal. Using a single lens for imaging creates challenges, as the imaging plane and magnification change simultaneously with the position of the lens. A two-lens system allows for an adjustable magnification at arbitrary imaging planes, allowing us to fix the crystal position while tuning. Furthermore, we can choose the two lenses and distance between them to be close to a Kepler telescope, which keeps the desired magnification constant. This results in a very slow change in the PFT through the imaging plane compared with a one-lens system, as depicted in Figure 2, reducing the sensitivity of the optical system.
The optical setup for our source is presented in Figure 3. We select the lenses to be f 1 = 500 mm and f 2 = 75 mm, which for an ideal telescope give a magnification of M = f 1 / f 2 = 0.15 , close to the desired magnification of 0.147 at room temperature. The setup is on a transportable breadboard, requiring folding of the path but enabling easy transportation of the setup next to the accelerator for future experiments. Half-wave plates (HWP) are placed before the grating for optimizing the polarization-dependent reflection and then after to reorient the polarization for stronger generation efficiencies. The Ti:Sa laser outputs a beam with a 1 / e 2 waist of w = 11 mm. After our optics, this waist is magnified down to w im = 1.65 mm at the imaging plane. To further utilize the 9 × 9 mm 2 crystal surface, a cylindrical lens f y = 75 mm is placed in the path that changes the spot size in the non-PFT axis to pump with higher pulse energies and maintain optimum fluence. The change in optical path length due to the refractive index and thickness of the cylindrical lens is compensated by small adjustments in the lens positions of the spherical lenses. For collection of the THz radiation, we use Teflon and TPX lenses. While they are less efficient at propagating THz pulses (80–90%) compared with off-axis parabolic mirrors (OAP), they are more compact and provide significantly less aberrations under small misalignment.

2.3. THz Generation Results

For THz pulse energy measurements, we use a calibrated custom GenTec SDX-1121 pyro-electric detector and adjust the pump pulse energies between 1 mJ and 5 mJ. The pump fluence is then calculated, knowing the magnification of our optical system. This allows us to obtain THz generation efficiencies for a given pump fluence, after factoring out the lens losses for a room-temperature and cooled setup. Efficiencies up to 0.78% were recorded and the results are depicted in Figure 4. With a cylindrical lens in place and higher pump energies of up to 10 mJ, 30 μ J THz pulse energies were recorded. After factoring out the losses, this would result in a generated pulse energy of 49 μ J and efficiency of 0.49 % . The lower efficiency is believed to be the result of aberrations induced by the cylindrical lens or change in THz propagation due to the larger THz spot size.

3. THz Pulse Characterization—Electro-Optic Sampling

While pyro-electric detectors, as most THz detectors, provide a characterization of pulse energy, they lack accurate temporal and spectral information. For this, we rely on the method of electro-optic sampling.
Electro-optic crystals are materials in which a birefringence Δ n is induced by an external electric field. This field can then be probed by measuring the induced phase retardation Γ between the polarization components of a short IR probe pulse. The EO-crystal zinc telluride (ZnTe) cut in the (110) plane is sensitive to electric fields of THz frequencies up to 4 THz, with the birefringence and associated phase retardation being proportional to the electric field [23]. The probe pulse is obtained from the same laser system used for THz generation, allowing precise synchronization between the probe beam and THz fields. The effect is maximized for a normally incident THz pulse orthogonally polarized with respect to the (001) axis of the crystal such that the index ellipsoid eigenvectors align at 45 with respect to electric field direction. The probe pulse must then be parallel or orthogonal to the THz electric field to optimally probe the induced birefringence, creating a phase retardation that can be written as [24,25]
Γ = 2 π L n 0 3 r 41 λ T ZnTe E THz E THz E cal
in which L = 0.2 mm is the crystal length, n 0 = 2.85 is the refractive index of ZnTe at λ = 785 nm and r 41 = 4 × 10 12 m/V is the EO coefficient of ZnTe [23]. The correction coefficient T ZnTe includes the Fresnel losses and absorption and dephasing effects that can be assumed to be constant below 2 THz at T ZnTe 0.45 [23]. In practical units, Equation (4) implies that an applied field of E cal = 13.6 MV/m induces a 1 rad phase shift.
In the simplest case, one can use a polarizer after the crystal, perpendicularly oriented to the incoming polarization of the IR beam so that no light is transmitted in the absence of THz radiation, as seen in Figure 5b. With an electric field present, the IR picks up the EO-induced phase shift, changing its polarization and allowing light to be transmitted. While the signal-to-noise (STN) ratio is maximal in this cross-polarized scheme [26], the drawback is that the measurement is insensitive to the sign of Γ and the applied electric field.
In order to obtain sign information, a balanced detection scheme can be used, as presented in Figure 5c. Here, a quarter waveplate (QWP) is inserted after the ZnTe crystal with the fast axis oriented 45 with respect to the probe beam to create circular polarization. A Wollaston prism is then used after the EO crystal to split the two polarization components of the probe beam to be detected separately. The EO signal can then be measured looking at the difference between the IR intensities in the two polarizations.
In both cases, the relation between detected intensity and induced phase shift Γ can be evaluated using Jones matrices yielding, respectively,
I det cross ( Γ ) = I 0 2 ( 1 cos Γ )
I det bal ( Γ ) = I 0 sin Γ
in which I 0 is the input intensity of the probe laser.
For our setup, we split off 8% of the IR pulse with a Pellicle Beamsplitter that is then propagated through a delay stage and overlapped with the THz fields using another Pellicle Beamsplitter and copropagated through the ZnTe crystal, as shown in Figure 3. We then image the ZnTe crystal onto a CCD sensor to retrieve transverse spot size information. The delay stage allows us to adjust the arrival time of the ultrashort probe pulse (130 fs-FWHM) and scan through the temporal profile of the ps scale THz pulse, as presented in Figure 5a. With the cross-polarized scheme, we observed peak phase shifts of 1.6 rad, indicating fields over 30 MV/m, as depicted in Figure 6, causing saturation in the balanced detection scheme where phase shifts over π / 2 cannot be detected, as indicated by (6). The average phase shift over the entire image is plotted for different time delays in the crossed and balanced detection scheme, giving us the temporal profile of the THz pulse shown in Figure 7. We obtain the spectral information by performing a Fourier transform on the temporal profile presented in Figure 7c. Large absorption lines appear in the spectrum at first but can be explained by multiple reflections of the THz within the ZnTe. The reflections appear in the Fourier transform as a factor of ( 1 + r 2 e i Ω t 0 ) with Fresnel reflection coefficient r, frequency Ω and delay t 0 = L × c / n . With known ZnTe reflection parameters, this term can be filtered out, and the temporal profile is reconstructed, removing the observed reflection in the profile and giving a more accurate pulse description. From Figure 7, we characterize our pulse to have an rms length of 2.3 ps and center frequency of 0.57 THz and peak frequency of 0.29 THz, with an rms bandwidth of 0.4 THz. The transverse profile is depicted in Figure 6 and indicates a spot size of 4.8 mm 2 .

4. Bandwidth-Narrowing Pulse Trains

Single-cycle broad bandwidth pulses are very useful for all applications where the maximum field amplitude is desired but, at the same time, suffers from large dispersion effects in any optical system, causing stretching of the pulse and therefore weakening of the fields. Moreover, they might be mismatched to final end-use if the application has a final acceptance bandwidth. To combat this, one can modify the optical rectification scheme to generate multicycle THz pulses by pumping the LN crystal with a train of IR pulses, creating a more narrowband spectrum, which would naturally suffer less from pulse stretching, for example, when coupling to small accelerating structures [27,28].

4.1. α -BBO Crystals

One approach of generating pulse trains is using strong birefringent crystals [29] such as α -BBOs with an ordinary refractive index of n o = 1.665 and an extra-ordinary one of n e = 1.544 [30]. With significant crystal thickness, a pulse polarized 45 to both axes is split into two pulses, separately polarized along the main axes of the crystal with a relative delay to each other of
Δ t = d × n o n e c d × 0.403 ps mm ,
in which d is the crystal thickness and c the speed of light. Using an array of crystals, each one of them oriented 45 to the previous crystal, a series of pulse splitting effects occur, generating 2 n pulses, with n being the number of α -BBOs. The IR pulse train then produces a series of THz pulses within the crystal, yielding multicycle THz pulses.
Given the electric field of a single-cycle pulse E THz ( t ) , a pulse train can be modeled as
E THz train ( t ) = m = 0 M E THz ( t m Δ t ) ,
in which Δ t is the temporal separation between the pulses and M = # pulses 1 . In Fourier space, FT ( f ( t t 0 ) ) = F T ( f ( t ) ) × exp ( i ω t 0 ) , and therefore the spectral profile of a pulse train can be described as
E ˜ THz train ( Ω ) = E ˜ THz ( Ω ) × m = 0 M e i Ω m Δ t ,
m = 0 M e i m Ω Δ t = sin ( ( M + 1 ) Ω Δ t / 2 ) sin ( Ω Δ t / 2 ) × e i ( M 1 ) Ω Δ t / 2
which changes the spectrum and narrows the bandwidth when taking the absolute value.

4.2. Two-Cycle THz Pulse

At first, we present the results of a two-pulse THz generation in which we place a single 17.4 mm α -BBO on the pump path after the Pellicle Beamsplitter (see Figure 3) at 45 with respect to the IR, creating a temporal delay between the two polarization’s of 7 ps. This crystal position avoids pulse splitting of the probe path, allowing for accurate EOS diagnostics. Due to the small aperture of the crystal (10 mm diameter) with respect to the pump ( 1 / e 2 -waist: 11 mm), we expect an energy loss of 60%. Additionally, the polarization change in the pulse causes 50% loss, resulting in only 20% of the original pulse energy. Nevertheless, the electric fields of the two-cycle pulse were sufficient enough to measure out the temporal profile through EOS, as presented in Figure 8. We observe a second pulse, 7.2 ps, delayed from the first pulse, closely equal in amplitude and shape. The Fourier transform shows frequency amplifications at multiples of 0.14 THz with dips in between that reach values close to zero.

4.3. Eight-Cycle THz Pulse

For further bandwidth narrowing, we can split the pulse twice more, using an 8.7 mm and 4.35 mm thick α -BBO, giving us a total of eight pulses separated by 1.75 ps. To avoid the strong aperture losses reported in Section 4.2, we place the three crystals between the amplifier and compressor of our CPA Ti:Sa laser system. The IR pulse after the amplifier is stretched and small in spot size but then gets expanded by a telescope to lower the fluence and protect the grating compressor from damage. Placing the crystals at this position has the advantage that the stretched pulse has weaker fields, attenuating nonlinear effects in the crystals but also allowing for our small aperture crystals to be implemented due to the smaller beam waist. The pulse compression is then slightly adjusted to compensate for the chirp induced by the long crystals. There are also drawbacks to placing α -BBOs before the compressor. First, the crystals are at a greater risk of damage due to the high fluence levels at this point. Second, generating pulse trains before splitting off the probe beam for EOS results in a train of probe pulses, which complicates the diagnostics. We measure a total of 75% transmission compared with the previous output, which is in agreement with cascading the effects of 90% transmission from each crystal. After orienting all the α -BBOs to 45 of each other, we note a 50% loss due to the strong polarization dependency of the compressor gratings, yielding a total output of only 36% of the original laser power.
Before diving into the results of this eight-cycle pulse generation, we discuss the effects of having a pulse train probe on our electro-optic sampling diagnostics.

Electro-Optic Sampling—Pulse Train Adjustments

To approach the challenge of pulse trains along the probe line, let us extend Equation (6) to the more accurate model in which the detected intensity I det is a convolution of the probe pulse intensity I ( t ) and sin Γ ( t )
I det ( t ) = I ( t τ ) sin Γ ( τ ) .
In the case of a single ultrashort probe pulse I ( t ) I 0 δ ( t ) , we retrieve (6) back. If we replace the single pulse by a train of pulses, the detected intensity profile becomes
I det train ( t ) = m = 0 M I 0 sin Γ ( t + m Δ t ) ,
I ˜ det train ( Ω ) = I 0 sin Γ ( Ω ) m = 0 M e i Ω Δ t ,
as presented in Figure 9. In theory, the sum in Equation (13) can be factored out, but it also contains zeros for every Ω = 1 / Δ t , leading to inaccurate pulse reconstruction when signal noise is present. Nevertheless, we can analyze and understand multicycle pulses by comparing them with our model.

4.4. Pump Analysis—Autocorrelation

Before generating multicycle THz pulses, it is helpful to independently analyze the IR pulse train and optimize the α -BBO orientation. We transport the pulse train through an existing UV generation line that is depicted Figure 10.
Similar to an autocorrelator, we adjust the delay along the IR stage, causing the number of IR pulses overlapping with the number of blue pulses to change, resulting in a varying UV pulse energy depending on the stage position. The strongest signal is detected when all the blue and IR pulses overlap and the weakest when only one pulse of each overlap, as can be seen in Figure 11. This gives us information of the temporal spacing between the pulses and allows us to optimize the α -BBO orientation to create a maximally uniform pulse distribution.

Eight-Cycle Pulse Results

After analyzing the IR pulse distribution, we propagate the pulse train to our THz source, depicted in Figure 3. Due to additional losses of our optics, we pump the crystal with a 2.4 mJ eight-pulse train at a fluence level of 490 J/m 2 , corresponding to 61 J/m 2 per pulse within the train. We detect 1.3 μ J THz pulses with the pyro-electric detector, corresponding to approximately 2 μ J pulses after including lens and window losses, yielding a conversion efficiency of 0.083%. This result is consistent with the low-incident fluence on the crystal, assuming a linear dependence on the efficiency until saturation effects start appearing [18], and it is in agreement with other measurements performed with similar laser parameters [31].
The electro-optic sampling scan shown in Figure 12 yields a signal with 15 peaks and is in good agreement with the UV autocorrelator data points, even though small deviations are expected due to pulse-to-pulse interference within the THz profile that would not appear in the UV generation process. The spectrum shows a strong amplification around 0.58 THz and estimated bandwidth of ∼85 GHz FWHM for the produced THz pulse based off comparison between the observed bandwidth and model. While in theory the pulse can be reconstructed by factoring out the sum in Equation (13), this has to be performed carefully, as the filtering function has zero values at frequencies where the THz pulse train spectrum is not zero. In a real experimental signal, there are small imperfections in the pulse train, as seen in Figure 11, which can be attributed to small rotational errors of the α -BBO crystals that potentially lead to large noisy spikes in the reconstructed signal.
While the overall energy is nearly one order of magnitude lower in the multicycle case than the single-pulse excitation, it is important to compare the spectral amplitude obtained in the two cases. Even though a full reconstruction of the THz waveform in the eight-cycle pulse case is still ongoing, estimates on the electric field amplitude at a given frequency can be made by normalizing the measured spectra (after taking into account the filtering effect of the multicycle IR probe) to the measured energy. For the eight-cycle data set, we find S norm ( 8 ) ( 0.57 THz ) = 21 · 10 18 J/Hz (i.e., 2.1 μ J in 100 GHz bandwidth) for the energy spectral density, while for the uncooled single-cycle spectrum, we obtain S norm ( 1 ) ( 0.57 THz ) = 6.76 · 10 18 J/Hz, indicating an overall increase in energy spectral density of more than a factor of 3 and of nearly 40 % when comparing with the peak frequency value of the single-cycle case S norm ( 1 ) ( 0.3 THz ) = 15.2 · 10 18 J/Hz. This is impressive considering that the energy fluence illuminating the nonlinear crystal in the eight-cycle case is significantly lower with respect to the single-cycle case.

5. Discussion

We developed a THz source that yields field strengths over 30 MV/m and can further be increased with stronger focusing optics. With an increase in pump energy, while maintaining optimum fluence, we reached THz pulse energies of up to 49 μ J. At 0.78% generation efficiency, we are approaching state-of-the-art generation efficiency achieved with lithium niobate crystals [6], allowing potential THz-based beam manipulation experiments to be optimally implemented. Producing multicycle THz pulses has successfully narrowed the bandwidth and increased the spectral amplitude, reducing dispersive effects in coupling structures. The feasibility for accelerator applications is limited though, as the generation of a train of IR pulses reduces the pump intensity and therefore the conversion efficiency. To quantify this further, we investigate the pump energies that our source can tolerate before dropping in efficiency. The highest pump energy for our source with cooling and cylindrical lens implementation is 7 mJ, for a total crystal surface area slightly smaller than 1 cm 2 before the conversion efficiency decreases. Given that our laser outputs 30 mJ for a single pulse and our method of pulse splitting results in 50% losses through the compressor gratings, we would be limited to two-cycle pulses with 14 mJ total energy to avoid losing THz conversion efficiency. For our room-temperature source, the most efficient pump energies appear to be closer to 3.5 mJ, and a train of four pulses could be implemented to pump the crystal before losing efficiency. Nevertheless, we showed that even at lower conversion efficiency, there is a significant increase in energy spectral density in the multicycle case, which could be beneficial to a variety of applications where the bandwidth and spectral amplitude of the source are crucial.

Author Contributions

Work, M.L.; supervision, P.M. All authors have read and agreed to the published version of the manuscript.

Funding

This work was supported by NSF grant PHY-1734215 and DOE grant No. DE-SC0009914.

Data Availability Statement

Data underlying the results presented in this paper are not publicly available at this time but may be obtained from the authors upon reasonable request.

Acknowledgments

We would like to thank Tobias Kroh from DESY for his valuable input in developing the source.

Conflicts of Interest

The authors declare no conflict of interest.

Abbreviations

The following abbreviations are used in this manuscript:
IRInfrared
UVUltraviolet
LNMg:LiNbO 3
ZnTeZinc Telluride
EOSElectro-Optic Sampling

References

  1. Kilpatrick, W. Criterion for vacuum sparking designed to include both rf and dc. Rev. Sci. Instrum. 1957, 28, 824–826. [Google Scholar] [CrossRef]
  2. Wang, J.; Loew, G. Rf breakdown studies in copper electron linac structures. In Proceedings of the 1989 IEEE Particle Accelerator Conference, Accelerator Science and Technology, Chicago, IL, USA, 20–23 March 1989; pp. 1137–1139. [Google Scholar]
  3. Thompson, M.; Badakov, H.; Cook, A.; Rosenzweig, J.; Tikhoplav, R.; Travish, G.; Blumenfeld, I.; Hogan, M.; Ischebeck, R.; Kirby, N.; et al. Breakdown limits on gigavolt-per-meter electron-beam-driven wakefields in dielectric structures. Phys. Rev. Lett. 2008, 100, 214801. [Google Scholar] [CrossRef]
  4. Dal Forno, M.; Dolgashev, V.; Bowden, G.; Clarke, C.; Hogan, M.; McCormick, D.; Novokhatski, A.; Spataro, B.; Weathersby, S.; Tantawi, S.G. Experimental measurements of rf breakdowns and deflecting gradients in mm-wave metallic accelerating structures. Phys. Rev. Accel. Beams 2016, 19, 051302. [Google Scholar] [CrossRef]
  5. Wu, X.; Shi, J.; Chen, H.; Shao, J.; Abe, T.; Higo, T.; Matsumoto, S.; Wuensch, W. High-gradient breakdown studies of an X-band Compact Linear Collider prototype structure. Phys. Rev. Accel. Beams 2017, 20, 052001. [Google Scholar] [CrossRef]
  6. Zhang, B.; Ma, Z.; Ma, J.; Wu, X.; Ouyang, C.; Kong, D.; Hong, T.; Wang, X.; Yang, P.; Chen, L.; et al. 1.4-mJ high energy terahertz radiation from lithium niobates. Laser Photonics Rev. 2021, 15, 2000295. [Google Scholar] [CrossRef]
  7. Hebling, J.; Stepanov, A.; Almási, G.; Bartal, B.; Kuhl, J. Tunable THz pulse generation by optical rectification of ultrashort laser pulses with tilted pulse fronts. Appl. Phys. B 2004, 78, 593–599. [Google Scholar] [CrossRef]
  8. Dhillon, S.; Vitiello, M.; Linfield, E.; Davies, A.; Hoffmann, M.C.; Booske, J.; Paoloni, C.; Gensch, M.; Weightman, P.; Williams, G.; et al. The 2017 terahertz science and technology roadmap. J. Phys. Appl. Phys. 2017, 50, 043001. [Google Scholar] [CrossRef]
  9. Vicario, C.; Ovchinnikov, A.; Ashitkov, S.; Agranat, M.; Fortov, V.; Hauri, C. Generation of 0.9-mJ THz pulses in DSTMS pumped by a Cr: Mg2SiO4 laser. Opt. Lett. 2014, 39, 6632–6635. [Google Scholar] [CrossRef]
  10. Pálfalvi, L.; Fülöp, J.; Almási, G.; Hebling, J. Novel setups for extremely high power single-cycle terahertz pulse generation by optical rectification. Appl. Phys. Lett. 2008, 92, 171107. [Google Scholar] [CrossRef]
  11. Vicario, C.; Monoszlai, B.; Hauri, C.P. GV/m single-cycle terahertz fields from a laser-driven large-size partitioned organic crystal. Phys. Rev. Lett. 2014, 112, 213901. [Google Scholar] [CrossRef]
  12. Wu, X.j.; Ma, J.l.; Zhang, B.l.; Chai, S.s.; Fang, Z.j.; Xia, C.Y.; Kong, D.y.; Wang, J.g.; Liu, H.; Zhu, C.Q.; et al. Highly efficient generation of 0.2 mJ terahertz pulses in lithium niobate at room temperature with sub-50 fs chirped Ti: Sapphire laser pulses. Opt. Express 2018, 26, 7107–7116. [Google Scholar] [CrossRef] [PubMed]
  13. Huang, W.R.; Fallahi, A.; Wu, X.; Cankaya, H.; Calendron, A.L.; Ravi, K.; Zhang, D.; Nanni, E.A.; Hong, K.H.; Kärtner, F.X. Terahertz-driven, all-optical electron gun. Optica 2016, 3, 1209–1212. [Google Scholar] [CrossRef]
  14. Nanni, E.A.; Huang, W.R.; Hong, K.H.; Ravi, K.; Fallahi, A.; Moriena, G.; Dwayne Miller, R.; Kärtner, F.X. Terahertz-driven linear electron acceleration. Nat. Commun. 2015, 6, 8486. [Google Scholar] [CrossRef] [PubMed]
  15. Zhang, D.; Fallahi, A.; Hemmer, M.; Wu, X.; Fakhari, M.; Hua, Y.; Cankaya, H.; Calendron, A.L.; Zapata, L.E.; Matlis, N.H.; et al. Segmented terahertz electron accelerator and manipulator (STEAM). Nat. Photonics 2018, 12, 336–342. [Google Scholar] [CrossRef]
  16. Curry, E.; Fabbri, S.; Maxson, J.; Musumeci, P.; Gover, A. Meter-scale terahertz-driven acceleration of a relativistic beam. Phys. Rev. Lett. 2018, 120, 094801. [Google Scholar] [CrossRef]
  17. Ravi, K.; Huang, W.R.; Carbajo, S.; Nanni, E.A.; Schimpf, D.N.; Ippen, E.P.; Kärtner, F.X. Theory of terahertz generation by optical rectification using tilted-pulse-fronts. Opt. Express 2015, 23, 5253–5276. [Google Scholar] [CrossRef]
  18. Kroh, T.; Rohwer, T.; Zhang, D.; Demirbas, U.; Cankaya, H.; Hemmer, M.; Hua, Y.; Zapata, L.E.; Pergament, M.; Kärtner, F.X.; et al. Parameter sensitivities in tilted-pulse-front based terahertz setups and their implications for high-energy terahertz source design and optimization. Opt. Express 2022, 30, 24186–24206. [Google Scholar] [CrossRef]
  19. KOSTENBAUDER, A. Ray pulse matrices for dispersive optical systems. In Proceedings of the Conference on Lasers and Electro-Optics, Baltimore, MD, USA, 21–25 May 1990. [Google Scholar]
  20. Gayer, O.; Sacks, Z.; Galun, E.; Arie, A. Temperature and wavelength dependent refractive index equations for MgO-doped congruent and stoichiometric LiNbO 3. Appl. Phys. B 2008, 91, 343–348. [Google Scholar] [CrossRef]
  21. Buzády, A.; Gálos, R.; Makkai, G.; Wu, X.; Tóth, G.; Kovács, L.; Almási, G.; Hebling, J.; Pálfalvi, L. Temperature-dependent terahertz time-domain spectroscopy study of Mg-doped stoichiometric lithium niobate. Opt. Mater. Express 2020, 10, 998–1006. [Google Scholar] [CrossRef]
  22. Kreier, D.; Baum, P. Avoiding temporal distortions in tilted pulses. Opt. Lett. 2012, 37, 2373–2375. [Google Scholar] [CrossRef]
  23. Van Tilborg, J.; Schroeder, C.; Filip, C.; Tóth, C.; Geddes, C.; Fubiani, G.; Huber, R.; Kaindl, R.; Esarey, E.; Leemans, W. Temporal characterization of femtosecond laser-plasma-accelerated electron bunches using terahertz radiation. Phys. Rev. Lett. 2006, 96, 014801. [Google Scholar] [CrossRef] [PubMed]
  24. Brunken, M.; Genz, H.; Göttlicher, P.; Hessler, C.; Hüning, M.; Loos, H.; Richter, A.; Schlarb, H.; Schmüser, P.; Simrock, S.; et al. Electro-optic sampling at the TESLA test accelerator: Experimental setup and first results. Tesla Rep. 2003, 11, 2003. [Google Scholar]
  25. Chen, Q.; Tani, M.; Jiang, Z.; Zhang, X.C. Electro-optic transceivers for terahertz-wave applications. JOSA B 2001, 18, 823–831. [Google Scholar] [CrossRef]
  26. Van Tilborg, J. Coherent Terahertz Radiation from Laser-Wakefield-Accelerated Electron Beams. Ph.D. Thesis, Eindhoven University of Technology, Eindhoven, The Netherlands, 2006. [Google Scholar]
  27. Liu, X.; Melnik, M.; Zhukova, M.; Oparin, E.; Rodrigues, J.J.; Tcypkin, A.; Kozlov, S. Formation of gigahertz pulse train by chirped terahertz pulses interference. Sci. Rep. 2020, 10, 9463. [Google Scholar] [CrossRef]
  28. Tian, Q.; Xu, H.; Wang, Y.; Liang, Y.; Tan, Y.; Ning, X.; Yan, L.; Du, Y.; Li, R.; Hua, J.; et al. Efficient generation of a high-field terahertz pulse train in bulk lithium niobate crystals by optical rectification. Opt. Express 2021, 29, 9624–9634. [Google Scholar] [CrossRef] [PubMed]
  29. Zhou, S.; Ouzounov, D.; Li, H.; Bazarov, I.; Dunham, B.; Sinclair, C.; Wise, F.W. Efficient temporal shaping of ultrashort pulses with birefringent crystals. Appl. Opt. 2007, 46, 8488–8492. [Google Scholar] [CrossRef] [PubMed]
  30. CASTECH Inc. Available online: https://www.castech.com/product/%CE%B1-BBO—Alpha-Barium-Borate-90.html (accessed on 27 September 2023).
  31. Wu, X.; Carbajo, S.; Ravi, K.; Ahr, F.; Cirmi, G.; Zhou, Y.; Mücke, O.D.; Kärtner, F.X. Terahertz generation in lithium niobate driven by Ti: Sapphire laser pulses and its limitations. Opt. Lett. 2014, 39, 5403–5406. [Google Scholar] [CrossRef] [PubMed]
Figure 1. (a) Visualization of the pulse-front tilt generation for a setup in which θ d = 0 . The reflection off the grating causes a transverse temporal delay indicated by the blue and red lines, creating a tilt in the pulse front noted as γ PFT in respect to the laser propagation direction. (b) Imaging system for a two-lens setup which relays the pulse-front tilt image to the grating plane. Note that the PFT direction is flipped after the focus and its magnitude set by the magnification M = Δ x image / Δ x g at the imaging plane inside the LN crystal.
Instruments 07 00039 g001
Figure 2. Pulse-front tilt angle evolution through the imaging plane at z = 0 (dotted line).
Instruments 07 00039 g002
Figure 3. THz source at the Pegasus Photoinjector Laboratory. The IR pump line is shown in red, while the probe pulse line for EOS is orange. For energy measurements, a pyro-electric detector is placed at the ZnTe position. For balanced detection EOS, a QWP and Wollaston prism is inserted as shown, and for cross-polarized detection, these are replaced with two polarizers, oriented 90 with respect to each other.
Instruments 07 00039 g003
Figure 4. (Left), uncooled-setup-generated pulse energies and efficiencies for different fluence levels of the pump beam. (Right), cooled setup showing increased generation efficiencies. Note that the total pulse energy differs due to different pump spot sizes in the different setups.
Instruments 07 00039 g004
Figure 5. (a) Cartoon of the temporal scan: The Infrared (IR) probe pulse shown in red is copropagated with the THz pulse with a known time delay. The delay is adjusted to then retrieve the full temporal profile. (b) Schematics of the cross-polarized scheme. The IR is polarized vertically and copropagated with the THz pulse using a Pellicle Beamsplitter (PBS). The EO crystal then induces a phase shift onto the IR pulse, changing its polarization. The second polarizer is set horizontally, allowing only light that has picked up a phase from the THz to be transmitted. (c) Schematics of balanced detection in which the probe pulse is circularly polarized and then split after the crystal into the two polarization components using a Wollaston prism. The varying probe profiles are recorded on the CCD camera to be postprocessed.
Instruments 07 00039 g005
Figure 6. (Left) Raw image data from the CCD sensor where the phase shift added to the probe pulse modulates the intensity difference between the two polarizations. The images get divided into 10 × 10 bins before normalizing to reduce noise. The reconstructed transverse profile of the electric fields is shown on the (right), with electric fields exceeding 30 MV/m. The slightly weaker fields in the center indicate saturation effects in the EOS measurement.
Instruments 07 00039 g006
Figure 7. (Left) detected phase shift as a function of the probe IR delay from the cross-polarized setup after averaging over a large region of interest to reduce noise. (Center) Temporal profile of THz waveform from balanced detection scheme. (Right) Spectrum before and after filtering out ZnTe-induced reflections. The reconstructed profiles on the left and center are the inverse Fourier transforms of the spectrum after filtering.
Instruments 07 00039 g007
Figure 8. On the (left) is the temporal profile of the THz fields after generating two-cycle pulses. On the (right) is the spectrum obtained by a Fourier transform with a filter applied to reduce the ZnTe-induced reflective effects.
Instruments 07 00039 g008
Figure 9. On the (left), a model of an eight-cycle pulse temporal profile with 1.7 ps delay between each pulse. The original THz field is depicted in blue and the modeled signal with a pulse train as a probe in orange. On the (right), we depict the Fourier transforms of the signal as well as a single-cycle spectrum with the amplitude increased by a factor of 20 for reference.
Instruments 07 00039 g009
Figure 10. The IR pulse train propagates through a second harmonic-frequency-doubling β -BBO crystal, which generates blue light at 400 nm and is split off. The remaining IR is transported through an adjustable delay stage to compensate the time delay induced by dispersive effects in the β -BBO crystal. Both colors are then overlapped and propagated through a second β -BBO, which then generates UV light at 266 nm.
Instruments 07 00039 g010
Figure 11. On the (left), we show the schematics of moving the IR in respect to the blue pulse train. On the (right) are the measurements of the UV amplitude over the temporal delay of the IR for eight-pulse train generation. The individual data points taken are noted at every peak as (time; amplitude).
Instruments 07 00039 g011
Figure 12. On the (left) is the scanned EOS signal over time using a pulse train as a probe pulse with a total of 15 peaks detected, indicating an eight-cycle THz pulse. For reference, the UV line data from Figure 11 are included and scaled in amplitude. On the (right) is the Fourier transform of the detected signal.
Instruments 07 00039 g012
Disclaimer/Publisher’s Note: The statements, opinions and data contained in all publications are solely those of the individual author(s) and contributor(s) and not of MDPI and/or the editor(s). MDPI and/or the editor(s) disclaim responsibility for any injury to people or property resulting from any ideas, methods, instructions or products referred to in the content.

