Abstract
The shielded pair resonator method is a useful tool in the measurement of accelerator components, such as the beam screens used in the Large Hadron Collider (LHC), the High-Luminosity (HL) LHC, or future accelerators. It can measure the resistive losses at several frequency points by separating the resistive losses on the sample from other sources of losses. We built a new resonator to be inserted into a superconducting dipole magnet (peak magnetic field of 9.5 T) and to measure the surface resistance of beam screens, such as LHC beam screens coated with amorphous carbon (a-C). The device can measure surface resistance at any temperature between 4.2 K and 300 K, in the frequency range of 400 MHz to 1600 MHz. We conducted the first surface resistance measurements of two a-C coated beam screens at 4.2 K and showed that the 200 nm to 400 nm titanium underlayer plus 50 nm a-C only has a limited effect on the surface resistance. This first result supports the choice of this coating as baseline for the HL-LHC triplets magnets upgrade. The resonator will have an important role in the characterization of next-generation beam screens, such as a beam screen with laser-engineered surface structure (LESS). Further measurements of the LHC beam screen in the presence of magnetic fields up to 9.5 T and throughout the full temperature range are going to be reported separately.
1. Introduction
In the Large Hadron Collider at CERN, the cold bore of the cryogenic magnets (1.9 K) is shielded from the beam by the intermediate temperature (4.2–15 K) tube called the beam screen [1]. The LHC beam screen is made out of a colaminated stainless steel-copper sheet, with two cooling channels attached on the top and the bottom, as seen in Figure 1. The inner surface resistance of the beam screen plays an important role in both the beam stability and the beam-induced resistive wall heating. Furthermore, requirements on secondary electron yield (SEY) of the beam screen arise to minimize the electron cloud effect [2,3]. Novel surface treatments with low SEY (such as amorphous carbon coating or laser-engineered surface structures) are studied for use in HL-LHC and also the Electron-Ion Collider (EIC) [4]. For the Future Circular Collider (FCC) for hadron–hadron collisions, also high-temperature superconductor (HTS) coatings are being considered [5]. The aim of this project is to develop a measurement setup that can be adapted to different geometries of beam screens and is able to measure surface resistance in the frequency range of 400–1600 MHz, inside a superconducting dipole magnet (9.5 T) (the so-called FRESCA facility at CERN [6]), at temperatures ranging from 4.2 K up to room temperature. Methods previously used to characterize impedances, such as the wire technique [7] or waveguide measurements [8], which perform well at room temperature, have not been deemed ideal for this specific cryogenic setup in vertical position.
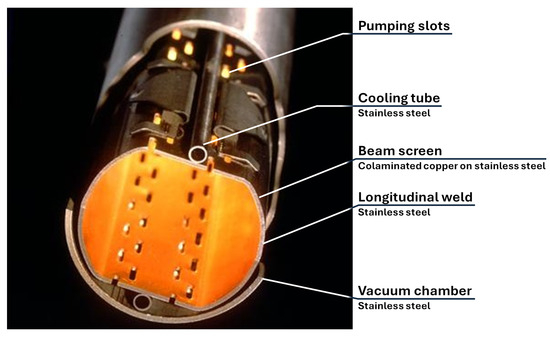
Figure 1.
Picture of the LHC beam screen.
For this purpose, a 400 mm long shielded pair measurement setup was designed. The length was limited by the uniform field region of the magnet. The length also determined the fundamental frequency of the resonator. In the past, this technique was used to measure the surface resistance of tubes made out of the same material as the LHC beam screen, at cryogenic temperatures and inside an LHC dipole magnet [9,10]. The main difference between the setup used and our current setup is that we have the option of cooling the resonator with a flow of cold helium gas at a controlled temperature, thus stabilizing the temperature at points relevant to the current and future operation of the beam screen (currently 5 K to 20 K, and, in FCC-hh, 40 K to 60 K, as described in [11]). In this paper, we describe the results of our first tests on an LHC beam screen and two different amorphous carbon coated LHC beam screens at liquid helium temperature, along with the results of the first measurement spanning the full temperature range. These results demonstrate the validity of the proposed design of the measurement device and confirm that the baseline choice of an amorphous carbon coating for electron cloud mitigation in the HL-LHC quadrupole magnets (triplets) does not significantly impact beam impedance.
2. Materials and Methods
The measurement is based on the shielded-pair method, which is a method commonly used to determine the electrical properties of two parallel conductors or cables, such as their capacitance or impedance, by surrounding them with a grounded shield in order to minimize external electromagnetic interference [12,13]. Similarly, two rods can be inserted into a cylindrical outer tube to create a resonant structure with two fundamental modes (even and odd mode). In the even mode, the two rods are excited identically (the resulting mode is similar to a half-wavelength coaxial cavity mode), while in the odd mode, the excitation signals of the two rods are shifted by 180. The electric field configuration is visualized in Figure 2. The frequencies of the two modes are almost identical, and by measuring (and simulating) the quality factor of both modes, one can derive the surface resistance of the inner rods and the outer tube independent of each other. This will be covered in more detail in Section 2.3. This method works best if the resistances of the components, i.e., rods and outer tube, are the same order of magnitude, as otherwise, the measured result of the better conductor will be dominated by the uncertainty of the worse one.
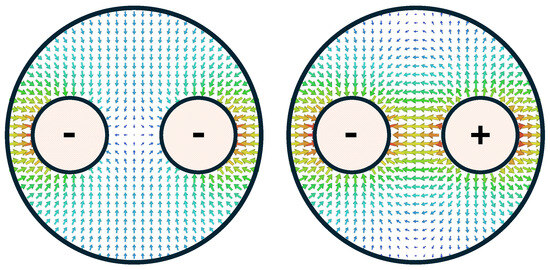
Figure 2.
Visualisation of the electric field configuration for the even mode (left) and odd mode (right).
The measurement setup can be divided into two parts. The first one is the instrumentation necessary to cool down the resonating cavity and stabilize it at a desired temperature. The second part is the RF measurement tools and the cavity itself.
2.1. Cryogenic Instrumentation
The measurement setup was designed and constructed to fit within the existing Facility for the Reception of Superconducting Cables (FRESCA) magnet at CERN [6], which was originally developed to measure the electrical properties of LHC superconducting cables. FRESCA consists of a cryostat containing a superconducting NbTi dipole magnet with a maximum operating field of 9.5 T. Inside the magnet cryostat, an independent inner cryostat is housing the equipment necessary for our measurement, protruding into the 53 mm aperture of the dipole magnet. The schematic view of the developed insert for the FRESCA magnet can be seen in Figure 3.
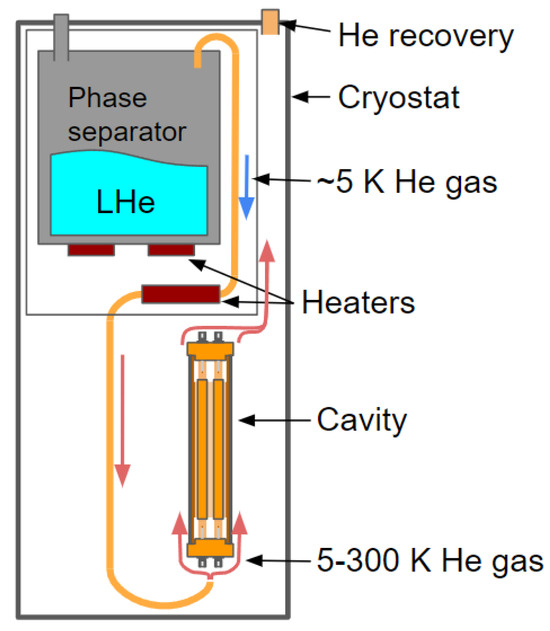
Figure 3.
Schematic view of the cryogenic setup.
To perform a measurement at stable temperatures other than 4.2 K, cold helium gas is circulated through the setup at a given flow rate and temperature. First, in an insulated chamber, the so-called phase separator, (with a diameter of 164 mm and a height of 624 mm), liquid helium is evaporated using electric heaters, and the resulting helium passes through a capillary pipe where another heater increases the temperature of the evaporated helium (5 to 6 K) to the desired temperature. The helium then exits the capillary below the cavity and some of it enters into the inner volume of the cavity through the small holes in the end cap, while the rest flows outside the outer walls of the cavity. We have two temperature sensors on the cavity itself in order to monitor the temperature difference between the top and bottom of the setup. A few Kelvin temperature difference is expected between the rods and the outer tube, as well as the top and the bottom of the setup, but in normal conducting measurements they should only influence the measured surface resistance slightly. During the three 4.2 K measurements discussed in the Results section, a simplified cooling setup was used, with liquid helium directly cooling the cavity, whereas during the intermediate temperature measurement, the phase separator based cooling setup was used.
2.2. Rf Equipment
A schematic view of the RF measurement setup can be seen in Figure 4. The body of the resonator is constructed from the beam screen under study as the outer wall. For mechanical stability, and to close the pumping slots on the top and bottom of the LHC beam screen, we have two half profiles (or support tube halves) attached to the top and bottom of the beam screen. These profiles are made out of stainless steel. The two rods inserted in the center are hollow and made of stainless steel in order to protect the setup from the possible effects of eddy currents during a magnet quench. They are both closed by two stainless steel plugs, and copper plated after the plugs are welded in place. The copper layer is approximately 20 thick, much thicker than the skin depth of copper at frequencies higher than 400 MHz.
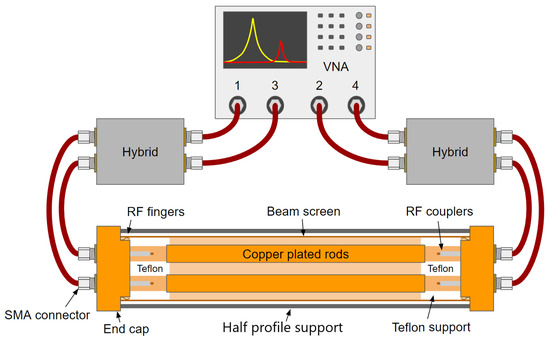
Figure 4.
Schematic view of the 2 rod cavity and the RF instrumentation to which it is connected.
The two rods are aligned and secured at both ends by Teflon support elements. The choice is based on Teflon’s low and temperature-stable dielectric constant, which minimally affects the electromagnetic field configurations. Additionally, it exhibits a low loss tangent, particularly in low-temperature conditions. Three Teflon pins ensure the centering of the Teflon supports and lock them azimuthally against rotations. One of the pins is in the center, and the other two can slide radially in grooves, as illustrated in Figure 5. This is necessary because Teflon contracts thermally significantly more than either copper or stainless steel, causing the relative distance between the two outside pins to change by up to 0.4 mm between 300 K and 4.2 K (calculated from the theoretical thermal expansion coefficient of stainless steel and Teflon).
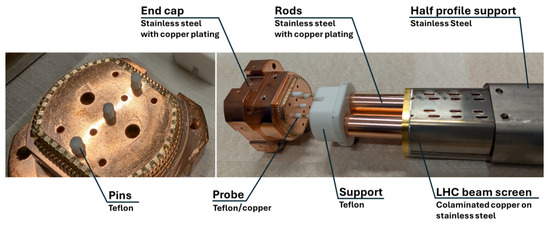
Figure 5.
End cap and Teflon support assembly. The three Teflon pins in the vertical midplane of the end cap ensure centering and azimuthal fixing of the rods.
The end caps of the setup are also copper-plated stainless steel, with two holes for the coupling pins, and six other holes for the helium gas to flow through. On the contact surface with the beam screen, the end cap has a set of “RF fingers” to minimize the contact resistance between the end cap and the beam screen, as the currents run through this contact.
Four semi-rigid coaxial cables connect the ports of the cavity to the output ports of two hybrid couplers (H-183-4, 30–2000 MHz). The hybrid couplers split the input signal into two signals of half amplitude in power, either in phase () or with opposite phases (). Four other coaxial cables are used to connect the input ports of the hybrids to a four-port vector network analyzer (R&S®ZNB4, 9 KHz to 4.5 GHz). The connections of the setup are visible in Figure 4. This way of connecting the VNA to the cavity allows the “selective measurement” of the even or the odd mode, instead of exciting a combination of the two. Transmission S-parameter represents the odd mode of the resonator, while represents the even mode. The reflection parameters for both modes can be calculated from , , , and .
The magnitudes and phases of the S-parameters are saved, and then post-processing of the signals is conducted using the Algorithm for Resonator Parameter Extraction (ARPE) [14]. This tool, instead of determining the loaded quality factor of the cavity from the full width at half maximum of the S-parameter peak, fits the data around the peak maximum with a partial circle in the complex plane (as seen in [14]). This makes the measurement more robust against noise, removes contributions such as cross-talk between the resonator ports, and eliminates the need for a very precise calibration of the cables and connectors. The calibration of the “cold part” of the setup would be impossible to perform, considering that the electrical length and attenuation of the cables are temperature dependent. During the development phase of the project, the so-called “port extensions” (or “Offset and de-/embedding” ) function of the VNA [15] was used to achieve similar measurement stability. The use of port extensions is not easy to automate; thus, when the measurement script was developed (in Python using the PyVISA package), the decision was made to use ARPE instead of port extensions, as this sped up the measurement process significantly while allowing measurement of the setup without human intervention.
2.3. Data Analysis
The unloaded quality factor of a cavity describes the ratio between the energy stored in the cavity and the energy lost in a single oscillation:
where is times the resonant frequency. The losses can be separated into resistive and dielectric losses:
Here, is the vacuum permeability, is the magnetic field strength, is the (spatially dependent) surface resistance of resistive surfaces inside the cavity, is the electric energy filling factor and is the dielectric loss tangent. Furthermore, the integral with the subscript “S” in the numerator represents the average power dissipated over the conducting volume, which can be expressed as a surface integral including the surface resistance. The integral in the denominator, with subscript “”, represents the total energy stored within the resonating structure and is, therefore, an integration over the entire volume of the resonator. In the case of our cavity, the first term further simplifies if we assume that the surface resistance of the beam screen, as well as the surface resistance of the internal rods, is homogeneous. In the midplane of the beam screen, there is a longitudinal weld where copper is removed from the surface in a 2.1 mm thick band, exposing the stainless steel, as discussed later. Before the RF measurements, the DC resistivity of P506 steel used in the beam screen was measured at 4.2 K to be 6.90m. Due to this very high resistivity and the fact that the surface currents are concentrated in the midplane of the beam screen, a significant portion of the energy is lost in the welding strip. The uncertainty in the consistent width of the stainless steel weld along the entire length of the beam screen introduces a large uncertainty in the measured result. The resistive losses in the welding strip are derived from the simulation. There are four terms in Equation (3):
where and are the geometry factors of the beam screen and the rods, respectively, and is the resistive loss term in the steel along the welding. All geometry factors and filling factors can be determined from the simulation of the respective modes. The calculation of excludes the slice of the beam screen where the weld is located, as losses of this slice are included in .
In the above equations, and are frequency dependent, and thus are not exactly the same for the even and odd modes of our cavity. The separation between the modes is between 5 MHz and 30 MHz, which at the frequency of the fundamental mode (400 MHz) leads to a change in the surface resistance of approximately 0.6%. At higher frequencies, the relative change in surface resistance is even smaller, so we can neglect it. Based on this, the even () and odd () mode unloaded quality factors acquired from the measurement can be expressed in the following system of equations:
From Equation (6), we can arrive at the equations for the surface resistance of the beam screen and the inner rods:
From Equation (7), it is also visible that the measurement uncertainty in the measurement comes partially from simulation (determination of the coefficients, the resistive losses in the steel and dielectric losses) and partially from the measurement of the quality factors. The uncertainty of the results is discussed in the following section. The and factors are temperature independent (since the change in the electromagnetic field pattern caused by the temperature change is negligible), but the dielectric loss tangent depends strongly on the temperature. Teflon has a dielectric loss tangent of approximately 4 at 1 GHz and room temperature. At 4.2 K, the loss tangent is approximately 5.6 at 1 GHz [16,17].
2.4. Measurement Uncertainty
The relative uncertainty of the geometry factors from the simulation is estimated to be less than 1%. Combined with the relative uncertainty of the dielectric filling factors and the uncertainty in the dielectric loss tangent of Teflon, this leads to a few percent of relative uncertainty of the derived surface resistances independent of the temperature. A much greater source of error is the weld in the midplane of the beam screen. As the fields and the surface currents are concentrated in the midplane, the weld is responsible for ≈3% to 6% of all the losses at room temperature (more significant in the even mode). As mentioned already, the resistivity of stainless steel at 4.2 K is extremely high; thus, the weld is responsible for more than 60% of the losses in the cryogenic measurements. The thickness of the strip where the copper is removed from the stainless steel (the “weld thickness”) also has an uncertainty of ≈0.2 mm. This, in turn, leads to a very large (≈30%) relative uncertainty of the derived surface resistance of the beam screen at 4.2 K. The relative uncertainty of the inner rod surface resistance does not depend strongly on the weld thickness.
Finally, on top of the uncertainty derived from the above mentioned factors, the measurement of the quality factor also contributes to the final measurement error. By repeating the measurement several times, across multiple cooldowns, and even a complete disassembly and reassembly of the setup, the standard deviation of the results was determined to be ≈4%. The combined uncertainty of the derived surface resistance is depicted on the result plots discussed in the Results section.
2.5. Sample Preparation
A standard LHC beam screen was cut into three equal-length samples; one of them was left unmodified to provide a baseline copper-plated measurement. Sample 2 was first coated with two 100 nm thick layers of titanium, each with different coating parameters, then a 50 nm thick layer of amorphous carbon. The purpose of this coating is to reduce the secondary electron yield of the beam screen surface and thus mitigate the electron cloud effect [3]. Sample 3 is similar to sample 2; the only difference is that the thickness of the titanium sublayers was doubled to 200 nm each. These coatings are similar to those performed on flat discs, measured and reported in [18]. However, those measurements were limited to the temperature range between 77 and 300 K, and the measurement frequency was 3.4 GHz, about twice as large as the LHC beam frequency spectrum cutoff [19]. In addition, the coatings were performed on a general-purpose coating device. In this paper, we focus on characterizing real LHC-type beam screens coated with the device developed for the in-situ coating of the HL-LHC beam screens in the accelerator tunnel in an attempt at validating the full coating process selected as baseline for the HL-LHC upgrade and assessing its impact on the beam screen surface impedance. Details on the hardware used for the coating and on the detailed coating procedure, performed using the process devised for the coating of the HL-LHC stand-alone superconducting quadrupoles, are described in [20,21,22].
It should be noted that the width of the welding for our particular beam screen has been measured to be 2.1 mm ± 0.2 mm, hence, the magnitude of the uncertainty mentioned above. This uncertainty also matches the expected variability of the width of the welding in the fabrication process of the beam screens, expected to be within ≈0.2 mm.
3. Results
A set of measurements was conducted at room temperature, one at 4.2 K, and a final one at intermediate temperatures using the standard copper-coated LHC beam screen. This was later compared to measurements of LHC beam screen samples coated by a multilayer of titanium and amorphous carbon.
3.1. Standard Lhc Beam Screen
At room temperature, we expect the surface resistance of the inner rods and the beam screen to be almost identical and to scale with the square root of the frequency. The measured surface resistance of the beam screen and of the rods, calculated with the procedure described in the previous section, can be seen in Figure 6 alongside the theoretical surface resistance of bulk copper. We repeated the measurement five times and used the results to determine the standard deviation of the results. As seen in Figure 6, the measured surface resistance of the rods is slightly higher than pure copper, which is most likely caused by surface imperfections of the coating. The results scale correctly with the frequency, and there is only a small difference measurable between the surface resistance of the rods and the beam screen, which is further discussed in Section 4. Due to the coupling becoming stronger at high frequency, the measurement becomes very noisy above 1600 MHz. Because of this effect, we will only use the first four harmonics in the following results.
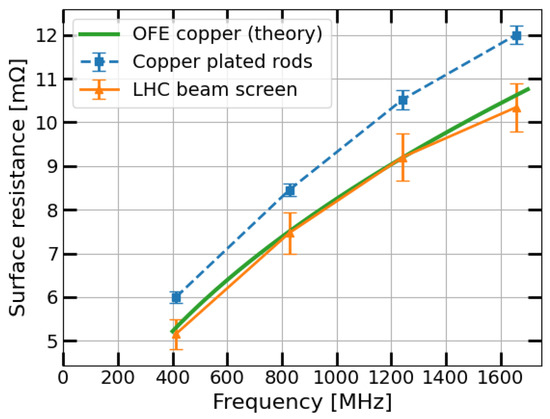
Figure 6.
Surface resistance as a function of frequency at room temperature using standard LHC beam screen. For comparison purposes, the theoretically determined values for oxygen-free electronic (OFE) copper are also plotted.
At 4.2 K, the theoretical surface resistance depends on the residual resistivity ratio (RRR) as well as on the surface roughness of the copper. Furthermore, in the frequency range between 400 MHz and 1600 MHz, the copper coating is in the anomalous skin effect (ASE) regime. In the case when the surface resistance is dominated by ASE, the surface resistance scales as , instead of the usual square root scaling [23]. Figure 7 shows the experimental data of the LHC beam screen at cryogenic temperature. The results obtained follow the expected ASE regime frequency dependency for copper with a RRR = 80, as indicated by the theoretically determined surface resistance (green solid curve), calculated using the Mathematica script described in [24]. The copper plated rods, consistent with the room temperature measurements in Figure 6, have a higher surface resistance (RRR ). The frequency dependence of the surface resistance of the rods is also slightly different from the beam screen.
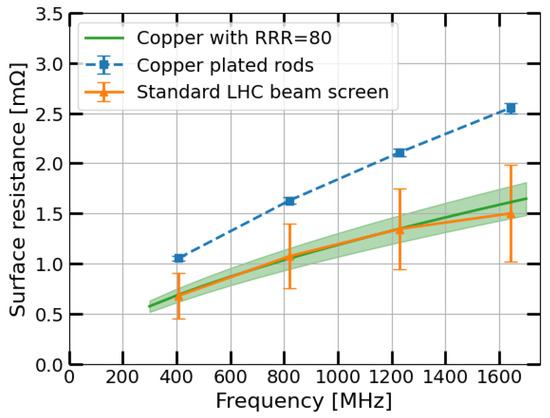
Figure 7.
Result of measurement at 4.2 K using standard LHC beam screen.
Figure 8 presents the analysis results of the LHC beam screen’s performance as a function of temperature for the first four resonances. It shall be mentioned that this test was conducted parasitically during the cooling system’s testing phase. The setup was placed in a larger cryostat than the planned magnet cryostat, and the measurement was conducted without an external magnetic field. During the stabilization of the temperature at 10 K, some temperature stability issues were observed. Consequently, data were collected during the natural heat-up of the system. A maximum temperature gradient of approximately 10 K was observed along the length of the beam screen. Thus, the temperature values shown in Figure 8 are averaged from measurements taken at both ends of the beam screen, with no data available for the rods’ temperature. This temperature gradient should not influence the measured surface resistance significantly below ≈40 K due to the resistivity of copper plateauing at low temperatures.
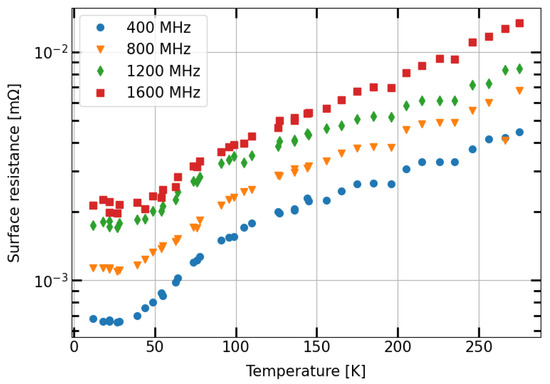
Figure 8.
First test measurements of the surface resistance as a function of temperature for a standard LHC beam screen. Errorbars of the results were removed for clarity. In general the relative uncertainty at low temperatures is approximately 35% while the uncertainty at high temperatures is approximately 10%.
Figure 8 shows that the surface resistance remains nearly constant between 10 K and 40 K and increases monotonically with increasing temperature, as expected. The measured values at 10 K are consistent with the values presented in Figure 7. Furthermore, the residual resistance plateau is in good agreement with a copper of RRR = 80. The trend of increased surface resistance with increased temperature is consistent for the first three resonances having the same slope but shows a significant deviation for the fourth resonance. At room temperature, the results also seem to align relatively well with the results seen in Figure 6. At intermediate temperatures, the relatively large temperature difference between the rods and the beam screen, along with the longitudinal temperature gradient, makes the validity of the results questionable. However, this effect can be minimized in subsequent measurements by maintaining a constant helium flow.
3.2. Amorphous Carbon-Coated Beam Screens
The liquid helium temperature measurements were repeated using samples 2 and 3. The results of these measurements can be seen in Figure 9 and Figure 10. The copper-coated rods used for the three samples were exactly the same. The fact that the measured surface resistance of the rods is not identical for the three measurements shows the uncertainty of the measurement with respect to exchanging the beam screen.
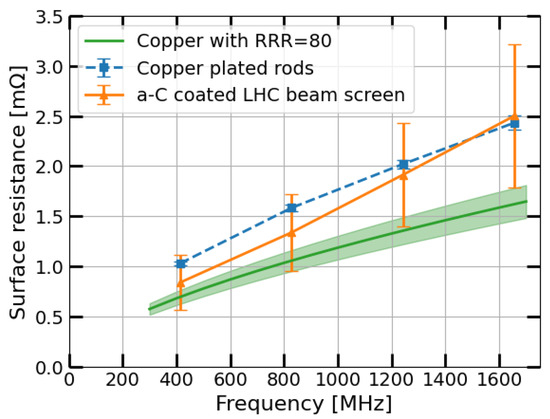
Figure 9.
Result of measurement at 4.2 K using amorphous carbon coated LHC beam screen.
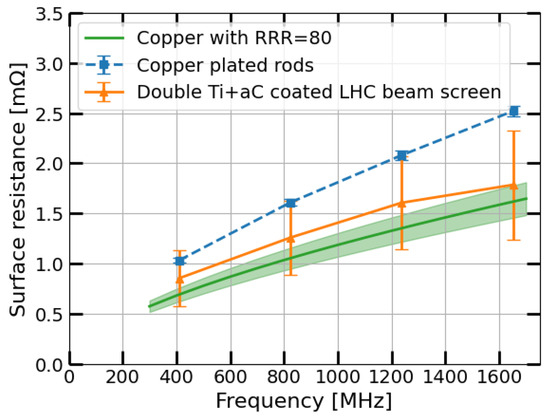
Figure 10.
Result of measurement at 4.2 K of the amorphous carbon coated LHC beam screen with double thickness titanium sublayer.
There is an increase of 8% to 65% in the measured surface resistance depending on the resonant mode with the amorphous carbon coating in the case of the single-thickness titanium sublayer, and an increase of 10% to 15% in the case of the double-thickness titanium sublayer. The temperature-dependent measurements were not performed on the coated beam screens.
4. Discussion
The results of the uncoated beam screen show the expected behaviour both at room temperature and at 4.2 K. The surface resistance measured at room temperature for the beam screen and for the rods corresponds, within the experimental uncertainty, to the value expected for copper at the four resonant modes explored. The surface resistance measured at 4.2 K corresponds to the value estimated for copper of RRR of about 80. This is in line with expectations for standard LHC beam screens [25], despite the very large error bars due to the projected uncertainty of ≈0.2 mm in the welding width. The higher surface resistance measured for the rods at 4.2 K is also in line with the expectations for a shiny copper plating of RRR of about 40 [26]. This confirms the validity of the measurement principle, and the robustness of the analysis chain. The measurement device as a proof of concept also confirmed the ability to perform measurements at intermediate temperatures between 4.2 K and room temperature, as per design specifications and goals, with the expectation that by stabilizing the temperature with the cold gas-based cooling system will further improve the results.
The measurements of the two samples coated with 200 nm (Figure 9) and 400 nm (Figure 10) of titanium, and 50 nm of amorphous carbon, both show an increase in the surface resistance of the beam screen compared to uncoated copper. The increase in surface resistance is higher for the thinner coating, contrary to what could be expected. The difference between the two coatings is negligible at the two lower harmonics, they both have approximately 8% increased surface resistance. At the fourth harmonic, the sample with a 200 nm thick titanium layer shows a 65% increase, while the the sample with the 400 nm titanium layer a 15% increase with respect to the uncoated sample. This was surprising because if the titanium layer is causing the increase of the surface resistance, then it should be higher in the case of the 400 nm layer. These results are nevertheless within the uncertainty range of the measurement due to the cumulative effects of the stainless steel welding size variability and the other experimental errors. This confirms the results previously obtained on flat discs measured at a higher temperature [18], as previously mentioned in Section 2.5. In both studies, the deviations of the results fall within the measurement errors, i.e., a negligible effect of the coating on the surface resistance. With this new measurement, we can conclude that the a-C coating produced in a real beam screen using the same coating techniques that are used for the HL-LHC triplet upgrade results in an increase of surface resistance of approximately 8 to 65% at the LHC relevant temperatures and frequencies. Since electron cloud multipacting has been identified as a significant contributor to heat load, posing limitations to the cryogenic system, the primary purpose of the a-C coating is to mitigate electron cloud formation and address potential issues in the HL-LHC era. The heat load generated by the electron cloud is considerably higher than that resulting from increased surface resistance. Thus, this value is well within the range that can be accepted for the regions to be coated in the HL-LHC [27], supporting the technological choice that was made for the accelerator, guaranteeing a negligible impact on the machine beam impedance [28].
5. Conclusions
We have developed a 400 mm-long shielded pair measurement setup to measure the surface resistance of beam screens for future accelerators in the range from room temperature down to 4.2 K. The device has been qualified by characterizing a standard copper-coated LHC beam screen. Furthermore, it has been employed for validating the amorphous carbon coating process envisioned for the HL-LHC beam screens, confirming that the surface resistance increase due to the coating is limited. This was already anticipated from flat sample measurements, thereby guaranteeing a minimal impact on beam impedance. An improvement of the measurement setup is currently being studied. In order to reduce the losses in the stainless steel in the midplane of the beam screen, we might tilt the plane of the rods from the horizontal midplane of the beam screen. This change has the potential to reduce the uncertainty of the results at 4.2 K. The angle of misalignment has to be large enough to reduce the current running in the midplane significantly, but small enough that the major part of the current still runs in the side walls of the beam screen. The device is envisioned to be used for insertion in the high-magnetic-field test setup FRESCA at CERN and will be employed eventually for the characterization of HTS-coated beam screens for the FCC-hh study [29].
Author Contributions
This work was performed at CERN between 2019 and 2022. Conceptualization, K.B.; methodology, K.B.; software, K.B.; validation, K.B. and P.K.; formal analysis, K.B., P.K. and S.C.; investigation, K.B. and P.K.; resources, S.C.; data curation, K.B. and P.K.; writing—original draft preparation, K.B., P.K. and S.C.; writing—review and editing, K.B, P.K. and S.C.; visualization, K.B.; supervision, S.C. and D.B. All authors have read and agreed to the published version of the manuscript.
Funding
This research received no external funding.
Data Availability Statement
The raw data supporting the conclusions of this article will be made available by the authors on request.
Acknowledgments
This work would have not been possible without the constant advice of Fritz Caspers, who originally devised the 2-rods system. The authors acknowledge the strong engineering support of the CERN design office, and in particular Luca Dassa, Emiliano Urrutia and Nadine Favre. The project benefited of the advice and support of the CERN Cryolab team and in particular Torsten Koettig, Laetitia Dufay-Chanat, and Sebastien Prunet. Furthermore we are grateful to our colleagues who produced the amorphous carbon coated samples, namely Pedro Costa Pinto and Spyridon Fiotakis.
Conflicts of Interest
The authors declare no conflicts of interest.
Abbreviations
The following abbreviations are used in this manuscript:
| a-C | Amorphous Carbon |
| ARPE | Algorithm for Resonator Parameter Extraction |
| ASE | Anomalous Skin Effect |
| FCC | Future Circular Collider |
| EIC | Electron Ion Collider |
| HL | High-Luminosity |
| HTS | High-Temperature Superconductor |
| LHC | Large Hadron Collider |
| LESS | Laser-Engineered Surface Structure |
| OFE | Oxygen-Free Copper |
| RRR | Residual Resistivity Ratio |
| RF | Radio Frequency |
| SEY | Secondary Electron Yield |
References
- Angerth, B.; Bertinelli, F.; Brunet, J.; Calder, R.; Caspers, F.; Gröbner, O.; Mathewson, A.; Poncet, A.; Reymermier, C.; Ruggiero, F.; et al. The LHC beam screen: Specification and design. In Proceedings of the Fourth European Particle Accelerator Conference, London, UK, 27 June–1 July 1994. [Google Scholar]
- Rumolo, G.; Ruggiero, F.; Zimmermann, F. Simulation of the electron-cloud build up and its consequences on heat load, beam stability, and diagnostics. Phys. Rev. ST Accel. Beams 2001, 4, 012801. [Google Scholar] [CrossRef]
- Costa Pinto, P.; Calatroni, S.; Neupert, H.; Letant-Delrieux, D.; Edwards, P.; Chiggiato, P.; Taborelli, M.; Vollenberg, W.; Yin-Vallgren, C.; Colaux, J.L.; et al. Carbon coatings with low secondary electron yield. Vacuum 2013, 98, 29–36. [Google Scholar] [CrossRef]
- Verdú-Andrés, S.; Blaskiewicz, M.; Brennan, J.; Gu, X.; Gupta, R.; Hershcovitch, A.; Mapes, M.; McIntyre, G.; Muratore, J.; Nayak, S.; et al. A Beam Screen to Prepare the RHIC Vacuum Chamber for EIC Hadron Beams: Conceptual Design and Requirements. In Proceedings of the International Particle Accelerator Conference, Campinas, Brazil, 24–28 May 2021. [Google Scholar] [CrossRef]
- Calatroni, S.; Bellingeri, E.; Ferdeghini, C.; Putti, M.; Vaglio, R.; Baumgartner, T.; Eisterer, M. Thallium-based high-temperature superconductors for beam impedance mitigation in the Future Circular Collider. Supercond. Sci. Technol. 2017, 30, 075002. [Google Scholar] [CrossRef]
- Verweij, A.; Genest, J.; Knezovic, A.; Leroy, D.; Marzolf, J.P.; Oberli, L. 1.9 K test facility for the reception of the superconducting cables for the LHC. IEEE Trans. Appl. Supercond. 1999, 9, 153–156. [Google Scholar] [CrossRef]
- Caspers, F. Impedance Determination from Bench Measurements. 2000. Available online: https://cds.cern.ch/record/437306 (accessed on 20 August 2024).
- Antuono, C. Improved Simulations in Frequency Domain of the Beam Coupling Impedance in Particle Accelerators. Master’s Thesis, Sapienza University, Roma, Italy, 2021. Available online: https://cds.cern.ch/record/2760024 (accessed on 3 September 2024).
- Caspers, F.; Morvillo, M.; Ruggiero, F.; Tan, J. Surface Resistance Measurements and Estimate of the Beam-Induced Resistive Wall Heating of the LHC Dipole Beam Screen; Technical Report LHC-Project-Report-307, CERN-LHC-Project-Report-307; CERN: Geneva, Switzerland, 1999; Available online: https://cds.cern.ch/record/400683 (accessed on 20 November 2023).
- Caspers, F.; Morvillo, M.; Ruggiero, F.; Tan, J.; Tsutsui, H. Surface Resistance Measurements of LHC Dipole Beam Screen Samples. In Proceedings of the 7th European Particle Accelerator Conference, Vienna, Austria, 26–30 June 2000. [Google Scholar]
- Lebrun, P.; Tavian, L. Beyond the Large Hadron Collider: A First Look at Cryogenics for CERN Future Circular Colliders. Phys. Procedia 2015, 67, 768–775. [Google Scholar] [CrossRef]
- Smith, G.; Nordgard, J. On the Design and Optimization of the Shielded-Pair Transmission Line. IEEE Trans. Microwave Theory Tech. 1980, 28, 887–893. [Google Scholar] [CrossRef]
- Tan, J. Technical and Practical Information on the Surface Resistance Measurement Bench Using the Shielded Pair Method: Application to the LHC Beam Screen; Technical Report CERN-SL-2000-002-AP; CERN: Geneva, Switzerland, 2000; Available online: https://cds.cern.ch/record/426232 (accessed on 1 June 2024).
- Krkotić, P.; Gallardo, Q.; Tagdulang, N.D.; Pont, M.; O’Callaghan, J.M. Algorithm for Resonator Parameter Extraction From Symmetrical and Asymmetrical Transmission Responses. IEEE Trans. Microw. Theory Tech. 2021, 69, 3917–3926. Available online: www.arpe.upc.edu (accessed on 7 December 2023). [CrossRef]
- GmbH, R.S. ZNB/ZNBT User Manual. Available online: https://www.rohde-schwarz.com/ch-en/manual/r-s-znb-znbt-user-manual-manuals_78701-29151.html (accessed on 1 January 2024).
- Teflon (PTFE) Properties Handbook, DU PONT. Available online: http://www.rjchase.com/ptfe_handbook.pdf (accessed on 1 July 2024).
- Zhang, Y.; Wang, Z. Measurement of dielectric loss tangent at cryogenic temperature using superconducting film resonator. J. Theor. Appl. Phys. 2016, 10, 27–32. [Google Scholar] [CrossRef]
- Brunner, K.; Krkotić, P.; Pinto, P.C.; Diaz-Rato, E.G.; Pfeiffer, S.; Vollenberg, W.; Calatroni, S.; Barna, D.; Pont, M.; O’Callaghan, J. Dielectric resonator to measure surface resistance of accelerator components at room temperature and 77 K. Phys. Rev. Accel. Beams 2023, 26, 083101. [Google Scholar] [CrossRef]
- Métral, E. RF heating from wake losses in diagnostics structures. In Proceedings of the 2nd International Beam Instrumentation Conference, Oxford, UK, 16–19 September 2013. [Google Scholar]
- Granadeiro Costa, A. In-Situ Amorphous Carbon Coating of Q5L8 Standalone Magnet (v.1); Technical Report EDMS 2441196; CERN: Geneva, Switzerland, 2020; Available online: https://edms.cern.ch/document/2441196/1 (accessed on 23 July 2024).
- Costa Pinto, P.; Taborelli, M. Amorphous Carbon Coating in Standalone Magnets of the LHC in IR2 and IR8 during LS2 2019–2020; Technical Report EDMS 1983116; CERN: Geneva, Switzerland, 2022; Not publicly available. Internal report. [Google Scholar]
- Costa Pinto, P.; Baglin, V.; Calatroni, S.; Chiggiato, P.; Cruikshank, P.; Demolon, P.; Fjierli, H.; Garion, C.; Girolamo, B.D.; Leggiero, L.; et al. In-situ a-C coating performance and status of LESS & tunnel implementation. In Proceedings of the 7th HL-LHC Collaboration Meeting, Madrid, Spain, 13–16 November 2017; Available online: https://indico.cern.ch/event/647714/contributions/2633173/attachments/1559499/2454409/7thHiLumi_pedro_carbon_coatings.pdf (accessed on 21 April 2024).
- Reuter, G.E.H.; Sondheimer, E.H.; Wilson, A.H. The theory of the anomalous skin effect in metals. Proc. R. Soc. Lond. Ser. A 1948, 195, 336–364. [Google Scholar] [CrossRef]
- Calatroni, S. A Mathematica Notebook for the Calculation of the Anomalous Skin Effect in Copper. CERN Document Server. 2020. Available online: http://cds.cern.ch/record/2718002 (accessed on 2 June 2024).
- Cruikshank, P.; Artoos, K.; Bertinelli, F.; Brunet, J.C.; Calder, R.; Campedel, C.; Collins, I.; Dalin, J.M.; Feral, B.; Grobner, O.; et al. Mechanical design aspects of the LHC beam screen. In Proceedings of the 1997 Particle Accelerator Conference (Cat. No. 97CH36167), Vancouver, BC, Canada, 12–16 May 1997. [Google Scholar] [CrossRef]
- Lain Amador, L. Production of Ultra-High-Vacuum Chambers with Integrated Getter Thin-Film Coatings by Electroforming. Ph.D. Thesis, Université Bourgogne-Franche-Comté, Besançon, France, 2019. [Google Scholar] [CrossRef]
- Antipov, S. Impact of a-C coating on impedance. In Proceedings of the 124th HiLumi WP2 Meeting, Geneva, Switzerland, 3 July 2018; Available online: https://indico.cern.ch/event/741104/contributions/3059804/attachments/1679470/2697601/Impedance_effects_of_the_HL-LHC_coated_inner_triplets_WP2.pptx (accessed on 25 July 2024).
- Aberle, O.; Béjar Alonso, I.; Brüning, O.; Fessia, P.; Rossi, L.; Tavian, L.; Zerlauth, M.; Adorisio, C.; Adraktas, A.; Ady, M.; et al. High-Luminosity Large Hadron Collider (HL-LHC): Technical Design Report; Technical Report; Series: CERN Yellow Reports: Monographs; CERN: Geneva, Switzerland, 2020. [Google Scholar] [CrossRef]
- Calatroni, S. HTS Coatings for Impedance Reduction in Particle Accelerators: Case Study for the FCC at CERN. IEEE Trans. Appl. Supercond. 2016, 26, 1–4. [Google Scholar] [CrossRef]


Disclaimer/Publisher’s Note: The statements, opinions and data contained in all publications are solely those of the individual author(s) and contributor(s) and not of MDPI and/or the editor(s). MDPI and/or the editor(s) disclaim responsibility for any injury to people or property resulting from any ideas, methods, instructions or products referred to in the content. |
© 2024 by the authors. Licensee MDPI, Basel, Switzerland. This article is an open access article distributed under the terms and conditions of the Creative Commons Attribution (CC BY) license (https://creativecommons.org/licenses/by/4.0/).