1. Introduction
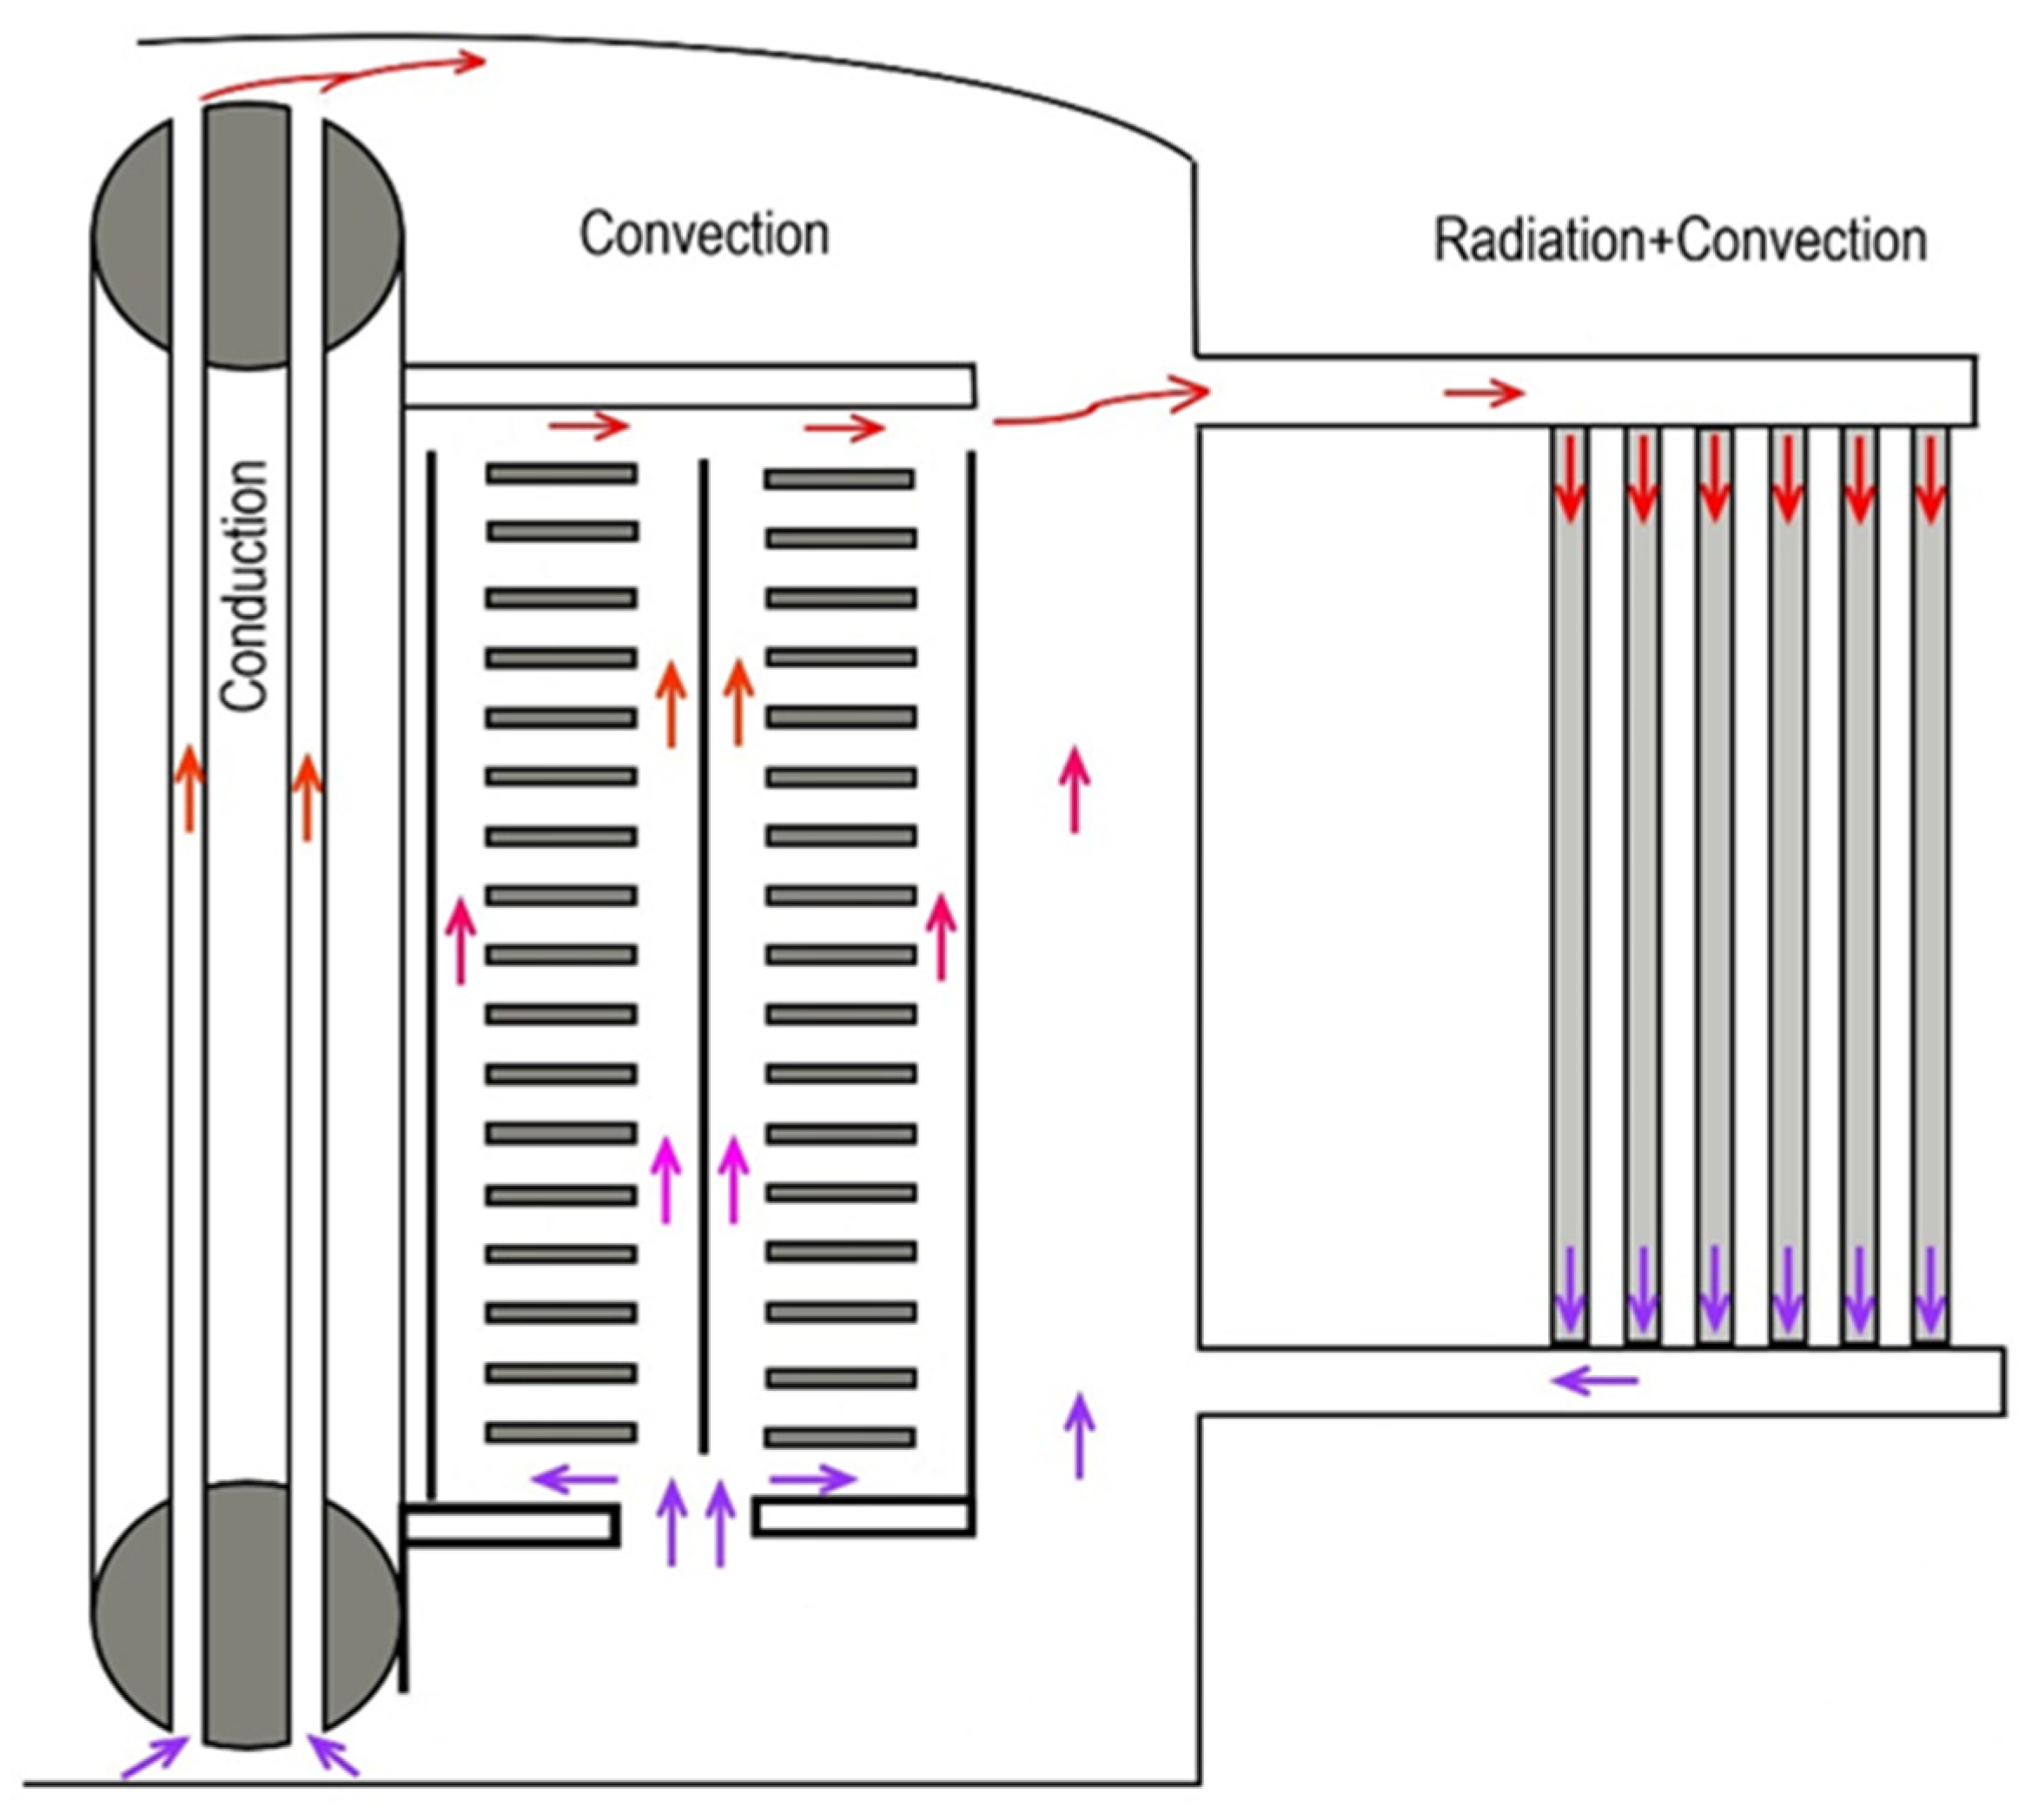
Oil-immersed power transformers are widely recognized as highly valuable components within electrical power networks. During the process of converting electric energy from high to low voltages, some of the energy is dissipated as heat, which occurs in the windings, core, and structural components. During the process of converting electric energy from high to low voltages, some of the energy is dissipated as heat, which occurs in the windings, core, and structural components. This heat must be efficiently dissipated by the cooling system. Although the majority of this heat is extracted from the radiators, a portion of it is also extracted from the oil tanks. The dissipation of heat from the windings and core is facilitated by the circulation of oil, which traverses the spaces between the winding disks. Subsequently, the oil flows through the upper pipes of the radiators, transferring the heat to the cooling channels within the fins. Eventually, the oil reaches the lower pipes of the radiators before returning to the windings at the bottom. There are four primary cooling modes employed in transformers: oil-natural air-natural (ONAN), oil-natural air-forced (ONAF), oil-directed air-forced (ODAF), and oil-forced air-forced (OFAF). Non-direct oil flow cooling systems, such as ONAN, are widely employed in power transformers due to their high reliability. The circulation of oil through the flow system is primarily driven by thermal forces resulting from variations in oil density [
1].
In the context of ONAN-cooled power transformers, the circulation of oil through the cooling network and the movement of air through the radiator fins are driven by natural convection resulting from buoyancy effects. A comprehensive understanding of the principles governing the flow of heat and dissipation in radiators is of the utmost significance for transformer manufacturers. The determination of the design parameters that can influence the heat dissipation process of radiators and enable the enhancement of design also draws attention within the transformer business. A more efficient design allows for a reduction in the size and the weight of the radiator, resulting in improved efficiency, extended lifespan, and decreased manufacturing costs, all while effectively dissipating a given amount of heat. Due to this rationale, the manufacturers of transformers exhibit a strong inclination towards minimizing the quantity of radiator with the objective of reducing the overall weight of the system, while ensuring that the thermal performance remains uncompromised. Additionally, improved radiator thermal performance may also reduce the weight of the active part components.
The main goals of this research are to investigate the radiator’s thermal performance in a range of dimensions and configurations and to optimize those dimensions and configurations for a variety of cooling loads from a techno-economic standpoint. The optimization parameters are the radiator height, the fin spacing, and the number of fins in a radiator.
The majority of the existing literature focuses on the internal cooling mechanisms employed in power transformers, specifically pertaining to the cooling of the windings. In contrast, the process of externally cooling the transformer, specifically through the utilization of radiators, involves significantly less effort. The absence of significant cooling issues in power transformers in the past can be attributed to the design of their cooling systems, which incorporated an excess number of radiators beyond the actual cooling requirements of the transformers [
2]. Considerable efforts have been undertaken in recent times to decrease the dimensions and quantity of radiators employed for the purpose of cooling power transformers. This endeavor aims to mitigate the escalating production costs resulting from the surge in raw material prices and the trend towards downsizing power transformers. In order to achieve an optimal cooling system for power transformers, it is imperative to conduct studies on the design of a radiator that exhibits superior performance.
Considering the advent of sophisticated tools like computational fluid dynamics (CFD), it has become feasible in recent years to virtually visualize the airflow and temperature distribution across radiators, thereby eliminating the need for costly experimental procedures. In addition, the analysis of air-flow distribution provides further understanding and potential avenues for enhancing the thermal efficiency of the system. By employing numerical methods, it becomes feasible to compute the heat losses and variation in temperature in power transformers and systems for cooling [
3,
4]. Nevertheless, the numerical challenges encountered in natural convection problems include issues related to convergence, computational time, and accuracy [
5,
6].
In their research, Fdhila et al. [
7] investigated the heat transfer phenomenon in air-cooled radiators with a large size. They employed a CFD model to simulate the heat transfer process, considering the combined effects of oil and air flows through mixed convection. The heat transfer between these two media within the radiators was modeled using an anisotropic porous medium approach. Additionally, the surrounding area of the radiators was modeled using a standard turbulent heat transfer model. The authors introduced a rapid and precise methodology for conducting simulations pertaining to a significant category of radiator cooling issues. Kim et al. [
8] conducted an investigation into the cooling efficiency of radiators utilized in oil-filled power transformers, specifically focusing on the application of ONAN and ODAN. The study employed analytical, numerical, and experimental methods to analyze the cooling performance of these radiators. The researchers conducted an analytical prediction of the temperature distribution and cooling performance of the radiator, which was subsequently validated using CFD results. Cha et al. [
9] investigated the influence of thermal head on the flow rate of an insulating oil in the pathway between a transformer and a radiator. The researchers employed commercial CFD software to conduct their analysis. It was discovered that the flow rate of the insulating oil exhibited an increase in correlation with the thermal head, consequently leading to an enhancement in the cooling efficiency of the radiator. Tălu and Tălu [
10] conducted a study on the cooling efficiency of a 630 kVA transformer radiator. This investigation employed numerical analysis techniques, specifically utilizing the Finite Element Method (FEM). The researchers examined the cooling efficiency of the radiator based on the ambient air temperature surrounding the radiator. Hence, it has been verified that the cooling efficiency of the radiator is enhanced when the angle of inclination throughout the cooling manifold and the transformer is approximately 20 °C.
Seong et al. [
11] conducted a numerical investigation to analyze the fluid flow and heat transfer distribution within a transformer radiator. This analysis was performed using commercially available CFD software. The researchers conducted an analysis on the cooling efficiency of the radiator by employing various cooling techniques. The researchers discovered that augmenting the overall length of the radiator yielded better results in enhancing the cooling efficiency, as opposed to increasing the quantity of radiator fins.
Dorella et al. [
12] utilized computational fluid dynamics (CFD) simulations to conduct the thermal design of a power transformer radiator. The analysis of thermo-fluid dynamic performance was conducted by introducing artificial body forces and a numerical scheme. Turbulators and wall indentation arrangements were proposed to improve heat transfer and increase cooling capacity. Simulations demonstrated that these modifications enhance the heat transfer coefficient and the cooling capacity of the radiator. Azbar et al. [
13] conducted a study. A 3D numerical simulation was conducted to investigate the impact of geometrical and operational parameters on the cooling of three-phase power transmission transformers. The study investigated the morphology of transformers, including their shape, fin shape, and arrangement. Circular and hexagonal shapes, when compared with traditional transformer shapes, resulted in a decrease in average oil temperature. The unequal heights of the fins enhanced the cooling process. The trapezoidal perforated fins exhibited the highest thermal performance. The hexagonal transformer, equipped with a perforated trapezoidal fin, achieved a 12% greater reduction in oil compared with the rectangular transformer.
In their study, Cho and Kim [
14] introduced a computational approach for determining the cooling efficiency of radiators employed in power transformer cooling systems. They utilized two well-established models to address the heat transfer resulting from natural convection within the radiator and the surrounding cooling air. A comparative analysis was conducted between the outcomes derived from two conventional models and the results obtained through CFD analysis, as well as the experimental data. The objective of this investigation was to gain insights into the heat transfer mechanisms occurring within the radiator and to develop an optimal cooling system for power transformers. In a similar vein, Shim et al. [
15] conducted a numerical analysis to investigate the natural convection occurring between the radiator and the surrounding cooling air. The study employed a simplified mathematical model for this purpose. In addition, a CFD analysis was conducted to examine the fluid flow and heat transfer phenomena surrounding both the actual and simplified configurations of a radiator, as influenced by natural convection. The researchers conducted a comparison between their CFD findings and the outcomes derived from the simplified mathematical model, as well as the experimental data. Nabati et al. [
16] conducted numerical simulations to analyze the variation in temperature and flow distribution within a radiator used for ONAN cooling. The primary objective of their research was to investigate the correlation between the characteristics of the radiator and the cooling performance of the system.
Rodriguez et al. [
17] presented a comprehensive study on a conventional 30 MVA power transformer, encompassing semi-analytical calculations, CFD simulations, and experimental measurements. The analysis focused on the capacity for cooling of the current radiator development when operating in ONAN mode, with a brief discussion of potential enhancements to the existing design. The creation of a thermo-hydraulic radiator model that accurately predicts oil temperatures and is applicable to various types of oils was described by Van der Veken et al. [
18]. This model was based on physical equations. The authors of the study introduced a methodology to estimate airflow velocity by considering the fan properties and radiator structure in thermal calculations. In their study, Chandak et al. [
19] conducted a numerical analysis to investigate the impact of radiation on the transfer of heat from a transformer radiator. The researchers observed that a consideration of radiation is necessary when examining the natural convection scenario. With the exception of the studies conducted by Paramane et al. [
20] and Van der Veken et al. [
18], the aforementioned numerical investigations did not take into account radiation heat transfer.
Medeiros et al. [
21] performed a thermal experimental assessment of a power transformer under the cooling conditions of oil-directed (OD), oil-forced (OF), and oil-natural (ON). In order to ensure safe functioning, it is important to design a cooling system that can effectively regulate the transfer of heat to the surrounding environment. Their study investigated the thermal efficiency of a prototype transformer using three different cooling methods, offering significant insights for the development of dependable transformer designs. The ON mode offers higher temperatures at a lower cost and maintenance level. However, achieving better thermal performance requires the use of external pumps, which incur additional costs. Rodrigues et al. [
22] evaluated the thermal efficiency of power transformers and the placement of optical fiber sensors for temperature monitoring. The article employed an experimental and computationally combined method to examine the thermal performance of power transformers and assess the positioning of optical sensors. The study involved comparing measurements obtained from a prototype power transformer with 20 optical fiber sensors to CFD simulations. The study demonstrated that temperature measurements obtained at certain times may not accurately depict the critical temperatures along the windings of transformers.
The existing literature contains studies that investigate the impact of geometric parameters on cooling performance and explore geometric optimization for transformer-cooling systems from a thermal perspective. In their study, Raeisian et al. [
23] conducted a CFD analysis on a 200 kVA distribution transformer operating under the ONAN-cooling regime. The researchers focused on identifying the key geometric parameters that have the most significant impact on the hotspot temperature. The present study employed a response surface methodology to optimize the radiator’s geometry. Amoiralis et al. [
24] conducted a numerical investigation on the optimal design of the ONAN transformer-cooling apparatus. The study investigated various tank designs for transformers, considering additional important factors such as the quantity and placement of the winding cooling ducts. The objective was to analyze how the geometry of the tank influences the performance of the cooling system in transformers. The cooling effectiveness of a power transformer with ONAN cooling was numerically investigated by Anishek et al. [
25], although experimental validation was not conducted. An optimization analysis was conducted on the radiator, revealing that the proposed design exhibited a 14% improvement in cooling performance compared with an existing design, while maintaining the same material cost. The researchers conducted a study to examine the independent impact of radiator height and fin spacing on cooling performance. In a study conducted by Smolka [
26], the utilization of CFD and genetic algorithm techniques was employed to propose an optimal arrangement for the windings and associated oil channels. The objective of this configuration was to effectively reduce the temperature of hotspots within the winding system. In their study, El Wakil et al. [
27] utilized a numerical approach to investigate the heat transfer and fluid flow characteristics of an insulating medium within one phase of a three-phase 40 MVA power transformer. It is important to note that the numerical method employed by the authors was not validated through experimental means. The researchers examined six distinct geometrical configurations and six varying oil flow rates to analyze the impact of these parameters on the cooling efficiency. Chereches et al. [
28] conducted a numerical parametric analysis on a modified power transformer in order to examine the impact of different parameters on the cooling system’s performance. According to their findings, the placement of an obstacle at the lower section of the transformer facilitated the directed flow of coolant towards the region with the highest temperature, resulting in a reduction of the maximum temperature. Nematzadeh et al. [
29] introduced two innovative integrated power cycles designed specifically for low-temperature heat sources. This was demonstrated through a thorough thermoeconomic simulation of the system. According to the findings, the throttle valve and absorber are the most detrimental components. An analysis of crucial parameters indicated that the generator and condenser temperatures have a direct impact on the energetic efficiency of the proposed power cycles, causing them to either increase or decrease. In their study, Eslamian et al. [
30] utilized FEM and CFD approaches to simulate the heat transmission of a dry-type transformer. They examined the impact of various factors, including duct width, on the temperature distribution within the transformers.
A comprehensive review of the existing literature reveals that while a considerable amount of research has been conducted on the cooling systems of transformers, the process of optimizing these systems is still in its nascent phase. The optimization efforts can be classified into two primary groups based on the methodology employed in the investigation. The first group has focused on examining the impact of different geometrical parameters on the hotspot temperature in windings, as evidenced by references [
23,
25,
28,
30]. The second group has worked on studying the effects of a variety of geometrical parameters on the total cooling performance of the transformer cooling system, as indicated by references [
24,
25,
27]. The verification experiments were carried out in a limited number of optimization studies, specifically [
23,
26,
30]. Furthermore, none of the aforementioned studies have taken into account an optimization study from an economic perspective. In this study, for the first time, optimal radiator configurations from both thermal and economic perspectives, with the goal of reducing investment costs, have been investigated.
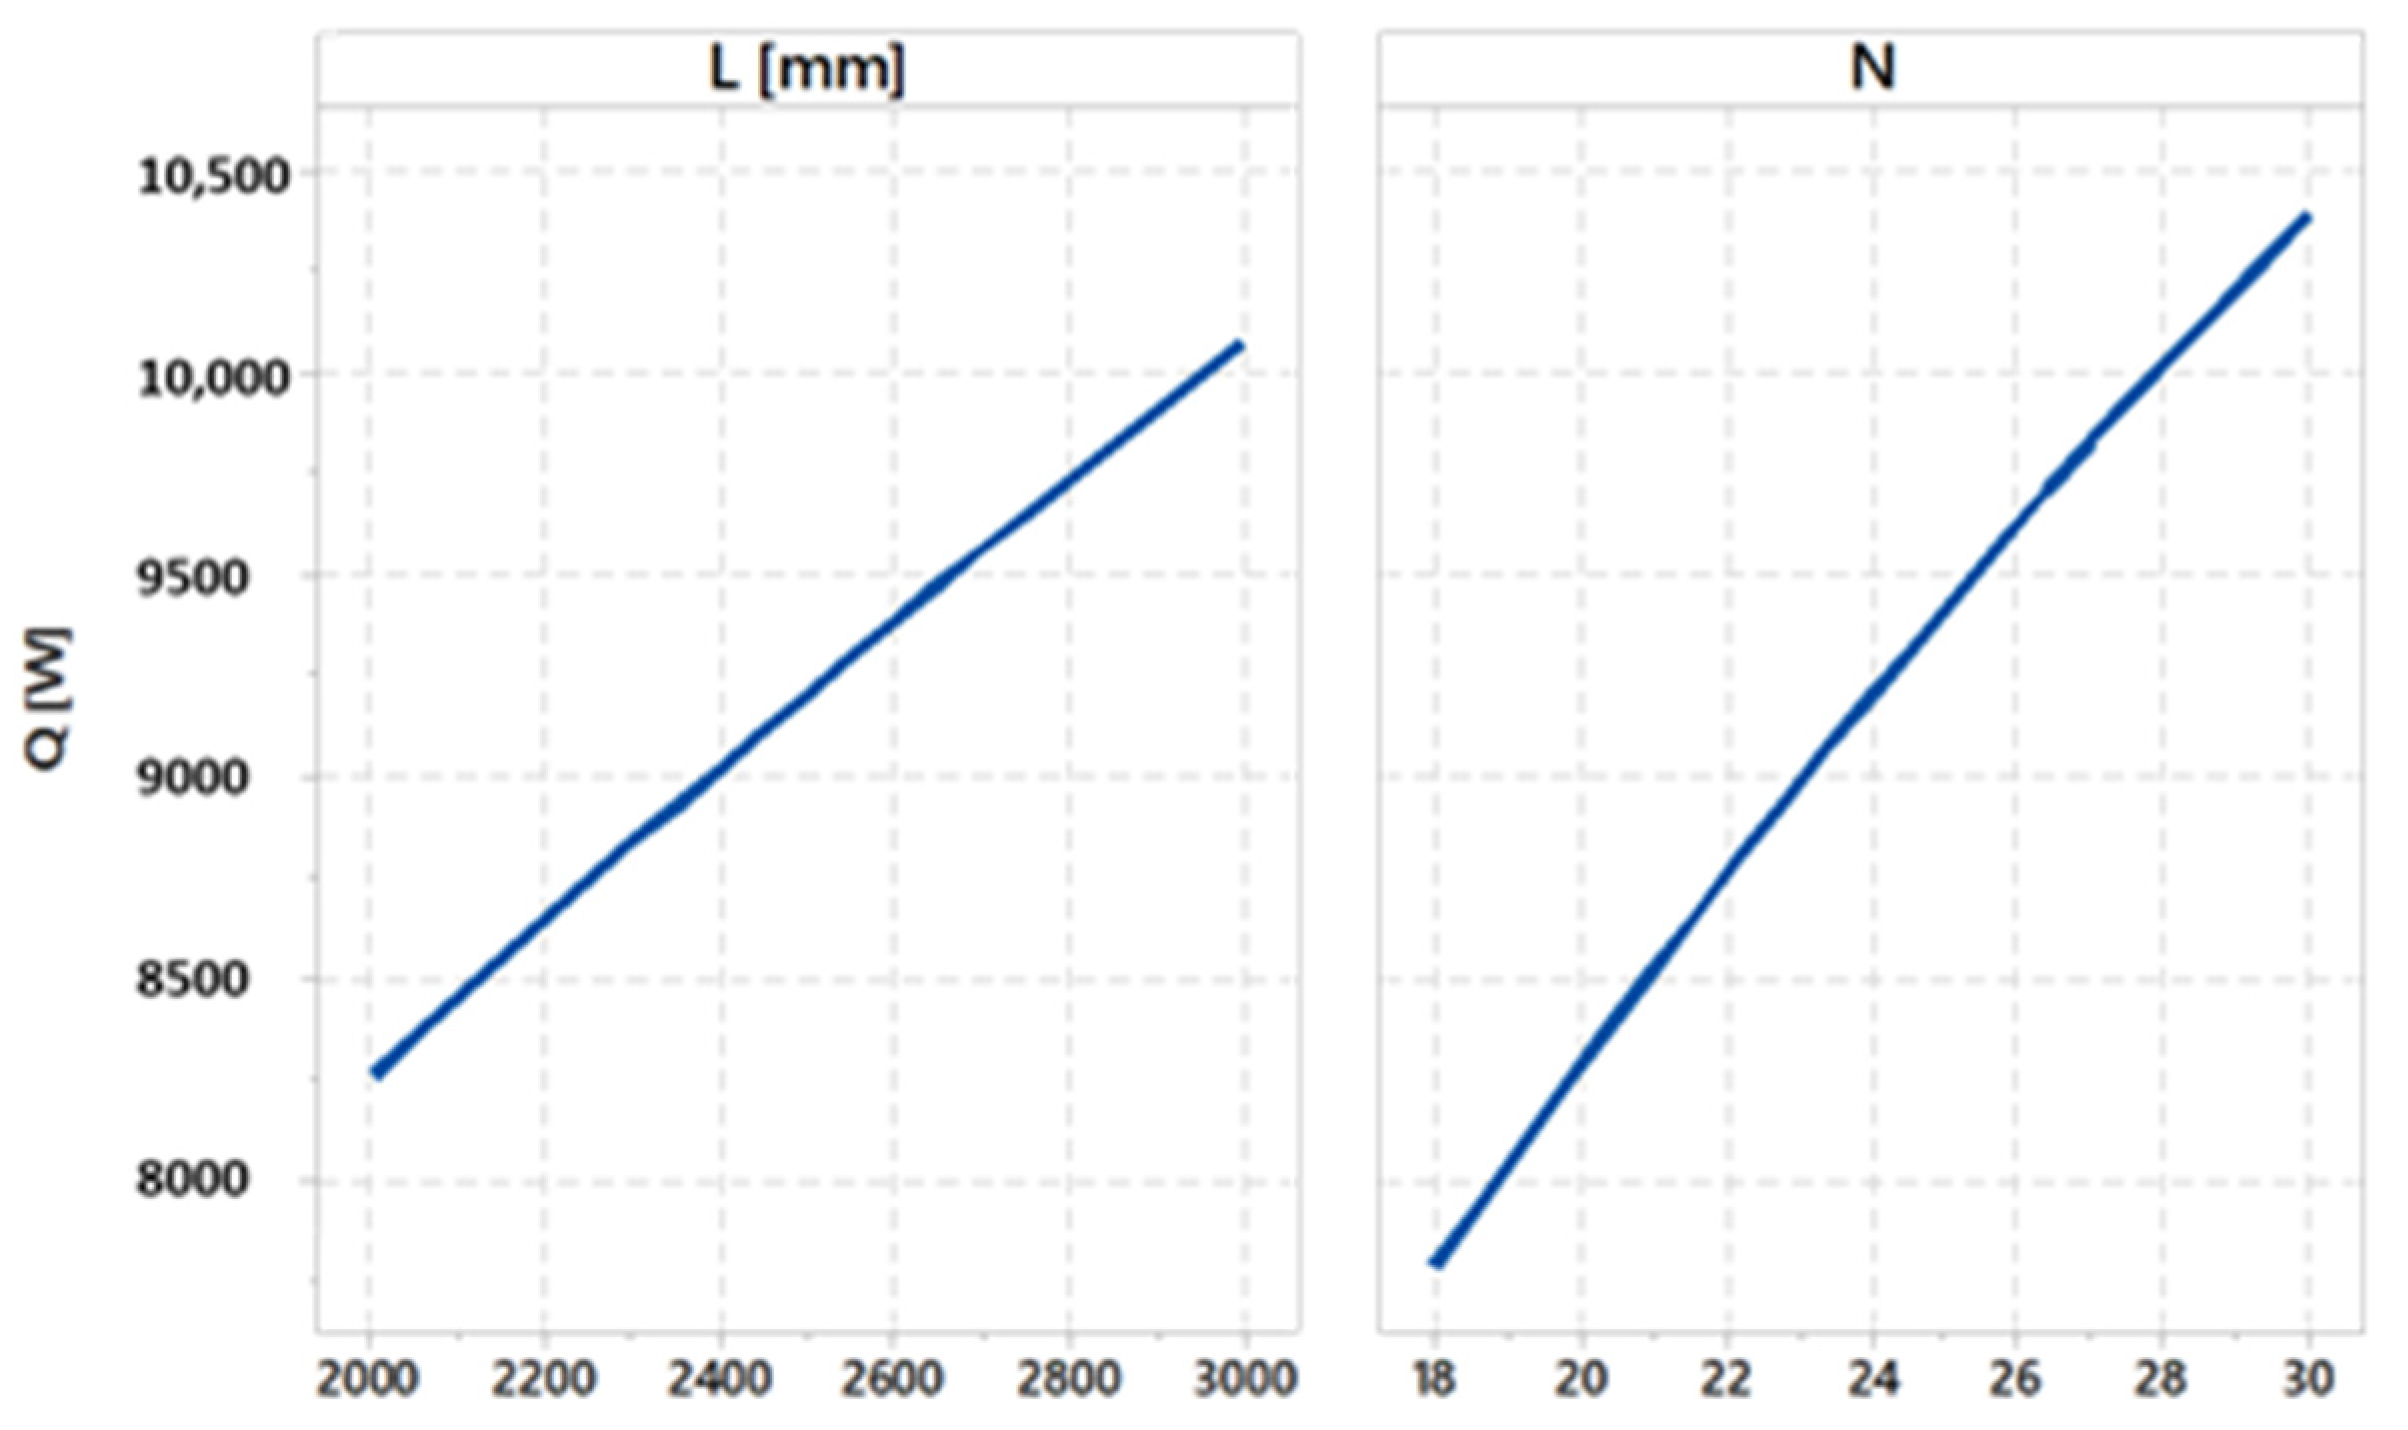
The main aims of this study are to investigate the thermal effectiveness of the radiator under different configurations and dimensions and to optimize these dimensions and configurations based on a techno-economic analysis for varying cooling loads. Within the confines of this specific context, the optimization criteria were determined to be the height of the radiator (L), the spacing between radiator fins (D), and the quantity of fins (N) contained within a radiator. Given these objectives, the cost factor is also examined. The results obtained from this extensive analysis provide significant contributions to the field of heat transfer optimization. Through the acknowledgment of the robust association between geometrical variables and heat transfer, coupled with the concurrent consideration of cost implications, individuals engaged in research, engineering, and practical applications can make well-informed choices when designing or optimizing systems to achieve improved thermal efficacy and cost-effectiveness. Hence, this study presents radiator geometric configurations that offer the most cost-effective solutions for achieving the desired cooling capacities. The aforementioned objectives were successfully accomplished through the implementation of the subsequent measures. The simulation of the flow and temperature fields within the radiator, as well as the surrounding ambient air and solid components, was conducted using Ansys Fluent 2023 R1© software, a widely used commercial CFD tool. Furthermore, the numerical model was verified using experimental data. Subsequently, a numerical investigation was conducted to examine the effects of various geometrical parameters. Finally, the response surface method (RSM) was employed, utilizing the commercially available statistical software, MINITAB v19©, to attain an optimal arrangement of the radiator that ensures the desired cooling capacity while minimizing associated costs. It should be noted that this research used a transformer cooling system based on the ONAN mode, thereby limiting the applicability of the findings to other cooling modes.
Since the modeling of the air and oil domains is expensive, the majority of numerical studies do not take radiation heat transfer into account, with the exception of Paramane et al. [
2,
20] and Van der Veken et al. [
18]. Hence, an additional innovation of this study involves the incorporation of modeling for both fluid and solid domains, as well as radiation heat transfer within the air domain, in order to achieve comprehensive and accurate simulations. The simulations were conducted using a high-performance computing system comprising 500 processors. Previous research has shown that there is a disparity between the number of experimental investigations and numerical studies conducted. Hence, an additional aim of this study is to present supplementary data from experiments in order to enhance comprehension of the thermal properties of transformer cooling systems. In order to obtain precise test results for different transformer cooling applications in diverse climatic conditions, a comprehensive experimental setup was meticulously designed and constructed. The experimental studies were conducted at the facilities of the General Electric Grid Solutions company.
Figure 1 shows the schematic illustration of this study.
2. Numerical Methodology
The cooling model considered in the current cooling system is the AN (air-natural) model. In the AN-cooling model, the radiators are cooled through natural convection, whereby cooling fans are absent and heat dissipation occurs solely along the surface of the radiators. The transformer under consideration employs mineral oil as a circulating cooling medium within both the active part and the tank. This facilitates the absorption of heat from the core and windings, which is subsequently dissipated to the surrounding air through the tank and fin surfaces. The purpose of this cooling system is to ensure a consistent and dependable temperature distribution throughout the transformer. In this context, the oil contained within the transformer was regarded as the numerical domain, and its convective heat transfer was modeled and simulated in a 3D manner. To obtain a comprehensive understanding of the fluid dynamics within the radiator, as well as the associated temperature distribution and heat transfer, a numerical model was developed.
The primary objectives of this simulation study are to examine the thermal performance of the radiator across various configurations and dimensions, as well as to optimize the dimensions and configurations from a techno-economic perspective for different cooling loads. In the present context, the optimization criteria encompass the determination of the radiator height, the spacing between the fins, and the quantity of fins within a radiator. The evaluation of these three parameters is necessary as they are interdependent criteria that should be considered in conjunction. In this context, the simulations were categorized into two distinct components. The investigation focused on determining the gap between each fin. Furthermore, an examination was conducted on the height and quantity of radiator fins. A total of 76 sets of radiator configurations were examined. The input data for the techno-economic study are derived from the results obtained through CFD simulations.
2.1. Physical Model
Radiators are heat exchangers made of steel plates that are typically positioned in a vertical orientation mounted on transformers. The panels comprise two steel fins that are pressed and welded together. In the context of simulation studies, a solitary radiator is represented as a physical model. Given the large number of elements and the significant computational load, the utilization of the symmetry boundary condition is employed. The CAD model was generated using CATIA V5R28
© software and parametrically prepared utilizing the Design Table
© feature. In a solid modeler, the process of geometry clean-up involves the removal of brackets and other small components. This procedure does not have a substantial impact on flow and heat transfer. Additionally, this approach contributed to a reduction in the duration needed for meshing, consequently resulting in decreased computational time.
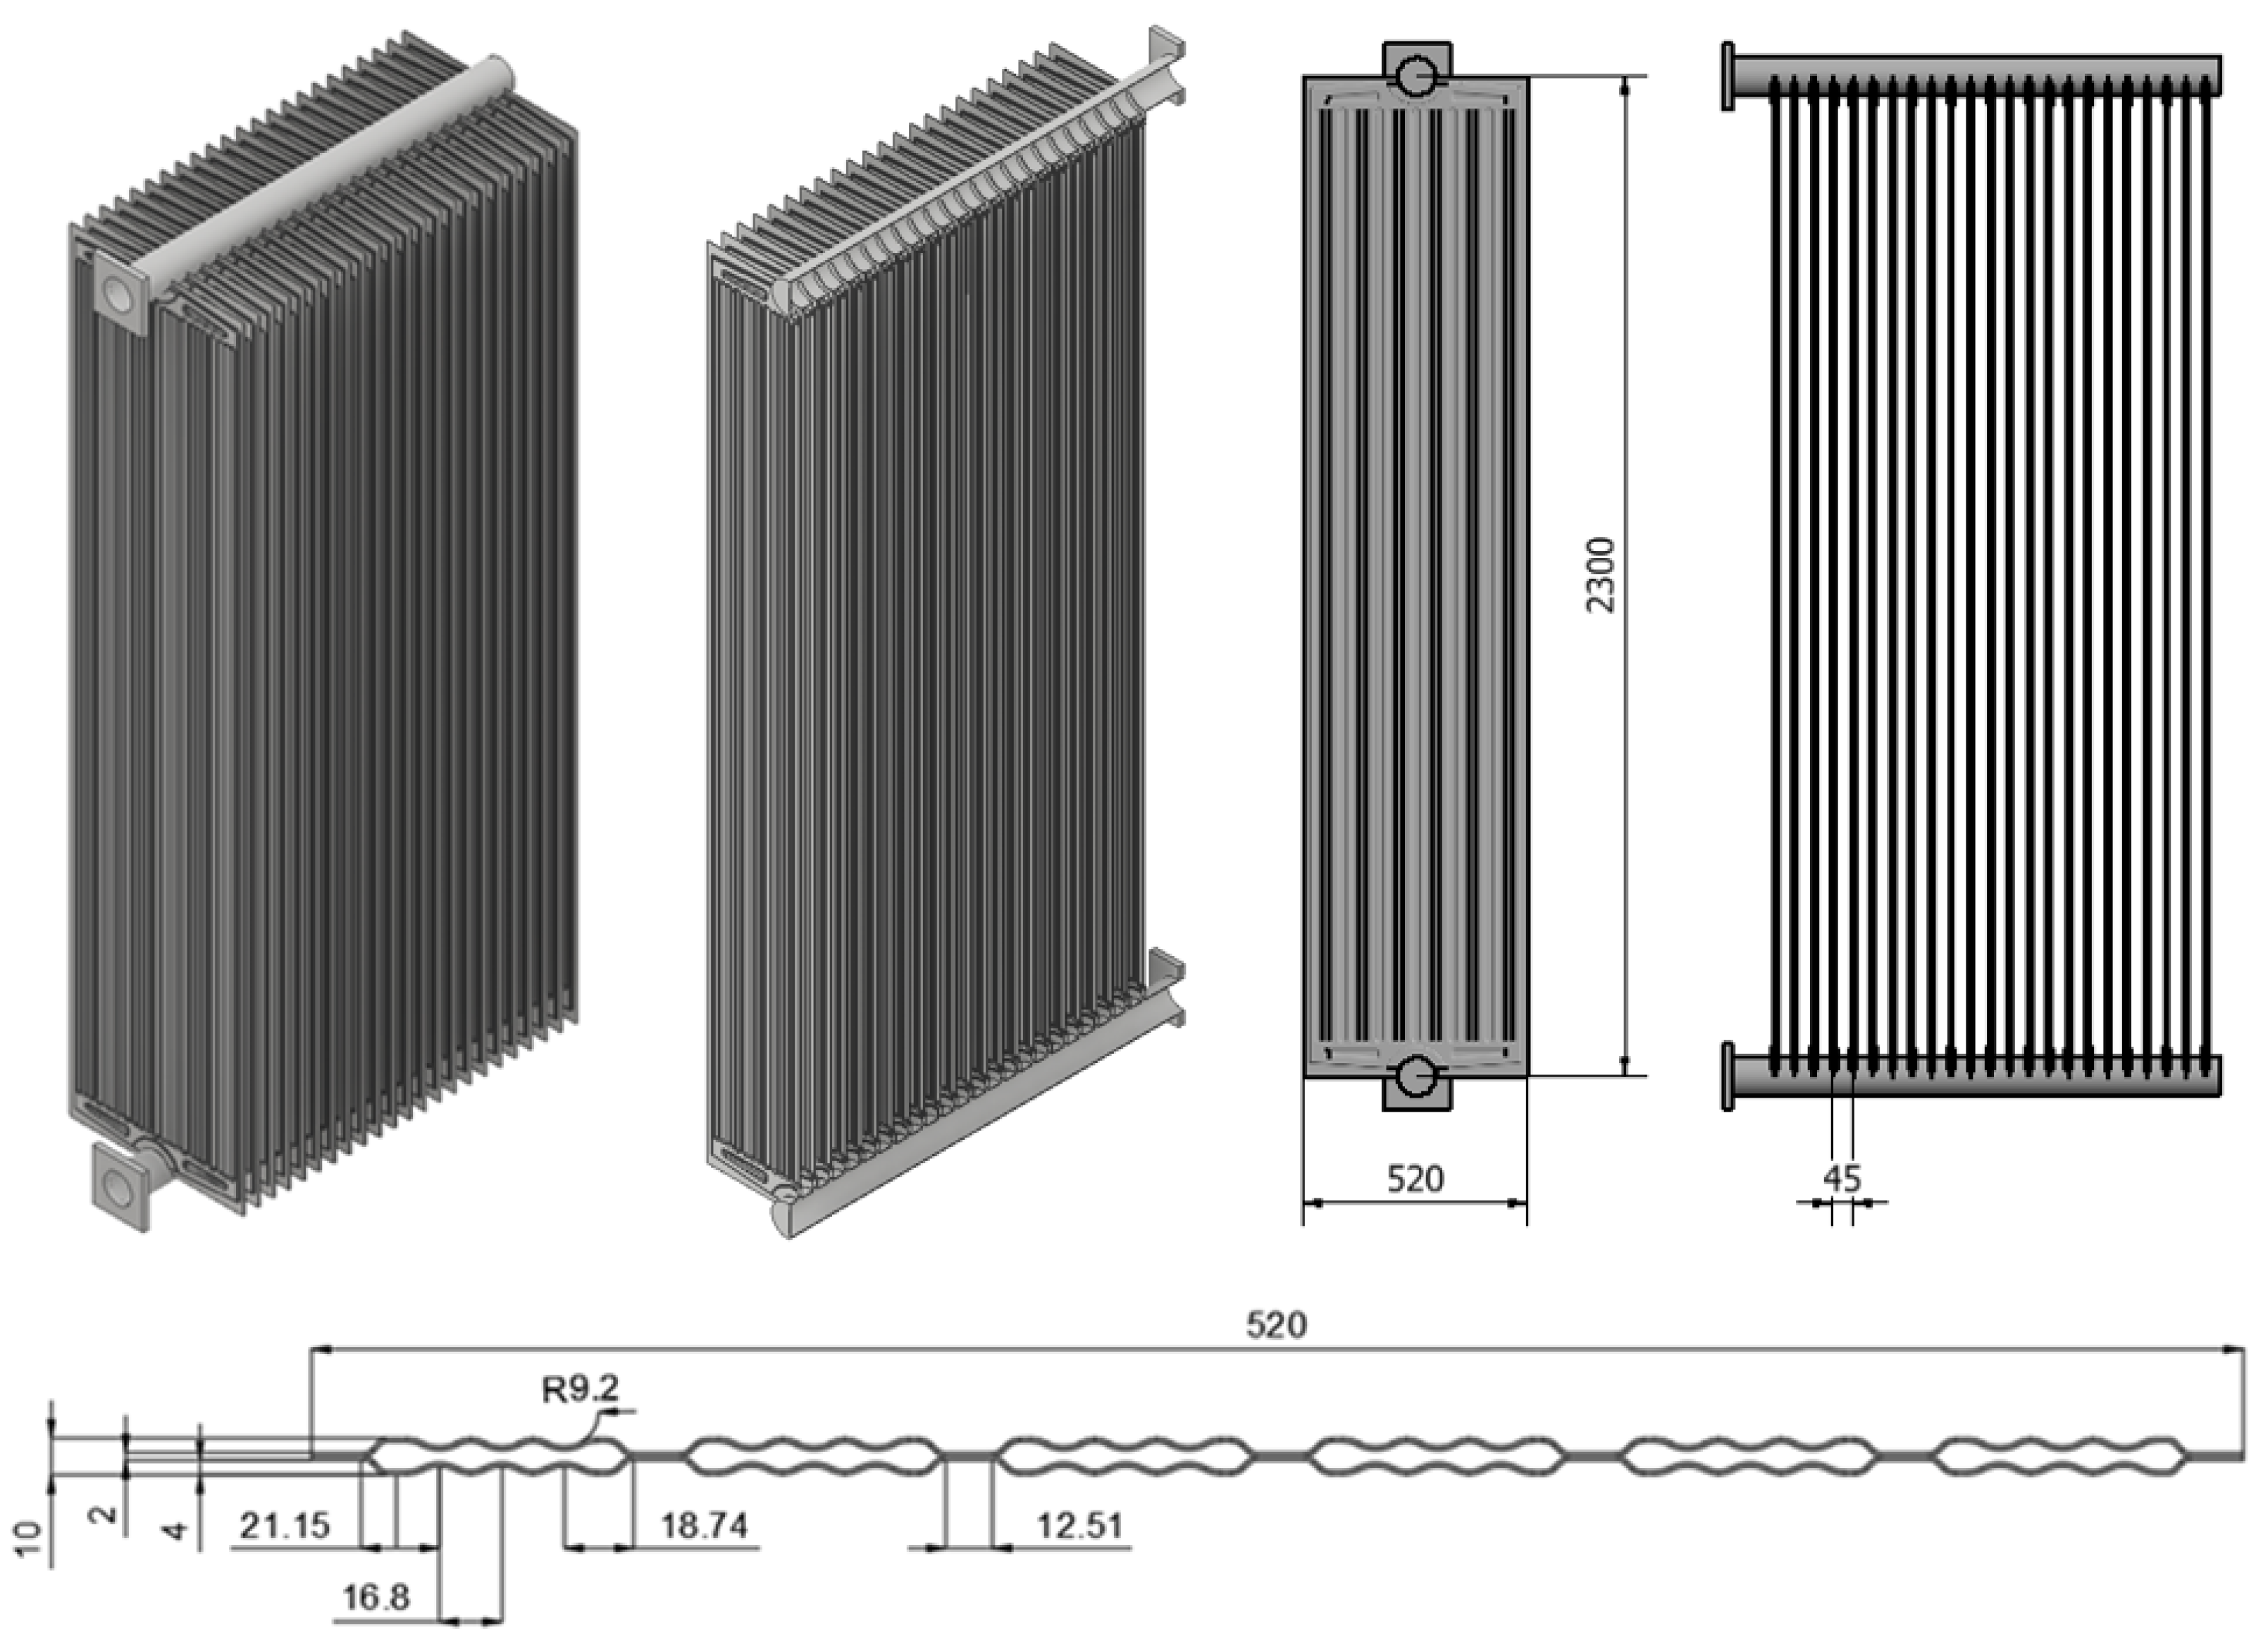
Figure 2 displays the visual representation of the CAD geometry with dimensions after undergoing the cleaning process. The vertical attachment of panels with a standardized width of 520 mm and varying heights ranging from 1000 to 3000 mm can be observed in the frontal view of the diagram. These panels were affixed to the horizontal header pipe. This study examines a range of 11–35 fins per radiator, which were horizontally positioned with inter-finned gaps measuring 35–50 mm. The hot oil was introduced into the upper collectors, where it traversed through these channels. During this process, thermal energy was transferred from the oil to the steel fin, subsequently dissipating into the air that circulates between the radiator fins. Ultimately, the downward movement of oil within the radiator fins was subjected to cooling, subsequently entering the lower header pipe and returning to the transformer tank. The sizing and design processes for transformer radiators are described in detail in the
Appendix A.
In order to mitigate the entrance effect and minimize the backflow resulting from the wake, the lengths of both the inlet and outlet pipes were extended. According to the details presented in
Figure 3, the radiator consisted of upper and lower manifolds with a diameter of 88.9 mm. Additionally, each individual radiator fin had a width of 520 mm. Once the geometries were simplified, the flow volume for the fluid (oil) was generated. The simulations did not incorporate the volumetric representation of the radiator slice. The high thermal conductivity of the metal material used in the radiator slice with a thin wall thickness allowed for the neglect of heat conduction resistances within the wall thickness. The volume of oil extracted for the solid volume and final domain was determined, as depicted in
Figure 3. Subsequently, in order to assess the impacts of natural convection, air domains of considerable size were generated, originating from and extending beyond the edges of the radiator. The air inlet is defined as a pressure inlet from all sides, while the air outlet is defined as a pressure outlet located at the top. The ‘Wall’ boundary condition was specifically designated for the ground surface.
2.2. Grid Generation
The Fluent T-Grid Mesher
© was employed to generate the grid for both models due to its flexibility and ability to regulate grid quality and optimize grid density during the grid production process. Subsequently, the grid configuration for each subdomain was established through the implementation of various localized procedures. Given the significant variation in dimensions, particularly for the radiator fins with a height of 3 m and a fin thickness of 1 mm, the geometry in this study was subjected to simplification to minimize its impact on the outcomes of the real system. The control of mesh quality in different regions of the domain was achieved through the utilization of various options available in the software. The mesh structure of choice was poly-hexcore. The poly-hexcore mesh structure employs polyhedral elements in close proximity to the wall, while hexagonal elements are utilized in regions further away from the wall. Hence, as depicted in
Figure 4, all surface meshes exhibited a polyhedral configuration and employed a hexagonal mesh pattern within the flow region. The poly-hexcore structure exhibited reduced memory coverage properties and a lower element count compared with solution meshes featuring a tetrahedral or polyhedral structure. Consequently, the utilization of a poly-hexcore structure led to a reduced analysis time while simultaneously achieving a higher-quality mesh. If the standard tetrahedral mesh was employed, there would be a sixfold increase in the total number of meshes and the corresponding resolution times.
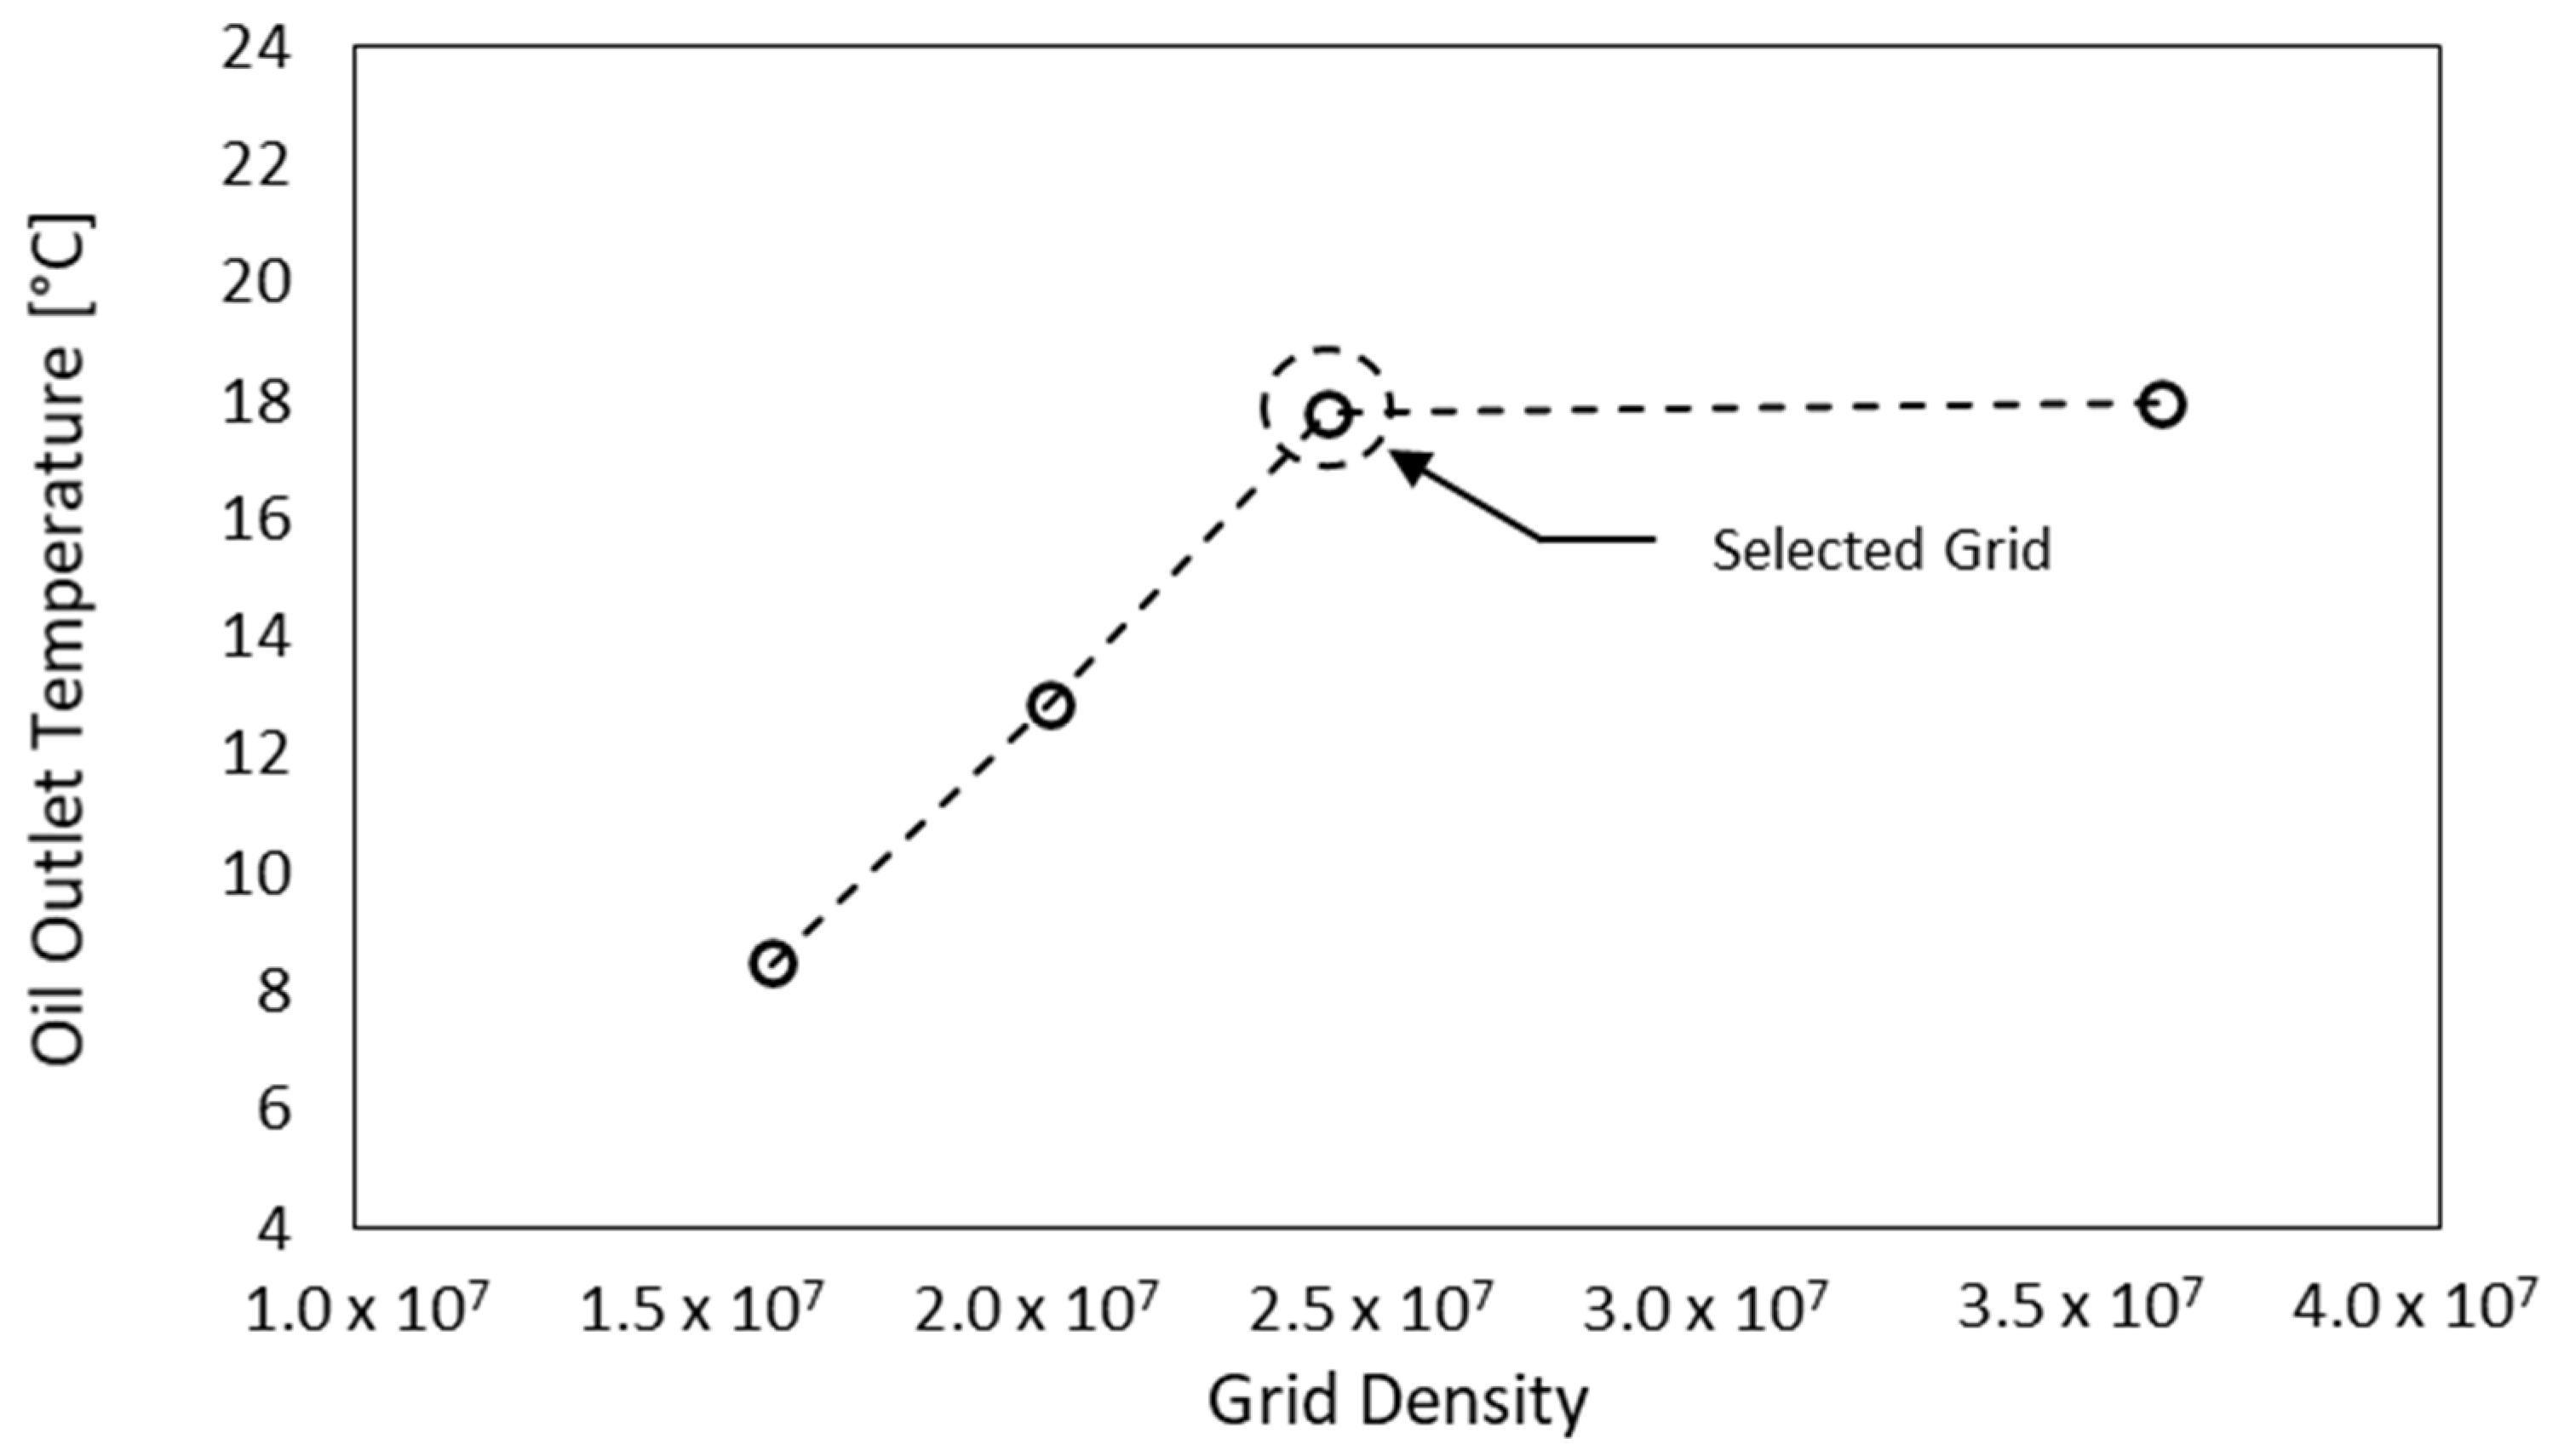
A grid independence analysis was conducted for both models in order to determine the most suitable grid size for numerical calculations. A mesh independence analysis was conducted on the radiator geometry, which had a length of 2300 mm and 23 fins. Initially, the geometry files were transferred to the Fluent Meshing© platform, where a surface mesh was generated. Subsequently, a volume mesh was acquired. Four grid structures were generated and analyzed under identical boundary conditions in this study. The grid densities employed for the simulations of heat transfer and fluid flow in the selected models varied within the range of 16 to 36 million. The primary criterion for independence was the average temperature of the oil upon exiting the radiator. The temperatures were selected as parameters to assess the outcomes of the energy solution model, while the velocity values were chosen as parameters to evaluate the outcomes of the flow (turbulence) solution model.
Figure 5 depicts the computed oil outlet temperatures (T
oil,out) for each of the grid structures. The difference in oil outlet temperature between the Grid-3 and Grid-4 grid configurations is less than 1%, as shown in
Table 1. Based on the results obtained, it can be observed that the oil outlet temperatures, which can be considered as a measure of overall heat transfer quantities, tend to stabilize at consistent levels as the grid resolution is increased (see
Figure 5). The findings of this study indicate that grid structures containing approximately 24 million cells exhibit sufficient precision in capturing the thermal and hydrodynamic boundary layers in close proximity to the critical surfaces. The grid structures were employed in all the simulations by modifying them parametrically based on the dimensions of the model. The investigation of independence was conducted on the smallest radiator, resulting in larger geometries containing over 100 million elements. This is indicative of a significant amount of time dedicated to calculations.
In order to increase the precision of velocity and temperature gradient measurements in the near-wall regions, the grid element size was decreased as it approached the heat transfer surfaces. By employing this approach, the gradient near the wall was accurately resolved in order to effectively capture the boundary layer phenomenon. The investigation also included an examination of the non-dimensional wall distance parameter (y+), which plays a significant role in the adjustment of fluid shear stress and heat transfer near the wall. This parameter defines the region of the wall law where the governing equations are solved. During the process of dimensioning the boundary layer of the solution grid, the k-w SST turbulence model was formulated with the objective of maintaining the y+ parameter at a value below 1. The requisite computations were conducted by employing established turbulent boundary layer equations for a planar surface, as documented in relevant research papers. To determine the initial grid point, a target y+ value of less than 1 was taken into account. The first cell height was then computed as 0.2 mm for oil domains and 0.15 mm for air domains. In this particular context, an investigation was conducted to assess the influence of the number of boundary layer meshes in proximity to heat transfer surfaces on cooling effectiveness. This was achieved by employing various boundary layer mesh sizes and stretching ratios. The results indicate that there was a decrease of 0.1% in the overall cooling capacity when the density of the mesh at the surface was increased. This suggests that the impact of the boundary layer on the accuracy of the simulation outcomes is insignificant, affirming the suitability of the chosen boundary layer thickness. In order to avoid encountering any divergence issues, a maximum skewness value of 0.815 was maintained for all models within the selected mesh configuration. The properties of the chosen grid configuration are presented in figures provided herein.
A close up view near the heat transfer surfaces of the radiator is shown in
Figure 6.
2.3. Solution Methodology and Boundary Conditions
The simulations were conducted on a high-performance computing system comprising 500 processors. The time needed to complete a single simulation on 500 processors was approximately 8 h, resulting in a total computing time of approximately 200,000 CPU-hours. This significant amount of computing time was primarily due to the inclusion of modeling for fluid and solid domains, as well as radiation heat transfer in the air domain. The equations governing the conservation of mass, momentum, and energy for the fluid (oil and air) inside and outside the radiator can be denoted as Equations (1)–(3). These equations describe the three-dimensional, incompressible, and turbulent flow of the fluid, as well as the heat transfer, in the radiator of the transformer for the current conjugate heat transfer and fluid flow problem. The equation representing the conservation of energy for the conduction of heat transfer in the solid component of a radiator can be denoted as Equation (4).
Equations (1)–(3) correspond to the conservation principles for the mass, momentum, and energy of the fluid (either oil or air) inside and outside the radiator. In this context, the symbols
,
,
, and
in Equations (1)–(4) correspond to the variables representing velocity, pressure, temperature, and coordinate direction, respectively. The symbols
,
,
,
,
,
, and
denote the surrounding ambient air temperature, the thermal expansion coefficient of air, the viscosity of the fluid, the density of the fluid (either oil or air), the thermal conductivity of the solid (stainless steel), the thermal conductivity of the fluid, and the specific heat of the fluid, respectively. The terms
and
in the given context denote the Reynolds stress and turbulent heat flux, respectively. The variable
denotes the buoyancy term associated with the surrounding cooling air, as defined by the Boussinesq approximation. The utilization of subscripts i and j within the equations denotes the application of tensor notation. The application of the finite volume method was employed to discretize and assess the boundary conditions as well as the three-dimensional governing equations on a computational grid. The control volume technique involves integrating the internal conservation equations of each control volume and implementing discrete formulations that maintain relevant values [
31,
32]. The development of a segregated solver with double-precision was undertaken with the aim of solving the Navier–Stokes equation. The resolution of the interaction between pressure and velocity was achieved through the utilization of the PRESTO algorithm, which is compatible with the Boussinesq approach. The Fluent software’s shell conduction method was employed to compute the conductive heat transfer occurring within the radiator fins. The utilization of the Boussinesq approach was employed in order to enhance the accuracy of modeling the buoyancy effects associated with natural convection. This approach yielded superior precision outcomes at a reduced computational expense for fluid motions characterized by small variations in density, such as those observed in natural convection. The investigation of the proposed enhancement in wall treatment by Menter [
33] was conducted utilizing the shear stress transport (SST) κ-ω turbulence model. The SST κ-ω turbulence model has been found to exhibit a high level of accuracy and dependability. It is capable of evaluating distinct flows and adverse pressure variations by employing the κ-ω model in proximity to wall surfaces and the κ-ω model in the primary flow region [
33]. The surface to surface (S2S) radiation model was utilized to simulate the heat transfer of surface radiation in various radiator configurations. In this model, an emissivity value of 0.95 was assigned to the radiator surface.
The diffusion component in the momentum and energy equations was evaluated using a second-order central difference method, resulting in a trustworthy outcome. The utilization of the least squares cell-based technique, which has been proven to be efficient in scenarios where highly skewed cells are present within the calculation domain, was employed to discretize the spatial gradients. In order to ensure convergence during the computations, under-relaxation factors of 0.50, 0.25, 0.75, and 0.50 were specified for momentum, pressure, turbulence, and energy, respectively. In the context of a steady-state computational fluid dynamics analysis, a convergence threshold of 10−6 was selected to assess the convergence of the continuity, energy, and momentum variables. Additionally, discrepancies in the mass flow rate were observed, prompting the execution of iterative processes to minimize these imbalances to a satisfactory threshold of less than 0.3%. The temperature of the output oil, weighted by its mass, was also monitored during the iterations. Once the outlet temperature was established within a stable range, the calculations were carried out until the desired residuals were achieved.
Subsequently, the implementation of hybrid initialization was initiated, followed by the execution of various assessments. The radiation model was not activated during the initial 2000 iterations of the analysis. Once the convergence results had reached the desired levels, the radiation model was subsequently activated, and an additional 4000 iterations were executed. After undergoing 6000 iterations, the temperature monitoring point exhibited a deviation of merely 0.02% from its ultimate value. The energy balance was carefully maintained in each simulation, ensuring that the net heat transfer rate between the inflow and outflow heat transfer surfaces differed by less than 0.1%.
Boundary conditions were defined using data obtained from thermal tests conducted in the experiment. The boundary conditions at the inlet of the radiator for the internal flow of oil included an experimentally determined mass flow rate of 0.250 kg/s, an average inlet temperature of Tin,ave = 54.6 °C, a turbulence density of 1%, and a hydraulic diameter of 0.0889 m. An outlet boundary condition was implemented at the outlet, where the average static pressure was prescribed as 0 Pa. The aforementioned boundary condition was employed in situations where the flow was primarily oriented towards the exterior of the domain. In the context of external air flow, it is conventionally accepted that the reference ambient temperature is denoted as Ta = 15 °C. No boundary criteria for the heat-transfer faces are specified by the user. This phenomenon arises from the interconnectedness of heat transfer surfaces, wherein a solid zone is juxtaposed with a fluid zone on the opposing side. To ensure that each side of the wall corresponds to a physical wall, the solver employs an automated process to create a designated region called “shadow” when a grid containing a connected wall of this nature is imported. Consequently, by utilizing the information contained within the adjacent cells, it is possible to directly calculate the heat transfer. The side walls of the structure are classified as opening boundaries, facilitating the unobstructed movement of air in these areas. In contrast, the ground functions as a no-slip wall, impeding the flow of air. The opening boundary condition was specified to have a very low intensity of turbulence, specifically at a level of 1%. The rationale behind utilizing a low turbulence intensity is attributed to the phenomenon of air being drawn and expelled into an environment that is characterized by a state of relative quiescence. It is necessary to acknowledge that stainless steel, a material with consistent properties, was specifically designated for solid components. These properties include a density (ρ) of 8030 kg/m3, a specific heat capacity (cp) of 502.48 J/kg K, and a thermal conductivity (kf) of 16.27 W/mK. Mineral oil, when utilized as a refrigerant, is a distinct type of oil. The thermophysical characteristics of this oil were derived from prior investigations conducted by the GE Company. The simulation program incorporated the temperature-dependent thermophysical properties of mineral oil. Regarding the air properties, the density of the air in the vicinity of the radiator fin is described by the Boussinesq equations. Based on our preliminary simulation studies, we found that the radiator’s surrounding air temperature varies within a small range (20 °C to 30 °C). Therefore, the air’s thermophysical properties were assumed to be constant since its final results would not be significantly altered. The characteristics of air were evaluated under standard conditions of 1 Atm of pressure and a temperature of 25 °C. It is postulated that the thermophysical properties of the air remain constant regardless of temperature, with cp = 1006 J/kg K, ks = to 0.02437 W/mK, μ = 1.78 × 10⁻⁵ kg/m.s, and β = 0.00312 K−1.
3. Validation Study
In order to ascertain the precision of numerical simulations, it is crucial to verify the findings through an experimental investigation. For this reason, an exclusive experimental facility was developed and built internally to evaluate the thermal performance of transformer radiators. The aforementioned facility possesses the capability of assessing the cooling effectiveness of radiators in both AN and AF cooling modes, as illustrated in
Figure 7. It is imperative to emphasize that tests were exclusively conducted for the AN-cooling setup. The experimental setup consisted of six radiators that were securely attached to headers. The activation or deactivation of each radiator can be achieved by manipulating the valve positioned at both its inlet and outlet. The monitoring of the inlet oil temperatures and oil flow rates for each radiator was conducted using an IFM SA5000
© (IFM Electronic GmbH SA5000, Essen, Germany) oil flow sensor, while the monitoring of the oil outlet temperatures was carried out using a Qualitrol
© PT100 (Qualitrol, Fairport, New York, NY, USA). In addition, a single IFM SA5000
© (IFM Electronic GmbH, Essen, Germany) oil flow sensor was employed to control the aggregate oil flow within the pipeline responsible for collecting the outlet of the radiators. The data acquisition system employed for the monitoring of flow and temperature sensors was the Elimko E-680
© (Elimko, Ankara, Türkiye). To maintain thermal equilibrium and counteract the expansion of the oil, a conservator was positioned above the header.
The mineral oil utilized in experiments and simulations exhibits a decomposition temperature of 140 °C. Directly heating the transformer oil with a resistor is deemed inappropriate due to the elevated temperature of the resistor surface, which can reach 350 °C, leading to the degradation of the transformer oil. The accuracy of numerical computations will be compromised by the modified viscosity and other altered properties of the degraded oil. The utilization of a particular methodology and the meticulous consideration of this issue are of utmost importance when applying heat to the oil. To mitigate the presence of uncertainties, an experimental setup incorporating a MicaFluid VOP200R
© (MicaFluid, Schlieren, Switzerland) oil treatment plant, equipped with temperature and oil flow control mechanisms, was employed. This setup facilitated the heating of the oil and ensured a consistent cyclic process. The observed phenomenon can be attributed to the simulated internal heating resulting from the core and windings within the transformer. The heated oil was introduced into the conservator, subsequently distributed to the radiators, and underwent cooling as it passed through the radiators, ultimately returning to the MicaFluid VOP200R
© (MicaFluid, Schlieren, Switzerland) oil tank. The circulation loop was sustained until a state of equilibrium was achieved. Following the attainment of a stable condition, the FLIR T865 (FLIR, Wilsonville, US) thermal imaging camera was employed to visually represent the temperature distribution across the radiators and other components, as depicted in
Figure 8.
The experiments were carried out within a controlled laboratory environment that was completely enclosed to minimize any potential interference from air currents that could potentially impact the accuracy of the measurements. The ambient temperature was assessed by employing four measuring points carefully placed around the experimental setup and subsequently calculating the average of these recorded temperatures. The experimental study employed radiators with dimensions of 2300 mm in length, 520 mm in width, and 23 fins. The radiators were positioned with a spacing of 500 mm between their axes. The temperatures of the oil were measured at both the inlet and outlet points of each radiator. Upon an examination of the oil inlet and outlet temperatures, it was observed that the recorded values exhibited a minimal deviation of ±0.2 °C between radiators. In order to minimize computational expenses and time, a solitary radiator was employed during the validation simulations. The inlet temperature values of radiator number 3 were utilized for comparison with the simulation outcomes. It is important to acknowledge that the comprehensive uncertainty associated with the determination of the cooling capacity was quantified at 5.6%.
The total cooling capacity was compared between the experimental and numerical results, with consideration for different oil flow rates. In this section, we provide an account of the validation process for the numerical model by conducting a comparative analysis between the computed outcomes and the experimental data. A satisfactory level of agreement was observed between the results obtained from numerical simulations and experimental measurements with respect to the overall cooling capacity. Under conditions of steady-state, the observed cooling capacity of a single radiator was recorded as Q
T-exp = 8335 W for an oil mass flow rate of 0.25 kg/s. This value was approximately 3.5% lower than the computed cooling capacity obtained from the simulation, which was Q
T-CFD = 8678 W. The extent of this deviation increased as the mass flow rate increased. The experimentally determined value for Q
T-exp was 23,693 W, whereas the simulation results yielded a value of Q
T-CFD = 27,495 W for a flow rate of 1.5 kg/s, resulting in a deviation of 16%. The mean Q
T variation observed between the simulated data and the experimental results was approximately 9.8%, as depicted in
Figure 9. It is important to acknowledge that parametric simulations were performed at a flow rate of 0.25 kg/s, resulting in a discrepancy of 3.5% between the simulated values and the measured data. The acceptability of this discrepancy is attributed to the inherent uncertainties associated with temperature and oil flow rate measurements, which can be related to the limitations of the measuring instruments’ accuracy. A contributing factor to this discrepancy is the omission of the influence of neighboring radiators in the radiator simulation, which was a significant factor in the experimental measurements. Additionally, the deviation can be attributed to the heat losses incurred by the oil piping system in the experimental setup. In the field of engineering, a certain degree of tolerance for inaccuracy is acceptable, considering the specific objectives of the ongoing investigation. The results indicate that the 3D CFD-based modeling, as proposed, was effectively executed and experimentally validated. The demonstrated efficiency and accuracy of the proposed method further support its efficacy.


