1. Introduction
Intensive care units (ICU) are equipped with highly sophisticated technical systems and devices for patient monitoring, respiratory and cardiac support, pain management, emergency resuscitation, and other life support measures. To ensure uninterrupted monitoring of patients with life-threatening illnesses and injuries or after major surgical procedures, these medical devices issue visual and acoustic alarms for various reasons. Each alarm has an individual sound, with the pitch and frequency of the sounds increasing with the priority of the alarm.
Research has shown that the number of alarms can rise to up to 350 per patient a day [
1]. Since most ICUs foster a ubiquitously audible alarm distribution, each of these alarms sounds from a central working and monitoring station and, depending on the local alarm policy within the hospital, also from the patient‘s room—audible for every person in the ICU but difficult for the source to be identified [
2]. Each alarm, therefore, needs to be evaluated and acknowledged by the caring nurse. The majority of the issued alarms, however, require no intervention from the other nurses and distract them from their current task. In addition to the unnecessarily increased cognitive workload, the high number of alarms results in desensitization and lower response time of healthcare professionals. This condition is called alarm fatigue [
1].
Alarm fatigue may have severe consequences not only for the patients but also for the healthcare professionals. Staff involved in a negative patient event (e.g., due to a missed alarm) can suffer from trauma called “second victim syndrome,” when the person who feels responsible for the failure suffers from guilt and depression, perhaps even occupational disability [
3].
Wilken et al. [
4] mentioned possible reasons for the high number of alarms and the resulting alarm fatigue, e.g., the use of default values for alarm thresholds. Default values can cause many unnecessary alarms by signaling that a vital data point exceeds the threshold but does not pose a threat for the patient. Other reasons may include inadequate use of electrodes or sensors, which can cause false alarms by e.g., falling off or disconnecting.
Using smart alarm-delay algorithms, daily electrode changes, or alarm management education already shows positive effects in reducing the number of unnecessary alarms [
5]. The remaining unnecessary alarms, however, are still audible for every person in the ICU, distracting both patients and nurses.
Previous work in several domains has shown success using visual or tactile alerts [
6,
7,
8]. A body-worn device, for example, can allow just the responsible nurse to receive the alarm. We assume that alarms can also be conveyed reliably via other modalities. In our work, we investigate the suitability of light, vibration, and sound via bone conduction speakers for critical care alarms using a wearable alarm system (WAS) in the form of a head-mounted display (HMD).
In prior design studies, we found suitable light and vibration patterns to represent three different urgency levels for patient alarms. We conducted a user study under task conditions that mimic concrete loads of nursing tasks with 12 nurses in an ICU lab. We compared different modalities for representative monitoring alarms on our HMD to the state-of-the-art: ubiquitous sound. Our results show that visual and tactile alarms presented on an HMD performed better than speakers regarding the factors of reaction time, error rate, perceived suitability, perceivability, and level of annoyance. Moreover, our prototype shows good usability and comfort. Based on this research, we propose a multimodal alarm design to present three different types of urgency.
This paper is organized as follows: The next section (
Section 2) gives an overview of our general approach to reduce the alarm load on ICUs.
Section 3 shows related work that helped us shape our own work. In
Section 4, we describe our requirements for a multimodal wearable alarm system (WAS), based on a requirements analysis published in 2018 [
9].
Section 5 and
Section 6 are based on previous publications [
10,
11], which motivated and documented the design of vibrotactile and peripheral light alarm patterns and their general applicability in this context. The results from these earlier studies suggested the patterns we used in the final evaluation. The evaluation and the results are presented in
Section 7 of this work. Finally, in
Section 8, we conclude and give examples for future work.
2. Approach
Our overall goal is to reduce the alarm load on ICUs by developing a wearable alarm system. This includes the design of:
For our multimodal alarm design, we focus on the alarm classification of common patient monitoring systems (PMS): critical, uncritical, and technical alarms.
The alarms shall be conveyed with tactile and visual cues via an HMD. HMDs fulfill several safety and hygienic requirements common for systems in local hospitals, e.g., keeping the forearms free and enable hands-free interaction. Moreover, they can be easily integrated in the nursing workflow, which includes frequent moving between patient rooms, as they display information directly in the user’s (peripheral) vision.
Additionally, necessary information for the nurse to evaluate the alarm will be displayed. After that, the nurse will be able to interact touch-free with the system to respond adequately to the alarm.
We want to describe this in a future scenario: Jane is a nurse on a surgical ICU. In today’s shift, she is responsible for three patients. While she is changing the medication for her first patient, an alarm for a second patient (John Doe) occurs on her WAS (see
Figure 1). The system shows her that alarm is caused by a displaced sensor. Since she knows that this patient is in stable condition, she can silence this alarm for a specific time to finish her task. Afterwards, she walks to her second patient to adjust the sensor and acknowledge the alarm.
We imagine our concept to be integrated into data glasses such as Google Glass.
Especially for safety-critical environments, it is important to include the users in the design process of a new system. For that reason, we planned several user studies to design and evaluate modalities for critical care alarms.
Figure 2 shows an overview of the studies described in this paper.
6. Design of Peripheral Light Alarms
Many PMS highlight the source of the alarm (e.g., the relevant vital parameter) on the information display with the colors red (critical), yellow (uncritical) and blue (technical). However, the design space for light patterns contains more parameters than just the hue. Prior research has shown that other parameters, such as, e.g., the blinking frequency or brightness, affects the perceived urgency of the delivered information [
25]. For that reason, we conducted a participatory design study to design light patterns that represent three levels of urgency, based on the given color mapping.
6.1. Apparatus
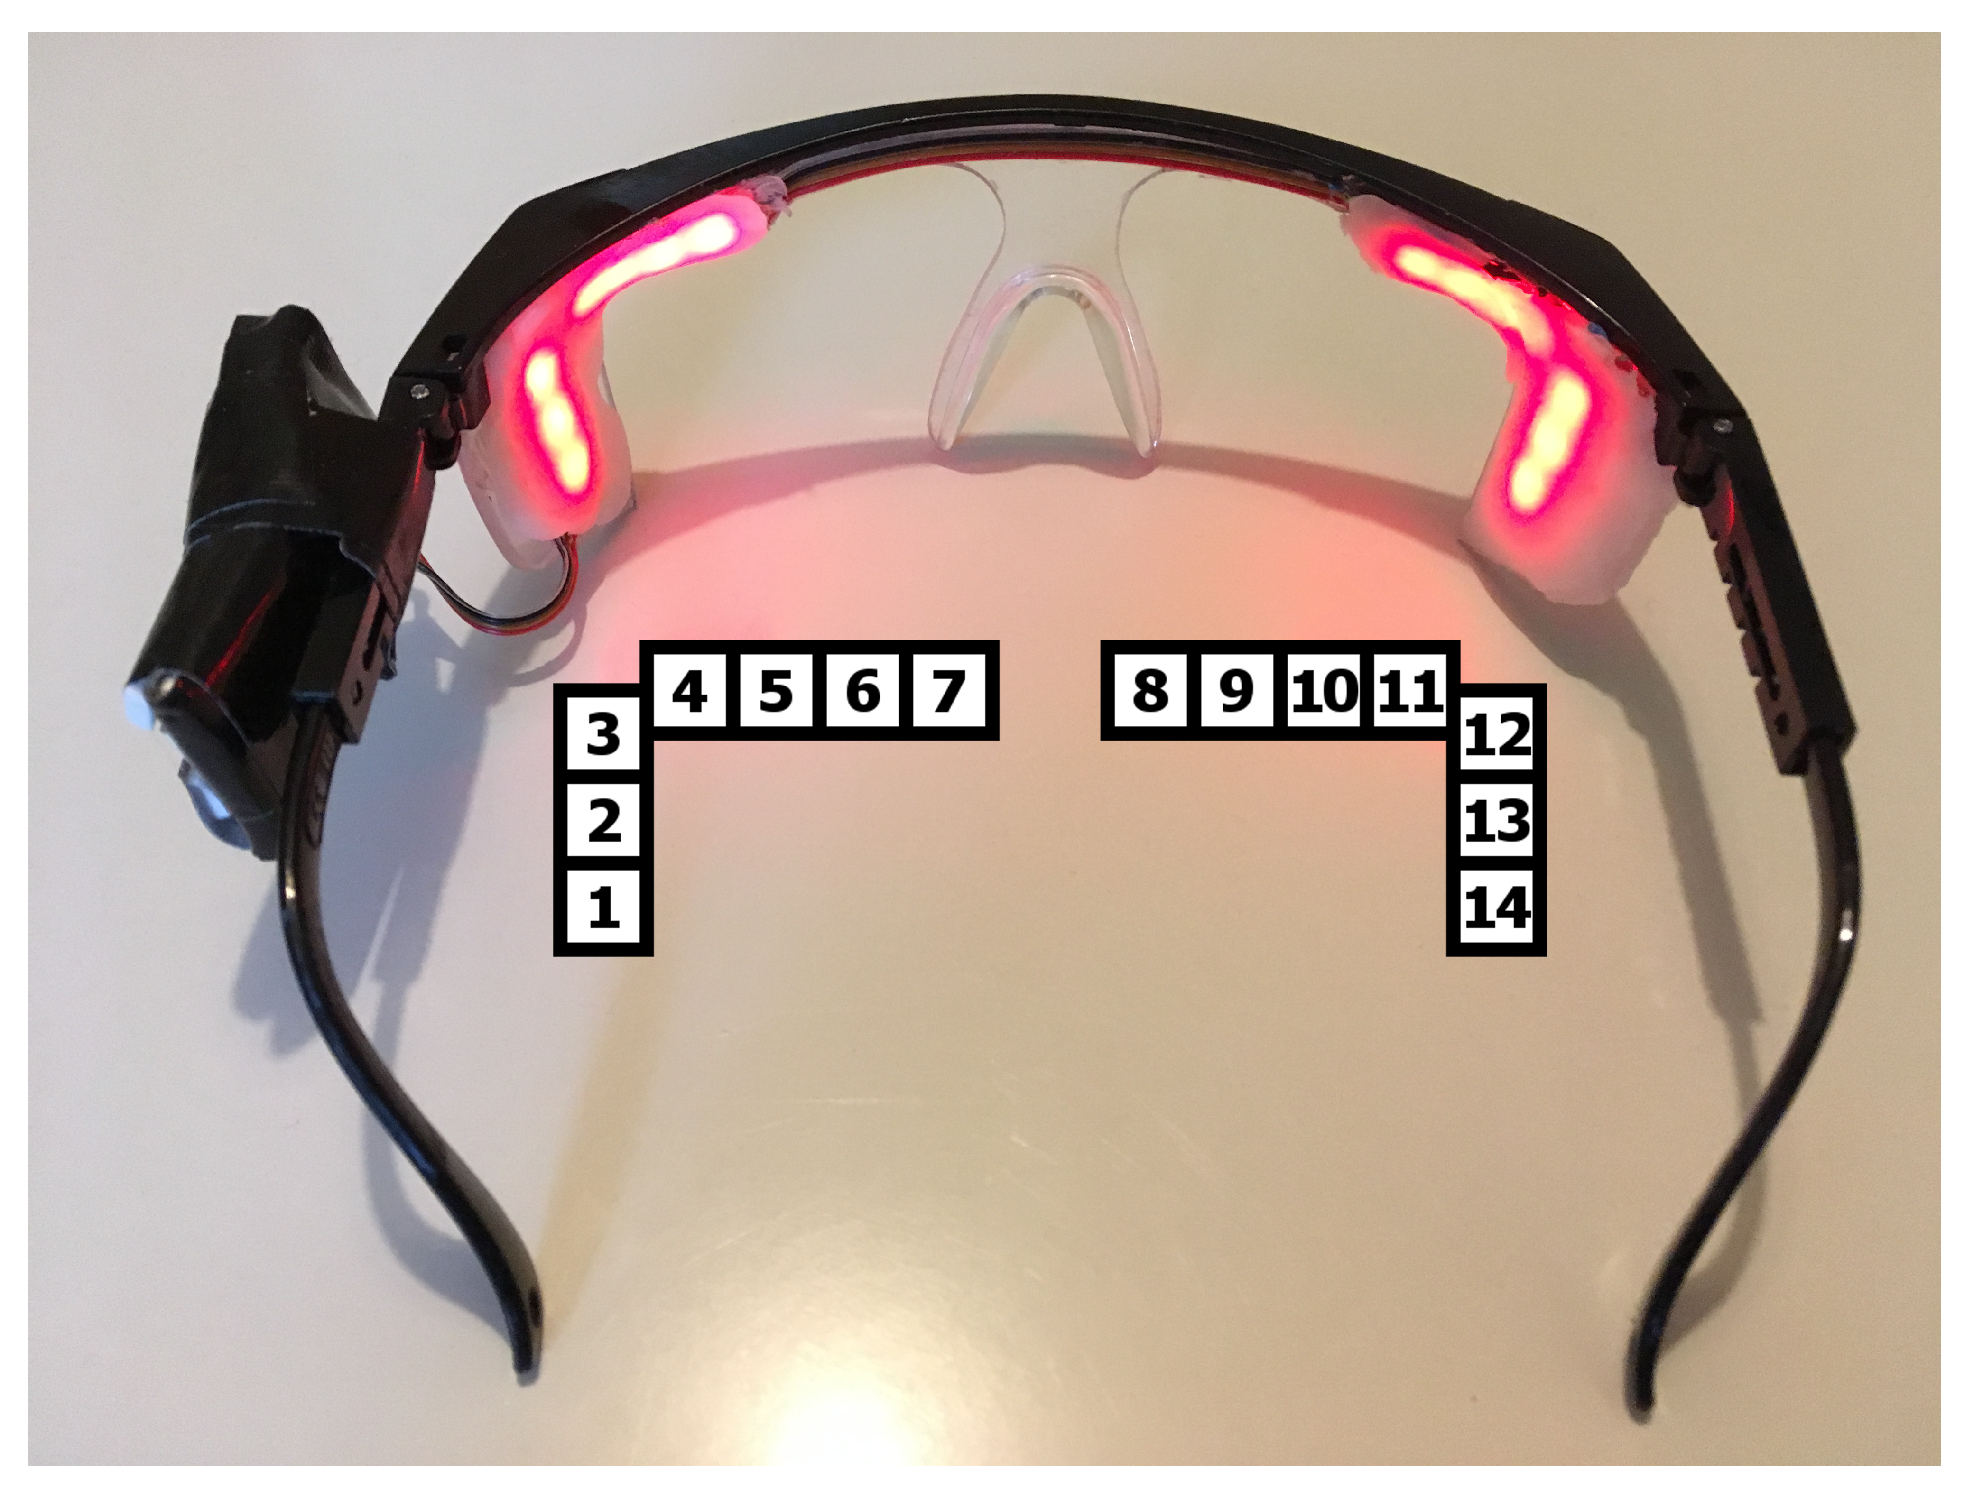
To design and evaluate peripheral light cues, we developed an HMD, based on safety glasses with a diffused peripheral LED display next to each eye. The prototype is shown in
Figure 9. The detailed technical setup can be found in [
11].
6.2. Evaluation
We conducted a study to design alarm cues for the alarm categories “critical alarm”, “uncritical alarm” and “technical alarm”. We divided our study into two conditions, a design study and a validation of the patterns.
Due to their very demanding shift work, conducting studies with nurses as participants may present several issues for them, e.g., the time needed to participate in the study or the competing commitments for clinical practice.
Since this study took place in a preliminary stage of exploring light patterns to represent different urgent alarms, we conducted the first user studies outside the target group to finally take the findings from our work to nurses.
6.2.1. Participatory Design Study
For the design study, we invited ten participants (six female), between 18 and 33 years old, without a specific background. Each participant had a normal or rectified vision (through contact lenses). None of them were color blind. In the first condition, the participants were asked to design two urgent light patterns for the color red and two less urgent light patterns for the colors yellow and blue. We made these colors mandatory because they are already established in several ICUs for the different alarm categories.
We provided a laptop on which the light pattern was programmed via the Arduino IDE. To simplify the design of the light patterns, we predefined functions that let the participants adapt: (1) the brightness levels (from 0 to 255), (2) the brightness transition (stepwise/smooth), (3) the duration of the lighting/smooth transition, and (4) individual LEDs that should light up.
These functions, a description, and a scheme with the numeration of the LEDs on the prototype were placed on a table next to the study laptop, always visible for the participants. Every design was directly uploaded and shown on the prototype and, if necessary, corrected. The participants were asked to think aloud during the design process and to justify their design solutions afterward. In the end, they had to choose, for each color, which pattern they prefer.
Results
Since every participant developed individual light patterns, we derived the following similarities:
- Stepwise Transition
The light pattern includes a stepwise brightness transition.
- Smooth Transition
The light pattern includes smooth brightness gradient.
- Different LED Positions
The light pattern includes the use of different LED positions.
The frequency of the general use of each parameter is shown in
Table 1. The number in parentheses states the frequency of the used parameter within the preferred patterns.
Regarding the preferred light patterns, the majority of the red patterns included a stepwise brightness transition or at least a combination with a smooth transition (e.g., a fading out). The majority of the yellow patterns included the use of different LED positions such as a chasing light or only the outer LEDs blinking. The blue patterns were mostly designed with a combination of stepwise and smooth transitions as well as with different LED positions.
During the thinking aloud process, the following statements have frequently been made: three participants stated that the lateral LEDs appear to be brighter than the top ones. Three other participants mentioned that the urgency was intrinsically encoded by the color. It was especially remarked that yellow is more urgent than blue (5), yellow and red are more urgent than blue (4) and that red is more urgent than yellow and blue (2). Nearly all participants (9) perceived higher blinking frequencies as more urgent, and five participants considered dimmed (“soft”) brightness modification as less urgent. Four participants referred to more LEDs switched on and to an increasing brightness as being more urgent, respectively. Finally, three participants stated that they had based their pattern designs on commonly known alarms.
The results indicate that the color blue appears less urgent than yellow or red and yellow appears generally less urgent than red. This complies with the general perception of colors. Furthermore, a lower urgency was represented with smooth brightness transitions. This has to be considered for the final design.
Deriving from the results, we implemented five light patterns for each color, which are shown in
Figure 10. The patterns are distinguished by blinking frequency, brightness, brightness transition, and the position of the blinking LED.
The frequent use of stepwise transitions for high priority alarms confirms the guidelines for urgent notifications of Matviienko et al. [
25]. Therefore, we designed four light patterns using stepwise brightness transitions. They differ in the frequency of blinking and the brightness. One pattern is based on the preferences in the designed red patterns including a combination of stepwise and smooth transitions. Since yellow and blue patterns shall appear similarly urgent, we implemented similar patterns. Three of them include a combination of stepwise and smooth transition, one is a pulse, and one is a chasing light. Durations and brightness values are based on former pretests.
6.2.2. Validation of the Peripheral Light Alarms
In a further study, we wanted to evaluate which of the shown patterns is best suited for representing three different types of alarms. Moreover, we wanted to find out whether blue light patterns appear, generally, independent from the design of the pattern, less urgent than red or yellow. This study served for evaluating the implemented light patterns (see
Figure 10) with regard to subjectively perceived urgency, comfort and distraction. Moreover, we wanted to derive at least one feasible light pattern for each alarm.
For this evaluation, we invited 20 participants (11 female), between 18 and 41 years old. Each participant had a normal or rectified vision (through contact lenses). None of them were color blind. During the user study, the 15 light patterns (see
Figure 10) were shown to the participants on the HMD in intervals of one minute. Each pattern was repeated three times; the order of the patterns was randomized. To prevent the participants from getting tired or irritated, we split the study into three conditions with different precision-demanding tasks [
29,
30]. The tasks should also represent a load similar to that on ICUs (e.g., giving injections). The order of the conditions was counterbalanced.
The first task was a wire loop game in which the participant has to remove plastic items from cavities inside the patient with a pair of tweezers without touching the edges of that cavity [
29]. If s/he touches an edge, the game board gives a visual and audible signal. In the second task, the participants had to play another wire loop game in which they must try to guide a wand along a wire without touching it. As soon as the wand touches the wire, a sound occurs (see
Figure 11). In the third task, the participants had to refill syringes with exact predefined amounts of water. Between each condition the participant was given the ability to pause for a while.
Each time the participant noticed a light pattern, s/he was asked to rate it regarding its perceived level of urgency, pleasantness, and distraction from the performed task. This was done based on a five-point Likert scale. These factors were chosen to find a suitable light pattern that appears urgent for the user but not distracting from the actual task. Since the HMD should be worn during a whole shift, we also paid attention to the comfort factor of a light pattern. The participant should also state one first association s/he had regarding the pattern. The results were logged by the researcher to minimize the distraction caused by the rating process. To help the participant remember, the rating criteria and their Likert scales a print-out of them was placed in viewing distance. At the end of the study, the participant was asked to note their age and gender on the protocol. There was also space given for further annotations.
Results
Quantitative Results
In the following, we use LP1–LP15 for Pattern 1–Pattern 15. We regard patterns rated with an average score higher than 3.5 as relevant. For the color red, all patterns except the constantly long blinking pattern (LP4) were perceived as urgent, with a range between 4.25 (SD = 0.67) for LP2 and 3.71 (SD = 0.98) for medium long blinking pattern (LP3). Of the yellow patterns LP6, LP7, LP8 were perceived as urgent but with no significant differences between the patterns. LP15, the additively on-switching LED, was the only blue light pattern perceived as urgent with a rating of 3.88 (SD = 0.95). There was a significance between LP 15 and all other blue patterns except LP11 ().
Regarding the distraction, LP1 (mean = 3.87, SD = 1.02), LP2 (mean = 3.5, SD = 0.9) and LP7 (mean = 3.8, SD = 1.05) were perceived as distracting. LP4 was significantly less distracting than LP1 and LP2 (both ). Within the blue patterns, LP15 was significantly more distracting than LP12, LP13 and LP14 (all ).
None of the red nor one for yellow light patterns were perceived as comfortable. However, the constantly long blinking pattern (LP4) was perceived as significantly more comfortable than LP1 (
) and LP2 (
) and LP9 is more comfortable than LP7 (
) and LP8 (
). All blue light patterns except LP15 were perceived as comfortable, with a range between 3.87 (SD = 1.11) for LP11 and 3.65 (SD = 1.04) for LP13. There were no significant differences. An overview of the results can be seen in
Figure 12.
Regarding the color groups, a Wilcoxon signed-rank test showed significant differences of the perceived urgency, distraction and comfort between blue and red or yellow patterns, overall
, which means that blue light patterns are generally less urgent and distracting but more comfortable. Red and yellow in general showed no significant differences in any of the factors. Nevertheless, there are combinations of red (LP1, LP3 or LP5) and yellow (LP9) patterns that show significant differences (
). The results are visualized in
Figure 13).
Pearson correlation test revealed a correlation between the perceived urgency and distraction (, ). Moreover, there is a negative correlation between urgency and comfort ).
Qualitative Results
After the presentation of each pattern, the participants were asked to mention an association with it. For red patterns, participants mentioned overall 74 times an association with “alarms”, “danger” or “emergencies” and 23 times an association with “warnings” or “errors”. All 20 participants associated LP2, and 18 participants LP1 and 15 LP5 with alarms. LP3, the constantly medium long blinking pattern, had 13 associations with “alarms" and 10 with warnings like “stop!”. LP5 was called “bright” or “dazzling” 10 times. Another association with the red patterns was “annoying”/“too long”, which was mentioned overall 30 times, evenly distributed.
The same association was made with the yellow patterns 21 times. The most prominent association with the yellow patterns was “bright”/“dazzling” with 76 mentions, which affected mainly LP6 and LP8 with 18 mentions and LP7 with 24 mentions. LP10 was associated with “party” or “fair” 19 times and with “confusing” nine times. The association with “alarms” was made 33 times, evenly distributed between LP6, LP7, LP8 and LP9.
The blue patterns were mostly associated with “alarms”, like a police blue light (74 mentions). Another association, mentioned 62 times, was “pleasant”. This was related to all blue patterns except LP15. This pattern was called “too long” or “hectic” 17 times.
6.3. Discussion
The results showed that the implemented blue light patterns appear overall less urgent than red or yellow (). Since blue patterns shall represent technical alarms and may indicate that a sensor does not measure the data reliably, ignoring a blue alarm due to an erroneously underrated urgency could lead to missing a critical incident. Thus, this result may indicate that light is not sufficient to represent an urgent blue alarm reliably. One option could be to extend this alarm by another sensory stimulus.
On the other hand, it is conceivable that nurses may perceive the blue pattern as urgent after a period of familiarization. This must be evaluated in a long-term study.
A correlation test revealed that the perceived urgency correlates with the perceived comfort of a light pattern (, ). This means for us that we have to compromise between those factors while choosing a light pattern for each alarm type.
Regarding all factors, the constantly short blinking pattern (LP2) is the most feasible pattern for red alarms. Even though it is the second most distracting light pattern, it appears most urgent. Red alarms require immediate reaction; accordingly, this alarm needs to grab attention. Adapting brightness and frequency, this alarm could become more comfortable. For the low priority alarm, we consider LP9, the constantly blinking lateral LEDs. As uncritical alarms are the most frequent alarms in ICU, we chose the most comfortable and less distracting light pattern for this alarm, which was still associated with alarms. As a technical alarm, we consider the constantly pulsating pattern, LP13, which is the second most urgent and also the second most comfortable pattern.
7. Experiment
We conducted an experiment to evaluate (1) the performance, suitability and feasibility of multimodal alarms compared to the state of the art (speakers) and (2) the usability and comfort rating of a multimodal head-mounted alarm display. The study was conducted under task conditions that mimic the load of care tasks.
7.1. Participants
For the study, we acquired 12 ICU nurses (seven female) from two different hospitals, between 22 and 51 (M = 33.8, SD = 10.3) years. Their years of experience in ICUs ranged from 3 months to 19 years (M = 8.92 years, SD = 6.92). Five of them had a corrected rectified vision through glasses, one of whom was blind in one eye. None of the participants were color blind.
7.2. Apparatus
Since we are in an early state of development, there are several safety factors that kept us from testing in the field. For that reason, we conducted the study in an unused ICU treatment room of a cooperating hospital, equipped with a patient bed, a desk, and a chair (see
Figure 14). To create a realistic environment, we prepared a sound file as background noise containing talking and laughing people, clinking glass containers, ringing telephones and the sounds of a respirator. We explicitly excluded further alarm sounds of clinical devices.
Moreover, we prepared additional speakers in the corner of the room with a distance of ∼1 m to the working place and ∼1.8 m to the patient bed to simulate the state of the art using a notebook with the acoustic alarms as mp3-files. To present the multimodal alarms, we augmented our prototype from the light patterns study (see
Figure 15). It consists of an
Adafruit Feather m0 WiFi as micro controller combined with a
Music Maker FeatherWing as amplifier, powered by a 3.7 V LiPo battery. In addition, 12 RGB LEDs are attached in the peripheral field of view (six on each side, three above, three next to the outsides of the eyes), diffused with
Gorilla Plastic. We attached two ERM vibration motors (⌀ 10 mm) on the temples behind the ear for vibrotactile cues. Two bone conduction speakers (14 mm × 21.5 mm) were attached on the temples above the ear (one on each side) which convey acoustic alarms without blocking the ear channels. To ensure a firm hold for different head sizes, we attached an elastic band on the prototype.
We used the following alarm designs for our experimental conditions based on our previous studies described in
Section 5 and
Section 6. The acoustic alarms are based on the sounds of a commercial patient monitoring system.
Light patterns: To represent critical alarms, we used a red blinking. All LEDs light up for 0.1 s with a 0.4 s break in between and a brightness value of 100. For the uncritical alarm, we used a yellow blinking. Just the side LEDs light up for 0.4 s with a 0.4 s break in between and a brightness value of 100. The technical alarm is a blue pulsating of all LEDs from brightness value 0 to 200 and back to 0 over 0.8 s with a 0.2 s break.
Vibration patterns: With increasing priority of the alarm, the number of vibrations increases. Respectively, the technical alarm consists of one, the uncritical alarm of two, and the critical alarm of three recurring vibrations with a length of 400 ms and a pause of 100 ms between the vibrations. The pattern itself repeats after an 800 ms pause.
Sound patterns: The sound patterns are based on the original sound files of a commercial PMS. With increasing priority of an alarm, the loudness and frequency and pitch of the beep increase. The patterns are visualized in
Figure 16.
The vibrotactile and light alarm patterns were hard-coded on the Feather. The acoustic alarms were stored as mp3-files on a micro-SD-card, read by the FeatherWing. We tested loudness, brightness and intensity of each condition and the background noises in prior pilot tests. These alarms were triggered via an Android app using a WiFi-connection to a web server that was started up by the Feather.
7.3. Study Design
For our study, we used a within subject design with the alerting medium as independent variables. It consisted of four main conditions, based on the used modalities: visual via peripheral light, tactile via vibration, and auditory via bone conduction speakers as experimental conditions, and finally auditory via speakers as control condition.
The essential key tasks of a nurse include i.e., the shift handover, a routine control, and the admission of new patients, which are mainly cognitively demanding. Furthermore, there are physically demanding tasks like mobilization of the patients or accompaniment of their transport, and, finally, there are precision demanding tasks like the application of medication or dressing changes. For that reason, we divided our study into three tasks that are cognitively, physically and precision demanding to represent realistic workloads according to the workflow.
For the cognitive task, we prepared several cross-multiplication problems that should be solved using the Rule of Three. This method is commonly used in nursing education and for calculating the dose of medication for patients. To avoid discrepancies between the math knowledge of the participants, we provided an explanation, including an example for the Rule of Three as well as a calculator.
For the
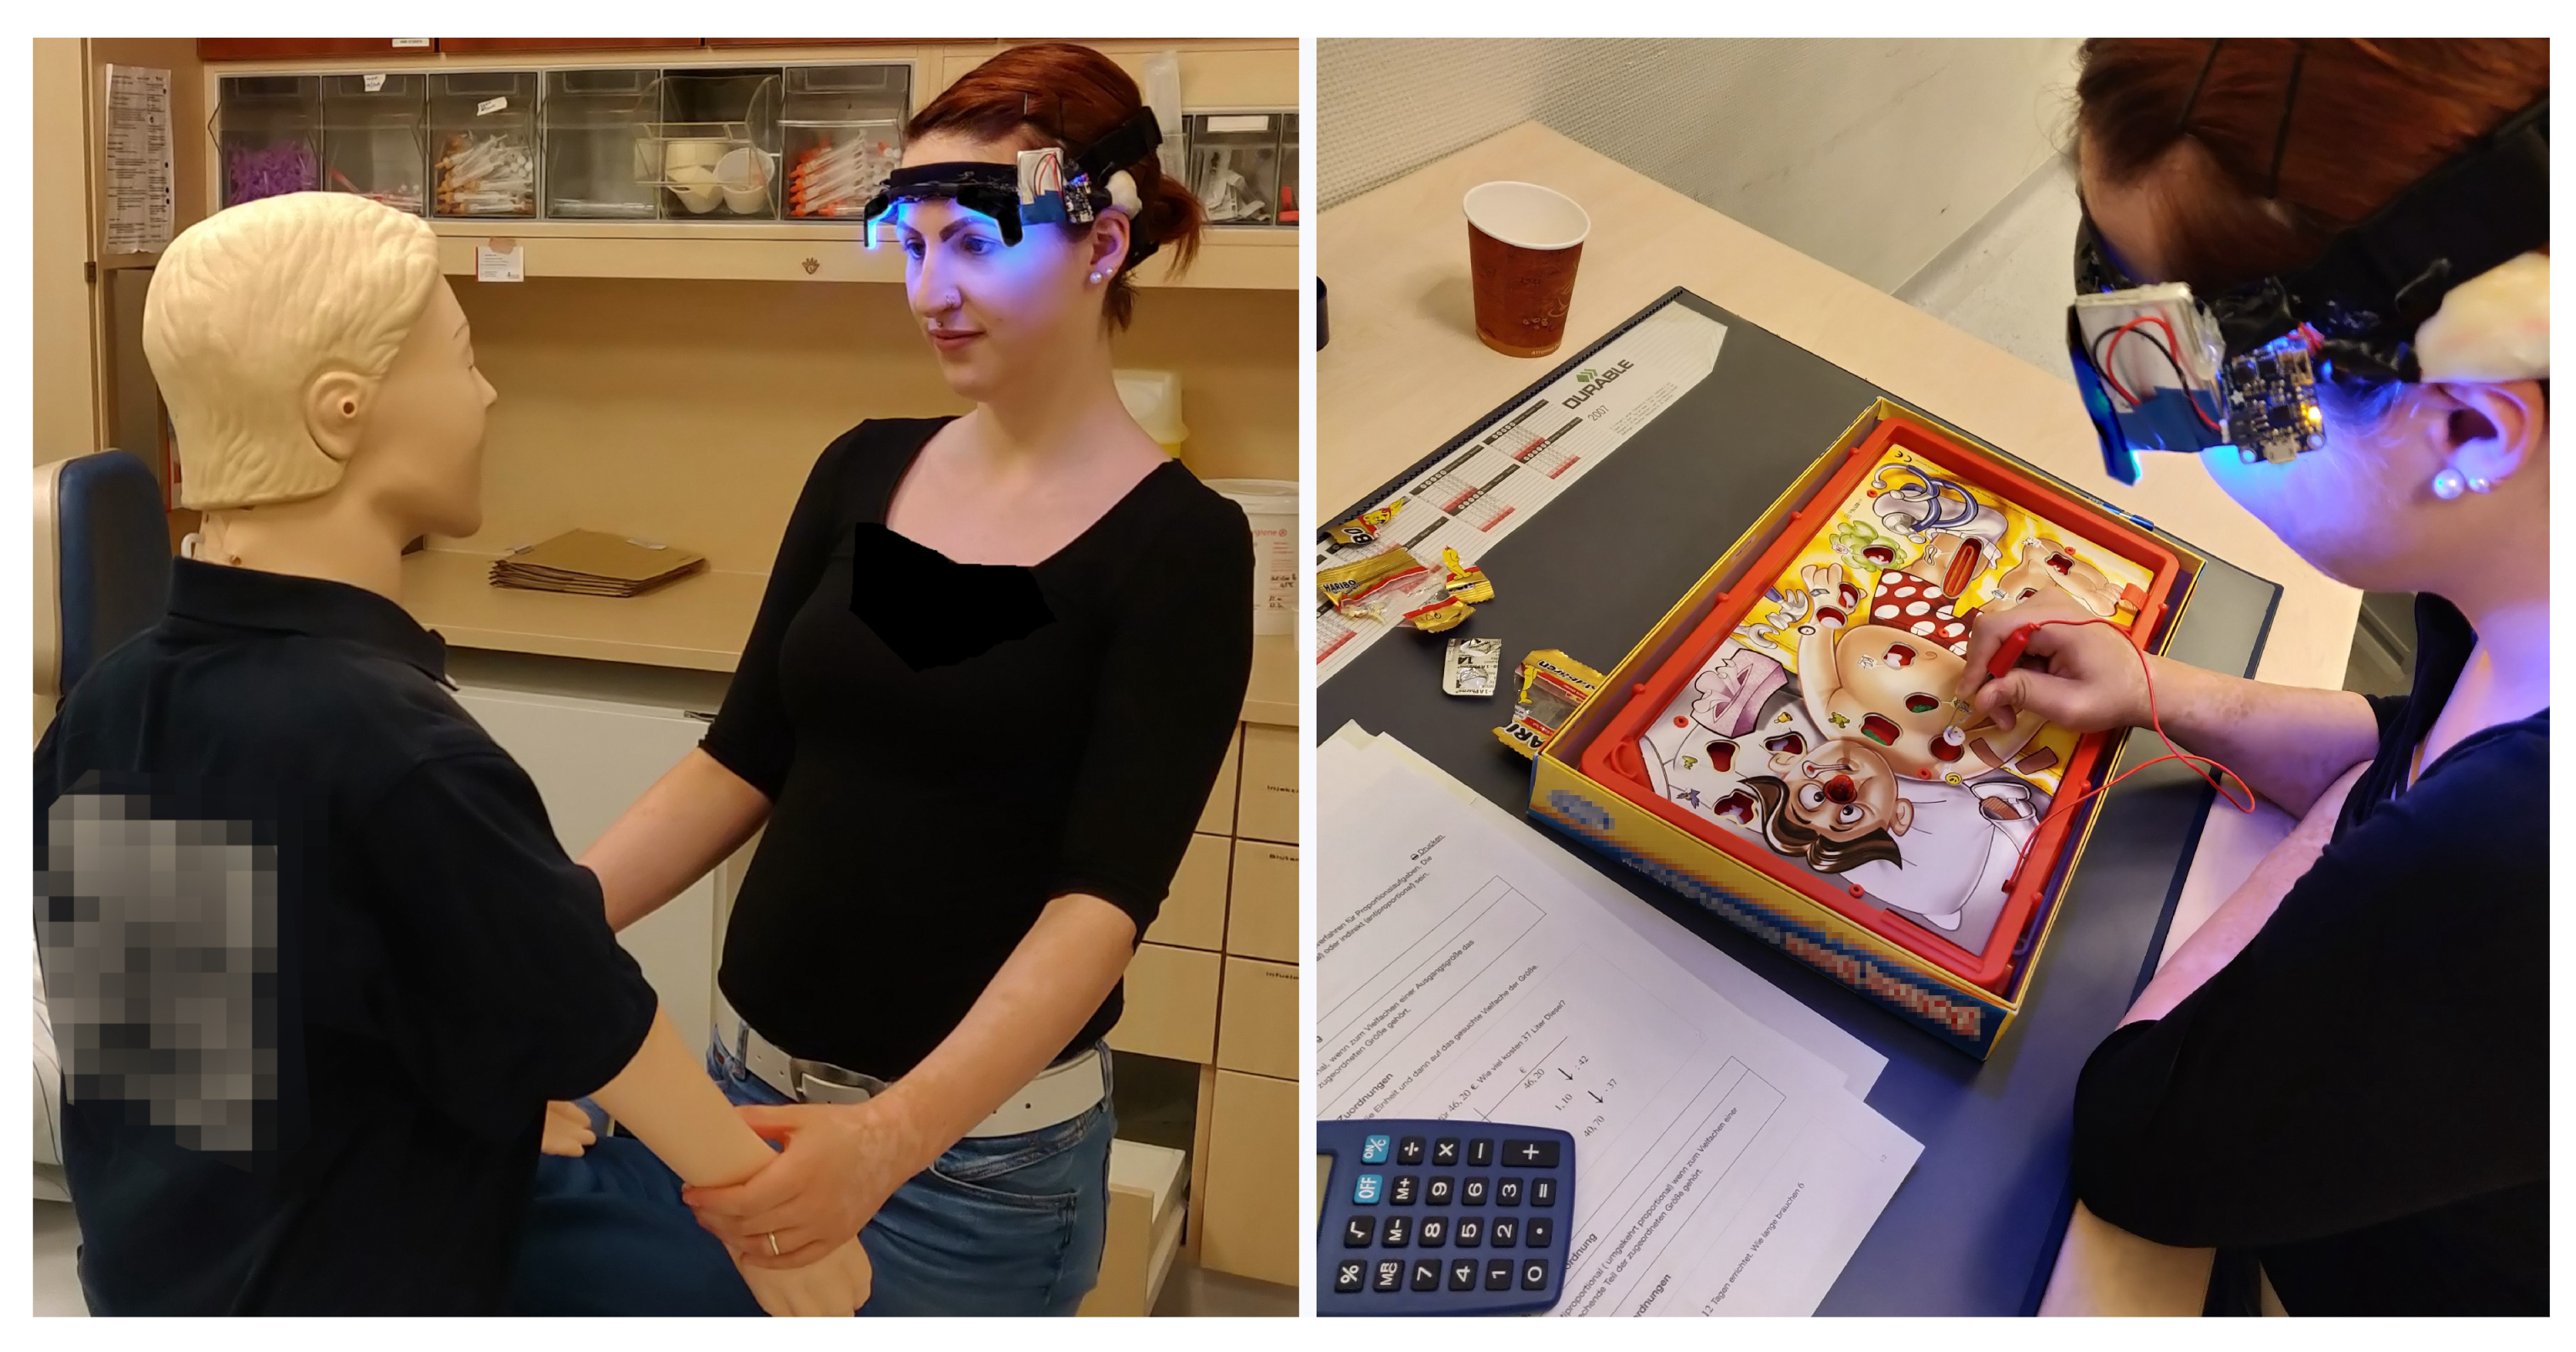
physical task, the participants were asked to perform a mobilization on a training manikin (Resusci Anne), which weighs 12 kg and is about 1.5 m tall (see
Figure 17, left). We chose this manikin to avoid fatigue effects caused by repeating the task, since awake patients usually support the nurses and heavier patients will be mobilized with at least two healthcare professionals.
The
precision task consisted of a wire loop game in which the participant had to remove plastic items with a pair of tweezers from cavities inside the patient without touching the edges of that cavity. If s/he touched an edge, the game board gave a visual and audible signal and the participant had to choose a different item (see
Figure 17, right). This hand-eye-coordination task should represent a load similar to giving injections or taking blood and was performed in former studies, e.g., by Englert et al. [
29].
During each task, all conditions were evaluated. Therefore, every participant performed each task and experienced three alarm levels per condition: critical, uncritical and technical alarms. The order of the conditions, alarm levels, and tasks was counter-balanced randomized. A possible setup for one participant is visualized in
Figure 18.
The experiment took approximately 60–90 min including setup, initial learning phases and final interview.
The nurses received their actual hourly wage for participation.
7.4. Measures
We measured the following dependent variables to compare the experimental conditions to the control conditions:
General suitability of the modality, suitability of the modality for the performed task, perceivability, distinguishability, comfort, and level of annoyance: (5-point Likert scale, 5—the most suitable—annoying): for each task after each condition, every participant rated the respective factor for the modality.
Perceived workload: for each condition during each task, every participant filled out a Raw-TLX Scale [
31].
Error rate: each time a participant named the wrong or no alarm level, we counted that as an error and logged it to the specific alarm.
Reaction time: we measured the time between presentation of the certain alarm and the identification by the participant.
Usability: at the end of the study, every participant filled out a System Usability Scale [
32].
Comfort of the prototype: at the end of the study, every participant filled out a Comfort Rating Scale [
33].
7.5. Procedure
After obtaining the informed consent, we collected the participants’ demographic data (age, gender, years of ICU experience) and explained the overall procedure.
For each condition, we introduced the respective alarm design to the participants and gave them an initial learning phase. The study started when the participant felt confident with the alarm design. The background noise was started and the three alarms of the respective condition were sent to the prototype or speaker. By sending the alarm, a timer was started automatically. As soon as the participant recognized an alarm, s/he had to name the type (red for critical, yellow for uncritical or blue for technical alarm) and we stopped the timer. After each alarm, we asked the participant to rate the suitability of the design for the respective alarm level, the suitability for the performed task and the perceivability on a 5-point Likert scale. At the end of the certain condition, we asked the participant to fill out a Raw-TLX scale and to rate the general suitability, task suitability, perceivability, distinguishability of the alarms, comfort and level of annoyance for the respective condition, also on a 5-point Likert scale.
This procedure was repeated for each condition during each task. At the end of the study, the participants were asked to fill out a system usability scale as well as a Comfort Rating Scale. Finally, we asked the participant which modalities they would prefer for their personal alarm system.
7.6. Results
In the following, we present our results in the respective evaluated factor. A Shapiro–Wilk test revealed that all data are normally distributed, so we used a Wilcoxon signed-rank test to test for significant differences with a significance level of 1%. A summary of the results can be seen in
Figure 19.
Suitability of the modality: For the general suitability, the participants rated light and bone conduction sound (in the following named as BC) significantly best, with a median of 4 (). Regarding light, the comments included that this modality is “really secure” (P1), “safe” (P1, P3, P7), “clear, unique” (P2), and “not distracting” (P1, P3–P7, P9). A representative quote of a participant for BC was: “Somehow distracting. Hoever, it SHOULD distract me in a specific way. It is so weird because it is in my head. Maybe I could get used to it.” (P2)—Vibration and speakers were both rated with 3, which means a medium suitability.
Task suitability: For the task suitability, we regarded the ratings in the respective task. For each task, light and BC performed significantly better than the control condition, which had an overall rating of 3/medium (). Except for the cognitive task, light performed with a rating of 4.5 for the physical and 5 for the precision task even better than all conditions (). However, one participant (P9) was concerned during the physical task about how the patient would perceive that. Vibration performed better than the control condition for the cognitive () and physical task (not significant, ). During the precision task, two participants (P4, P12) were concerned that they would be afraid to get out of place with the needle during taking blood. For this task, vibration was rated as medium suitable.
Perceivability: Regarding the perceivability, all experimental conditions performed significantly better than the control condition. Comparing light and vibration (both 5, best perceivable), there is no significant difference but eight participants mentioned a rather negative or annoying perceivability for vibration. In contrast, light was described as “Fast perceivable, especially with background noises” (P1).
Distinguishability: The distinguishability of the alarms was rated significantly best (median = 5) compared to all conditions for light (). Worst distinguishable were vibration and speakers, with a medium rating (3). For vibration, one participant (P8) mentioned: “Sure, they are distinguishable. However, I have to concentrate on that and count the vibrations, so they are actually not!”
Comfort: The participants rated light () and BC with as “comfortable”. Two participants (P2, P11) were concerned that light could be exhausting for the eyes, and one of them mentioned that s/he was “tired and had headache during the shift. Bright light doesn’t make it any better. Maybe there should be a mode to switch to something different.” (P11). Vibration and the control condition were rated as medium comfortable. Level of annoyance: Regarding this factor, just light showed a better score, with 2 (not annoying). One participant (P12) described light as “distracting but positively distracting. Opposite to the speakers, I see that immediately, I don’t have to interrupt my task.” All other conditions were rated medium.
Error rate: The most errors were made with acoustic alarms. Both speakers and BC showed an error rate of 9.3%. Each mistake was a confusion between the uncritical and technical alarm. Five participants mentioned that they got used to hearing an alarm and look to the PMS display to realize which one it is. With one error, vibrotactile alarms showed an error rate of 2.8%. No error was made for light alarms.
Generally, the time stamps for the mistaken patterns did not indicate a learning effect for the patterns. Reaction time: With 2.02 s (SD = 0.6), the participants had the fastest reaction time in identifying the light alarms. Generally, all experimental conditions performed significantly better than the control condition (3.72 s, SD = 1.74).
Perceived workload: The analysis of the Raw-TLX showed that there are overall high scores, which means a high workload. However, there is also a high standard derivation for each factor (see
Figure 20). The participants perceived the lowest work load in all categories with light alarms. Compared to the control condition, vibration showed worse results in all categories except in “Overall Performance”. BC performed just slightly better than the control condition except for the factor “Frustration”. However, these results are not significant.
Usability and Comfort: With a SUS-score of 80 (SD = 8.53), the participants rated the prototype with good usability. The median of the Comfort Rating is 4 (0 means best comfort), which means good comfort, considering the prototype’s early state development. However,
Figure 21 shows that the lowest rating applies to the attachment of the prototype (median = 16.5).
Qualitative feedback: Regarding the final feedback, none of the participants wanted to adhere to the state of the art. The majority of the participants (11 of 12) preferred the light alarms. Two participants mentioned that light would be sufficient for each alarm level. However, five of them remarked that they could imagine that other nurses could prefer vibrotactile alarms and we should consider making the alerting method customizable. One participant preferred BC as single method to be alerted, since s/he reacted sensitively to light, especially, when s/he is sick. The other participants preferred a combination of modalities for specific alarms. For example, 9 of 12 participants wanted a combination of light and BC for critical alarms. Ten of 12 participants preferred just a visual solution for uncritical alarms. Regarding the technical alarm, there was no clear result. Five participants preferred the light alarms for this, two the acoustic, and two the vibrotactile solution. Two participants suggested a combination of vibration and light and one participant considered a combination of all modalities because the technical alarm is usually underestimated and ignored, since a missing sensor could also cause a critical alarm.
7.7. Discussion
Regarding all factors, we suggest using a combination of light and BC for critical alarms, and just light to represent uncritical and technical alarms. However, even if light performed best in all categories, there was a high variability of the preferred signal types. Therefore, we should consider enabling an opt-out for light alarms and, at least for uncritical and technical alarms, and opt-in for a vibrotactile alerting, which needs to be configured individually. This option could also be useful to switch the modality for specific tasks.
Even if the time stamps of the measured errors did not indicate that there was a learning effect, it should be considered that this may be caused by the small sample size and could be clarified in a long-term study. Moreover, the high error rate for sounds may be explained by the fact that nurses are generally used to getting additional information on the monitoring system for the specific alarm to identify its urgency.
The high means of the Raw-TLX have to be regarded in combination with the high standard derivation. This may be caused by the fact that some participants attended our study right after their shift, which could mean that they might have been exhausted. Another possible reason could be the low number of participants. If we take a closer look at the single factors of the Comfort Rating Scale, the overall median represents the rating for the factors “Emotion”, “Harm”, “Perceived Change”, “Movement”, and “Anxiety”. However, the factor “Attachment” was rated with a median of 16.5, which means a physical feel of the device on the body. This is caused by the early state of development, in which we focused on the functionality of the prototype.
Although we could show significant results that support the use of personal multimodal alarms, our results are still limited. At this point, we did not evaluate the combination of the modalities, and, moreover, the task performance. Even if the qualitative feedback didn’t show any indications in case of light and BC, we still need to measure whether the multimodal alarms have a negative influence in performing nursing tasks.
Moreover, it needs to be evaluated if multimodal alarms perform as well in a long-term study. Thus, we can exclude fatigue due to the new alarm signaling.
Another point that needs to be evaluated is the long-term use of HMDs in the medical context. There is a risk that “yet another technical device” will be neglected as soon as the novelty effect ends. To avoid this, a WAS would have to be made mandatory for the specific ICU as part of the general work clothes.
However, for a long-term evaluation, the WAS needs an approval for medical devices to be tested in the field. Until then, we aim to create a more realistic test lab for preliminary explorations.
8. Conclusions and Future Work
In this paper, we presented the design of vibrotactile and peripheral light patterns to represent ICU alarms. Moreover, we showed the evaluation of different modalities for a personal multimodal alerting on ICUs via an HMD.
Under task conditions that mimic the specific load of nursing tasks, we could show that visual and tactile alarms performed better and were faster to identify by nurses than the state of the art. In particular, light and bone conduction speakers performed well regarding the factors suitability, task suitability, perceivability, distinguishability and comfort.
Based on our results, we could derive a final multimodal alarm design, which will be evaluated with a realistic alarm frequency as a next step. The qualitative feedback we got from nurses indicated that there is a general need to change from a ubiquitous, obtrusive and distracting alert system to a personal, noiseless alarm distribution. We could observe that our participants were positively surprised about the new method of alerting.
Even though the prototype was in an early state of development, there were just concerns regarding the attachment of the HMD. This will be solved in future work.
However, there were concerns about the acceptance of peripheral light alarms of patients and relatives we have to consider. Overall, we have to take care about evaluating the social acceptability of such a device. Moreover, our alarm design needs to be evaluated in a long-term study with a realistic number of alarms.
In the future, we will integrate the multimodal alarms into data glasses to test their feasibility in combination with displayed vital data. Finally, we aim to develop touch-free interaction methods to acknowledge, forward, or silence alarms.


