Abstract
Current research in human factors and automated driving is increasingly focusing on predictable transitions instead of urgent and critical take-overs. Predictive human–machine interface (HMI) elements displaying the remaining time until the next request to intervene were identified as a user need, especially when the user is engaging in non-driving related activities (NDRA). However, these estimations are prone to errors due to changing traffic conditions and updated map-based information. Thus, we investigated a confidence display for Level 3 automated driving time estimations. Based on a preliminary study, a confidence display resembling a mobile phone connectivity symbol was developed. In a mixed-design driving simulator study with 32 participants, we assessed the impact of the confidence display concept (within factor) on usability, frustration, trust and acceptance during city and highway automated driving (between factor). During automated driving sections, participants engaged in a naturalistic visual NDRA to create a realistic scenario. Significant effects were found for the scenario: participants in the city experienced higher levels of frustration. However, the confidence display has no significant impact on the subjective evaluation and most participants preferred the baseline HMI without a confidence symbol.
1. Introduction
The ongoing development of automated driving functions in the automotive industry and the presence of SAE International Level 2 systems such as the Tesla Autopilot on the market give rise to new challenges for the internal human–machine interface (HMI) design. Recent human factors research on Level 3 automation has shifted from urgent and time-critical transitions to predictable and non-critical situations, as these are likely to occur more often than emergency requests to intervene (RtIs) [1]. System limits causing planned RtIs may for example include highway exits, sections with missing lane markings and complex city infrastructure such as crossings. Level 3 automated driving systems will consequently be restricted to certain parts of a drive. Furthermore, users do not need to monitor the system [2] and thus engaging in non-driving related activities (NDRA) becomes legal. With limited availability comes the possibility of interrupting an NDRA, thus potentially causing negative effects such as annoyance and higher workload (see Janssen et al. [3] for an overview). In line with this, Danner et al. [4] and Hecht et al. [5] identified information about the remaining automated driving time as a main user need, as different activities were found to require different time budgets and time budget information may help users to develop a correct mental model.
To fulfill user needs regarding time budget information, studies have investigated effects of predictive HMI solutions featuring the remaining time until an upcoming RtI or an overview of the complete trip and its automated driving sections to improve plannability and interruption management [1,6,7,8]. Depending on the implementation of such predictive HMI elements, workload, usability and acceptance can be improved [1,6,8]. However, due to traffic jams, accidents or updated infrastructure information, predicted time budgets are prone to changes and time leaps may diminish positive effects of the predictive HMI. Based on an exploratory driving simulator study, Danner et al. [9] consequently proposed a confidence display for time budget estimations. With the presented study, we thus want to assess the effects of adding a confidence information to a predictive HMI (i.e., time budget estimation) when engaging in a common naturalistic NDRA.
1.1. Confidence Displays
The visualization of uncertainty information has already been an important topic in aviation [10] and for recommender systems [11]. Moreover, confidence displays gain importance in the automotive industry due to the ongoing development of advanced driving assistance functions.
Shani et al. [11] researched confidence displays for recommender systems for news stories, video clips, shopping items, etc. In a user study, they found some displays to be more understandable and better liked by the users: Concepts inspired by well-known displays in other areas (e.g., the bar chart from phone connectivity or fuel gauge) are favored. Furthermore, discrete confidence displays with a relatively low number of scores are best understood and require the least (or even no) training. Moreover, trust in confidence displays was found to be built up over time (users require a few interactions before they are willing to trust the displays). However, in a subsequent second user study, no evidence was found for the support of users in the identification process of relevant items. Users even required more time and gained no significant accuracy improvement.
In the automotive industry, confidence information was used by Stockert et al. [12] to enrich information on the status of an advanced cruise control (ACC) system. The researchers found advantages of the confidence display concept in shorter reaction times to critical events and positive effects on secondary task engagement. Moreover, usability was increased. No effects, however, were proven for workload and acceptance. According to Feierle et al. [13], the degree of certainty with which the automation can cope with a situation is not relevant when no RtIs occur. However, with the ongoing research into automated driving with limited availability, concepts displaying the ability of the car to drive automated were assessed. Large et al. [14] used a horizontal multi-step (traffic light) color-coded bar to display the reliability of the Level 3 automated driving function. Some participants reported having adapted their NDRA engagement to the system status, while some did not notice changes in the bar and thus did not adapt. However, the concept was not evaluated further. A similar concept was implemented by Helldin et al. [15]. Their vertical seven-step autonomous scale led to better performance in take-over situations; participants with the concepts looked away from the road more often and were more comfortable while performing NDRAs. Similarly, Beller et al. [16] evaluated a concept presenting uncertainty information of the automated driving functions using a face with an expression of uncertainty and hand gestures. They found the concept to increase the time to collision in the event of automation failure and hints for improved situation awareness and better knowledge of fallibility. In addition, higher trust ratings and increased acceptance were reported. Another visualization was chosen by Kunze et al. [17]. They used a heartbeat concept that also included a numerical display to communicate system uncertainties during Level 3 automated driving and also found positive effects on trust and situation awareness. However, operator workload was increased and users were impeded in the execution of the visual search task.
In summary, studies on confidence information show positive effects of such displays. However, results are to some extent contradictory when used to display the reliability of automated driving functions. Confidence displays are also an issue in other disciplines and studies have already investigated the advantages and disadvantages of several ways of displaying the uncertainty information: Concepts based on well-known interfaces and discrete displays with a relatively low number of scores are most understandable. However, the authors are not aware of any study that focuses on the confidence in time budget estimations. In this use case, confidence displays might also help prevent frustration that can result from unfulfilled expectations regarding automated driving time budgets [18].
1.2. Objectives
With our study, we aimed to answer the following research question concerning the so-called automation HMI [19]:
- Does an additional confidence display for time budget estimations have a positive effect on the subjective evaluation of the system when engaging in a common naturalistic NDRA (mobile device use)?
Since in particular in urban areas with their complex infrastructure and multiple (vulnerable) road users, timing aspects are harder to predict for both the user and the system, the following research question was also addressed:
- Is the confidence display evaluated differently in urban and highway scenarios?
2. Materials and Methods
2.1. Preliminary Study
To approach this as-yet unaddressed issue, a pre-study was conducted to find a suitable way of presenting the additional confidence information. Based on identified literature, four different confidence displays were developed and integrated in the adaptive instrument cluster concept by Feierle et al. [20] (see Figure 1). All concepts included speed, speed limit, automation scale with current level of automation, maneuvers, navigation and a predictive HMI element. The first concept included a vertical color-coded bar (7 steps), the second was based on smileys (3 steps), the third conveyed the confidence level in percent (5% steps) and the last was designed as a color-coded CD-shaped bar. Five participants, all laypersons, were shown the concepts and asked questions on intuitiveness, usefulness, creativity and stress induced by the concept. Open questions concerned the chosen colors and the necessity of a textual description. Moreover, participants were asked to rank the concepts. Participants were not instructed regarding the meaning of the symbol to assess its intuitiveness.
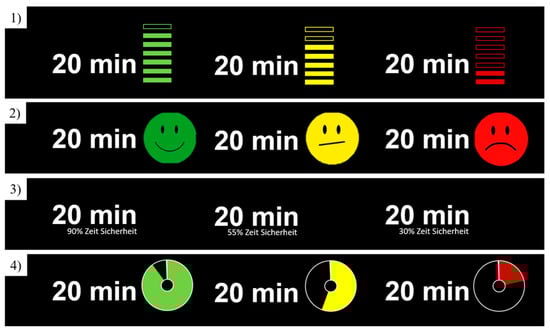
Figure 1.
Concepts 1–4 with time budget (20 min) and confidence display.
Participants in the pre-study experienced difficulties in interpreting the additional symbol. Four out of five participants misunderstood the vertical bar of Concept 1 as a representation of the remaining time. The smiley (Concept 2) was seen as containing too few steps and its color-coding was evaluated as unnecessary double information. Furthermore, the concept was classified as inappropriate for a technical product and not suitable for conveying information on confidence. The percentage-based Concept 3 was criticized mainly for its small font size and the wording. Furthermore, it was seen as stressful and 5% steps as unrealistically concrete. The CD bar (Concept 4) was mostly seen as a representation of time, as in the bar concept. Generally, participants found it difficult to interpret a medium (yellow) level of confidence in all concepts. Four participants appreciated the traffic light color scheme. Three claimed to need a text explaining the symbol and three wanted an additional numerical level of confidence. In a final ranking, the vertical bar concept and the numerical concept both took first place, the CD bar came second, and the smiley concept was rated the worst by all participants.
2.2. HMI Design
Based on the preliminary study results, the final concept (see Figure 2) included a bar concept to abstract the confidence level, as the numerical concept was well rated but also considered unrealistically concrete. Furthermore, Shani et al. [11] recommended well-known and discrete concepts with a low number of scores. To avoid the symbol being misunderstood as a representation of time passing by, we converted the vertical bar into a horizontal bar resembling the icon for mobile phone connection quality, which is based on the recommendations of pre-study participants and is supported by findings of Shani et al. [11]. Furthermore, the color-coding was abandoned as especially red, but also yellow, convey a criticality that does not fit a confidence level for time budget estimations. Based on pre-study findings, a textual description (“Wahrscheinlichkeit Zeitbudget”, confidence in time budget estimation) was added to illustrate the connection between the time budget information and the confidence symbol. The available time budget is a countdown in 1-min increments. Time leaps were emphasized by displaying “Zeitanpassung” (time budget adjustment) for 20 s in a yellow-framed text box in the instrument cluster (see Figure 3). No additional auditory or ambient signals were used to highlight time leaps in order to create a realistic scenario. Uncritical time leaps such as the ones realized in this study were—as in navigation systems—supposed to be realized without such accentuation in future automated driving cars, since a signal indicating a time leap could be rather disturbing while conducting an NDRA [3]. Furthermore, accentuations of time leaps could push the evaluation of the confidence symbol by making it more salient artificially.
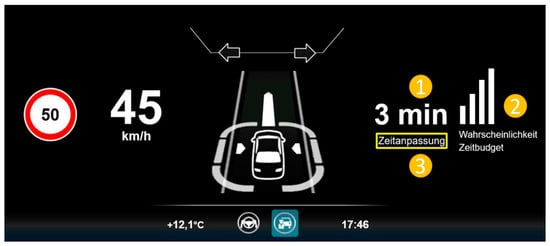
Figure 2.
Visualization of the advanced HMI including: time budget (1); confidence level (2); and message time budget adjustment (3).
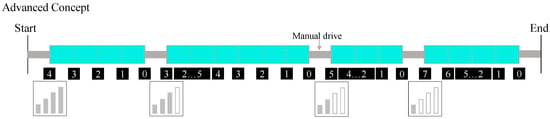
Figure 3.
Exemplary experimental drive (periods with available automation are cyan, dotted lines represent 1 min). Black boxes with white numbers are durations displayed in the predictive HMI (leaps are displayed with “…”, e.g., 2…5). Confidence levels at the start of each automated driving period are displayed on the bottom. After a leap, the confidence level was set to 100% and remains 100% until the end of the automated driving section.
2.3. Experimental Design
For this study, a mixed design was used. As within factor, the HMI concept (baseline vs. advanced) was chosen, allowing the participants to make a direct comparison. The scenario (highway vs. city) was implemented as between factor. Two different HMI concepts were compared, namely a baseline concept and an advanced concept, which features the symbol displaying the time budget estimation confidence. To test the between subject factor, participants were randomly assigned to the groups “city” and “highway”. Although test tracks were completely different in terms of the environment and infrastructure, the automated driving times and positions of time leaps were identical. Each drive included four automated driving periods (3 min, 2 × 4 min and 6 min). These periods were followed by short manual drives. Three out of four periods included a time leap. In the advanced HMI, a confidence level in the time budget estimation was given throughout each automated part (see Figure 3). The confidence level was constant until a time leap occurred. After the leap, the confidence level was set to 100% in all cases and did not change again. Each period included one specific leap and confidence level. The order of the periods was systematically varied.
2.4. Procedure
Upon participants’ arrival, they were welcomed and their written consent was obtained. An overview was given, and participants filled out a demographic questionnaire including questions on age, gender, driving experience and participation in previous driving simulator studies. After the parameters of the driver’s seat were set, written instructions were given to the participants. These included a description of the activation and deactivation process of the automation and an explanation of the time budget information. Furthermore, the possibility of time leaps and the respective textbox in the instrument cluster were explained. Participants then drove a test drive of 8–10 min to familiarize themselves with the simulator and the activation and deactivation process of the automation. The drive was performed on either highway or city roads, depending on the participant’s allocation to an experimental group. The drive included both manual and automated driving periods. Participants experienced the baseline HMI (with time budget information but without confidence symbol) including two RtIs. After the test drive and another short instruction, the first experimental drive started, featuring either the baseline or the advanced HMI concept. Similar to the pre-study, no additional instruction was given regarding the confidence display or the research purpose. We assumed the concept to be easily understandable as it is based on a well-known symbol and pre-study results and was described in the instrument cluster using a permanent text.
Participants were instructed to engage in an NDRA with their phone or the tablet provided (featuring videos and games) and activate the automation as soon as possible. These NDRA were chosen because of their popularity causing high motivation to engage [21,22] and their comparable visual distraction. The system was defined as an SAE Level 3 automation that did not need to be supervised by the user. It did not include a minimal risk maneuver. Following the first experimental drive, questionnaires (see Section 2.6) were administered. Participants then drove the second experimental drive and answered the same set of questions. Each drive lasted about 20 min. Finally, a post-study questionnaire was given with questions on participants’ favorite HMI concept, their perception of time leaps and whether they wanted additional HMI modalities to inform them about time leaps. Furthermore, participants had the chance to comment the study, the HMI and the simulator. All participants had the chance to win a €20 Amazon voucher. The whole experiment lasted about 75 min.
2.5. Apparatus
The experiment was conducted in a mock-up located at the Chair of Ergonomics at the Technical University of Munich (see Figure 4). The mock-up consisted of three ultra HD (4096 × 2160 px) 55” monitors, displaying a 120° field of view including the rear mirror. Two additional displays represented the side mirrors. The instrument cluster featuring the developed HMI was displayed on a 13” monitor located behind the steering wheel. Steering wheel and pedals (by SensoDrive) and a motion platform from D-BOX (to induce pitch and roll motions) were installed. The simulator was run with the driving simulator software SILAB 6 from Würzburg Institute for Traffic Sciences (WIVW).
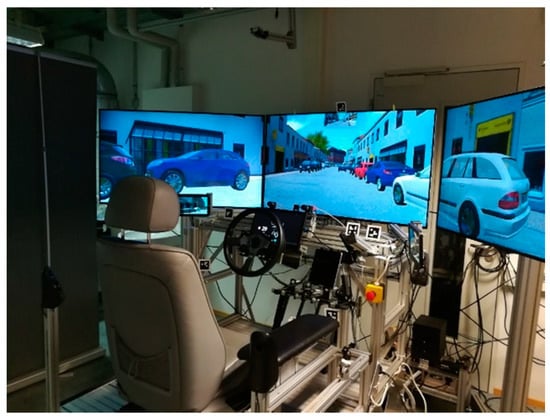
Figure 4.
Mock-up used in this study.
The implemented driving automation was capable of taking over longitudinal and lateral guidance. It was activated and deactivated from a button on the steering wheel. Due to technical limitations, the city automation had to be activated at a speed of 30 km/h or lower, which was not the case for the highway automation. Drivers were informed of the time until the next system limit through the predictive HMI in both HMI conditions. Additionally, cascade auditory warnings 28, 14 and 7 s prior to the system limits, as well as text boxes (“Please take over in 28/14/7 seconds”), conveyed different levels of urgency. The availability of the system was indicated by an auditory icon and a textbox in the instrument cluster.
2.6. Dependent Variables
To test the acceptance of the system, van der Laan’s acceptance scale [23] was implemented. Nine items are rated on a 5-point scale from −2 to 2 (semantic differential), separated between the two dimensions satisfaction and usefulness. Furthermore, the NASA-RTLX [24] was used to measure workload and the subscale frustration on scales from 0 to 20. The system usability scale (SUS) [25] was used to assess usability. Its ten items are rated on a 5-point Likert scale. Moreover, a single-item question on trust (“I trust the system”; 1 = I don’t agree at all, 5 = I completely agree) was used. Based on the literature presented, the following hypotheses were formulated:
Hypothesis 1a(H1a).
Displaying the confidence in an automated driving time influences the acceptance of the system.
Hypothesis 1b(H1b).
The scenario (city vs. highway) influences participants’ acceptance of the system.
Hypothesis 2(H2).
Displaying the confidence in an automated driving time budget influences trust in the system.
Hypothesis 3(H3).
Displaying the confidence in an automated driving time budget influences the usability of the system.
Hypothesis 4a(H4a).
Displaying the confidence in an automated driving time budget influences participants’ frustration level.
Hypothesis 4b(H4b).
The scenario (city vs. highway) influences participants’ frustration level.
2.7. Participants
The sample consisted of N = 32 participants, 16 per scenario condition. In total, 25 participants were male and seven female. The average age was M = 31.56 years (SD = 7.16). Thirteen participants drive less than 5000 km/year, seven between 5001 and 10,000 km/year, four between 10,001 and 15,000 km/year, six between 15,001 and 20,000 km/year and two more than 20,000 km/year. Thirteen participants (40.63%) had taken part in a driving simulator study before and nine participants (28.13%) were students. Participants rated their experience with automated driving mainly as “medium” (34.38%).
2.8. Statistical Analysis
Statistical analysis was performed using IBM SPSS 24. To test hypotheses, mainly analyses of variance (ANOVA) were conducted or, if the prerequisites had not been fulfilled, relevant non-parametric tests. Likert scales and semantic differentials that are used for calculating total scores are considered suitable for parametric testing, whereas single-item responses are considered to be of ordinal character and thus required non-parametric testing [26]. As ANOVA was found to be sufficiently robust to withstand any violation of normal distribution, it was calculated even in the event of normality violation [27]. Levene’s test was used to assess variance homogeneity. As the effects of the two HMI concepts were tested multiple times for subjective ratings, the alpha level was adjusted using the Bonferroni-Holm method. The alpha level initially tested was α = 0.05.
2.9. Ethical Approval
The Ethics Board of the Technical University of Munich provided ethical approval for this study. The corresponding ethical approval code is 539/19 S-SR.
3. Results
3.1. Subjective Rating
Means and standard deviations for all subjective measures, subdivided into advanced and baseline HMI, as well as highway and city scenario, can be found in Table 1. A principal component analysis (PCA) was calculated with regard to van der Laan’s acceptance scale. The two dimensions, usefulness and satisfaction, could not be confirmed in the PCA and therefore an overall score for acceptance was calculated as a mean of the values from −2 to 2 of all nine items. To test effects on acceptance, a 2 × 2 ANOVA was calculated. The error variances were homogeneous, as assessed by Levene’s test (p > 0.05). The ANOVA was not significant for the within factor HMI (F(1, 30) = 0.00, p > 0.999). Furthermore, there was no interaction effect (F(1, 30) = 2.97, p = 0.10) and no effect of the between factor scenario (F(1, 30) = 1.23, p = 0.532).

Table 1.
Means (and standard deviations) for subjective measures.
To assess the effects on trust, non-parametric tests were calculated because the single-item question does not fulfill requirements for ANOVA. To test the within factor, a Wilcoxon test was calculated and revealed no significant effect of the HMI concept on trust (z = −1.10, p > 0.999, n = 32). In addition, no significant effect was found for the between factor scenario calculating a Mann–Whitney U test (z = −1.69, p = 0.273, n = 32).
To test effects on usability, a 2 × 2 ANOVA was calculated. The assumption of homogeneity was fulfilled for all times of measures. The ANOVA was significant for neither the within factor HMI (F(1, 30) = 0.35, p > 0.999) nor the between factor scenario (F(1, 30) = 1.29, p = 0.552). Furthermore, there was no interaction effect between the concepts and the scenarios (F(1, 30) = 1.12, p = 0.299). According to Bangor et al. [28], average SUS scores of the highway drives can be interpreted as good (advanced HMI: M = 83.59) and excellent (baseline HMI: M = 86.66). In both city drives, the concepts were rated as good.
To assess the effects on frustration, non-parametric tests were calculated. For the within factor, a Wilcoxon test revealed no significant effect of the HMI concept on trust (z = − 0.22, p > 0.999, n = 32). However, a significant effect was found for the between factor scenario calculating a Mann–Whitney U test (z = −3.17, p = 0.008, n = 32, r = 0.56): frustration is higher for the city condition than on the highway (with a strong effect size).
3.2. Post-Study Questions
In the overall rating, 21 participants (65.63%) preferred the baseline concept; 11 liked the advanced concept with the confidence display better. Eighteen participants (56.25%) felt not supported in their activity planning by the confidence display, eight (25%) were undecided and six (18.75%) agreed. Half of the participants stated that they had recognized that there were both extensions and reductions of the time budget in each experimental drive. Of those who recognized the time leaps, extensions in the automated driving time were rated mostly positive (10 positive, 6 neutral and 0 negative). Reductions in the automated driving time budgets were evaluated as mostly neutral (0,11 and 5, respectively). Twenty-six participants stated that they were highly involved in their NDRA. Four participants wanted to be informed about time leaps via voice message, 15 wanted an auditory icon, 7 an LED conveying the information, and 11 desired no additional notification (multiple answers possible). In the open comments, two participants mentioned problems interpreting the confidence symbol. Two participants rated the symbol positive and one as irrelevant.
3.3. Subset of Data: Time Leaps Noticed
To further analyze the effect of the confidence display on subjective measures, the subset of 16 (10 highway and 6 city) participants who stated to have noticed the leaps was assessed separately. Among them, three participants (18.75%) preferred the advanced concept (compared to 50% of those who did not note the leaps). Very similar to the complete sample, 56% of the participants did not feel supported in their NDRA planning and engagement by the confidence symbol, 19% did and 25% were undecided. Further subjective measures (see Table 2) descriptively show no effects of the HMI concept on acceptance, slightly improved trust and frustration levels for the advanced concept and a better usability rating for the baseline concept. Due to the explorative character of this analysis, no statistical tests were calculated.
Table 2.
Data subset with means (and standard deviations) for subjective measures.
4. Discussion
With the HMI concept presented, we aimed to improve the value of time budget estimations for automated driving time by adding a confidence level as an additional element for a predictive HMI in cases where time leaps occur due to changing traffic or environmental information. We expected our concept to improve usability, trust, frustration and acceptance in a common NDRA setting. Furthermore, we assumed that the scenario (highway vs. city) would have an influence with regard to frustration and acceptance. However, the HMI concept with the confidence display did not show any positive or negative impact on the subjective evaluation. The only significant influence was found for frustration: the city scenario has a negative impact on the level of frustration.
The increased level of frustration in the city scenario might be due to the driving automation implemented. The city automation occasionally leads to problems with the activation of the system and should only be activated at speeds lower than 30 km/h. This is, however, not the case with the highway automation. High standard deviations of city frustration ratings undermine the possible influence of occasional automation imperfections.
Unexpectedly, no effect was found for the confidence display. A possible explanation is that participants did not understand or trust the confidence symbol. Despite our effort to design an intuitive symbol (including a textual description), two participants explicitly mentioned difficulties understanding the confidence symbol. Instructing the participants on the confidence display or training them in using it might have an impact on the way the system is evaluated. Short interaction time and familiarity bias may have favored the familiar baseline concept in this study. However, extensive training does not reflect a naturalistic scenario and was therefore omitted.
Furthermore, half of the participants indicated that they were not aware of all the time leaps, most likely because of the visually distracting NDRA and the small leaps (2–3 min). Those who noted the time leaps were less likely to prefer the confidence display than those who did not, strengthening the rejection of the concept. According to participants, auditory or ambient information could be implemented to raise awareness for the leaps. However, the evaluation of such accentuations will most likely depend on the frequency of time leaps and personal preferences. Depending on the current NDRA, it may also be perceived as rather annoying and thus decrease acceptance [3]. However, further evaluation could compare an LED-based notification concept with an auditory icon and no accentuation to further investigate this issue.
Moreover, the confidence concept might generate limited benefit for the users, because they can only be sure that there are no time leaps if the confidence display is at 100%. This was the case during 13 out of 17 min of automated driving time (see Figure 3). Nonetheless, only 19% felt supported in their activity planning by the confidence symbol. In conclusion, this study adds to previous contradictory results of confidence display studies. In some studies, confidence displays achieved no improvements or even some disadvantages [11,12,17]. Moreover, in today’s navigation systems, which suffer the same problem, no confidence is given in the arrival time estimation. Time leaps in the estimated arrival time seem to be accepted.
Future studies might investigate the usefulness of a confidence information when engaging in time critical NDRAs. The chosen activity in this study represented a very common activity. A setting with more time pressure and more motivation to achieve a predefined goal might generate positive effects of a confidence display, as in such a scenario the confidence display might help the user to anticipate whether or not he will be able to finish his NDRA without interruption. This knowledge might have been of no importance in our study, due to the unimportance of the NDRA. If there are positive effects in such cases, the confidence display can for example only be displayed if the user wishes to engage in such activities and desires confidence information to improve NDRA planning.
5. Conclusions
In this study, we followed a new approach to add value to automated driving time budget estimations. A confidence display resembling a mobile phone connectivity bar was implemented to visualize confidence in the system’s ability to estimate automated driving time. Neither positive nor negative effects on the subjective evaluation of the confidence display were found in a driving simulator study in a common and naturalistic NDRA setting (mobile device use). The majority of participants preferred a predictive HMI without a confidence level.
Author Contributions
Conceptualization, T.H. and S.D.; methodology, T.H., S.D. and A.F.; software, T.H. and S.D.; validation, T.H., S.D. and A.F.; formal analysis, T.H.; investigation, T.H.; resources, A.F. and K.B.; data curation, T.H.; writing—original draft preparation, T.H.; writing—review and editing, T.H., S.D., A.F. and K.B.; visualization, T.H.; supervision, K.B.; project administration, K.B.; and funding acquisition, K.B. All authors have read and agreed to the published version of the manuscript.
Funding
This research was funded by research project @CITY-AF, carried out at the request of the Federal Ministry of Economics and Energy (Bundesministerium für Wirtschaft und Energie), under research project No. 19A18003N. The authors are solely responsible for the content.
Acknowledgments
The authors thank Jana Mühlhausen for conducting the study.
Conflicts of Interest
The authors declare no conflict of interest. The funders had no role in the design of the study; in the collection, analyses, or interpretation of data; in the writing of the manuscript, or in the decision to publish the results.
References
- Holländer, K.; Pfleging, B. Preparing Drivers for Planned Control Transitions in Automated Cars. In MUM 2018, Proceedings of the 17th International Conference on Mobile and Ubiquitous Multimedia, Cairo, Egypt, 25–28 November 2018; Abdennadher, S., Alt, F., Eds.; The Association for Computing Machinery, Inc.: New York, NY, USA, 2018; pp. 83–92. ISBN 9781450365949. [Google Scholar] [CrossRef]
- SAE International. Taxonomy and Definitions for Terms Related to Driving Automation Systems for On-Road Motor Vehicles. SAE Int. 2018. [Google Scholar] [CrossRef]
- Naujoks, F.; Wiedemann, K.; Schoemig, N. The Importance of Interruption Management for Usefulness and Acceptance of Automated Driving. In Proceedings of the 9th International Conference on Automotive User Interfaces and Interactive Vehicular Applications, Oldenburg, Germany, 24–27 September 2017. [Google Scholar] [CrossRef]
- Danner, S.; Pfromm, M.; Bengler, K. Does Information on Automated Driving Functions and the Way of Presenting It before Activation Influence Users’ Behavior and Perception of the System? Information 2020, 11, 54. [Google Scholar] [CrossRef]
- Hecht, T.; Darlagiannis, E.; Bengler, K. Non-driving Related Activities in Automated Driving—An Online Survey Investigating User Needs. In Human Systems Engineering and Design II. IHSED 2019. Advances in Intelligent Systems and Computing, vol 1026, Proceedings of the 2nd International Conference on Human Systems and Design: Future Trends and Applications, Munich, Germany, 17–19 September 2019; Ahram, T., Karwowski, W., Pickl, S., Taiar, R., Eds.; Springer International Publishing: Cham, Switzerland, 2020; pp. 182–188. ISBN 978-3-030-27928-8. [Google Scholar] [CrossRef]
- Hecht, T.; Kratzert, S.; Bengler, K. The Effects of a Predictive HMI and Different Transition Frequencies on Acceptance, Workload, Usability, and Gaze Behavior during Urban Automated Driving. Information 2020, 11, 73. [Google Scholar] [CrossRef]
- Wandtner, B.; Schömig, N.; Schmidt, G. Secondary task engagement and disengagement in the context of highly automated driving. Transp. Res. Part F Traff. Psychol. Behav. 2018, 58, 253–263. [Google Scholar] [CrossRef]
- Richardson, N.T.; Flohr, L.; Michel, B. Takeover Requests in Highly Automated Truck Driving: How Do the Amount and Type of Additional Information Influence the Driver–Automation Interaction? MTI 2018, 2, 68. [Google Scholar] [CrossRef]
- Danner, S.; Pfromm, M.; Limbacher, R.; Bengler, K. Information needs regarding the purposeful activation of automated driving functions. In Human Factors and Ergonomics Society Europe Chapter, Proceedings of the Human Factors and Ergonomics Society Europe Chapter 2019 Annual Conference, Nantes, France, 2–4 October 2019; Waard, D.d., Tolfetti, A., Pietrantoni, L., Franke, T., Petiot, J.-F., Dumas, C., Botzer, A., Onnasch, L., Milleville, I., Mars, F., Eds.; 2020; Available online: https://www.hfes-europe.org/books-proceedings/ (accessed on 3 July 2020).
- McGuirl, J.M.; Sarter, N.B. Supporting trust calibration and the effective use of decision aids by presenting dynamic system confidence information. Hum. Factors 2006, 48, 656–665. [Google Scholar] [CrossRef]
- Shani, G.; Rokach, L.; Shapira, B.; Hadash, S.; Tangi, M. Investigating confidence displays for top- N recommendations. J. Am. Soc. Inf. Sci. Technol. 2013, 64, 2548–2563. [Google Scholar] [CrossRef]
- Stockert, S.; Richardson, N.; Lienkamp, M. Driving in an Increasingly Automated World – Approaches to Improve the Driver-automation Interaction. Procedia Manuf. 2015, 3, 2889–2896. [Google Scholar] [CrossRef]
- Feierle, A.; Danner, S.; Steininger, S.; Bengler, K. Information Needs and Visual Attention during Urban, Highly Automated Driving—An Investigation of Potential Influencing Factors. Information 2020, 11, 62. [Google Scholar] [CrossRef]
- Large, D.; Burnett, G.; Morris, A.; Muthumani, A.; Matthias, R. Design Implications of Drivers’ Engagement with Secondary Activities During Highly-Automated Driving—A Longitudinal Simulator Study. In Proceedings of the Road Safety and Simulation International Conference (RSS) 2017, The Hague, The Netherlands, 17–19 October 2017. [Google Scholar]
- Helldin, T.; Falkman, G.; Riveiro, M.; Davidsson, S. Presenting system uncertainty in automotive UIs for supporting trust calibration in autonomous driving. In Proceedings of the 5th International Conference on Automotive User Interfaces and Interactive Vehicular Applications, Eindhoven, 2013, Eindhoven, The Netherlands, 28–30 October 2013; Terken, J., Ed.; ACM: New York, NY, USA, 2013; pp. 210–217. ISBN 9781450324786. [Google Scholar] [CrossRef]
- Beller, J.; Heesen, M.; Vollrath, M. Improving the driver-automation interaction: An approach using automation uncertainty. Hum. Factors 2013, 55, 1130–1141. [Google Scholar] [CrossRef] [PubMed]
- Kunze, A.; Summerskill, S.; Marshall, R.; Filtness, A. Automation Transparency: Implications of Uncertainty Communication for Human-Automation Interaction and Interfaces. Ergonomics 2018, 62, 1–22. [Google Scholar] [CrossRef]
- Ochs, M.; Pelachaud, C.; Sadek, D. An empathic virtual dialog agent to improve human-machine interaction. In Proceedings of the 7th International Joint Conference on Autonomous Agents and Multiagent Systems—Volume 1; International Foundation for Autonomous Agents and Multiagent Systems: Estoril, Portugal, 2008; pp. 89–96. ISBN 9780981738109. [Google Scholar]
- Bengler, K.; Rettenmaier, M.; Fritz, N.; Feierle, A. From HMI to HMIs: Towards an HMI Framework for Automated Driving. Information 2020, 11, 61. [Google Scholar] [CrossRef]
- Feierle, A.; Bücherl, F.; Hecht, T.; Bengler, K. Evaluation of Display Concepts for the Instrument Cluster in Urban Automated Driving. In Human Systems Engineering and Design II. IHSED 2019. Advances in Intelligent Systems and Computing, vol 1026. Proceedings of the 2nd International Conference on Human Systems and Design: Future Trends and Applications, Munich, Germany, 17–19 September 2019; Ahram, T., Karwowski, W., Pickl, S., Taiar, R., Eds.; Springer International Publishing: Cham, Switzerland, 2020; pp. 209–215. ISBN 978-3-030-27928-8. [Google Scholar] [CrossRef]
- Pfleging, B.; Rang, M.; Broy, N. Investigating user needs for non-driving-related activities during automated driving. In International Conference on Mobile and Ubiquitous Multimedia (MUM), Proceedings of the 15th International Conference on Mobile and Ubiquitous Multimedia (MUM), Rovaniemi, Finland, 12–15 December 2016; Alt, F., Ed.; The Association for Computing Machinery, Inc.: New York, NY, USA, 2016; pp. 91–99. ISBN 9781450348607. [Google Scholar] [CrossRef]
- Hecht, T.; Feldhütter, A.; Draeger, K.; Bengler, K. What Do You Do? An Analysis of Non-driving Related Activities During a 60 Minutes Conditionally Automated Highway Drive. In Human Systems Engineering and Design II. IHSED 2019. Advances in Intelligent Systems and Computing; Ahram, T., Taiar, R., Colson, S., Choplin, A., Eds.; Springer International Publishing: Cham, Switzerland, 2020; ISBN 978-3-030-25629-6. [Google Scholar] [CrossRef]
- van der Laan, J.D.; Heino, A.; Waard, D.d. A simple procedure for the assessment of acceptance of advanced transport telematics. Transp. Res. Part C Emerg. Technol. 1997, 5, 1–10. [Google Scholar] [CrossRef]
- Hart, S.G.; Staveland, L.E. Development of NASA-TLX (Task Load Index): Results of Empirical and Theoretical Research. In Human Mental Workload; Meshkati, N., Hancock, P.A., Eds.; Elsevier: Amsterdam, The Netherlands, 1988; pp. 139–183. ISBN 9780444703880. [Google Scholar]
- Brooke, J. SUS—A quick and dirty usability scale. In Usability Evaluation in Industry; Jordan, P.W., Thomas, B., McClelland, I.L., Weerdmeester, B., Eds.; Taylor & Francis: London, UK, 1996; pp. 189–194. ISBN 0-7484-0314-0. [Google Scholar]
- Carifio, J.; Perla, R. Resolving the 50-year debate around using and misusing Likert scales. Med. Educ. 2008, 42, 1150–1152. [Google Scholar] [CrossRef] [PubMed]
- Blanca, M.J.; Alarcón, R.; Arnau, J.; Bono, R.; Bendayan, R. Non-normal data: Is ANOVA still a valid option? Psicothema 2017, 29, 552–557. [Google Scholar] [CrossRef] [PubMed]
- Bangor, A.; Kortum, P.; Miller, J. Determining what individual SUS scores mean: Adding an adjective rating scale. J. Usability Stud. 2009, 4, 114–123. [Google Scholar]


© 2020 by the authors. Licensee MDPI, Basel, Switzerland. This article is an open access article distributed under the terms and conditions of the Creative Commons Attribution (CC BY) license (http://creativecommons.org/licenses/by/4.0/).