2. Introduction
Computer-supported collaborative learning (CSCL) is the “field concerned with how information and communication technology (ICT) might support learning in groups (co-located and distributed)” (p. 290) [
1]. This group is usually composed of 2 to 6 students working together to solve a problem [
2]. ICT covers a wide range of technological tools and devices such as computers, the Internet, live broadcasting technologies (e.g., radio and television), broadcasting technologies (e.g., podcasting and video players), and telephony (e.g., mobile, or fixed) [
3]. In the scoping review conducted by Bringula and Atienza (2022) [
4], it was shown that CSCL had positive effects on students’ social aspects, attitudes, and mathematics competencies.
Within a CSCL learning environment, it is assumed that students can work together towards a common academic goal and, consequently, learn in a social group [
5,
6]. It is also assumed that students have equal participation in this learning environment. However, these assumptions are not always true because students have different personalities. Understanding the students’ personalities is important because these could influence their academic performance in a learning environment [
7]. For example, highly individualistic students prefer to work alone. In addition, some students do not perform their assigned tasks; instead, they resort to leaving the group to avoid dealing with the responsibility [
8]. Furthermore, some dominant students monopolize discussions [
8], whereas some team members share and agree on a common decision [
9,
10]. As a result, unique information is ignored [
11]. Students who have unique ideas may be forced to agree with the rest of the group, resulting in a phenomenon known as groupthink [
11]. Other students may reduce or cease efforts to contribute to the welfare of the group [
12,
13,
14,
15]. They may also have varying degrees of participation in a learning activity [
16]. Some students were very competitive and outspoken, while others were timid, shy, and afraid to commit mistakes. As pointed out by [
17], these challenges are related to group cohesion, participation, communication, collaboration, and trust.
The behaviors previously discussed are well-documented. The stag and hare hunting behaviors, on the other hand, are underrepresented in the CSCL literature. In a game-based, mobile-supported collaborative learning environment, stag and hare hunting behaviors refer to learners’ tendency to choose either a high-risk game mode with higher payoffs (i.e., the stag) or a low-risk game mode with fewer points (i.e., the hare) [
18]. Since learners are in a collaborative learning environment, their interactions with the system may be influenced by their personalities. A student who is not afraid to make mistakes may choose an answer passively to contribute to the group’s points. On the one hand, a student who does not want to be blamed if his or her answer is incorrect may choose a question with a lower point value. These students may not necessarily contribute to the overall well-being of the group and, as a result, do not achieve learning.
This study adapted the stag hunt behavior proposed by Rousseau [
19], as discussed in the papers of Skyrms [
20,
21]. The stag hunt behavior means that a hunter must hunt for a stag, though he may, nonetheless, opt for a hare, if given the chance. The contributions of the members of the team in the stag hunting behavior are based on the risks associated with the options. Given this context, this study aimed to investigate stag and hare hunting behaviors of students who used a mobile-based CSCL in mathematics and to develop a model that would characterize these behaviors.
4. Methodology
4.1. Software Utilized
The method of this study was already reported in our previous work [
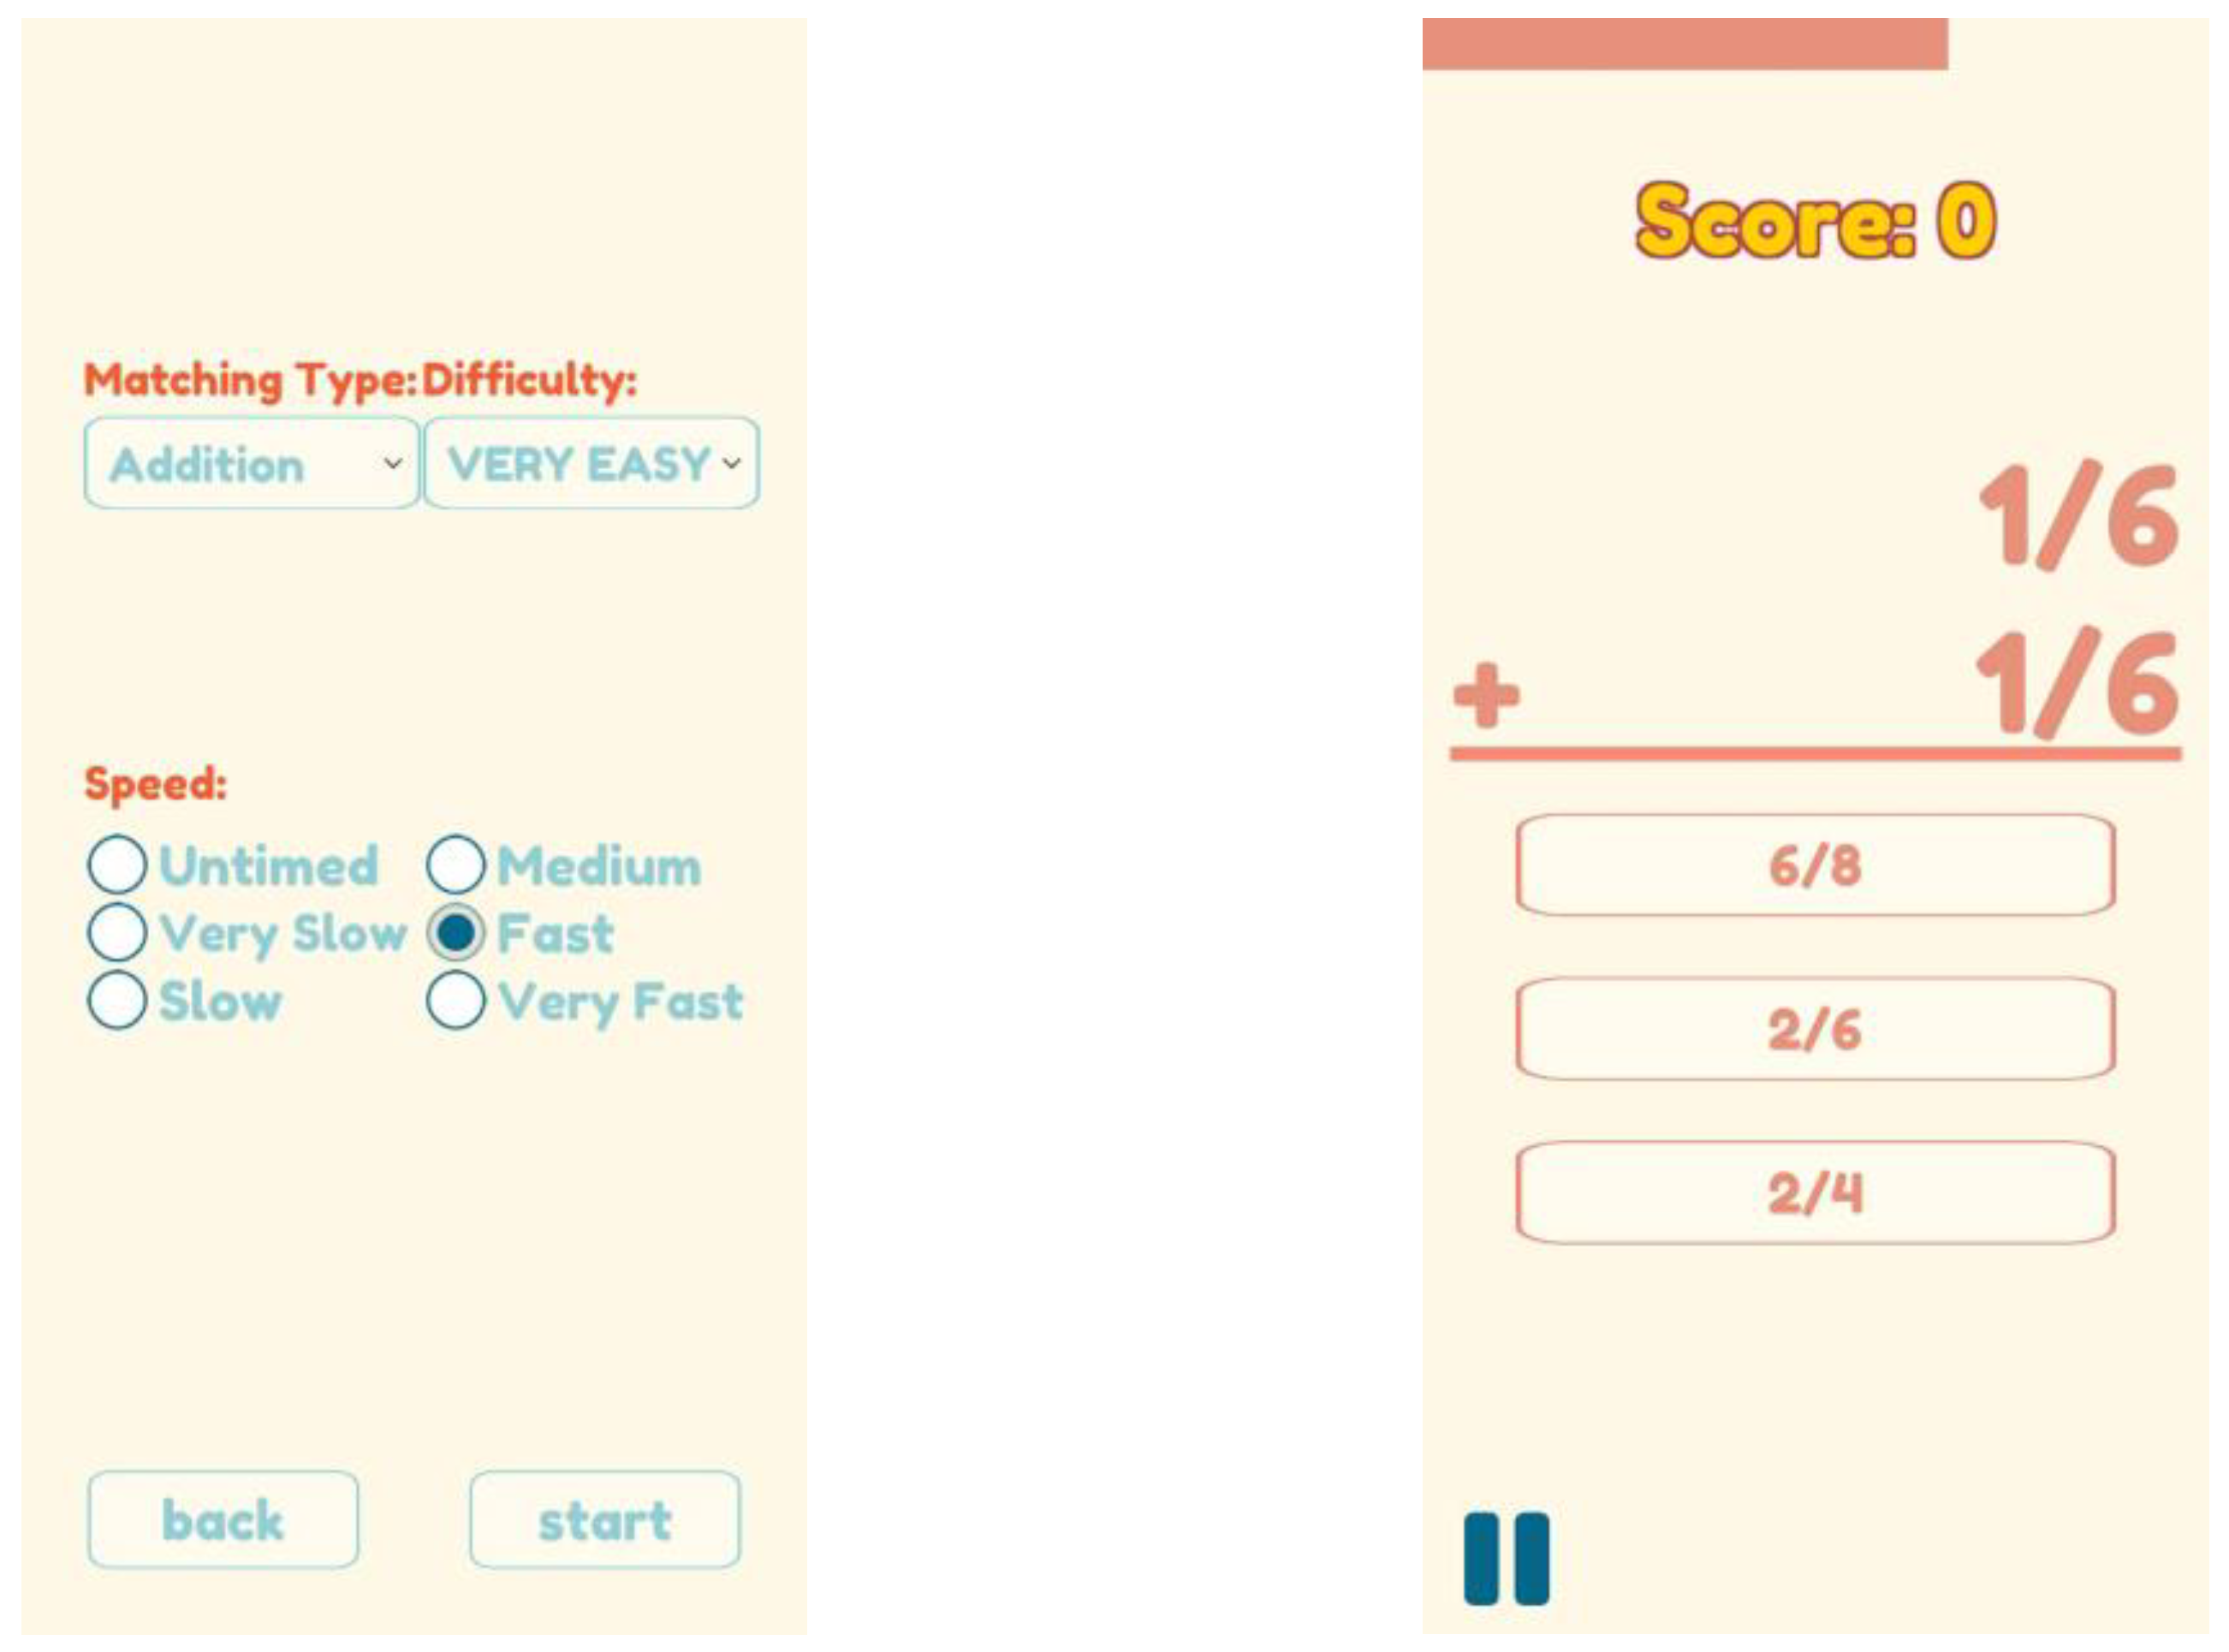
16]. The study utilized Ibigkas! Math, a mobile-based learning application for students in grades 1–6. It is a collaborative game that generates and displays arithmetic problems (addition, subtraction, multiplication, and division of whole numbers and fractions). The given and possible answers appear on all the students’ devices. The correct answer, however, appears only on one of the mobile Android devices of the team members. The answer must be stated aloud by the players. At least two students must play the game. Each player was given a chance to host the game. Only the host can select the game setting. The game setting includes selection of the arithmetic operation, difficulty level, and speed (
Figure 1; [
16]).
4.2. Research Design, Data Gathering Procedure and Participants
Two research designs were used in this study. One of the research designs used was a one-group pretest-posttest design [
49]. Prior to the intervention period, a pretest was administered. A three-day intervention period followed the pretest. All participants used the same version of Ibigkas! Math. Finally, a posttest was given. A descriptive design was also used because the collected log files were analyzed to determine the participants’ usage behaviors [
49].
There were two sections of grade 5 students, each of which had 40 students, but only one section participated in the study. Of the 40 students in that section, only 37 participated in the study. The demographics of the participants are shown in
Table 1.
Grade 5 students from a private university in Manila participated in this study. The university has an elementary department. They were grouped into three-person teams in terms of mathematical competencies and personality dimensions. Every team consisted of students with different levels of mathematical competencies (struggling/low-, average-, and high-performing) and personality dimensions. The team is homogenous. Teachers identified the mathematical competencies of the students. The classifications are reliable because teachers know the abilities of their students [
18,
50,
51,
52]. The results of the pretest (
Table 2) confirmed that the teachers’ classifications were correct. Thus, in the study, there were eight struggling students, 13 average students, and 16 high-performing students. Meanwhile, the Big Five personality dimensions (OCEAN) [
31] were used to identify the personality dimensions of the students because the items of this instrument are intended to capture the dominant personality dimensions of the children. The descriptions of OCEAN are further discussed in the results section.
The team used the game for a total of 45 min without any interventions from the software or facilitators. Each team member was given equal chances to host the game. The host of the game chose the game settings that include the type of problem solved (addition, subtraction, multiplication, and division), difficulty levels (very easy, easy, medium, hard, and very hard), and speed (very slow, slow, medium, fast, and very fast). The times for each speed setting are as follows: very slow is 35 s, slow is 30 s, medium is 27 s, fast is 20 s, and very fast is 15 s. The game scores are based on the speed setting, but untimed speed has no equivalent points. The points for the other settings are as follows: very slow corresponds to 2 points, slow to 5 points, medium to 10 points, fast to 15 points, and very fast to 20 points. All students were given a token of participation, and the three groups with the highest game scores received prizes. During this process, interactions with the applications were tracked and automatically recorded on the mobile phones.
The pretest-and-posttest research design was adopted from Rodrigo et al. [
53]. The pretest was administered before the start of the game, and the posttest was given after the game. Both tests consisted of 12 items (three questions on each of the four arithmetic operations on fractions). Mathematics teachers validated the items on the pretest and posttest. This ensured that the items of the tests were appropriate for the grade levels of the students and conformed to the curriculum [
53].
4.3. Data Collection, Pre-Processing, Preparation, Feature Selection, and Data Analysis
The interaction log files from mobile phones were manually collected and encoded in a spreadsheet. The dataset included interaction logs with eight distinct features (i.e., game host, difficulty level, speed, type of problem solved, time start, time end, number of attempts, and correct attempts). The game host (coded as 1 and 0) displays the student who selected the game setting. Correct attempts refer to whether the response is correct or not. Nominal data include the difficulty level, type of problem solved, and correct attempts. Time spent is a derived feature that indicates the time spent answering problems. It is calculated by subtracting time end from time start. The total number of responses provided by learners in answering a given problem is referred to as the number of attempts. Accuracy is calculated by dividing the number of correct attempts by the number of attempts, and numeric data is normalized using z-scores.
The stag and hare hunting behaviors were based on the speed setting that a student chose. Students were labeled as stag hunters if they chose fast or very fast game settings; otherwise, they were labeled as hare hunters [
16]. A stag hunter is a student who chooses a faster game setting that entails higher points as well as higher penalties for incorrect answers (e.g., deductions on time). A hare hunter is the exact opposite of a stag hunter—that is, a student who chooses a slower game setting in which there are fewer points and penalties for incorrect answers. Personality dimensions were also included as one of the hypothesized features. Incomplete records (e.g., incomplete or invalid data) were removed from the dataset, whereas log files generated in single-player mode were discarded. Accuracy was excluded in the decision tree modeling.
Seventy percent of the dataset served as the training dataset. Employing forward feature selection using k-NN 10-fold cross-validation with Weight by Chi-Squared Statistic (χ2(Difficulty Level) = 5159.1; χ2(Type of Problem Solved) = 951.7; χ2(Correct Attempts) = 123.9; χ2(Personality) = 15076.0) and Weight by Correlation (Time Spent, r = 0.11; Number of Attempts, r = 0.09), all features except Number of Attempts were retained.
Decision tree modeling with accuracy criterion was employed using the selected features to model the behavior of the students in using the application. Using the decision tree modeling dataset, the data for the lag sequential analysis (LSA) was derived. The LSA data was composed of a sequence of game settings in terms of difficulty level and types of problems solved of stag and hare hunters. The data was then analyzed through Generalized Sequential Querier version 5.1.
Normalized learning gain was computed to describe the increase (or decrease) in the scores of the students. Moreover, normalized gain g was computed to determine how much the students learned from the game session. The formula, which is shown in Equation (1), denotes the ratio of the mathematics performance of students to the maximum achievable improvement [
54,
55].
Due to the small sample size, the Mann-Whitney
U test was used to establish whether there is a significant difference in game interaction data between the hare and stag hunters [
56]. Spearman’s rho correlation was employed to determine the relationship between learners’ game interaction data and learning gain. To determine the significance of the findings, all statistical tests adopted a 0.05 level of significance with 95% reliability.
5. Results
RQ1: Which of the stag and hare behaviors is beneficial (or harmful) to mathematics achievement?
Table 2 shows the pretest and posttest results. Stag hunters have higher prior knowledge than the hare hunters. The standard deviations of the scores and learning gains show that the mathematics performance of stag hunters is less dispersed than that of the hare hunters. The stag hunters had negative learning gains (
M = −50%). On the other hand, the hare hunters had positive learning gains (
M = 7.1%). Nevertheless, the test scores of both students were above the passing mark (i.e., half of the number of items).
There are 1745 game sessions (
Table 3). A game session refers to the state where a student chooses a game mode. The stag hunters are more likely to choose the very fast game mode, while the hare hunters tend to select a medium speed game mode. This is confirmed in the z-scores shown in
Table 4. Stag hunters tend to avoid division problems, while hare hunters try to solve more diverse types of problems. While both tend to solve more addition problems, the z-scores indicate that stag hunters solve addition problems higher than the average. The z-scores also suggest stag hunters tend to avoid subtraction and multiplication problems, which is the opposite of what the hare hunters do.
The game sessions generated 4628 solved arithmetic problems (
Table 5). On average, students solved 2.7 problems per minute (4628 arithmetic problems/(37 students × 3 sessions × 15 min per session)). This result is achievable because each game setting could last from 15 to 35 s. Stag hunters (M = 1.2 s, z-score = −0.61) answered the questions more quickly than did the hare hunters (M = 1.6 s, z-score = 0.29). Stag hunters had more attempts to answer a problem before getting the correct one (M = 535.7, SD = 712.5, z-score = 0.44). When the average number of attempts is divided by the average number of problems (535.7/173.3~3.1), an average of 3.1 is computed. This is the average number of attempts per problem. This result implies that stag hunters select all the possible choices just to get the correct answer, which, in turn, increases the accuracy rate. On the one hand, hare hunters (M = 182.4, SD = 420.3, z-score = −0.21) take about 1 to 2 selections (182.4/125.5~1.5) before they can hit the correct answer. The z-scores of average attempts confirm that stag hunters took more attempts on average than did the hare hunters.
Stag hunters had more correct attempts (M = 68.7, SD = 54.3, z-score = 0.56) than did the hare hunters (M = 30.4, SD = 36.0, z-score = −0.27). Similarly, the stag hunter (M = 46.9, SD = 49.2, z-score = 0.47) had higher chances of getting the correct answer than the hare hunters did (M = 25.3, SD = 12.6, z-score = −0.23). This is because stag hunters selected all three given choices. Stag hunters (M = 188.3, SD = 137.4, z-score = 0.63) were more likely to answer addition problems than their counterparts (M = 87.7, SD = 75.2, z-score = −0.30). Mann-Whitney U tests show that there is a significant difference between the game interactions of the two groups in terms of time spent answering a problem, number of attempts, number of correct attempts, accuracy, and number of addition problems (
Table 6).
Answering easy problems for the hare hunters has a moderately positive relationship with their learning gain (Spearman r = 0.475,
p < 0.05) (
Table 7). The result suggests that hare hunters are more cautious in answering problems (
Table 7). For the stag hunters, all game settings data relating to number of attempts (Spearman r = −0.54,
p < 0.05), number of correct attempts (Spearman r = −0.77,
p < 0.05), accuracy (Spearman r= −0.61,
p < 0.05), and addition problems (Spearman r = −0.60,
p < 0.05) have a moderate to strong negative relationship with their learning gains. While high interaction data may seem favorable to students, the findings suggest otherwise.
6. RQ2: What Features Describe the Stag and Hunting Behaviors of the Students?
The model correctly classified 76.1% of the instances classified using the decision tree model (
Figure 2). The precision means that 83.3% of the students belong to the actual “stag” class among all the students predicted to be “stag” (
Table 8). Under the class “stag”, the classifier can correctly label 83.3% of the students who are stag hunters. In other words, when the decision tree model predicts the student as a stag hunter, the model is correct 83.3% of the time. Recall signifies that 72.2% of the “stag” students have been correctly identified as “stag-hunter” students.
Personality dimensions primarily predict stag and hare hunting behaviors. Students who display high Openness personality traits are more likely to become stag hunters. The keenness to try new things and experiences—the dominant characteristics of people displaying Openness personality traits—explains why students are thrilled to have faster game settings. Students who display high Extraversion personality traits are known to be talkative, energetic, and assertive. Students who display high Neuroticism personality traits are more likely to be hare hunters. They are known to be moody and tense. They regulate these traits by choosing a slow-paced game setting.
Students who display high Conscientiousness are also categorized as hare hunters. They are characterized as being organized, methodical, and thorough. Students who display an enhanced Agreeableness personality trait tend to be classified as hare hunters. However, they also display characteristics of stag hunters when they solve addition problems. They are characterized as friendly and cooperative. They may consult other team members when choosing which game setting the group may want to play and agree to such recommendations. This explains why they tend to exhibit both gaming behaviors.
7. RQ3: What Is the Usage Behavior of Students in Terms of the Level of Difficulty and Types of a Problem Solved?
States are defined as different game modes. A state transition is the shifting of game mode to another game mode per game session. The transition labels are in the form of a conditional probability/z-score. A z-score of at least 1.96 is considered significant [
57]. Arrows in darker lines show significant transitions. Students are given all equal chances to choose game settings.
There is a high probability (95%) that stag hunters will choose problems with a medium level of difficulty (
Figure 3). They are more likely to switch from easy to medium and vice versa. This means that they will choose a step lower or a step higher level of difficulty. Stag hunters are more likely to choose only the first-three levels of difficulty (very easy, easy, and medium levels). This is because they are more interested in increasing their game scores.
Hare hunters have a high tendency (83%) to solve very easy problems (
Figure 4). Unlike the stag hunters, the hare hunters will switch from very easy to medium problems (and vice versa), which are two steps lower (or higher) in level of difficulty. Even though there are insignificant transitions, the result shown in
Figure 4 suggests that hare hunters will attempt to answer problems of varying difficulties. Although there is a small possibility (6%), hare hunters will shift from medium to hard problems. It is an indication that hare hunters try to advance their problem-solving skills. Hare hunters are more explorative and cautious problem solvers. For hare hunters, the primary motivation in the game is learning the content, not the possible prize they could win.
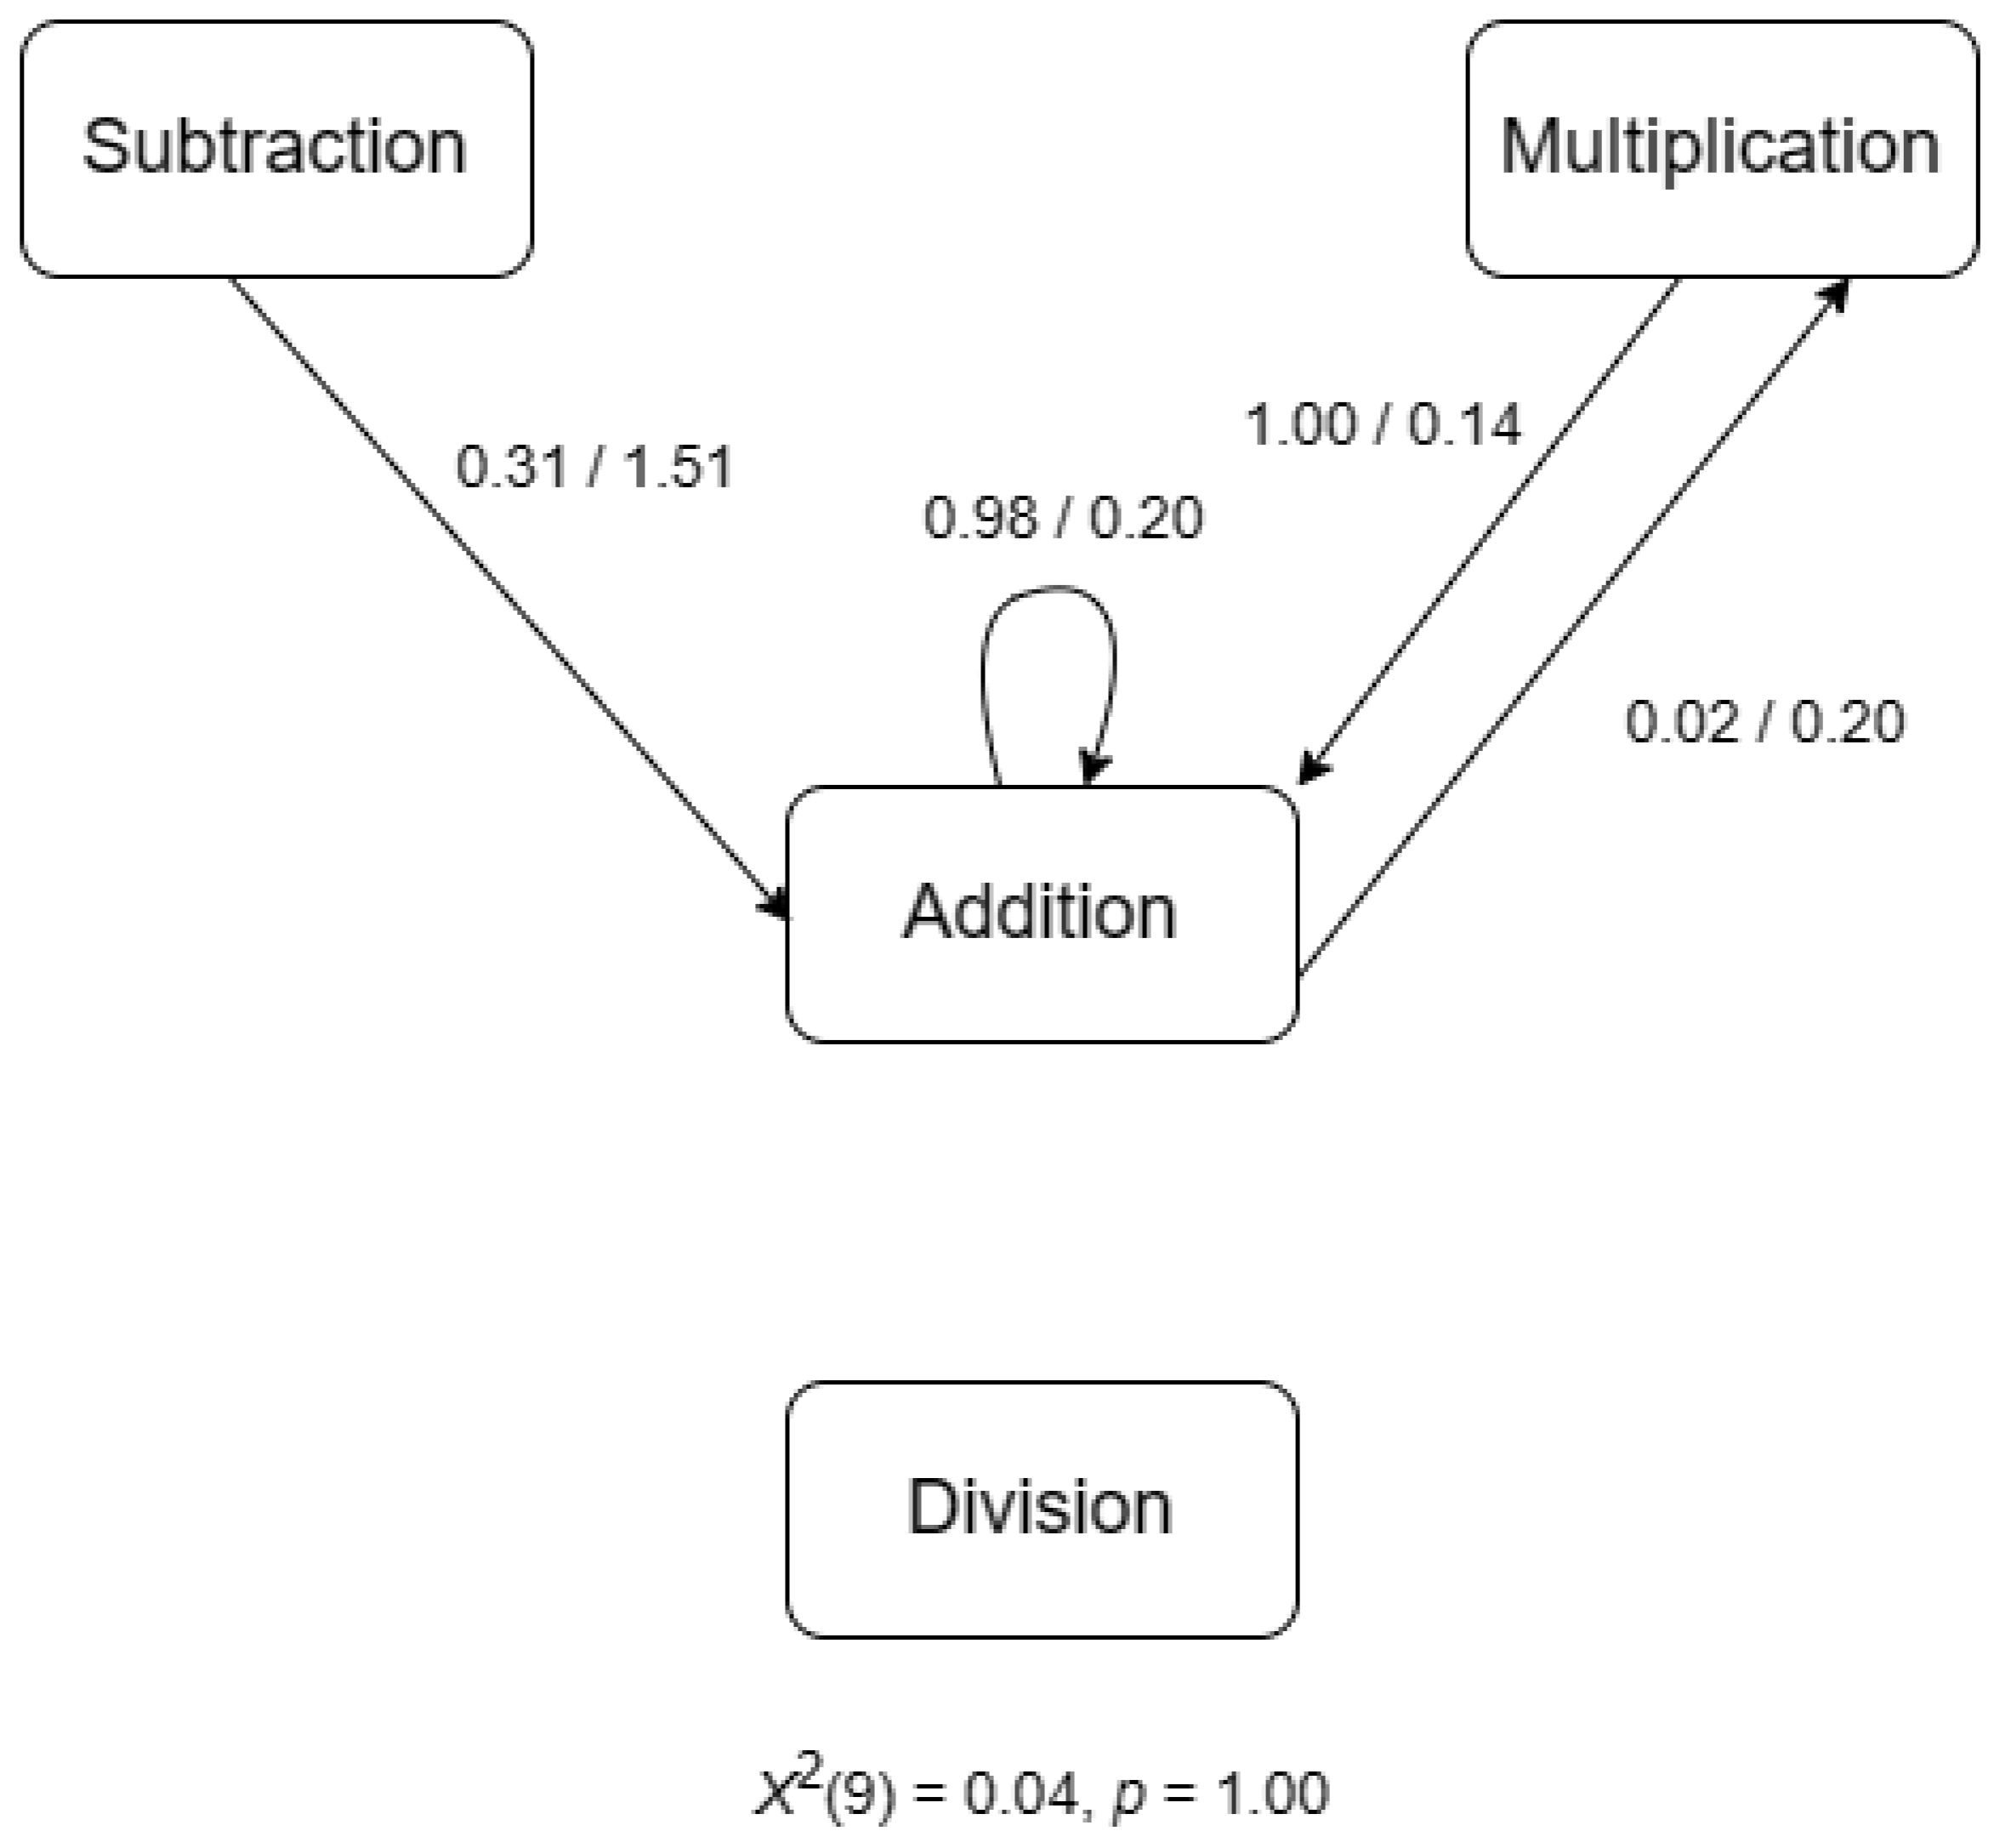
There are no significant transitions in terms of the types of problems solved by stag hunters (
Figure 5). This discovery is attributed to uneven frequency distributions of state transitions in terms of problem types solved. Nevertheless, the state transition diagram in
Figure 6 shows that the hare hunters are more likely to shift to and from addition and multiplication. Furthermore,
Figure 5 shows that, 98% of the time, addition problems will be selected in the next game setting. Stag hunters will avoid changing the operations to division.
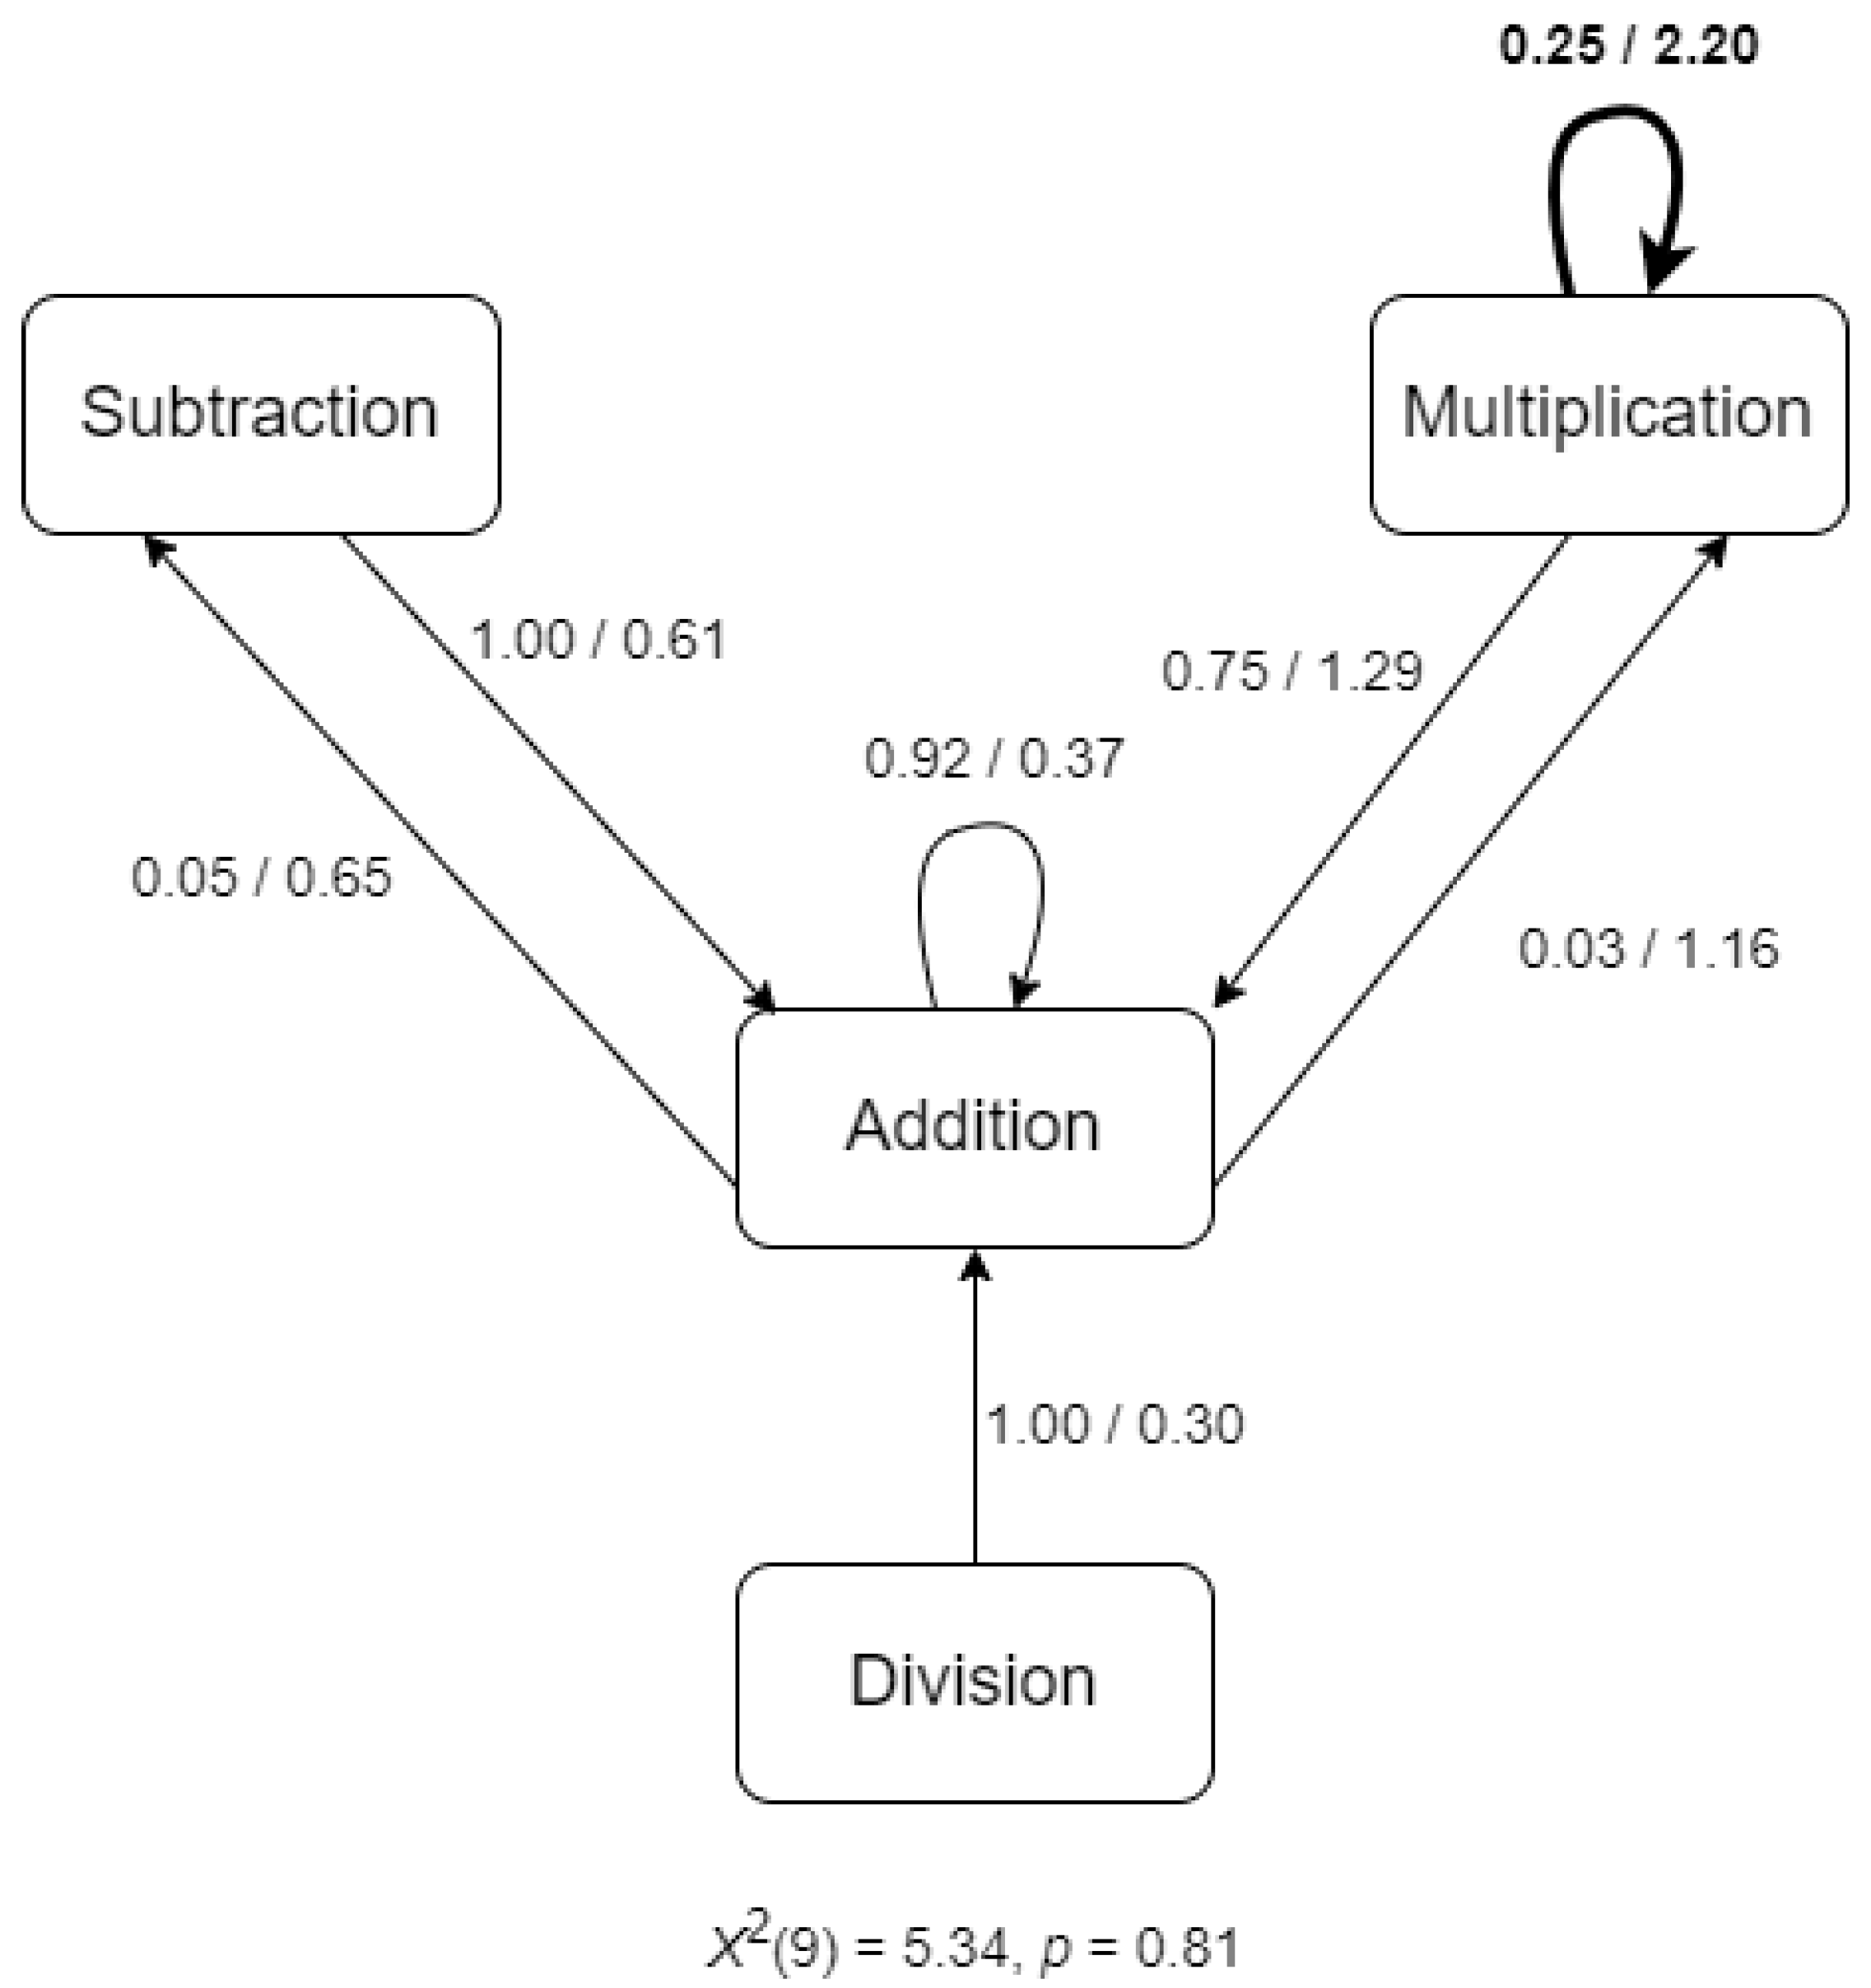
Meanwhile, there is a 25% chance to choose a multiplication type of problem (
Figure 6). All other transitions are not significant. Nonetheless, hare hunters are open to solving diverse types of problems (
Figure 6). It is worth noting that hare hunters attempted to answer subtraction and division problems. If they find it difficult, they switch back to answering problems in addition.
Overall, the types of problems solved, and the level of difficulty have between four and five options. There are 20 (4 × 5) possible combinations of states (or game settings) that a student may choose. There are 400 (20 × 20 states) transitional probabilities. Students chose 10 out of the 20 possible game modes. Out of the 400 possible transitional probabilities, addition with varying difficulty levels is the most preferred setting. Among these settings, addition with very easy difficulty level is the most preferred. When the students chose to switch from easy division problems to addition with a hard difficulty level, they chose addition with a hard difficulty level. Also, it is most probable that students will choose their current game modes again for the next game session (EA_ADD → EA_ADD = 53%; VE_ADD → VE_ADD = 78%; MD_ADD → MD_ADD = 76%).
8. Discussion
The purpose of this study was to describe students’ stag and hare hunting behaviors in a mobile-based CSCL. According to the findings of this study, stag and hare hunters prefer easy problems. They prefer the addition of fractions because it is the easiest type of problem that can be solved in a time-constrained game. Statistical analysis shows that the interaction data in terms of the number of problems solved are also similar, which suggests that both sets of participants are engaged in the experiment.
The study found empirical evidence for the distinct traits of stag and hare hunters in choosing game modes and game interaction. Hare hunters would attempt to solve different types of arithmetic problems solved with varying degrees of difficulty. This game behavior may not be beneficial for the game since it would entail lower game scores. On the other hand, stag hunters stick to solving addition problems in a fast or very fast mode. Consistent with the definition of Skyrms [
20,
21], stag hunters are more inclined to choose game settings with higher payoffs but higher risk. The findings of this study indicate that the game interactions of stag hunters are higher than those of hare hunters. While these results seem to be desirable since higher interactions with CSCL are positively related to academic performance [
23,
25,
26,
27], the results of this current study suggest otherwise.
The correlation coefficients reveal that the game interactions of the stag hunters are negatively related to learning gain. In the context of this study, the high number of interactions with the mobile-based CSCL does not positively contribute to students’ learning since it is an indication that the stag hunters passively select answers. This would result in a superficial indication that students get a higher number of correct answers in a short time. On the other hand, hare hunters are cautious before they choose an answer. This process is slower, which leads to more time spent but with a lower number of attempts and accuracy rate. Nevertheless, this “slow but sure” attitude can lead to a 7% increase in their mathematics scores. The finding of the study that higher interactions or engagements in a computerized learning environment can lead to higher academic performance contradicts the findings of Siqin et al. [
25] and Tirado-Morueta et al. [
26]. This disagreement could be attributed to the context of the current study. The current study was carried out in a setting where students compete for higher points, and the results of the tests had no bearing on their grades in their subject. As a result, the engagements measured in this study may only reflect the students’ desire to win the game.
The stag and hunting behaviors of the students are primarily attributed to personality dimensions. This current study provides empirical evidence that personalities do influence the interaction with the learning systems [
7]. It also contributes to the existing literature by showing that stag and hare hunting behaviors exist in mobile-based CSCL, which consequently extends the current classifications of learners in this learning environment. Mathematics teachers benefit from this result as it suggests that personality dimensions and prior mathematics achievement can be considered when forming groups in collaborative mathematics learning activities.
Students who exhibited high Open personality trait are more likely to engage a stag behavior. This finding confirms the findings of the studies of Sánchez Hórreo and Carro [
36] and Baer et al. [
37] that the characteristics of people in this personality dimension (i.e., open to experience) contribute to the welfare of the group (i.e., higher engagement). However, this characteristic does not contribute to learning performance. Students with this characteristic are more focused on experiencing the creative and fun aspects of the game ([
34] cited in [
35]). In other words, they are distracted by the creative components of the game and may not focus on the true goal of the mobile CSCL.
Students who exhibit high Conscientiousness, Agreeableness, Extraversion, and Neuroticism personality traits are classified as hare hunters while students who show high Conscientiousness personality traits are motivated to learn from the activity [
32,
38,
41]. This characteristic is shared by a student who belongs to the Agreeableness personality dimension. According to different studies [
35,
44], a person in this personality dimension is expected to be cooperative. Hence, students in this personality dimension are expected to perform in accordance with the team’s goal. Meanwhile, students in the Extraversion personality exude positive behaviors (e.g., emotionally positive, energetic, confident, etc.) that could contribute to the welfare of the team [
35,
44]. These traits may influence other members of the team to achieve the goal of the game. In summary, previous studies showed [
40,
41] that people with enhanced personality traits of Conscientiousness, Agreeableness, and Extraversion are mostly task and group performers—traits that are desirable in a team member [
38]. Therefore, hare hunters have the sought-after characteristics of a team member.
Students who show personality traits of high Neuroticism are also hare hunters. People in this taxon are known for being moody, easily getting upset, tense, and worrisome, all of which harm group dynamics [
35] and affectivity [
45]. However, the result of this study contradicts the image of people in this taxon reported in the existing literature. Although the characteristics of people showing high Neuroticism personality traits have negative connotations, these characteristics turn out to be helpful traits in this study. For example, students tend to regulate these traits by lowering their expectations. They do this by selecting a game mode with a slower pace and fewer penalties. Consequently, their game interactions with the mCSCL are substantial enough to be categorized as hare hunters. The disagreement of this finding with prior research can be attributed to the fact that students are driven by a common learning goal. Future researchers may further investigate the goal-setting behaviors of students who fall in the Neuroticism personality dimension and how these behaviors influence gameplay.
It can be observed from the decision tree model that three out of the five hypothesized game interaction variables are significant features to detect stag and hare hunting behaviors. This study provides further evidence from the study of Piki [
29] that behavior engagement in a CSCL could serve as a basis for classifying CSCL learners. Therefore, stag and hare hunters could be distinguished in terms of their personality dimensions, types of problems they solve, level of difficulty they choose, and time they spend solving problems.
Lag sequential analyses further describe the engagement of stag and hare hunters in terms of the sequence of types of problems solved and the level of problem difficulty. The findings of this study extend the current literature in two ways. First, this current study shows that mathematics learners in an mCSCL can be characterized through decision tree and lag sequential analysis. This extends the learners’ classification of previous studies [
22,
23,
24,
25,
26,
27,
46,
47]. Second, it was shown that mathematics mCSCL can be classified through their gaming behaviors based on the concept proposed by Skyrms [
20,
21]. Particularly, stag and hare hunters have distinct patterns of problem-solving behaviors. Stag hunters are complacent when solving easy or medium-level problems, while hare hunters are the exact opposite of stag hunters.
Meanwhile, hare hunters explore all difficulty levels even though the game scores do not depend on the level of problem difficulty. The transition labels in
Figure 4 show that the transitions from Very Easy → Medium → Difficult are significant, indicating that hare hunters attempt to progress their level of mathematics skills. These distinct problem-solving behaviors could further explain why the hare hunters managed to increase their mathematics scores. The overall LSA suggests that all students are more focused on solving addition problems with varying degrees of difficulty. These findings provide important key points in the development of mCSCL.
9. Conclusions, Recommendations, and Implications
This study attempted to determine whether the stag and hare behaviors are beneficial to mathematics achievement, whether the learners’ game interaction and personality dimensions describe these behaviors, and whether the problem-solving behavior of students exhibits a significant pattern. The study provided empirical evidence to conclude that (a) hare hunting behavior is beneficial to mathematics achievement, (b) learners’ game interaction in terms of difficulty level, time spent, type of problem solved, and personality dimensions do describe gaming behaviors, and (c) students exhibit a significant pattern of problem-solving behaviors. Therefore, all hypotheses in this study are partially supported.
Stag and hare hunters could be distinguished in terms of their personality dimensions, the types of problems they solve, the level of difficulty they choose, the time they spend solving problems, and their problem-solving patterns. More specifically, stag hunters are most likely to belong to the Openness personality dimension that describes them as imaginative, insightful, daring, and creative. They are also likely to solve problems more quickly than hare hunters, and to stick to the same levels and types of problems. Meanwhile, hare hunters may display four of the Big Five personality traits, which are Conscientiousness, Extraversion, Agreeableness, and Neuroticism. They tend to solve problems slower than the stag hunters and tend to attempt problems of varying degrees and types.
There are theoretical and practical implications derived from the findings. First, this study shows that students’ engagement in an mCSCL goes beyond being classified as social loafers or bystanders. Unlike social loafers, who have no intention to interact with other team members, students in this study reduced their participation because of associated risks (e.g., wrong answers entail deduction of time). The second theoretical implication relates to this finding. When students are given the freedom to choose the level of participation that they are comfortable with, they are expected to perform in that chosen environment. Their low game interactions do not necessarily mean that they are not engaged in the mCSCL; rather, it reflects being careful. The third theoretical implication is that this study discovered a new perspective about the group interaction of people with neurotic personalities. Further research is recommended to understand the academic goals of students displaying high level of Neuroticism personality trait and how this affects their interactions in an mCSCL.
The practical implications of the results of the study include the following: (1) detect the stag and hare hunting behaviors and make it adaptive to these gaming behaviors; (2) increase the points for types of problems and level of difficulty; (3) encourage game users to explore more problems; (4) include a more stringent penalty to avoid stag behaviors; and (5) provide post-game support to address the problem-solving weaknesses of the students.
Finally, future research could be conducted to determine the impact of these game design changes on game interaction and mathematics learning, and the results of this study could inform mathematics educators that, to achieve optimal mathematics learning in collaborative activities, gender, personality dimensions, and prior mathematics performance could serve as the basis for group composition.


