Article

Characterization of Antibiotic Resistance in Select Tertiary Hospitals in Uganda: An Evaluation of 2020 to 2023 Routine Surveillance Data

by
Jonathan Mayito
1,*,
Daniel Kibombo
1,
Charles Olaro
2,
Susan Nabadda
2,
Consolata Guma
2,
Immaculate Nabukenya
1,
Andrew Busuge
1,
Flavia Dhikusooka
1,
Alex Andema
3,
Peter Mukobi
3,
Nathan Onyachi
3,
Ben Watmon
3,
Stephen Obbo
3,
Alfred Yayi
3,
James Elima
3,
Celestine Barigye
3,
Filbert J. Nyeko
3,
Ibrahim Mugerwa
2,
Musa Sekamatte
2,
Joel Bazira
4,
Richard Walwema
1,
Mohammed Lamorde
1,
Francis Kakooza
1 and
Henry Kajumbula
5
add Show full author list remove Hide full author list
1
Infectious Diseases Institute, Makerere University College of Health Sciences, Kampala P.O. Box 22418, Uganda
2
Ministry of Health, Kampala P.O. Box 7272, Uganda
3
Regional Referral Hospital, Ministry of Health, Kampala P.O. Box 7272, Uganda
4
Department of Microbiology, Mbarara University of Science and Technology, Mbarara P.O. Box 1410, Uganda
5
Department of Microbiology, Makerere University College of Health Sciences, Kampala P.O. Box 7072, Uganda
*
Author to whom correspondence should be addressed.
Trop. Med. Infect. Dis. 2024, 9(4), 77; https://doi.org/10.3390/tropicalmed9040077
Submission received: 29 January 2024 / Revised: 2 March 2024 / Accepted: 5 March 2024 / Published: 5 April 2024
(This article belongs to the Special Issue Infectious Disease Prevention and Control: A One Health Approach)

Abstract

:
Antimicrobial resistance (AMR) is a public health concern in Uganda. We sought to conduct an extended profiling of AMR burden at selected Ugandan tertiary hospitals. We analyzed routine surveillance data collected between October 2020 and March 2023 from 10 tertiary hospitals. The analysis was stratified according to the hospital unit, age, gender, specimen type, and time. Up to 2754 isolates were recovered, primarily from pus: 1443 (52.4%); urine: 1035 (37.6%); and blood: 245 (8.9%). Most pathogens were Staphylococcus aureus, 1020 (37%), Escherichia coli, 808 (29.3%), and Klebsiella spp., 200 (7.3%). Only 28% of Escherichia coli and 42% of the other Enterobacterales were susceptible to ceftriaxone, while only 44% of Staphylococcus aureus were susceptible to methicillin (56% were MRSA). Enterococcus spp. susceptibility to vancomycin was 72%. The 5–24-year-old had 8% lower ampicillin susceptibility than the >65-year-old, while the 25–44-year-old had 8% lower ciprofloxacin susceptibility than the >65-year-old. The 0–4-year-old had 8% higher ciprofloxacin susceptibility. Only erythromycin susceptibility varied by sex, being higher in males. Escherichia coli ciprofloxacin susceptibility in blood (57%) was higher than in urine (39%) or pus (28%), as was ceftriaxone susceptibility in blood (44%) versus urine (34%) or pus (14%). Klebsiella spp. susceptibility to ciprofloxacin and meropenem decreased by 55% and 47%, respectively, during the evaluation period. During the same period, Escherichia coli ciprofloxacin susceptibility decreased by 40%, while Staphylococcus aureus gentamicin susceptibility decreased by 37%. Resistance was high across the Access and Watch antibiotic categories, varying with time, age, sex, specimen type, and hospital unit. Effective antimicrobial stewardship targeted at the critical AMR drivers is urgently needed.

1. Background

Antimicrobial resistance (AMR) is projected to cause 10 million deaths annually by 2050, ranking it among the leading causes of death and a global health threat [1]. A review of the AMR global burden in 2019 revealed a concerning rise in AMR, with an estimated 1.27 million deaths directly linked to it [2]. This was higher than the mortality due to the Human Immunodeficiency Virus (HIV) or malaria [3], which were the previously leading infectious killers [2]. The AMR burden fell disproportionately on sub-Saharan Africa and Asia, with Western sub-Saharan Africa experiencing the highest all-age AMR-attributable death rate at 27.3 per 100,000. [2]. This coincides with the poor preparedness of the AMR surveillance systems and the paucity of AMR data in these regions [3].
Before 2018, Uganda’s AMR data were from isolated studies, which pointed to an emerging AMR epidemic but were short of a country-wide profile of the burden. For instance, methicillin-resistant Staphylococcus aureus (MRSA) was highly prevalent (overall, 46%) among patients (52%), healthcare workers (36%), and the clinical environment (33%) of the burns unit of Mulago National Referral Hospital (NRH) [4]. Further, multidrug-resistant (MDR) Gram-negative rods, including Enterobacterales and Acinetobacter spp., were responsible for a large proportion (80%) of puerperal sepsis among postpartum mothers attending a tertiary hospital [5]. Among the Enterobacterales isolated, 82% were extended-spectrum β-lactamase (ESBL) producers, 77% were resistant to ciprofloxacin, and 46% of the Staphylococcus aureus isolates were MRSA [5].
As Uganda initiated its national AMR surveillance systems in line with the Global Antimicrobial Surveillance System (GLASS), a situational analysis revealed high levels of MDR due to MRSA (2–90%), ESBL (10–75%), and carbapenem-resistant Enterobacterales (CRE, 4–30%), as well as high resistance (>50%) to common antibiotics including penicillin, tetracycline, and cotrimoxazole [6]. Uganda has since made significant progress in setting up its national AMR surveillance system, guided by a National AMR Surveillance Plan (NAP) based on the GLASS manual [7]. Some of the initial surveillance data show that common pathogens including Enterobacterales and non-fermenting Gram-negative bacilli are resistant to third-generation cephalosporins, and there is emerging resistance to carbapenems [7]. For instance, Escherichia coli resistance to ceftriaxone, imipenem, and ciprofloxacin was 52.7%, 18.8%, and 52% respectively, while Klebsiella pneumoniae resistance to the same antibiotics was 79.7%, 1.6%, and 53.8% respectively [7,8]. This wide perspective of the country’s AMR burden has been enabled by coordinated surveillance guided by the NAP, national governance structures, surveillance documents, and an expanded microbiology laboratories network [7].
Although the current national AMR surveillance data have informed the early AMR surveillance and AMR control efforts, a more comprehensive and well-structured profiling of the AMR burden to tailor the response efforts to the different levels of the health care system is still lacking. This evaluation therefore sought to conduct an extended profiling of the AMR burden and its variation with critical determinants including age, gender, sample types, and healthcare units at selected tertiary hospitals to fill the above gap. This information will be critical in informing and evaluating infection prevention and antimicrobial stewardship interventions aimed at preventing, slowing, and reversing the ascendance of the AMR epidemic in the country. It will also give insights into the performance of the AMR surveillance program and critical areas that need improvement.

2. Methodology

This was an analysis of the routine laboratory-based surveillance data collected between October 2020 and March 2023 from 10 tertiary hospitals, including nine regional (sub-national) referral hospitals and one national referral hospital in Uganda (Figure 1).
The country has a tiered healthcare system whose base is formed by health centers at the community level, followed by general hospitals, regional referral hospitals (RRH), and national referral hospitals. Regional referral hospitals are the first level, with specialists in the major fields of surgery, internal medicine, obstetrics and gynecology, and pediatrics. The national referral hospitals offer super-specialized healthcare with multiple specialists in different fields. Microbiology laboratory capacity has been gradually developed in the facilities over the past five years. At the time of data collection, all laboratories in the surveillance network were receiving continuous mentors in quality management systems using the strengthening laboratory management towards accreditation (SLMTA) and stepwise laboratory quality improvement process towards accreditation (SLIPTA) approaches. All the labs had applied for SANAS assessment for accreditation (Star 3–5).
Qualified clinical and laboratory teams are deployed to collect and analyze the samples, and these undergo continuous in-service training and mentorship in diagnostic stewardship, AMR surveillance guidelines and protocols, bacteriology techniques, and laboratory quality management systems. Standard laboratory procedures are followed during sample processing. In-house reconstituted culture media are used for primary isolation, including 5% sheep blood agar, MacConkey, and chocolate agar. Bacterial identification was carried out using biochemical methods, including colonial appearance and Gram stain reactions. Culture media is quality controlled for sterility and ability to support growth using recommended American Type Culture Collection (ATCC) reference bacterial strains. Mueller Hinton agar (MHA) media performance and potency of antibiotic discs were assessed using Escherichia coli ATCC 25922, Staphylococcus aureus ATCC 25923, and Pseudomonas aeruginosa ATCC 27853 [9]. Antimicrobial susceptibility testing (AST) was performed using the Kirby-Bauer disc diffusion method according to the updated CLSI M100, 30th, 31st, 32nd, and 33rd editions [10,11,12].
Specimens were collected from patients with various community- or hospital-acquired infections. The analysis included both GLASS priority (urine, blood, stool, urogenital, and cerebrospinal fluid (CSF)) and non-GLASS specimens, including pus and tracheal aspirates. Patient demographic and clinical details were collected using the standardized national microbiology laboratory requisition form, which accompanies all specimens to the laboratory. For purposes of this evaluation, we categorized the hospital units as “General units/wards”, referring to those that provide care to relatively clinically stable patients such as outpatient, medical, surgical, and pediatric, among other wards, and “specialized units/wards”, referring to units that provide care to critically ill patients, including high dependence, intensive care, and dialysis units.

2.1. Sample Size

The total number of patients sampled across the surveillance sites during the evaluation period was 14,484, which constituted the sample size for the evaluation. Results from blood, CSF, urine, pus, and tracheal aspirate specimens cultured during the study period were included in the analysis.

2.2. Statistical Analysis

Unique patient identification numbers and results were entered into the WHONET 5.6, AMR data management software [13].
For summary statistics, continuous variables were reported as means with standard deviation (SD) for normally distributed data or median and interquartile range (IQR) for non-normally distributed data. Categorical variables were reported as proportions in terms of frequencies and percentages. To derive the percentage of susceptible isolates for each pathogen-antibiotic pair, the number of susceptible isolates was divided by the total number of isolates tested against each antibiotic and multiplied by 100. Susceptibility was stratified by age, sex, specimen type, and hospital unit. Associations between susceptibility and these variables were established using the Chi Square test. The resulting percentages were reported with respective 95% confidence intervals (CI) and p-values. The three-month changes in the trends of susceptibility over the evaluation period were determined using linear regression analysis. Data analysis was performed in StataSE 15, R 4.2.2 software, and Microsoft Excel version 2020. At all levels of comparison, the level of significance was a paired p-value < 0.05.

2.3. Ethical Statement

The data used in the evaluation are part of the national AMR surveillance data extracted from the electronic laboratory records system as mandated by the Ministry of Health. The evaluation used de-identified aggregate data. There was no interaction with the patients.

3. Results

Table 1 summarizes the demographic characteristics. A total of 95,371 patients presented to the surveillance sites with suspected infections during the evaluation period. Of the 95,371 patients, 14,484 (15%) underwent microbiological testing, of which most, 8002 (55.74%), were female. Of the specimens analyzed, the majority (3279) were urine, followed by blood (3245) and pus (2774). A total of 2754 isolates were recovered, including 1443 (52.4%) from pus, 1035 (37.6%) from urine, 245 (8.9%) from blood, and the rest from CSF, stool, urogenital, tracheal aspirates, and sputum.
Supplementary Table S1 shows the isolate recovery from the different sample types. Overall, Staphylococcus aureus was the most common pathogen, contributing 1020 (37%) isolates, followed by Escherichia coli, 808 (29.3%) and Klebsiella spp., 200 (7.3%). Of the 245 blood isolates, 121 (49.4%) were Staphylococcus aureus, 91 (37.1%) were Enterobacterales (Klebsiella spp., Escherichia coli, and Enterobacter spp.), 17 (6.9%) were Enterococcus spp., 7 (2.9%) were Salmonella spp., 5 (2.04%) were Acinetobacter spp., 3 (1.22%) were Pseudomonas spp. and 1 (0.4%) was Streptococcus pneumoniae.
Escherichia coli, 443 (42.8%), was the most common urine isolate, followed by Staphylococcus aureus, 299 (28.9%), Klebsiella spp., 115 (11.1%), Enterococcus spp., 64 (6.2%), Citrobacter spp., 52 (5.0%), Enterobacter spp., 29 (2.8%), Pseudomonas spp. (20, 1.93%), and Acinetobacter spp., 5 (0.8%).
The most common pus isolates were Enterobacterales, 697 (48.3%), majorly Escherichia coli, 325 (47%), then Klebsiella spp., 200 (29%), and Citrobacter spp., 120 (17%). Among the Gram-positive pathogens, Staphylococcus aureus, were 600 (41.5%), while the Enterococcus spp. were 20 (1.9%). The non-fermenting Gram-negative isolates included Pseudomonas spp. 69 (6.7%) and Acinetobacter spp. 57 (5.5%)). Overall, most of the isolates, 2572 (92%), were ESKAPE-E pathogens. However, from the available information, we could not distinguish between community-acquired infections (CAI) and HAI.

3.1. Susceptibility of Isolates in General and Specialized Units

Susceptibility data are summarized in Table 2 (for general units) and Supplementary Table S2 (for specialized units). For Gram-negatives, data for ampicillin were only available for Escherichia coli, showing a remarkably low susceptibility of 4% for isolates from specialized clinics and 8% for general clinics. Escherichia coli susceptibility to the combination amoxycillin/clavulanic acid was much lower for specialized clinics (20%) compared to general clinics (56%).
Ceftriaxone, the only third-generation cephalosporin analyzed, also had very low susceptibility, ranging from 28% for Escherichia coli to 42% for ‘other Enterobacterales’ in general clinics, but did not remarkably differ from that observed in the specialized clinics. At 19%, meropenem susceptibility was remarkably low for Acinetobacter spp. isolates from specialized clinics. Notably, reduced susceptibility to meropenem was also observed for Klebsiella spp. isolates from the specialized clinics (70%).
Gentamicin, the only aminoglycoside analyzed, had susceptibilities just below 60% for Escherichia coli and Klebsiella spp. but higher at 71% and 65% for other Enterobacterales and Pseudomonas spp., respectively. Susceptibility to ciprofloxacin, representing the second-generation quinolones, showed low or modest susceptibilities ranging from 36% for Escherichia. coli to 60% for Pseudomonas spp.
Among Staphylococcus aureus, only 44% were methicillin-susceptible, indicating a remarkable 56% MRSA prevalence. Susceptibility to erythromycin was also very low, at 34%. There were no data available for vancomycin. Among the enterococci, 66% were susceptible to ampicillin and 72% to vancomycin.

3.2. Antibiotic Susceptibility Variation by Hospital Units

Table 3 presents the distribution of bacterial susceptibility across various hospital units. There were significant variations in susceptibility to all tested antibiotics (p = 0.000–0.025) across the different hospital units, except for ciprofloxacin (p = 0.888), chloramphenicol (p = 0.109), meropenem (p = 0.136), and vancomycin (p = 0.64). The hospital units included the emergence department, gynecology ward, HIV clinic, maternity, outpatients’ department, pediatric ward, and surgical ward. Notably, the susceptibility observed in the HIV clinic was higher than that in other units. However, the number of isolates from the HIV clinic was few (<30).

3.3. Antibiotic Susceptibility Variation by Age Group

Table 4 presents the distribution of bacterial susceptibility across different age groups, revealing significant variations in susceptibility patterns for various antibiotics across different age cohorts. Among individuals aged 5–24 years, the susceptibility to ampicillin resistance was 8% lower [OR = 0.54, CI = 0.33–0.88, p = 0.013] compared to those aged >65 years. Moreover, across all age groups, ampicillin susceptibility remained consistently low, below 20% for most age groups. In the 25–44 age group, there was an 8% lower susceptibility to ciprofloxacin [OR = 1.4, CI = 1.072–1.835, p = 0.014] compared to the >65 age group. Additionally, the 0–4 age group exhibited an 8% higher ciprofloxacin susceptibility [OR = 0.73, CI = 0.532–0.993, p = 0.045] compared to the >65 age group. Overall, the susceptibility to ciprofloxacin was below 60%.
The age groups of 25–44 and 45–64 demonstrated an 11% [OR = 1.66, CI = 1.155–2.377, p = 0.006] and 10% [OR = 1.54, CI = 1.042–2.274, p = 0.030] lower chloramphenicol susceptibility, respectively, in comparison to the >65 age group. In contrast, there was remarkably higher methicillin susceptibility among Staphylococcus aureus isolates from the 25–44 age group (77% vs. 20%) [OR = 0.23, CI = 0.061–0.885, p = 0.032] compared to the >65 age group, indicating lower MRSA in the 25–44 age group. Susceptibility to third-generation cephalosporins, amoxicillin clavulanic acid, and carbapenems did not vary significantly across age groups.

3.4. Antibiotic Susceptibility Variation by Sex

Supplementary Table S3 displays the distribution of antimicrobial susceptibility by sex, revealing significantly higher susceptibility to erythromycin among males compared to females [OR = 0.75, CI = 0.595–0.941, p = 0.013]. Susceptibility to other antibiotics did not vary by sex.

3.5. Antibiotic Susceptibility Variation by Sample Type

Table 5 compares the susceptibility profiles of isolates from various specimen types. For Escherichia coli, differences were noted for ciprofloxacin, chloramphenicol, and ceftriaxone. Ciprofloxacin susceptibilities were higher in blood (57%) compared to urine (39%) or pus (28%), p-value of 0.005. Similarly, higher susceptibility was observed for ceftriaxone for isolates from blood (44%) compared to urine (34%) or pus (14%), p = 0.002. For chloramphenicol, on the other hand, susceptibilities were highest for pus (75%) and urine (72%) and lowest for blood (33%). For Klebsiella spp., blood isolates demonstrated lower susceptibilities for chloramphenicol than those for urine or pus (41% vs. 77% vs. 39%, respectively, p = 0.008). This was also the case for ceftriaxone, with susceptibilities of 19% for blood, 56% for urine, and 28% for pus (p = 0.006). In that case of gentamicin, susceptibilities were lower for blood (39%) and pus (42%) than urine (60%), p = 0.049.

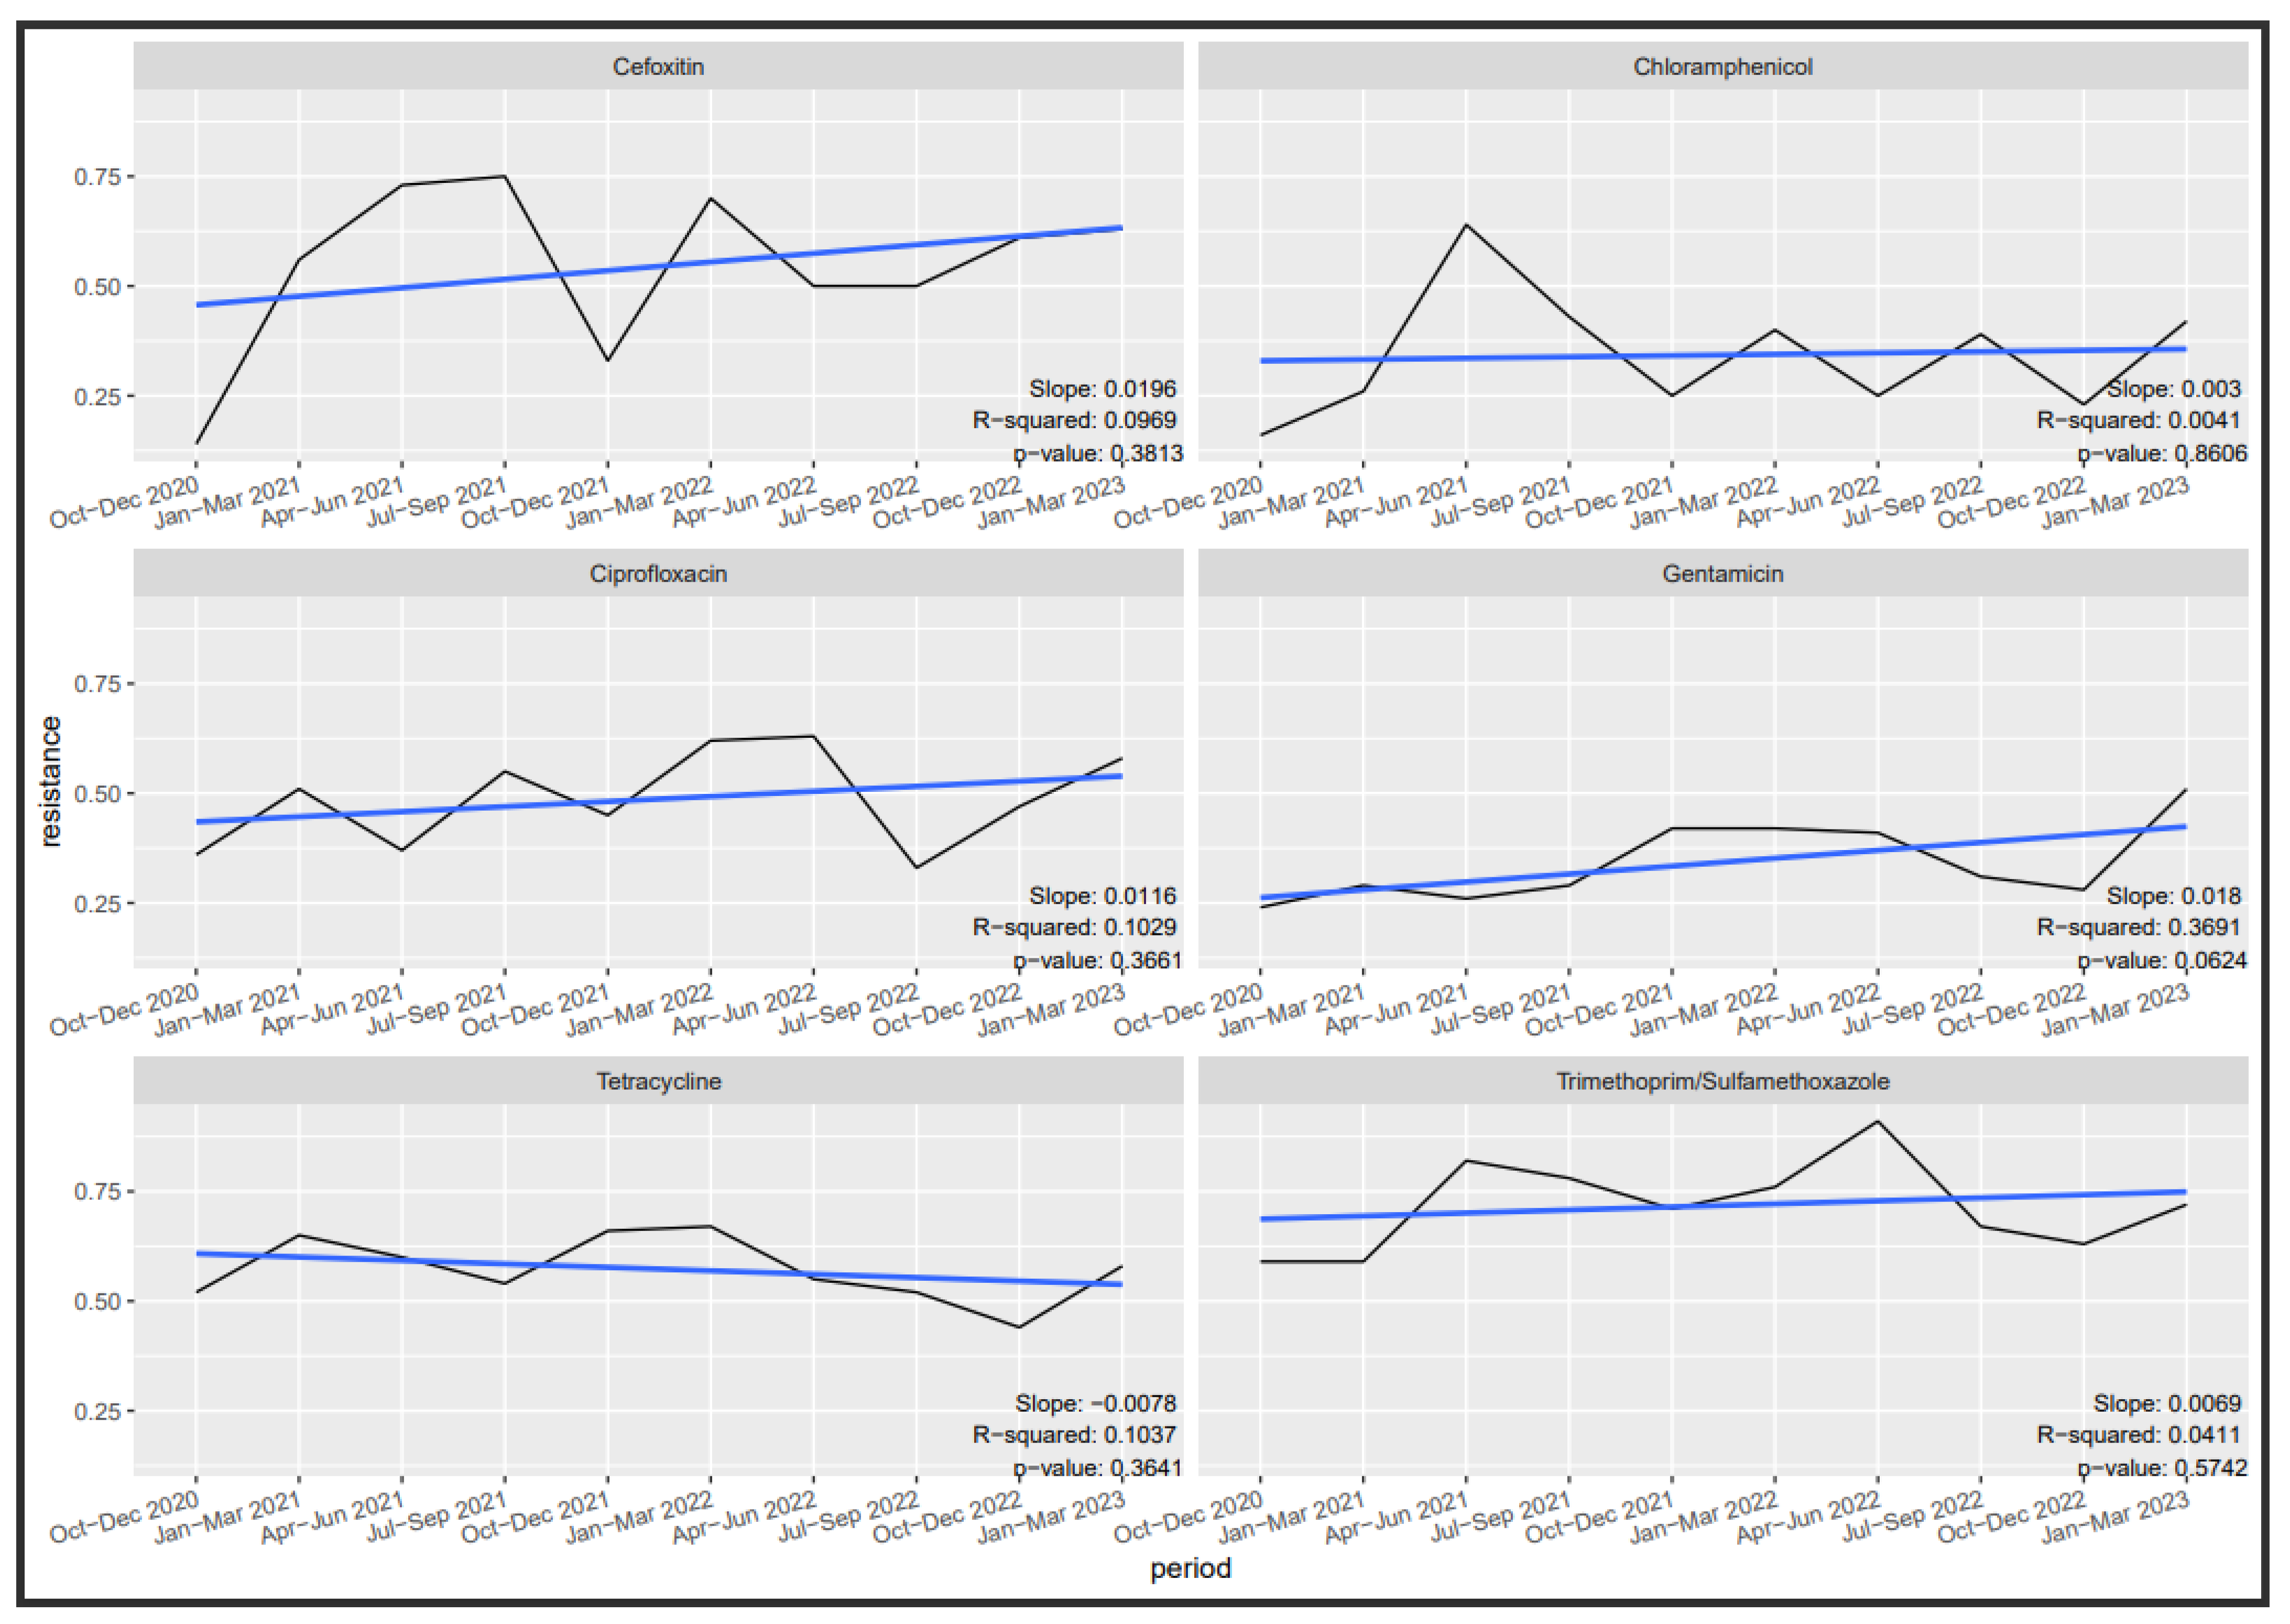
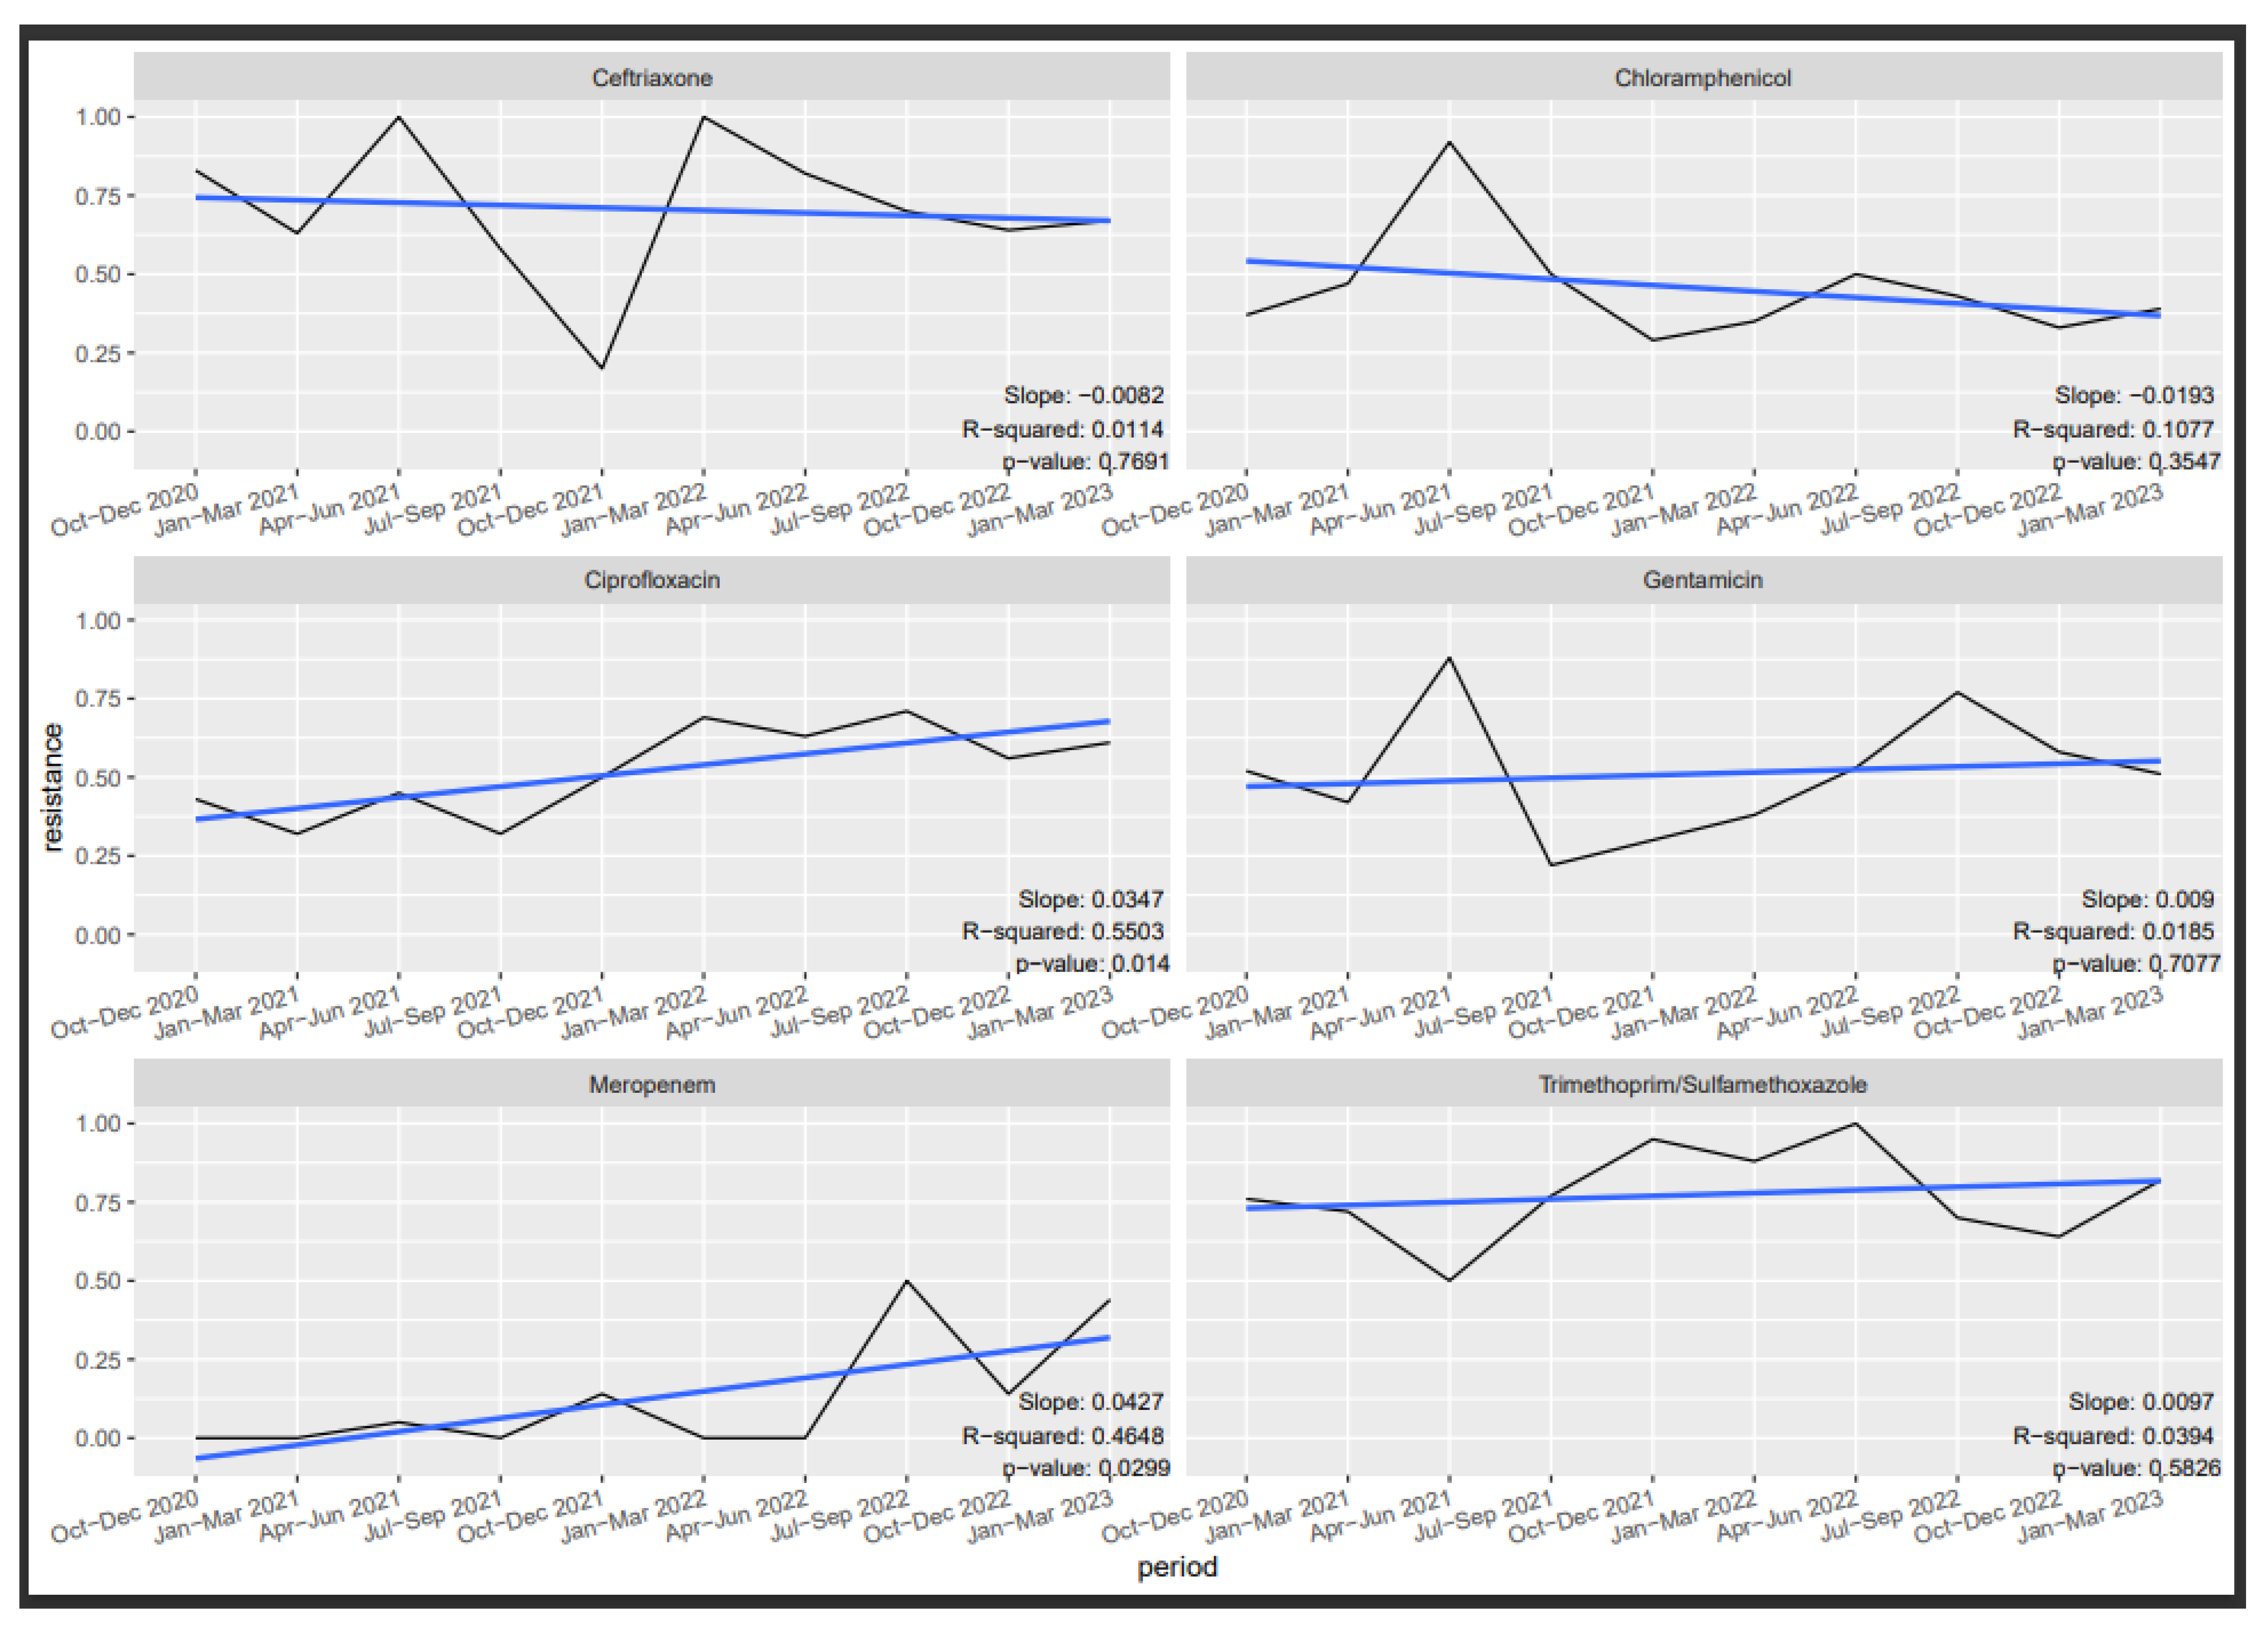
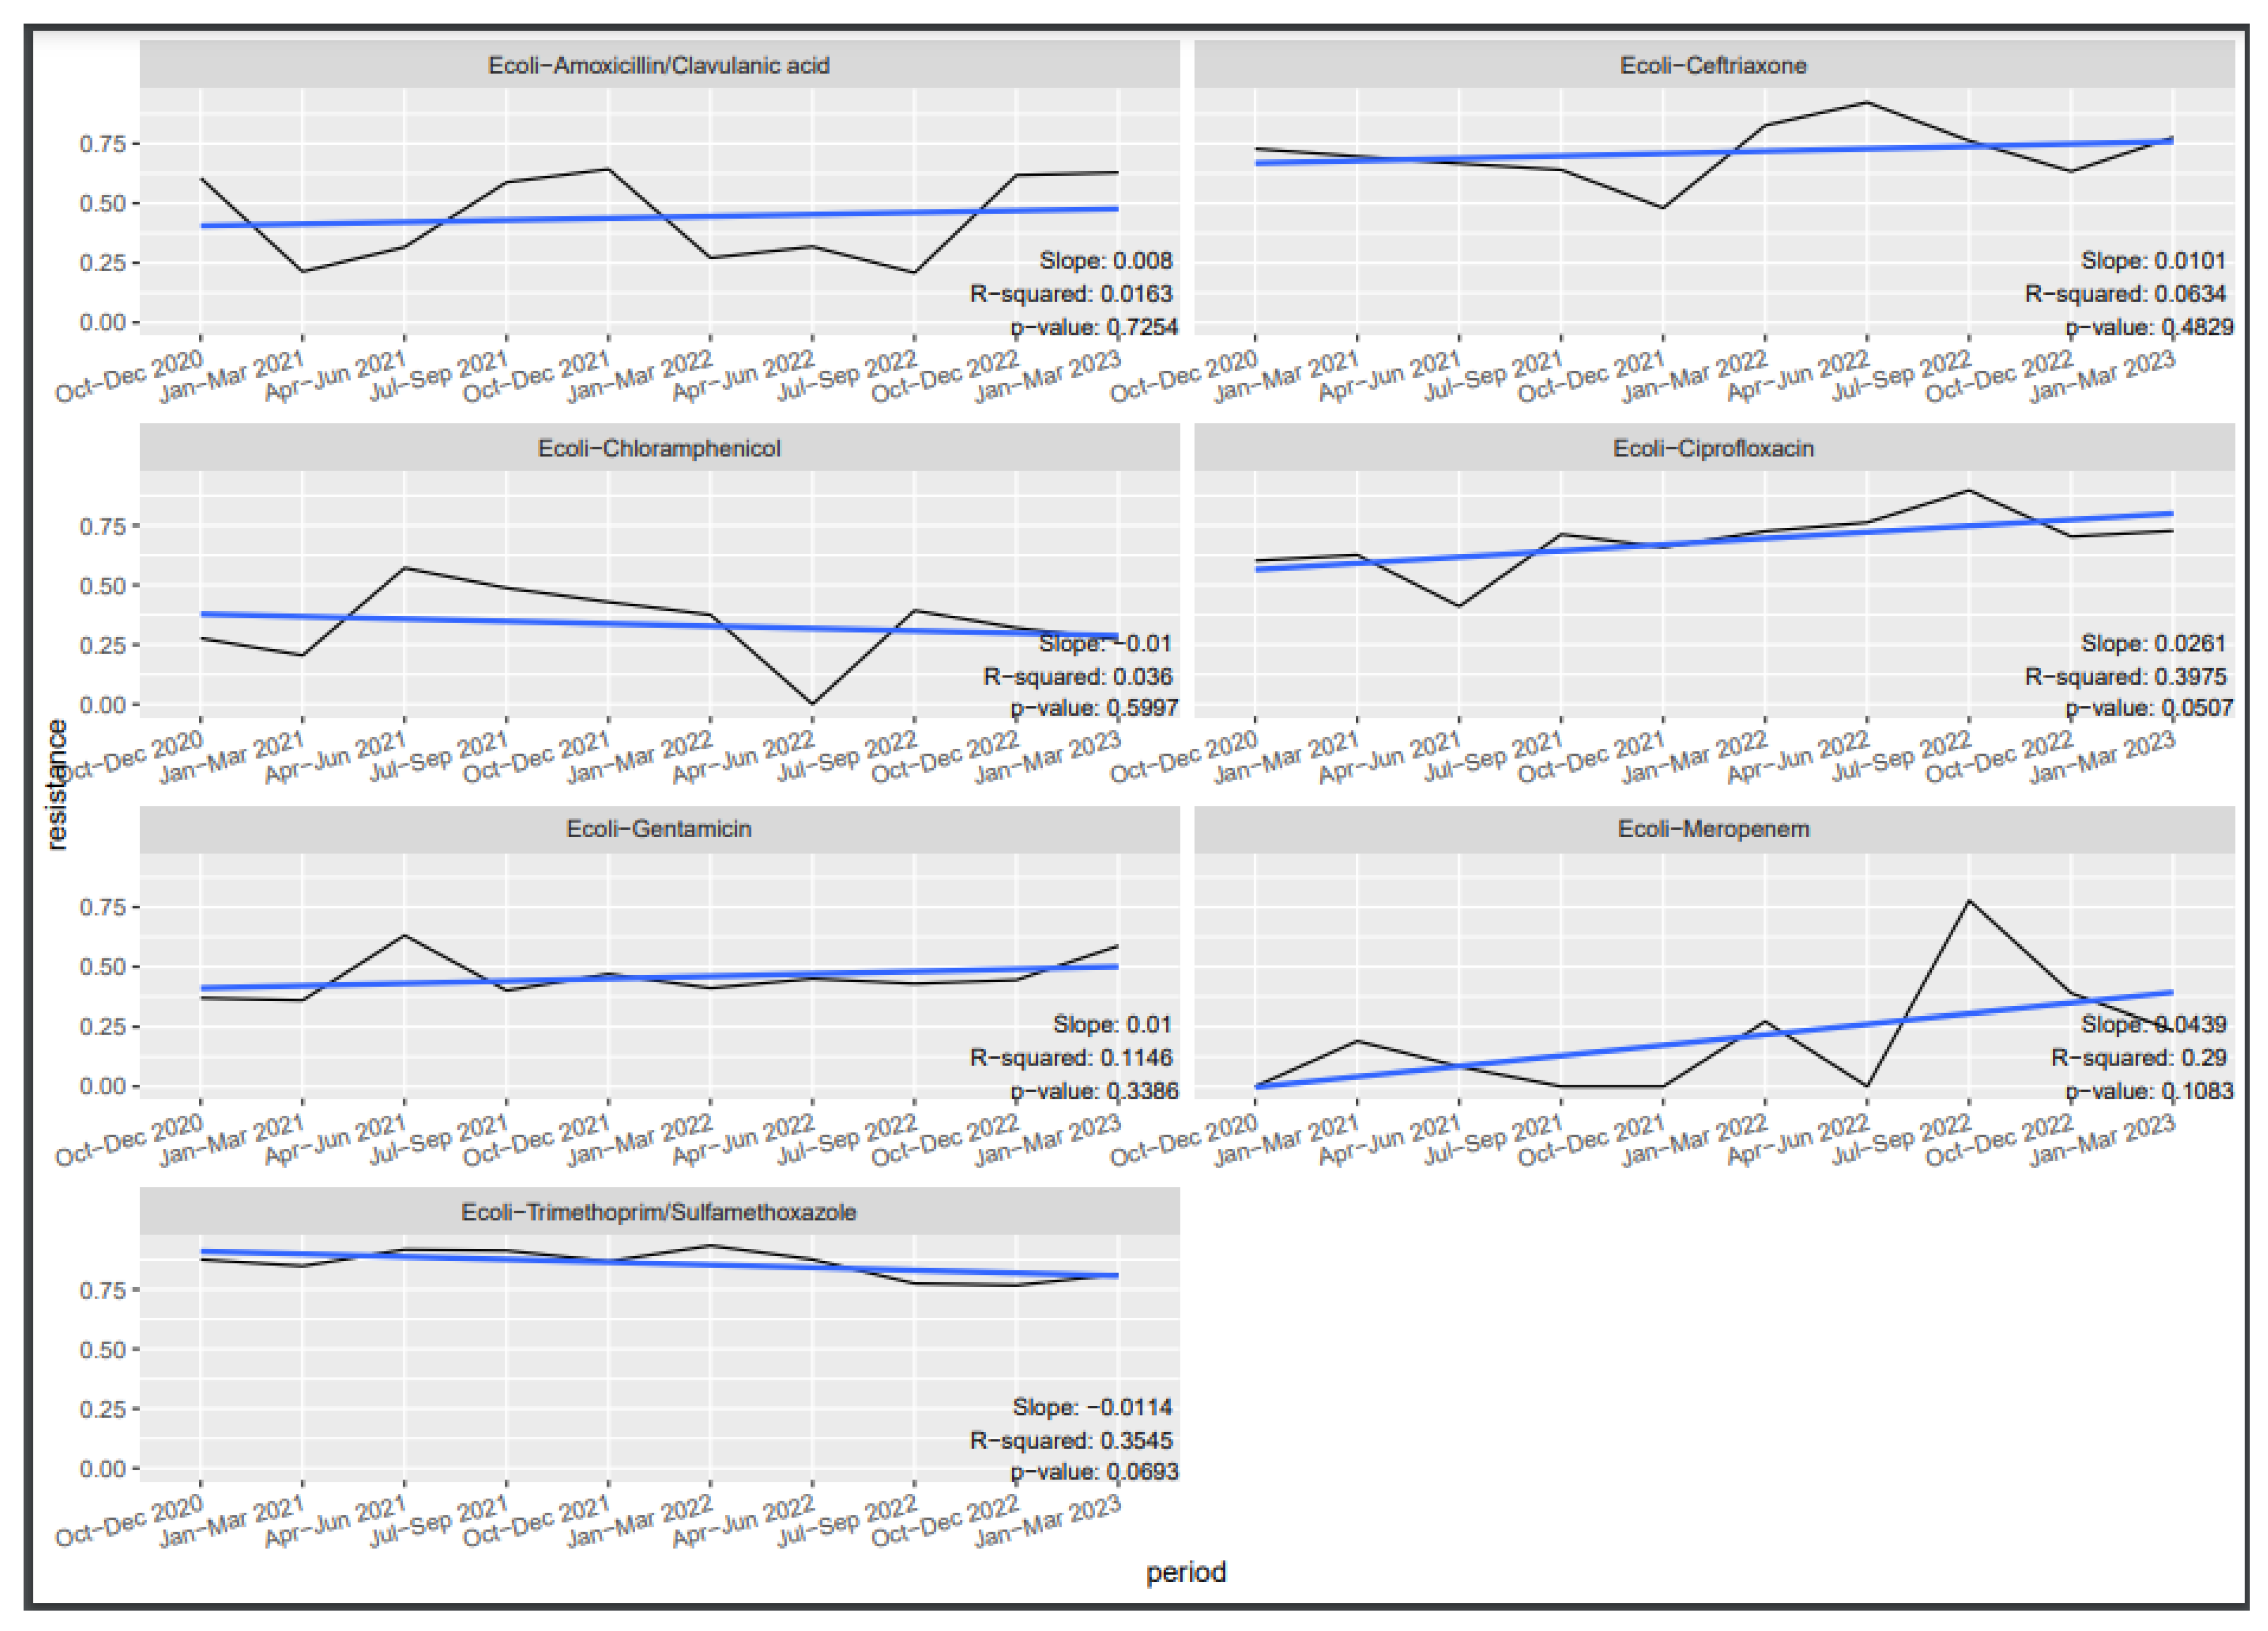
3.6. Antibiotic Susceptibility Trends

Figure 2, Figure 3 and Figure 4 depict the trends in susceptibilities observed during the evaluation period. Specifically, we investigated the quarterly susceptibility trends of Klebsiella spp., Staphylococcus aureus, and Escherichia coli isolates to various antibiotics.
Notably, significant quarterly variation was observed for Klebsiella spp. susceptibility to ciprofloxacin and meropenem, indicating notable changes in susceptibility over time (p = 0.01 and 0.029, respectively). Ciprofloxacin susceptibility displayed a negative trend (slope = 0.0347), with approximately a 55% decrease in susceptibility by quarter (R-squared = 0.5503). Similarly, meropenem exhibited a negative trend (slope = 0.0427), with approximately a 47% decrease in susceptibility by quarter (R-squared = 0.4648). However, no significant variation was observed for ceftriaxone, chloramphenicol, gentamicin, and cotrimoxazole.
For Staphylococcus aureus, only gentamicin susceptibility demonstrated a marginal variation by quarters (p-value = 0.062). Gentamicin exhibited a decreasing trend (slope = 0.018), with approximately a 36.91% decrease in susceptibility by quarter (R-squared = 0.3691). There was no significant variation in susceptibility by quarter for cefoxitin, ciprofloxacin, tetracycline, chloramphenicol, and cotrimoxazole.
For Escherichia coli, varying susceptibility by quarter was observed. Susceptibility to ciprofloxacin demonstrated a significant negative trend over the quarters (slope = 0.0262, R-squared = 0.3967, p = 0.05), while cotrimoxazole also exhibited a marginally significant negative trend (slope = −0.0119, R-squared = 0.3832, p = 0.056). No significant variation was observed for the remaining antibiotics: amoxicillin, meropenem, ceftriaxone, and gentamicin.

4. Discussion

We provide an extensive evaluation of AMR in Uganda, focusing primarily on the most isolated bacteria: Escherichia coli, Klebsiella spp., Acinetobacter spp., Staph. aureus, and Enterococcus spp. These ESKAPE organisms contributed 92% of the isolates, with susceptibility to specific antibiotics varying significantly among sample types and healthcare units. Remarkably reduced susceptibility was observed in all categories of the antibiotics, including the Access and Watch groups (AWaRe classification), with worryingly low susceptibility in the Watch category, more so in the specialized clinics. Similarly, resistance (reduction in susceptibility) was spread across all age groups, with resistance to certain antibiotics like ampicillin, ciprofloxacin, chloramphenicol, gentamycin, and methicillin varying significantly in certain age groups. Over the evaluation period, resistance was mostly linear except for ciprofloxacin, meropenem, and gentamycin, which showed a positive trend. Similarly, co-trimoxazole showed a slight positive trend for Klebsiella spp. and Staph. aureus with no significant change for Escherichia coli. A pronounced spike was observed in the E. coli, Klebsiella spp., and Staphylococcus aureus resistance between April and June 2021, the same timing of the COVID-19 pandemic peak. Notably, resistance against many antibiotics, particularly ampicillin and cotrimoxazole, was persistently high throughout the evaluation period.
Antimicrobial resistance to commonly prescribed antibiotics is widespread in the East African region, especially by Gram-negative bacteria [14]. Earlier studies heralded AMR as an emerging threat in Uganda: Seni et al. found alarmingly high levels of MDR pathogens, particularly ESBL and MRSA, in surgical site infections at Mulago hospital as early as 2013 [15]. Moreover, the epidemic was already occurring in the community; MRSA and ESBLs were highly prevalent in community acquired pyogenic abscesses presenting to Mulago hospital [16]. Our evaluation demonstrated that there has been an increase in AMR compared to these earlier evaluations of surveillance data before and after the constitution of the NAP-AMR, both in terms of AMR prevalence and spread [6,7,8]. The Gram-negatives exhibited high resistance to ceftriaxone, imipenem, ciprofloxacin, gentamycin, and chloramphenicol, and the high amoxicillin clavulanic acid resistance in Escherichia coli, presumably indicating a role for AmpC beta lactamases. Similarly, the high resistance to imipenem/meropenem by Escherichia coli, Klebsiella spp., and Acinetobacter suggested a high presence of carbapenamase producers. However, laboratory confirmation for ESBL and carbapenamase-producing organisms (CPO) was not done. The observed increase suggests that the stewardship actions being used are not having the desired effect, which requires immediate attention.
Among the Gram-positives, the very high prevalence of MRSA at 56% was particularly notable and comparable to the 53% found by Pius [17] from skin and soft tissue infections in western Uganda. Similarly, high rates of MRSA have been reported in Kenya (53.4%) [18] and Tanzania (43.3%) [19], suggesting that MRSA is endemic in Uganda and other East African countries. MRSA isolation from community- and hospital-acquired infections suggests continued emergence and transmission in both contexts, necessitating IPC and the promotion of rational antibiotic usage in both. Among the enterococci, 66% were still susceptible to ampicillin but, worryingly, vancomycin resistance was up to 24%. One study in Kenya identified no vancomycin resistance among clinical Enterococcus isolates [20]. The World Health Organization listed the carbapenemase producers, ESBL, MRSA, and VRE, as critical and high-priority threats requiring urgent attention [21]. The prevalence of the above resistance phenotypes was higher in specialized healthcare units like the ICU compared to the general units. Specialized units are characterized by extensive use of broad-spectrum antibiotics, invasive procedures, and the handling of patients with severe infections, which are predisposing factors for AMR [22,23]. Moreover, resistance to all antibiotics in this evaluation significantly varied among the different healthcare units of the hospitals except for ciprofloxacin, chloramphenicol, cefixime, cefepime, and vancomycin. Therefore, context-specific interventions in addition to universal IPC and stewardship interventions are needed.
In this evaluation, ampicillin, ciprofloxacin, chloramphenicol, gentamycin, and methicillin resistance were significantly higher in certain age groups compared to the >65 age group. This indicates that age might be an independent risk factor for pathogens developing resistance to certain antibiotics. Hossain et al. also observed an age effect in urinary tract Escherichia coli resistance to antibiotic therapy [24]. Escherichia coli resistance to amikacin, nitrofurantoin, and colistin was lower in the younger age groups compared to the >60 age group [24]. Moreover, aging-related physiological, metabolic, and immunological changes are associated with specific changes in different body site microbiota, e.g., skin microbiota changed due to changes in skin sebum [25]. The human microbiota has been deemed a reservoir of AMR due to its wide microbial genetic diversity, ecosystem for genetic exchange, and constant exposure to AMR determinants [26]. This emphasizes that surveillance of antimicrobial resistance genes (ARG) in the human microbiota can be a source of information for AMR control strategies. On the other hand, there was less variation in AMR by sex, with only resistance to erythromycin being significantly lower in men than women. This contrasts Brandl et al. findings from the German national surveillance data, where men had a twofold higher incidence of resistant infections (2.3 for MRSA, 2.2 for carbapenem-resistant Acinetobacter baumannii, CRAB, and 1.7 for carbapenem-resistant Enterobacterales, CRE) and colonization compared to women [27]. Men are favored in accessing health services because they hold the decision-making power and control of resources, factors that give them access to antimicrobials, a risk of AMR [28]. Women, on the other hand, are more likely to attend local and free health facilities, which might prescribe antibiotics only when needed or when available [29]. These findings show that gender-related effects on AMR are critical in efforts towards the control of AMR, which need to be urgently explored.
Resistance to several antibiotics including, ciprofloxacin, chloramphenicol, ceftriaxone, gentamicin, and erythromycin, significantly differed among the specimen types. This finding may have implications for empirical therapy for different infectious syndromes, as the infection may be due to microorganisms of the same species but different strains [30,31]. However, few prior research efforts have focused on the effect of specimen type on AMR. Studies by Mwansa et al. showed that Staphylococcus aureus resistance to tetracycline was influenced by specimen type, being lower in urine compared to blood [32]. Likewise, Escherichia coli isolated from sputum had higher resistance to common antibiotics compared to those isolated from blood and urine, except for urine, where Escherichia coli was more resistant to fluoroquinolones than that from sputum [33]. Similarly, Salmonella enterica isolated from urine, blood, and stool had differing resistance to cephems, macrolides, phenicols, tetracyclines, and quinolones [30]. The largest difference was observed with quinolones, to which the isolates from blood were less susceptible compared to those from urine or feces [30]. It is plausible that the chemical and immunological properties of the different specimens that affect bacterial yield from the different specimens [34] might also alter the organism’s response to antibiotic therapy. The GLASS also set priority specimens for surveillance based on infections of critical body systems that were showing alarming resistance to last resort antibiotics [35]. The variation of resistance by specimen type observed in these studies emphasizes that for antibiograms to effectively inform AMR control, they need to be context-specific, including specimen type, organism, age, and others whenever possible.
We provide the first evaluation of resistance trends in bacteria predominantly isolated in Uganda. Positive trends in antibiotic resistance were noted for ciprofloxacin and meropenem for Klebsiella spp., gentamycin for Staphylococcus aureus, and ciprofloxacin for Escherichia coli, while cotrimoxazole showed a slight negative trend for Escherichia coli. The antibiotic resistance of most bacteria to the other antibiotics remained persistently above 30%, with none showing any negative trend. Selection pressure due to irrational use of antibiotics and the cloning of the selected resistant isolates likely underlie this persistently high and increasing trend in resistance against certain antibiotics [36]. Notable was a pronounced spike in Escherichia coli resistance to amoxicillin clavulanic acid and gentamycin; Klebsiella spp. resistance to ceftriaxone, chloramphenicol, and gentamycin; and Staph. aureus resistance to cefoxitin and chloramphenicol during the COVID-19 pandemic peak. The Center for Disease Control reported a 15% increase in AMR between 2019 and 2020, largely driven by a breakdown in infection prevention measures and antibiotic prescriptions for supportive treatment of COVID-19 and bacterial co-infections [37]. The increasing trends and persistently high resistance have implications for the empirical treatment of infectious syndromes [38], which is the commonest approach to treating bacterial infection in Uganda. Antimicrobial stewardship implementation strategies are urgently required to reverse the observed, but these would be more effective if they were targeted at specific situations or antimicrobials [39].
The greatest strength of our evaluation is that, unlike prior evaluations of AMR surveillance in Uganda, our evaluation presents a wide interrogation of the AMR surveillance data and considers how some critical parameters like age, sex, specimen types, and healthcare unit may influence the AMR surveillance outlook. This information is very critical to shaping Uganda’s AMR surveillance efforts focused and effective. The evaluation was limited by the range of antibiotics tested and the range of pathogens considered, focusing on Escherichia coli, Klebsiella spp., Acinetobacter spp., Staph. aureus, and Enterococcus spp., which had large representative numbers for analysis.

5. Conclusions

We noted consistently high resistance across all WHO AWaRe categorizations of antibiotics, with increasing trends for certain antibiotics and significant variations by age, sex, specimen type, and hospital unit. The findings emphasize the necessity of transitioning to surveillance combined with infection prevention and effective antimicrobial stewardship strategies targeted at the critical drivers of AMR so as to reverse the ascending trends of AMR. Further, gender issues relating to AMR need urgent investigation, while molecular and genetic surveillance techniques, particularly those focused on ARG in the body microbiota, would improve stewardship interventions.

Supplementary Materials

The following supporting information can be downloaded at: https://www.mdpi.com/article/10.3390/tropicalmed9040077/s1. Table S1 Isolate recovery from the different specimen; Table S2: Isolate recovery from the different specimen; Table S3: AMR variation by gender.

Author Contributions

Conceptualization, J.M., D.K., A.B., F.D., F.K. and H.K.; methodology, J.M., D.K., A.B., F.D., F.K. and H.K.; formal analysis, J.M., D.K., A.B., F.D. and H.K.; investigation, J.M., D.K., J.B., R.W., M.L., F.K. and H.K.; resources, F.K., R.W. and M.L.; data curation, J.M., D.K., A.B. and F.D.; writing—original draft preparation, J.M.; writing—review and editing, D.K., F.D., C.O., S.N., C.G., I.N., A.A., P.M., N.O., B.W., S.O., A.Y., J.E., C.B., F.J.N., I.M., M.S., J.B., R.W., F.K. and H.K.; visualization, F.D.; supervision, C.O., S.N., A.A., P.M., N.O., B.W., S.O., A.Y., J.E., C.B. and F.J.N.; project administration, J.M.; funding acquisition, F.K., R.W. and M.L. All authors have read and agreed to the published version of the manuscript.

Funding

Funded by the Fleming Fund grants programme through Mott MacDonald under the terms of Grant Agreement|Uganda CG2 TOR FF78-484. The funder did not contribute to any phase of the evaluation.

Institutional Review Board Statement

Not applicable.

Informed Consent Statement

Not applicable.

Data Availability Statement

The datasets presented in this article are not readily available because the data is a preserve of the Ministry of Health. Requests to access the datasets should be directed to the Director General of Curative services, Ministry of Health.

Acknowledgments

We would like to acknowledge the contribution of all staff in the participating hospitals, particularly the clinical and laboratory staff for supporting the sample collection and analysis. We also greatly appreciate the patients who provided the samples, whose results were the basis of this evaluation.

Conflicts of Interest

The authors have declared that no competing interests exist.

Abbreviations

AMRAntimicrobial Resistance
AWaRe Access Watch Reserve
ASTAntimicrobial Susceptibility Testing
GLASSGlobal Antimicrobial Resistance and Use Surveillance System
CRECarbapenem Resistant Enterobacterales
ESBLExtended Spectrum Beta Lactamases
MDRMulti-Drug Resistance
MRSAMethicillin Resistant Staphylococcus Aureus
NAPNational Action Plan
SLMTAStrengthening Laboratory Management Towards
Accreditation
SLIPTALaboratory Quality Improvement Process Towards
VREVancomycin Resistant Enterococcus

References

  1. Jim, O. Antimicrobial Resistance: Tackling a Crisis for the Health and Wealth of Nations. 2014. Available online: https://wellcomecollection.org/works/rdpck35v (accessed on 4 March 2024).
  2. Murray, C.J.L.; Ikuta, K.S.; Sharara, F.; Swetschinski, L.; Aguilar, G.R.; Gray, A.; Han, C.; Bisignano, C.; Rao, P.; Wool, E.; et al. Global burden of bacterial antimicrobial resistance in 2019: A systematic analysis. Lancet 2022, 399, 629–655. [Google Scholar] [CrossRef] [PubMed]
  3. Elton, L.; Thomason, M.J.; Tembo, J.; Velavan, T.P.; Pallerla, S.R.; Arruda, L.B.; Vairo, F.; Montaldo, C.; Ntoumi, F.; Hamid, M.M.A.; et al. Antimicrobial resistance preparedness in sub-Saharan African countries. Antimicrob. Resist. Infect. Control 2020, 9, 145. [Google Scholar] [CrossRef] [PubMed]
  4. Kateete, D.P.; Namazzi, S.; Okee, M.; Okeng, A.; Baluku, H.; Musisi, N.L.; A Katabazi, F.; Joloba, M.L.; Ssentongo, R.; Najjuka, F.C. High prevalence of methicillin resistant Staphylococcus aureus in the surgical units of Mulago hospital in Kampala, Uganda. BMC Res. Notes 2011, 4, 326. [Google Scholar] [CrossRef] [PubMed]
  5. Bebell, L.M.; Ngonzi, J.; Bazira, J.; Fajardo, Y.; Boatin, A.A.; Siedner, M.J.; Bassett, I.V.; Nyehangane, D.; Nanjebe, D.; Jacquemyn, Y.; et al. Antimicrobial-resistant infections among postpartum women at a Ugandan referral hospital. PLoS ONE 2017, 12, e0175456. [Google Scholar] [CrossRef] [PubMed]
  6. UNAS; CDDEP; GARP-Uganda; Mpairwe, Y.; Wamala, S. Antibiotic Resistance in Uganda: Situation Analysis and Recommendations; Uganda National Academy of Sciences; Center for Disease Dynamics, Economics & Policy: Kampala, Uganda, 2015; 107p. [Google Scholar]
  7. Nabadda, S.; Kakooza, F.; Kiggundu, R.; Walwema, R.; Bazira, J.; Mayito, J.; Mugerwa, I.; Sekamatte, M.; Kambugu, A.; Lamorde, M.; et al. Implementation of the World Health Organization Global Antimicrobial Resistance Surveillance System in Uganda, 2015–2020: Mixed-Methods Study Using National Surveillance Data. JMIR Public Health Surveill. 2021, 7, e29954. [Google Scholar] [CrossRef] [PubMed]
  8. Mugerwa, I.; Nabadda, S.N.; Midega, J.; Guma, C.; Kalyesubula, S.; Muwonge, A. Antimicrobial Resistance Situational Analysis 2019–2020: Design and Performance for Human Health Surveillance in Uganda. Trop. Med. Infect. Dis. 2021, 6, 178. [Google Scholar] [CrossRef]
  9. Mahon, C.R.; Lehman, D.C.; Manuselis, G. Textbook of Diagnostic Microbiology, 5th ed.; Elsevier: Amsterdam, The Netherlands, 2015. [Google Scholar]
  10. CLSI. Analysis and Presentation of Cumulative Antimicrobial Susceptibility Test Data, 5th ed.; CLSI Guidelines M39; CLSI: Wayne, PA, USA, 2022. [Google Scholar]
  11. CLSI. Performance Standards Antimicrobial Susceptibility Testing, 33rd ed.; CLSI Supplement M100; CLSI: Wayne, PA, USA, 2023. [Google Scholar]
  12. CLSI. Performance Standards Antimicrobial Susceptibility Testing, 30th ed.; CLSI Supplement M100; CLSI: Wayne, PA, USA, 2020. [Google Scholar]
  13. WHONET ©. The Microbiology Laboratory Database Software. 1989–2023. Available online: https://whonet.org/ (accessed on 4 March 2024).
  14. Ampaire, L.; Muhindo, A.; Orikiriza, P.; Mwanga-Amumpaire, J.; Bebell, L.; Boum, Y. A review of antimicrobial resistance in East Africa. Afr. J. Lab. Med. 2016, 5, a432. [Google Scholar] [CrossRef]
  15. Seni, J.; Najjuka, C.F.; Kateete, D.P.; Makobore, P.; Joloba, M.L.; Kajumbula, H.; Kapesa, A.; Bwanga, F. Antimicrobial resistance in hospitalized surgical patients: A silently emerging public health concern in Uganda. BMC Res. Notes 2013, 6, 298. [Google Scholar] [CrossRef]
  16. Ongom, P.A.; Obuku, E.A.; Achan, B. Community-acquired soft-tissue pyogenic abscesses in Mulago hospital, Kampala: Bacteria isolated and antibiotic sensitivity. East Cent. Afr. J. Surg. 2012, 17, 28–37. [Google Scholar]
  17. Pius, T.; Irege, R.; Makeri, D.; Tamale, A. Methicillin-Resistant Staphylococcus aureus among Patients with Skin and Soft Tissue Infections: A Cross-Sectional Study at a Tertiary Hospital in Bushenyi, Western, Uganda. Open Access Libr. J. 2023, 10, e10186. [Google Scholar] [CrossRef]
  18. Wangai, F.K.; Masika, M.M.; Maritim, M.C.; Seaton, R.A. Methicillin-resistant Staphylococcus aureus (MRSA) in East Africa: Red alert or red herring? BMC Infect. Dis. 2019, 19, 596. [Google Scholar] [CrossRef]
  19. Kumburu, H.H.; Sonda, T.; Leekitcharoenphon, P.; van Zwetselaar, M.; Lukjancenko, O.; Alifrangis, M.; Lund, O.; Mmbaga, B.T.; Kibiki, G.; Aarestrup, F.M. Hospital Epidemiology of Methicillin-Resistant Staphylococcus aureus in a Tertiary Care Hospital in Moshi, Tanzania, as Determined by Whole Genome Sequencing. BioMed Res. Int. 2018, 2018, 2087693. [Google Scholar] [CrossRef]
  20. Georges, M.; Odoyo, E.; Matano, D.; Tiria, F.; Kyany’a, C.; Mbwika, D.; Mutai, W.C.; Musila, L. Determination of Enterococcus faecalis and Enterococcus faecium Antimicrobial Resistance and Virulence Factors and Their Association with Clinical and Demographic Factors in Kenya. J. Pathog. 2022, 2022, 3129439. [Google Scholar] [CrossRef] [PubMed]
  21. World Health Organization. WHO Publishes List of Bacteria for Which Now Antibiotics Are Urgently Needed. [Internet] 2022 Jan. Available online: https://www.ecdc.europa.eu/en/news-events/who-publishes-list-bacteria-which-new-antibiotics-are-urgently-needed#:~:text=WHO%20publishes%20list%20of%20bacteria%20for%20which%20new%20antibiotics%20are%20urgently%20needed,-News&text=%E2%80%8BThe%20World%20Health%20Organization,effective%20antibiotics%20are%20urgently%20needed (accessed on 4 March 2024).
  22. President, J.C.; De Waele, J. Intensive Care Units as Epicentres for Antimicrobial Resistance Development. AMR Control 2017. Available online: http://resistancecontrol.info/2017/intensive-care-units-as-epicentres-for-antimicrobial-resistance-development/ (accessed on 4 March 2024).
  23. Yildirim, S.; Nursal, T.Z.; Tarim, A.; Torer, N.; Noyan, T.; Demiroglu, Y.Z.; Moray, G.; Haberal, M. Bacteriological profile and antibiotic resistance: Comparison of findings in a burn intensive care unit, other intensive care units, and the hospital services unit of a single center. J. Burn Care Rehabil. 2005, 26, 488–492. [Google Scholar] [CrossRef] [PubMed]
  24. Hossain, A.; Hossain, S.A.; Fatema, A.N.; Wahab, A.; Alam, M.M.; Islam, N.; Hossain, M.Z.; Ahsan, G.U. Age and gender-specific antibiotic resistance patterns among Bangladeshi patients with urinary tract infection caused by Escherichia coli. Heliyon 2020, 6, e04161. [Google Scholar] [CrossRef]
  25. Wu, L.; Zeng, T.; Deligios, M.; Milanesi, L.; Langille, M.G.I.; Zinellu, A.; Rubino, S.; Carru, C.; Kelvin, D.J. Age-Related Variation of Bacterial and Fungal Communities in Different Body Habitats across the Young, Elderly, and Centenarians in Sardinia. mSphere 2020, 5, e00558-19. [Google Scholar] [CrossRef]
  26. Brinkac, L.; Voorhies, A.; Gomez, A.; Nelson, K.E. The threat of antimicrobial resistance on the human microbiome. Microb. Ecol. 2017, 74, 1001–1100. [Google Scholar] [CrossRef]
  27. Brandl, M.; Hoffmann, A.; Willrich, N.; Reuss, A.; Reichert, F.; Walter, J.; Eckmanns, T.; Haller, S. Bugs That Can Resist Antibiotics but Not Men: Gender-Specific Differences in Notified Infections and Colonisations in Germany, 2010–2019. Microorganisms 2021, 9, 894. [Google Scholar] [CrossRef]
  28. Jones, N.; Mitchell, J.; Cooke, P.; Baral, S.; Arjyal, A.; Shrestha, A.; King, R. Gender and Antimicrobial Resistance: What Can We Learn from Applying a Gendered Lens to Data Analysis Using a Participatory Arts Case Study? Front. Glob. Women’s Health 2022, 3, 745862. [Google Scholar] [CrossRef]
  29. Aryal, B.K.; Daud, M.; Thapa, A.; Mahotra, A.; Magar, S.A.; Malla, C.K. Assesssment of health facilities for implementation of package of essential non-communicable disease in Nepal: Baseline study in Kailali and Ilam District. J. Nepal Health Res. Counc. 2018, 16, 149–155. [Google Scholar] [CrossRef]
  30. Shakeri, H.; Volkova, V.; Wen, X.; Deters, A.; Cull, C.; Drouillard, J.; Müller, C.; Moradijamei, B.; Jaberi-Douraki, M. Establishing Statistical Equivalence of Data from Different Sampling Approaches for Assessment of Bacterial Phenotypic Antimicrobial Resistance. Appl. Environ. Microbiol. 2018, 84, e02724-17. [Google Scholar] [CrossRef]
  31. Karp, B.E.; Tate, H.; Plumblee, J.R.; Dessai, U.; Whichard, J.M.; Thacker, E.L.; Hale, K.R.; Wilson, W.; Friedman, C.R.; Griffin, P.M.; et al. National Antimicrobial Resistance Monitoring System: Two decades of advancing public health through integrated surveillance of antimicrobial resistance. Foodborne Pathog. Dis. 2017, 14, 545–557. [Google Scholar] [CrossRef]
  32. Mwansa, T.N.; Kamvuma, K.; Mulemena, J.A.; Phiri, C.N.; Chanda, W. Antibiotic susceptibility patterns of pathogens isolated from laboratory specimens at Livingstone Central Hospital in Zambia. PLoS Glob. Public Health 2022, 2, e0000623. [Google Scholar] [CrossRef]
  33. Wang, S.; Zhao, S.; Zhou, Y.; Jin, S.; Ye, T.; Pan, X. Antibiotic resistance spectrum of E. coli strains from different samples and age-grouped patients: A 10-year retrospective study. BMJ Open 2023, 13, e067490. [Google Scholar] [CrossRef]
  34. Torres, J.; Avalos, N.; Echols, L.; Mongelluzzo, J.; Rodriguez, R.M. Low yield of blood and wound cultures in patients with skin and soft-tissue infections. Am. J. Emerg. Med. 2017, 35, 1159–1161. [Google Scholar] [CrossRef]
  35. WHO. Global Antimicrobial Resistance Surveillance System Manual for Early Implementation. [Internet] 2015. Available online: https://www.who.int/publications/i/item/9789241549400 (accessed on 4 March 2024).
  36. Baker, S.; Thomson, N.; Weill, F.-X.; Holt, K.E. Genomic insights into the emergence and spread of antimicrobial-resistant bacterial pathogens. Science 2018, 360, 733–738. [Google Scholar] [CrossRef] [PubMed]
  37. CDC. Covid-19 Impact on Antimicrobial Resistance: 2022 Special Report. [Internet] 2022. Available online: https://www.cdc.gov/drugresistance/pdf/covid19-impact-report-508.pdf (accessed on 4 March 2024).
  38. Sivasankar, S.; Goldman, J.L.; Hoffman, M.A. Variation in antibiotic resistance patterns for children and adults treated at 166 non-affiliated US facilities using EHR data. JAC—Antimicrob. Resist. 2022, 5, dlac128. [Google Scholar] [CrossRef] [PubMed]
  39. Malani, A.N.; Richards, P.G.; Kapila, S.; Otto, M.H.; Czerwinski, J.; Singal, B. Clinical and economic outcomes from a community hospital’s antimicrobial stewardship program. Am. J. Infect. Control 2013, 41, 145–148. [Google Scholar] [CrossRef] [PubMed]
Figure 1. Map showing the AMR surveillance sites that were included in this evaluation.
Tropicalmed 09 00077 g001
Figure 2. Trend in Klebsiella spp. resistance.
Tropicalmed 09 00077 g002
Figure 3. Trend in Staphylococcus aureus resistance.
Tropicalmed 09 00077 g003
Figure 4. Trends in E. coli resistance.
Tropicalmed 09 00077 g004
Table 1. Demographics characteristics.
VariableLevelsNumber of SpecimensPercentage of Total
SiteJinja RRH282119.48%
DMM MUST 261518.05%
Mbarara RRH238416.46%
Kabale RRH188112.99%
Mbale RRH148710.27%
Arua RRH10397.17%
Lira RRH8205.66%
Gulu RRH6564.53%
Masaka RRH5383.71%
Soroti RRH2431.68%
Sex Female800255.74%
Male635544.26%
Age (Years)25–44490233.84%
5–24397627.45%
0–4253217.48%
45–64207514.33%
65 and above9996.90%
Sample typeUrine327925.29%
Blood324525.03%
Pus Swab277421.39%
Urogenital swabs178113.73%
Cerebral Spinal Fluid8816.79%
Sputum5644.35%
Stool4073.14%
Tracheal aspirate360.28%
QuarterOctober–December 2020193613.37%
January–March 2021215914.91%
April–June 2021209314.45%
July–September 2021188112.99%
October–December 202113669.43%
January–March 202211207.73%
April–June 20226674.61%
July–September 20226774.67%
October–December 20228525.88%
January–March 2023173311.96%
DepartmentOutpatient department528245.31%
Paediatric ward214118.37%
Medical ward136511.71%
Surgical ward8857.59%
Gynaecology ward5474.69%
Emergency ward5374.61%
Orthopaedic department2662.28%
Maternity ward1681.44%
Private ward1341.15%
Acute Care Unit1331.14%
Intensive care unit1060.91%
HIV clinic940.81%
Table 2. Antibiotic susceptibility in general clinics.
AntibioticGram-Negative IsolatesGram-Positive Isolates
EnterobacteralesNon Enterobacterales
E. coli n (%S)Klebsiella spp. n (%S)Others n (%S)Acinetobacter spp. n (%S)Pseudomonas spp. n (%S)Staphylococcus aureus n (%S)Enterococcus spp. n (%S)
Ampicillin607 (8%) 79 (22%)70 (66%)
Amoxicillin/Clavulanic acid463 (56%) 11 (82%)
Ciprofloxacin650 (36%)299 (55%)220 (58%)69 (54%)73 (60%)799 (51%)86 (51%)
Chloramphenicol411 (67%)179 (56%)124 (39%) 631 (68%)49 (59%)
Ceftriaxone375 (28%)226 (38%)155 (42%)31 (16%)
Meropenem172 (81%)86 (90%)77 (75%)20 (55%)19 (63%)
Imipenem629 (89%)365 (90%)201 (77%)59 (66%)94 (87%)
Trimethoprim466 (15%)275 (21%)167 (36%)40 (20%) 597 (32%)
Gentamicin597 (57%)278 (54%)192 (71%)57 (53%)60 (65%)718 (66%)
Erythromycin 748 (34%)
Vancomycin 86 (72%)
Cefoxitin (MRSA Screen) 172 (44%)
Table 3. Susceptibility variation by hospital units.
AntibioticEmergency n (%S)Gynaecology n (%S)HIV Clinic n (%S)Maternity n (%S)Medical n (%S)OPD n (%S)Paediatrics n (%S)Specialized n (%S)Surgical n (%S)p-Value
Ampicillin38 (18%)83 (14%)12 * (33%)27 * (7%)150 (13%)608 (17%)84 (10%)24 * (4%)230 (7%)0
Amoxicillin/Clavulanic acid23 * (35%)71 (45%)9 * (56%)16 * (50%)121 (42%)434 (54%)70 (41%)9 * (44%)188 (47%)0.007
Ciprofloxacin80 (46%)157 (44%)17 * (33%)47 (36%)251 (46%)886 (48%)195 (56%)35 (49%)416 (44%)0.888
Chloramphenicol32 (56%)93 (61%)11 * (82%)42 (55%)137 (66%)622 (60%)139 (69%)24 * (50%)318 (58%)0.109
Ceftriaxone18 * (17%)58 (21%)7 * (43%)8 * (25%)115 (27%)315 (57%)76 (26%)14 * (21%)196 (22%)0
Meropenem8 * (87%)27 * (74%) 5 * (40%)55 (89%)161 (86%)19 * (79%)2 * (50%)67 (67%)0.136
Imipenem51 (90%)96 (77%)12 * (92%)27 * (89%)194 (89%)627 (90%)112 (85%)32 (75%)249 (84%)0.025
Trimethoprim/Sulfamethoxazole31 (6%)96 (19%)13 * (8%)48 (21%)173 (20%)694 (24%)161 (25%)17 * (24%)240 (21%)0
Gentamicin61 (70%)126 (44%)18 * (67%)50 (56%)193 (64%)767 (65%)153 (51%)23 * (61%)400 (55%)0
Erythromycin24 * (33%)57 (23%)12 * (33%)24 * (25%)90 (41%)527 (26%)130 (32%)11 * (27%)157 (45%)0
Vancomycin 5 * (20%)26 * (46%)1 * (0%)3 * (67%)48 (42%)249 (36%)28 * (61%)6 * (67%)24 * (21%)0.64
Oxacillin/Methicillin10 * (50%)9 * (44%)1 * (0%)2 * (50%)17 * (53%)82 (44%)38 (47%)1 * (0%)37 (59%)0
* Bacterial isolates less than 30, which limits our ability to use the data to inform patient care or any stewardship or policy interventions.
Table 4. Susceptibility variation by age groups.
Antibiotic NameAge GroupsSusceptibilityOR [95% CI]p-Values
Ampicillin 0–4173 (13%)0.86 [0.468–1.588]0.634
5–941 (21%)0.45 [0.191–1.043]0.063
10–1440 (22%)0.43 [0.185–1.013]0.054
15–25294 (18%)0.57 [0.343–0.952]0.032
25–44556 (12%)0.86 [0.528–1.393]0.536
45–64332 (14%)0.74 [0.444–1.246]0.26
65 and above224 (11%)Ref
Amoxiclav0–4117 (47%)1.24 [0.773–1.985]0.374
5–934 (58%)0.77 [0.365–1.622]0.491
10–1431 (45%)1.33 [0.619–2.878]0.462
15–25205 (55%)0.88 [0.583–1.319]0.529
25–44386 (46%)1.24 [0.867–1.786]0.235
45–64240 (46%)1.28 [0.861–1.893]0.224
65 and above170 (52%)Ref
Ciprofloxacin0–4377 (58%)0.73 [0.532–0.993]0.045
5–967 (62%)0.6 [0.346–1.038]0.068
10–1491 (74%)0.34 [0.201–0.578]0.000
15–25567 (47%)1.12 [0.837–1.489]0.456
25–44964 (41%)1.4 [1.072–1.835]0.014
45–64505 (45%)1.19 [0.883–1.591]0.257
65 and above275 (50%)Ref
Chloramphenicol0–4253 (64%)1.15 [0.757–1.733]0.520
5–955 (69%)0.94 [0.49–1.822]0.865
10–1450 (68%)0.99 [0.505–1.954]0.985
15–25397 (65%)1.09 [0.74–1.598]0.668
25–44614 (56%)1.66 [1.155–2.377]0.006
45–64332 (57%)1.54 [1.042–2.274]0.030
65 and above168 (67%)Ref
Ceftriaxone0–4105 (27%)1.64 [0.936–2.881]0.084
5–934 (38%)1.01 [0.463–2.213]0.976
10–1429 (58%)0.44 [0.194–1.008]0.052
15–25179 (34%)1.21 [0.752–1.955]0.430
25–44337 (38%)1 [0.652–1.527]0.992
45–64216 (31%)1.36 [0.857–2.169]0.190
65 and above122 (38%)Ref
Meropenem0–453 (77%)2.2 [0.825–5.842]0.115
5–915 (86%)1.15 [0.219–6.077]0.866
10–1410 (80%)1.88 [0.337–10.431]0.473
15–2574 (77%)2.24 [0.896–5.586]0.085
25–44159 (80%)1.82 [0.788–4.189]0.161
45–6490 (82%)1.62 [0.65–4.047]0.300
65 and above68 (88%)Ref
Imipenem0–4197 (82%)1.73 [0.991–3.011]0.054
5–943 (86%)1.34 [0.516–3.497]0.546
10–1461 (85%)1.43 [0.631–3.255]0.390
15–25314 (85%)1.35 [0.8–2.277]0.262
25–44596 (85%)1.36 [0.845–2.184]0.206
45–64364 (84%)1.51 [0.91–2.49]0.111
65 and above232 (89%)Ref
Trimethoprim Sulphamethoxazole0–4267 (25%)0.79 [0.512–1.223]0.292
5–963 (31%)0.58 [0.31–1.09]0.091
10–1469 (34%)0.51 [0.279–0.923]0.026
15–25360 (22%)0.93 [0.613–1.415]0.739
25–44670 (22%)0.94 [0.639–1.375]0.741
45–64331 (25%)0.81 [0.532–1.228]0.318
65 and above202 (21%)Ref
Gentamicin0–4307 (51%)1.7 [1.199–2.402]0.003
5–957 (73%)0.63 [0.332–1.211]0.168
10–1470 (80%)0.44 [0.233–0.845]0.013
15–25494 (60%)1.15 [0.833–1.584]0.398
25–44832 (58%)1.27 [0.942–1.715]0.116
45–64420 (59%)1.22 [0.878–1.696]0.237
65 and above236 (63%)Ref
Erythromycin0–4215 (31%)0.99 [0.577–1.695]0.969
5–949 (44%)0.56 [0.272–1.159]0.118
10–1460 (50%)0.46 [0.232–0.904]0.024
15–25300 (35%)0.85 [0.509–1.42]0.535
25–44477 (28%)1.14 [0.691–1.866]0.616
45–64196 (30%)1.04 [0.6–1.793]0.896
65 and above86 (31%)Ref
Vancomycin0–459 (44%)0.71 [0.33–1.547]0.393
5–917 (47%)0.63 [0.208–1.927]0.421
10–1415 (40%)0.84 [0.258–2.755]0.778
15–2572 (37%)0.94 [0.443–1.983]0.866
25–44150 (40%)0.82 [0.423–1.593]0.559
45–6497 (38%)0.91 [0.449–1.852]0.799
65 and above50 (36%)Ref
Oxacillin/Methicillin0–455 (38%)0.4 [0.102–1.604]0.198
5–99 (55%)0.2 [0.032–1.24]0.084
10–1418 (77%)0.07 [0.013–0.385]0.002
15–2552 (42%)0.34 [0.086–1.355]0.126
25–4469 (46%)0.29 [0.075–1.116]0.072
45–6435 (45%)0.3 [0.071–1.24]0.096
65 and above15 (20%)Ref
OR denotes odds ratios, and 95% CI denotes the 95% confidence interval obtained by fitting a logistic regression model. p-values < 0.05 were considered statistically significant.
Table 5. AMR variation by sample type in general clinics.
AntibioticGram-NegativesGram-Positives
Acinetobacter spp. Escherichia coli Klebsiella spp. Staphylococcus aureus Enterococcus spp.
BloodUrinePusp-ValueBloodUrinePusp-ValuesBloodUrinePusp-ValuesBloodUrinePusp-ValueBloodUrinePusp-Value
n (%S)n (%S)n (%S)n (%S)n (%S)n (%S)n (%S)n (%S)n (%S)n (%S)n (%S)n (%S)n (%R)n (%S)n (%S)
AmpicillinNANANA 20 (20%)283 (9%)194 (5%)0.088NANANA NANANA NA14 (36%)27 (67%)8 (87%)0.046
Amoxicillin/Clavulanic acidNANANA 21 (57%)216 (53%)147 (56%)0.70522 (36%)55 (44%)84 (42%) NANANA NANANA
Ciprofloxacin2 (100%)5 (40%)44 (57%)0.047 23 (57%)256 (39%)246 (28%)0.00529 (41%)50 (62%)126 (49%)0.12182 (62%)153 (37%)407 (62%)0.00013 (15%)39 (64%)13 (31%)0.004
ChloramphenicolNANANA 12 (33%)133 (72%)150 (75%)0.02117 (41%)30 (77%)89 (39%)0.00860 (77%)128 (58%)309 (75%)0.00512 (67%)17 (59%)10 (70%)0.689
Ceftriaxone 16 (44%)149 (34%)133 (14%)0.00227 (19%)45 (56%)75 (28%)0.006NANANA NANANA
Meropenem 4 (50%)13 (54%) 6 (83%)62 (85%)63 (79%)0.9025 (80%)16 (94%)34 (88%)0.636NANANA NANANA
Imipenem5 (80%)3 (100%)34 (56%)0.76526 (81%)314 (89%)200 (86%)0.30228 (100%)78 (91%)121 (83%)0.088NANANA NANANA
Trimethoprim/Sulfamethoxazole3 (33%)1 (100%)23 (13%)0.14415 (27%)201 (10%)162 (14%)0.3327 (26%)65 (22%)84 (15%)0.47358 (28%)135 (21%)282 (42%)0.000 NANANA
Gentamicin2 (100%)5 (40%)35 (54%)0.4718 (61%)230 (58%)223 (49%)0.17131 (39%)45 (60%)109 (42%)0.04969 (58%)142 (61%)350 (71%)0.058NANANA
Piperacillin 1 (100%)1 (0%) 2 (50%) NANANA NANANA
ErythromycinNANANA NANANA NANANA 70 (46%)179 (23%)352 (41%)0.000NANANA
Vancomycin NANANA NANA NANANA NANANA 16 (81%)38 (74%)12 (58%)0.440
Oxacillin/ MethicillinNANANA NANA NANANA 17 (47%)27 (26%)99 (51%) 0.123NANANA
Disclaimer/Publisher’s Note: The statements, opinions and data contained in all publications are solely those of the individual author(s) and contributor(s) and not of MDPI and/or the editor(s). MDPI and/or the editor(s) disclaim responsibility for any injury to people or property resulting from any ideas, methods, instructions or products referred to in the content.

