Abstract
This paper studies the computational modelling of the flow separation over the engine nacelle lips under the off-design condition of significant crosswind. A numerical framework is set up to reproduce the general flow characteristics under crosswinds with increasing engine mass flow rate, which include: low-speed separation, attached flow and high speed shock-induced separation. A quasi-3D (Q3D) duct extraction method from the full 3D (F3D) simulations has been developed. Results obtained from the Q3D simulations are shown to largely reproduce the trends observed (isentropic Mach number variations and high-speed separation behaviour) in the 3D intake, substantially reducing the simulation time by a factor of 50. The agreement between the F3D and Q3D simulations is encouraging when the flow either fully attached or with modest levels of separation but degrades when the flow fully detaches. Results are shown to deviate beyond this limit since the captured streamtube shape (and hence the corresponding Q3D duct shape) changes with the mass flow rate. Interestingly, the drooped intake investigated in the current study is prone to earlier separation under crosswinds when compared to an axisymmetric intake. Implications of these results on the industrial nacelle lip design are also discussed.
1. Introduction
Gas–turbine engines are generally housed in nacelles. An optimal intake design is the one which provides a uniform distribution of the air flow to the downstream components with minimum total pressure loss over a wide range of operating conditions. Modern engine architectures are trending towards higher bypass ratios and lower fan pressure ratios, which offer further improvements in propulsive efficiency with consequential reduction in emissions and noise. To circumvent the consequent increase in the weight and drag, engine manufacturers are exploring the possibility of employing shorter intakes and slimmer nacelle lips [1,2]. Such designs are however much more susceptible to flow separation due to the reduced diffusion capability of the intake, specifically under the off-design conditions of high crosswinds and high-incidence.
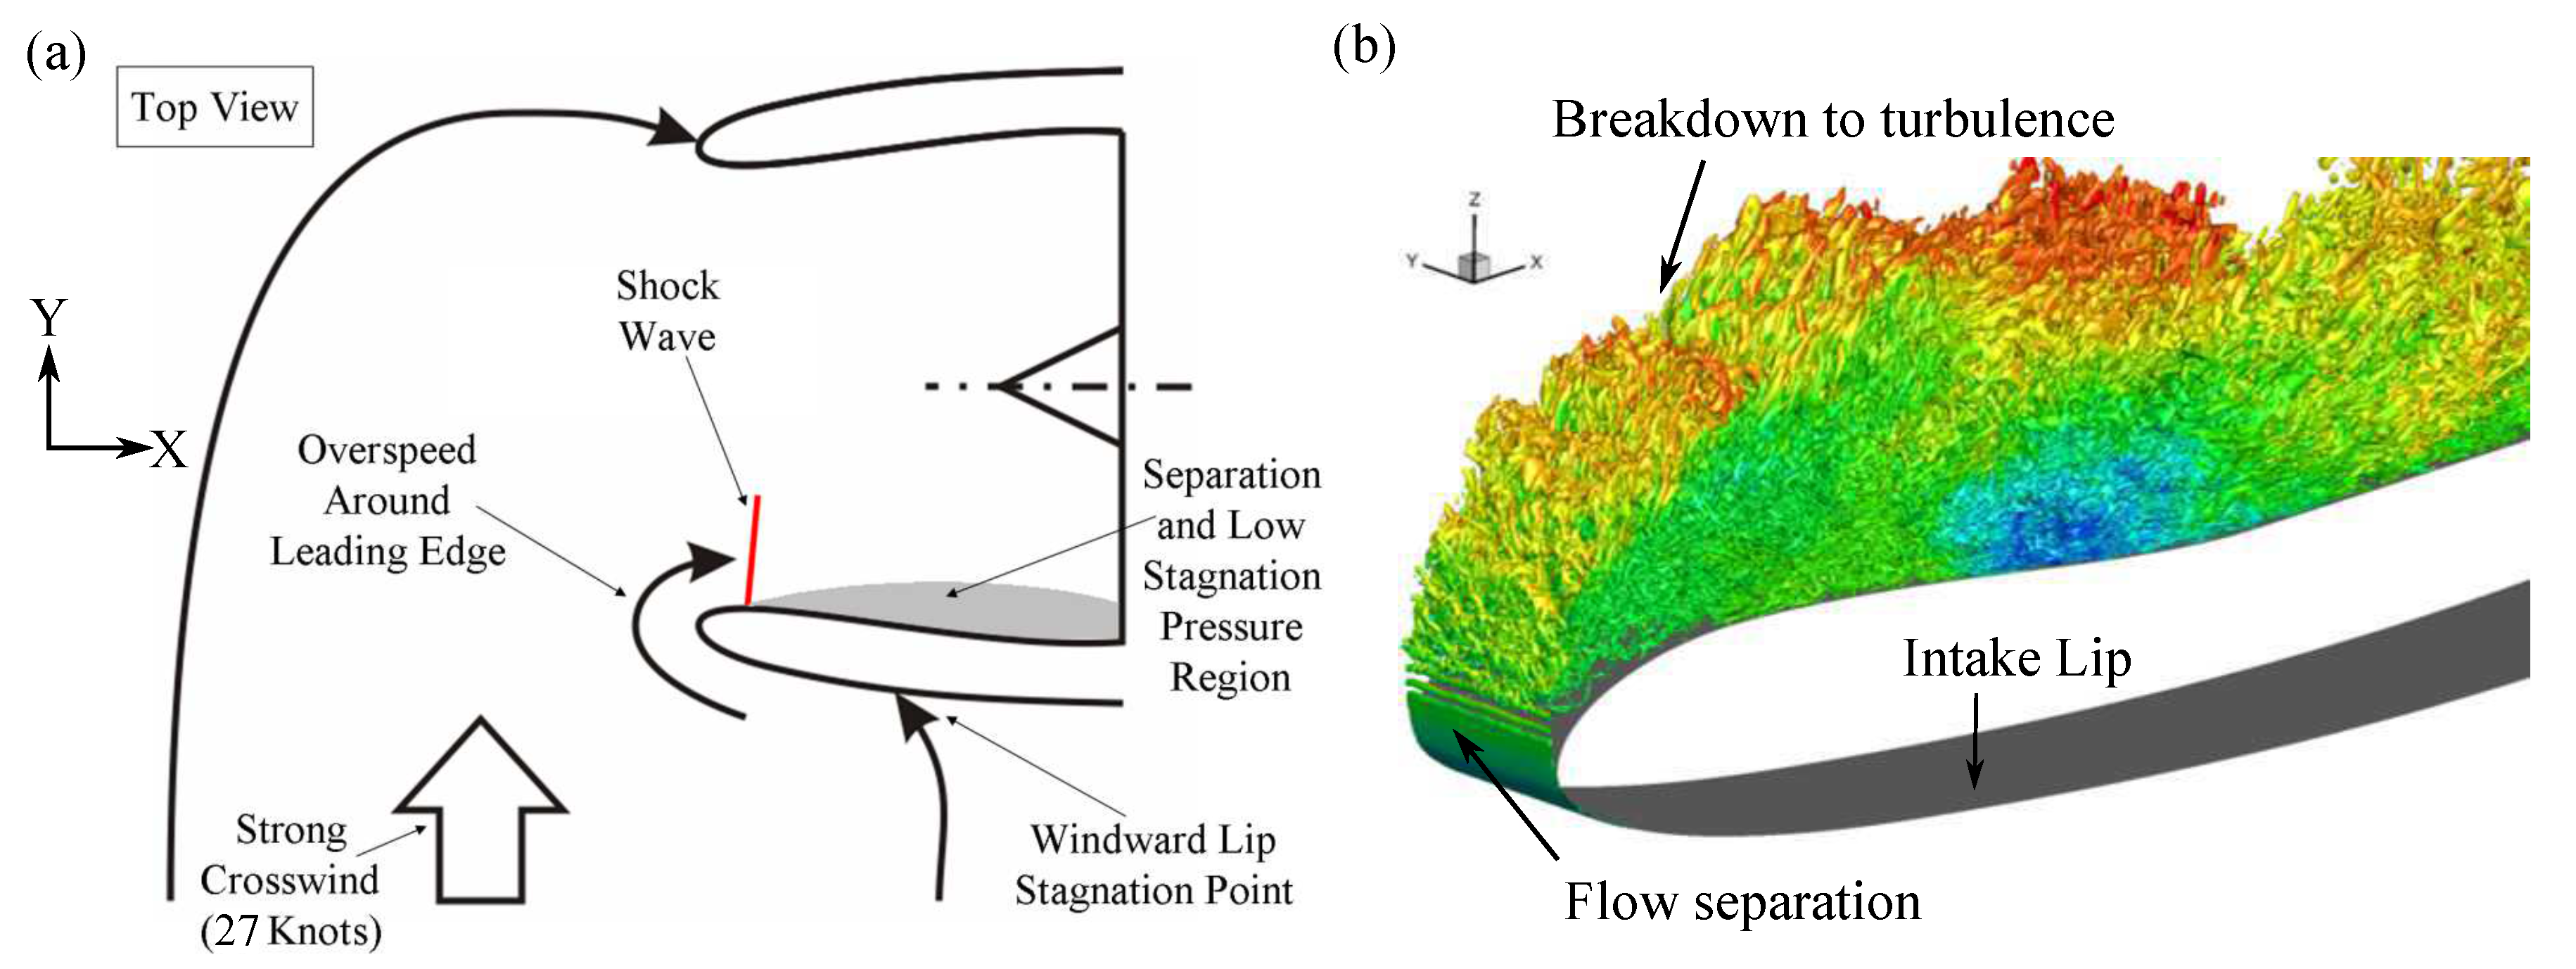
Ideally the nacelle lip skin would be designed to maximise cruise performance, since cruise is generally the longest flight phase [3]. Nevertheless, to cater for the off-design conditions of high-incidence and crosswind, the actual lip shapes used in commercial aircraft intakes are a compromise. Typically, the lip shapes at different circumferential locations may be designed independently, then blended together to form the full lip shape. Figure 1 outlines the key flow features under strong crosswind when the flow around the nacelle lip either (a) reaches supersonic speed and encounters a flow separation due to shock-wave boundary layer interaction (Figure 1a from Wakelam et al. [4]) or (b) remains subsonic and encounters a low-speed separation (Figure 1b from Vadlamani and Tucker [5]). In either of these cases, inhomogeneous flow reaching the fan face has a detrimental effect on the engine efficiency. As shown by Freeman and Rowe [6], aerodynamic instabilities like fan stall can occur in extreme cases. Hall and Hynes [7] investigated the interaction of natural wind with the intake, and observed hysteresis behaviour in the flow separation and reattachment at low-speeds/low mass-flow rates. Colin et al. [8] simulated crosswind flow over an intake with nine different turbulence models and compared their predictive capability. Among these models, Spalart–Allmaras (SA), shear stress transport (SST) and explicit algebraic Reynolds stress model (EARSM) were shown to accurately predict the separated flow at higher engine mass flow rates. Additional complications due to the ground vortex ingestion under crosswinds are also analysed by [9] and Carnevale et al. [10].
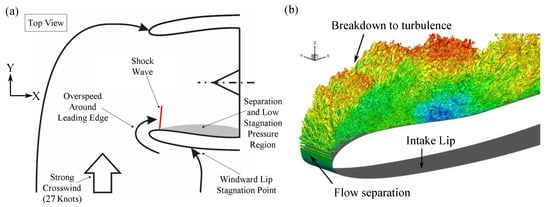
Figure 1.
(a) Flow over an intake under crosswind [11]; (b) low-speed separation on intake lip (Vadlamani and Tucker [5]).
To examine the crosswind flows in detail (in the absence of ground plane), Wakelam [11] adopted a novel experimental approach. A cost effective quasi-3d (Q3D) sector rig is built in contrast to a full-3D (F3D) intake rig. Duct walls are modelled inline with the captured three-dimensional streamtube (extracted from CFD simulation) ingested into the axisymmetric intake. This is shown to recreate the pressure distribution over the highly loaded section on the windward side of the intake lip. The Sector Rig also captured three flow regimes at increasing engine mass flow rates: low-speed separation (with hysteresis), attached flow, and high speed shock-induced separation. Wakelam et al. [4,12] further demonstrated the use of different flow-control strategies (passive boundary trips and active vortex generator jets) to reduce fan-face distortion. From the numerical front, Vadlamani and Tucker [13] studied the possibility of using plasma actuators for flow control. Oriji and Tucker [14] employed a Q3D computational framework that shares a similar geometry to the sector rig. This setup is used to enhance the standard one-equation SA model to accommodate for the roughness and relaminarisation effects.
Aforementioned literature suggests that Q3D sector rig is a plausible approach to qualitatively reproduce the dynamics of the flow over the intake lip under crosswinds, albeit in the absence of the ground plane. Q3D approach offers a significant reduction in the experimental and computation costs, which is particularly beneficial for iterative parametric studies. However, its validity needs to be further assessed, if the intake design has to be based on the results of this approach. Hence, the current work attempts to develop a numerical framework that could model the crosswind flow behaviour, specifically close to the high-speed shock-induced separation. The objectives of this paper are multi-fold: (a) identify the merits and challenges of the Q3D approach on the intake design and flow control (b) progressively invoke simplifications, both in terms of the geometry and flow physics, to facilitate the Q3D extraction procedure (c) At each stage, verify both the qualitative/quantitative impact of these simplifications by comparing the isentropic Mach number (ISM) over the intake lip, stagnation pressure and distortion coefficient at the fan-face for different operating conditions.
Outline of the paper: details of the numerical methodology are discussed in the next section. The results section provides an overview of the (a) performance of a full 3D (F3D) real intake with droop (b) comparisons against an axisymmetric intake (c) quasi 3D (Q3D) duct extraction procedure and (d) reproducibility of the flow behaviour using Q3D. This is followed by concluding remarks in the final section.
2. Numerical Methodology
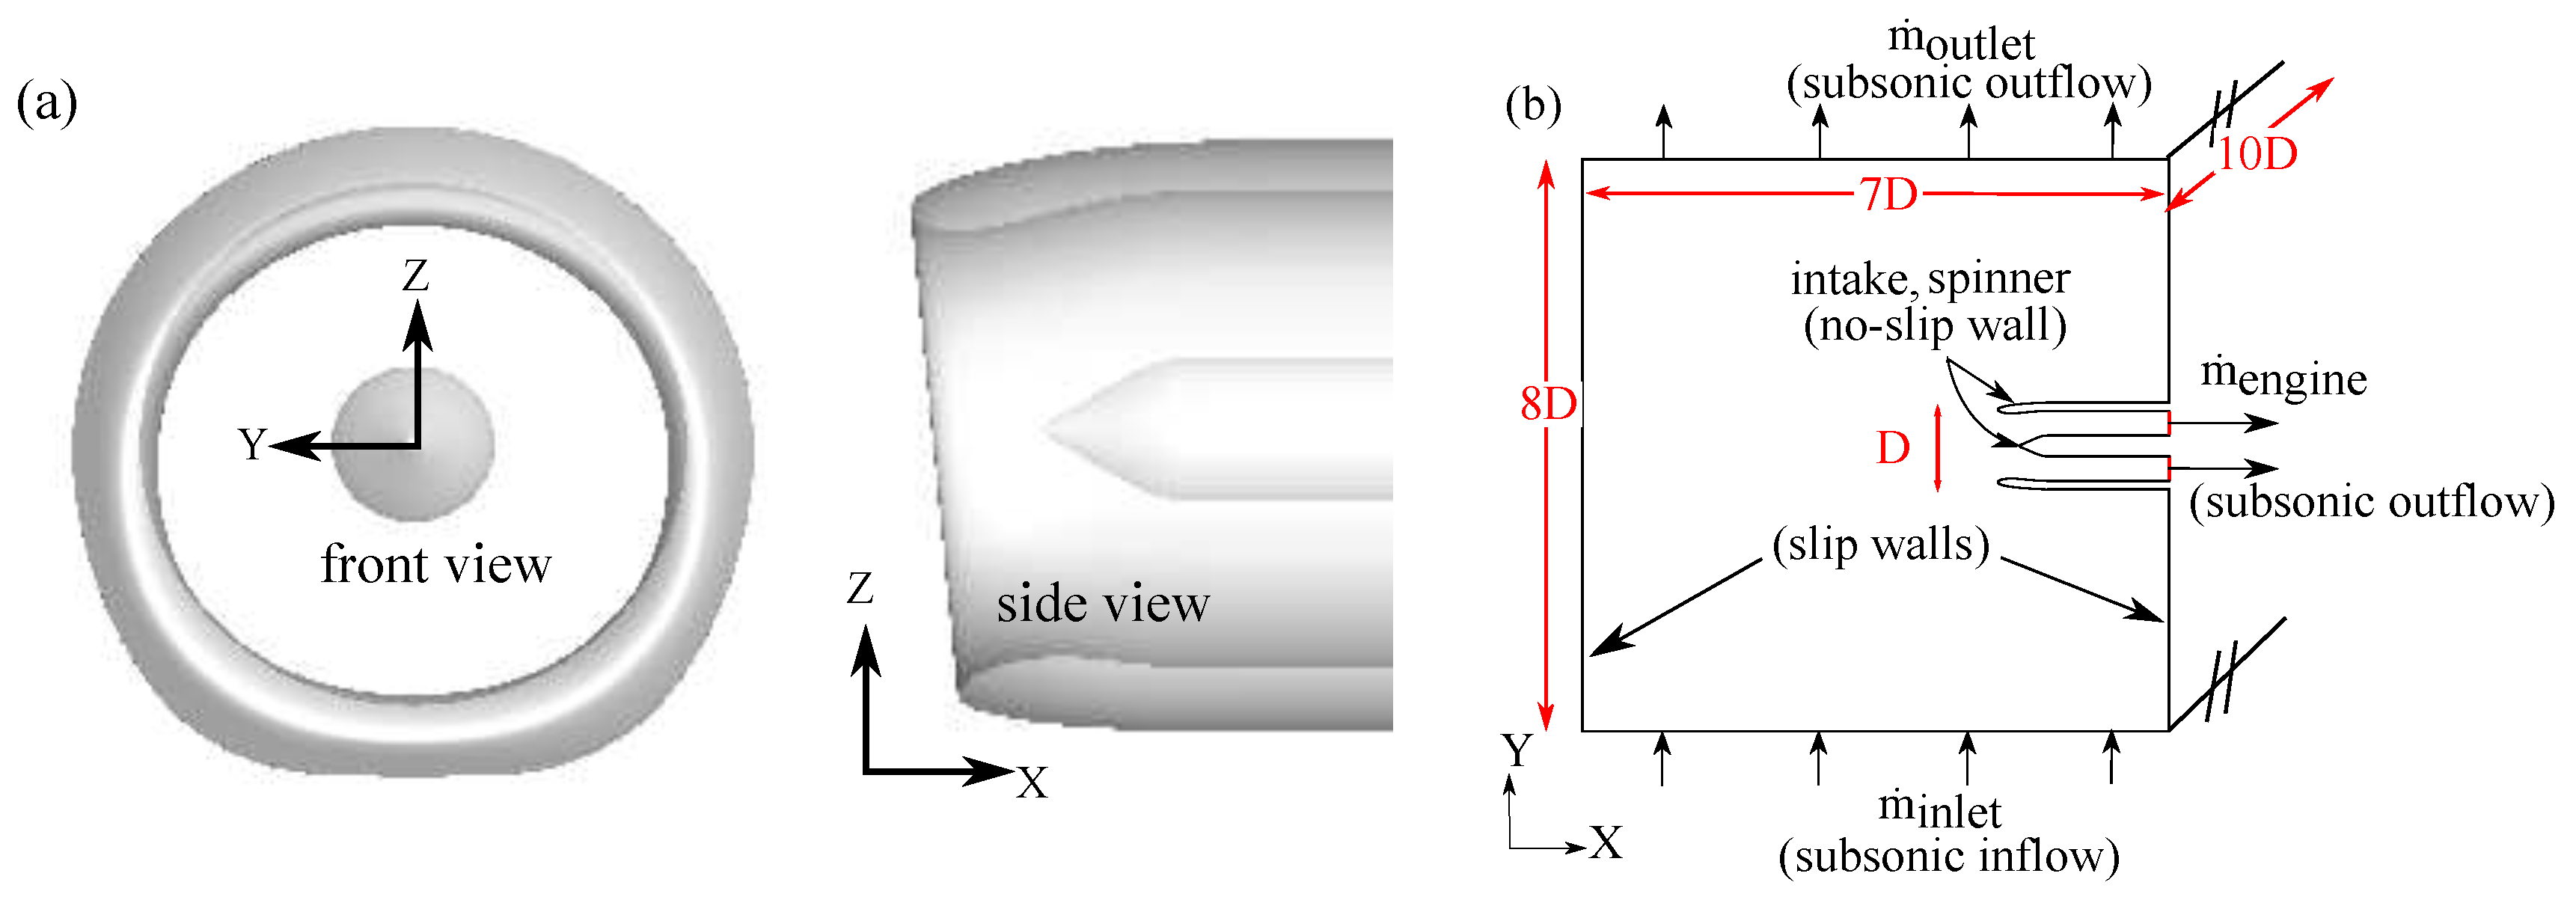
A nacelle design typical for modern wide-body aircraft is used as a baseline case for the analysis. Figure 2a exhibits the geometric features of a real intake which includes circumferentially varying lip thickness (front view) and intake droop (side view). Figure 2b shows the physical boundary conditions applied and the extent of the computational domain ( in x, y and z directions respectively). The inlet freestream is set at atmospheric sea-level density, total pressure and total temperature. The crosswind speed is set to 27 knots. At the inlet, Spalart variable () is set to . This corresponds to an inflow turbulent viscosity which is 10 times the laminar viscosity. The effect of increasing levels of in the free-stream on the boundary layer behaviour is expected to be minimal since the Reynolds number is large enough and the flow over the intake lip is already turbulent (see [15]). An equivalent mass inflow is set at the windward face to supply uniform crosswind. The intake and spinner surfaces are modelled as viscous walls, and the rest of the faces of the computational domain as inviscid slip walls. Additional complications due to the ground vortex ingestion are not included in the current simulations. To simulate different engine power settings, the engine exit mass outflow is varied within a range of normalised mass flow rate 0.55 to 1.35, where is a reference value. A subsonic outflow boundary is imposed at the face opposite to the windward face. To satisfy continuity, the mass flow through the outlet is hence specified to be the difference between the mass flow rate at the inlet and engine exit.
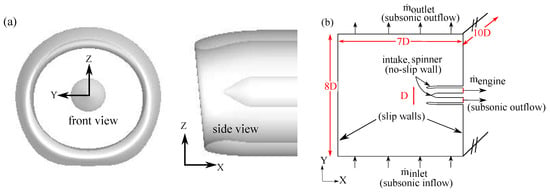
Figure 2.
(a) Drooped intake geometry; (b) boundary conditions for full 3D simulations.
A mesh comprising of 10.1 million nodes (15.2 million elements) is used for the full 3D domain. Hybrid meshing strategy is employed in which (a) hexahedral elements are used around the intake lip and spinner walls to accurately model the boundary layers and (b) unstructured tetrahedral elements are used in the freestream to reduce computational cost and facilitate meshing. Standard one-equation Spalart-Allmaras (SA) turbulence model is used to close the system of Reynolds-averaged Navier-Stokes (RANS) equations, which is demonstrated to reasonably predict the flow over intakes under off-design conditions ([8,10,16]). Note that additional corrections to the SA model to account for relaminarisation and roughness (see [14]) are not included in this current study. It is well known that the post-separation predictive capability of steady RANS models is questionable. Unsteady RANS or the presence of fan (see [17]) can alleviate these deficiencies to some extent. Nevertheless, we limit scope of the current study to steady RANS, since the objective of this paper is to verify if the Q3D can reproduce the flow characteristics of F3D on the intake lip using the same computational techniques. The minimum values of the first off-wall nodes are typically 30–40 and hence wall-functions are activated at the wall to ensure sufficient accuracy of the boundary layer predictions [18]. The numerical framework (and the grids employed in the current study) has been successfully validated against the experimental data under the off-design condition of high-incidence [16].
A Rolls-Royce in-house solver, HYDRA, was used for all simulations. It is a density-based finite-volume unstructured solver, which is second-order accurate in space and time. The solver is suitable to carry out multi-fidelity simulations including RANS/unsteady RANS/large eddy simulations (LES) and has been extensively validated over a wide range of test cases and complex flows [19]. Low Mach number preconditioning is also activated to accelerate convergence and improve the predictions in the low-Mach separated zones.
3. Results
3.1. Full 3D Drooped Intake
In this section, results are reported for the simulations on a full 3D (F3D) intake, which has realistic geometric features like droop and circumferentially varying lip thickness. For a fixed crosswind speed of 27 knots, the characteristics of the flow over this intake is examined by varying the engine mass flow rate. Figure 3a–c show the Mach number contours on the plane for increasing engine mass flow rates. Note that the mass flow values are normalised as , where corresponds to the engine mass flow rate for the ‘attached’ case close to high-speed separation. Consistent with the experiments on an intake subjected to crosswinds (see [11]), three distinct flow regimes can be identified: low speed separation on the intake lip for , attached flow for , and high speed separation for . When the engine mass flow is low, the pressure gradient is insufficient to promote flow reattachment over the intake lip. On the other hand, at higher , excessive acceleration results in a local transonic flow over the lip. The subsequent formation of the shock wave over the lip triggers boundary layer separation. Between these two separation limits, the flow remains fully attached over the intake and the distortion is minimal. The local acceleration of the flow over the convex curvature of the spinner wall is evident in Figure 3c. This is due to the well known fact that the flow accelerates over convex bends due to a favourable pressure gradient. In addition, the shock induced separation on the windward side of the intake lip increases the local blockage. Due to this blockage, the flow further accelerates particularly on the convex surface of the spinner wall facing the windward side of the intake lip. Similar flow behaviour was noted by Colin et al. [8].

Figure 3.
Mach number contours on plane for increasing engine mass flow rate.
The performance of the fan is sensitive to the distortion transferred to the fan face. Frames (a–d) in Figure 4 compare the contours of stagnation pressure, , at the fan-face (≈0.5D from highlight) for varying engine mass flow ratios between and . In frame (a), a considerable region with a lower is observable on the windward side of the intake. This is indicative of the distortion transferred to the fan face due to the low speed separation on the intake lip. The distribution in frame (b) was almost uniform (), except within the region of thin boundary layer, thereby indicating a fully attached flow. Frame (c) shows the distortion initiated by the shock-induced separation at a relatively higher mass flow. Further increase in the engine mass flow intensifies the shock strength and results in an abrupt increase in the distortion as seen in frame (d). The in the separated region was much lower for high speed shock-induced separation (by ) when compared to low speed separation (by ). It can be noted that the separation is not symmetric about plane; this asymmetric behaviour is attributed to the (a) droop of the intake and (b) non-uniform thickness of the intake lip in the circumferential direction. This aspect will be further discussed in Figure 7.

Figure 4.
contours at fan-face: (a) low-speed separation; (b) attached flow; (c,d) high speed separation.
3.1.1. Simplification of F3D Problem
Initial attempts were made to extract a quasi-3D duct from the full 3D viscous drooped intake (see Appendix A). However, due to asymmetry and low speed flow in the boundary layer, the resulting duct shapes were complex and mesh creation around these ducts was extremely challenging. In order to facilitate the extraction of the Q3D duct, additional simplifications are essential. These include: (a) simplifying the geometry to an axisymmetric intake and (b) eliminating the boundary layers (and flow separation) by treating both the flow and walls as inviscid. Subsequent sections show the impact of these simplifications by highlighting the key differences between (a) the symmetric and drooped intakes and (b) viscous and inviscid simulations on the axisymmetric intake.
3.1.2. Full 3D Axisymmetric Intake—Viscous Simulations
In order to construct the F3D axisymmetric intake, the highly loaded intake lip section from the drooped intake is first extracted and subsequently rotated by about the X-axis. It is important to examine the effect of this simplification on the dynamics of the flow. Due to the three-dimensional nature of the flow, captured streamtubes in the two intake designs are expected to differ. Hence a thorough comparison between the predictions from drooped and axisymmetric intakes is made in the subsequent plots.
Figure 5 compares the axial variation of isentropic Mach number, ISM, around the intake lip for the axisymmetric and drooped intakes. ISM profiles have been extracted from the intersection between the plane and the windward side of the inlet. It is defined as
where is the freestream (inlet) stagnation pressure, and p is the local static pressure on intake lip. For the separated cases in frames (a,c,d), deviations in the peak values of ISM are observable. However, the agreement is generally favourable for the case (frame (b)) where the flow remains attached in both the intakes. For the current intake configuration in the absence of ground plane, the highly loaded lip profile and the windward profile at are observed to be marginally different, thus having a little impact on the streamwise variation of the ISM.

Figure 5.
Axial variation of isentropic Mach number (ISM) for free 3D (F3D) drooped and axisymmetric viscous simulations.
Figure 6a compares the contours of stagnation pressure at the fan face for the drooped and axisymmetric cases at four different engine mass flow rates. Figure 6b compares the corresponding extent of distortion at the fan-face. An industrial standard, , is used to quantify the distortion. Here and are the mean fan face stagnation and dynamic pressures respectively, and is the minimum mean stagnation pressure over any 60° sector at the fan face. Based on the extent of low regions and the DC60 values, it is apparent that the axisymmetric intake shows low speed separation for (frame (i)), high speed separation for (frame (iv)) and attached flow for both the and cases (frames (ii,iii)). It is worth noting that the contours in Figure 6a for the axisymmetric cases are always symmetric about the plane, in contrast to the asymmetry observed for the droop cases. It is also interesting to note from the case (frame (iii)) that the flow in the drooped intake has separated while the flow remains attached in the axisymmetric intake. This is also evident from the Figure 6b, where the DC60 value at for the drooped intake is higher than the axisymmetric intake. The steep increase in the DC60 (indicator of the separation onset) has shifted to a higher mass flow rate for the axisymmetric intake. It indicates that the flow in the drooped intake is prone to separation at a lower mass flow rate when compared to the axisymmetric intake. Nevertheless, it should be noted that the industrial intakes are generally drooped in order to accommodate for the installation effects of nacelle under the wing. Hence, the finding of drooped intake separating at a lower mass flow rate than the axisymmetric intake cannot be generalised, since the effect of wing is not considered in the current study.

Figure 6.
Drooped and axisymmetric cases: comparison of (a) and (b) DC60 at fan face.
The reason for an earlier separation and asymmetric contours for the drooped intake will be explored next. Figure 7 compares the mass flow distribution at the fan face for the drooped and axisymmetric intakes for (attached flow case). Fan-face is sub-divided into four quadrants as shown in the inset and the proportion of mass flow through each quadrant is estimated. Blue/red colours in the figure respectively represent a deficit/excess in the mass flow rates through each of the quadrants, and the percentage deviation from a uniform mass flow distribution is calculated as: .

Figure 7.
Distribution of mass flow at fan face quadrants for F3D drooped and axisymmetric viscous simulations, when (pie colours represent ).
For the axisymmetric case, equal mass flows through the quadrants I and IV. However, for the drooped intake, more mass flow through quadrant IV when compared to quadrant I. Hence, the flow experiences a higher acceleration and a stronger shock over the intake lip for the drooped case, thereby promoting earlier separation. Mass flow in quadrants II and III was relatively lower than that in I and IV respectively. This was attributed to the thicker boundary layers in quadrants II and III evident from a closer look at contours in Figure 6a(ii).
Despite these aforementioned differences between the drooped and axisymmetric intake, Figure 5 and Figure 6b have demonstrated a favourable agreement in the axial variation of ISM and corresponding distortion levels for both the intakes. Hence, the simplification of choosing an axisymmetric intake, to facilitate the extraction of a Q3D duct, is justified.
3.1.3. Full 3D Axisymmetric Intake–Inviscid Simulations
The boundary layers could potentially separate at high or low mass flow rates thereby hindering the extraction of the Q3D duct. Even if the flow is attached, the streamlines released closer to the intake and spinner walls fail to adhere to these surfaces due to the boundary layers. Hence, inviscid simulations are carried out on the axisymmetric intake to eliminate boundary layer effects and undesirable flow separation. No turbulence model is used for these simulations and the intake/spinner surfaces are treated as slip walls.
Figure 8 compares the axial variation of ISM for inviscid and viscous simulations. Viscous simulations in frames (b,c) remain attached while those in frames a and d show low-speed and high-speed separation respectively. For the attached cases, the ISM distribution from viscous and inviscid simulations are in excellent agreement. A noticeable mismatch can be observed for the separated cases (frames a and d) which was expected. Inviscid simulations should not produce any undesirable separation unless an artificial boundary layer develops due to artificial viscosity in the numerical scheme. Hence, it was reassuring to note that such undesirable separation is not observed and that the numerical schemes are robust. When compared to the viscous simulations, inviscid simulations in frames (a,d) also predict a higher ISM peak on the intake lip at . In the inviscid simulations, due to the absence of boundary layers, there is no scope for any low-speed or high-speed shock induced separation. Thus the flow accelerates to higher speeds on the intake lip in the absence of viscous effects.

Figure 8.
Axial variation of ISM for F3D axisymmetric viscous and inviscid simulations.
3.2. Quasi-3D Axisymmetric Duct
Previous sections demonstrated that, for , the simplifications (axisymmetric intake and elimination of viscosity) had minimal effect on the DC60 values and the ISM distributions on the intake lip. This corresponds to the case when the flow remains attached but close to the high-speed shock induced separation. In this section, a quasi-3D duct is extracted from the F3D axisymmetric inviscid result for . Subsequently, both inviscid and viscous simulations are carried out on the Q3D duct. Comparisons were made against the F3D to verify if the Q3D can reproduce similar trends at a substantially lower computational cost.
3.2.1. Extraction Procedure
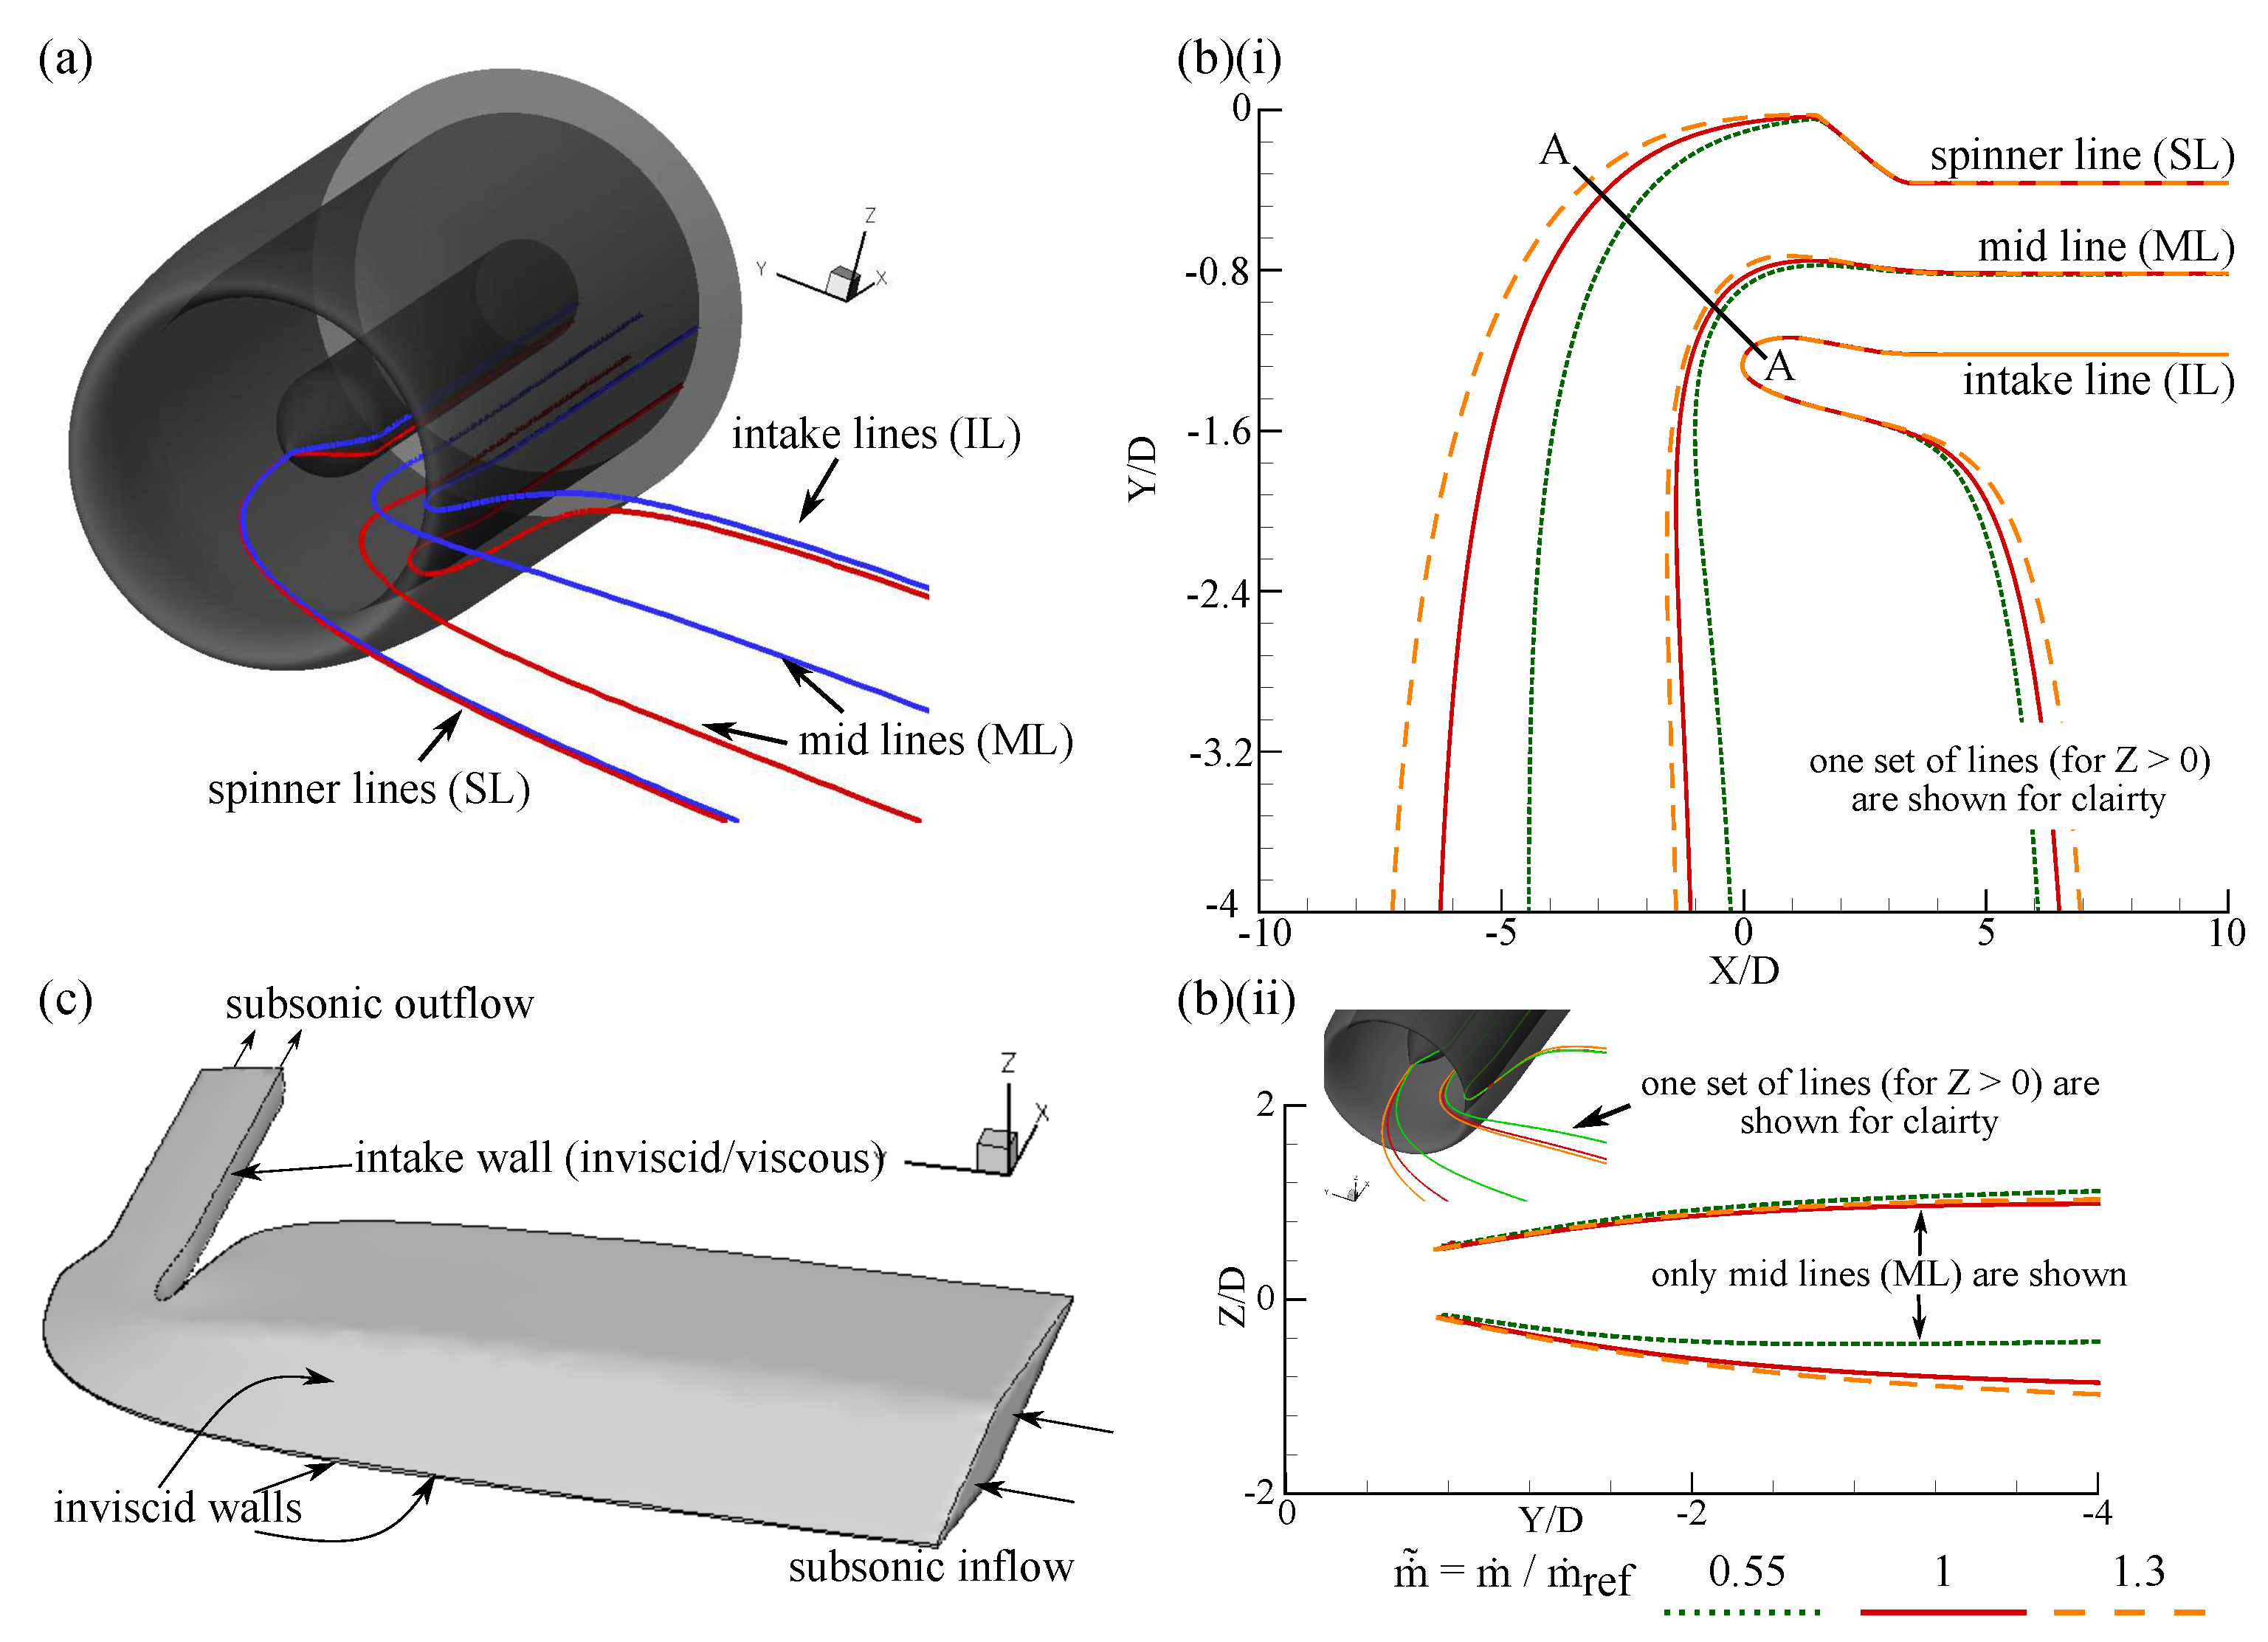
Firstly a 20° sector with the largest distortion at the fan-face has been identified. This corresponds to the ±10° on either side of the plane on the windward side of the axisymmetric intake. As shown in Figure 9a, a total of six streamlines were released from the engine exit and traced to the inlet of the computational domain. Of these, two streamlines were released on the spinner (spinner lines, SL), two on the intake (intake lines, IL) and the rest were released midway between the spinner and intake surfaces (mid lines, ML). These streamlines compose the Q3D streamtube of interest. The three dimensional streamtube contraction was crucial to achieve the appropriate lip loading, since it controls the local flow acceleration over the intake lip and the corresponding shock strength. Hence, it was prudent to qualitatively understand the variation of the captured streamtube with increasing engine . Figure 9b compares the captured streamtubes on and planes for ’s corresponding to low-speed separation, attached flow and high speed separation. With increasing mass flow, a clear increase in the cross-sectional area of the captured streamtube is evident from Figure 9b, specifically along the normal to the intake lip (marked as A-A in frame (b)(i)). For the scope of this project, the streamtube obtained for was chosen, since this corresponds to a highly realistic case close to high-speed shock induced separation.
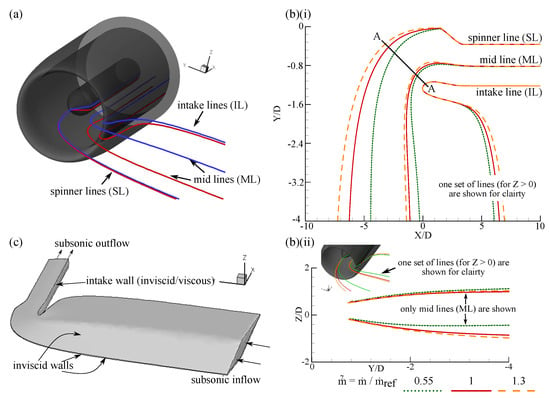
Figure 9.
(a) Captured streamtube for , for F3D axisymmetric intake; (b) captured streamtube at different mass flow rates; (c) 3D view of axisymmetric quasi-3D (Q3D) duct with corresponding Boundary Conditions (BCs).
For the case, 3D stereolithography (STL) surfaces are generated from the six streamlines as shown in Figure 9c. Hybrid meshing strategy is employed for Q3D grid with structured hexahedral elements around intake and unstructured tetrahedrons elsewhere. The near wall resolution was inline with that of F3D drooped intake. For the viscous simulations, SA turbulence model with wall-functions is used. Top and bottom walls of the Q3D duct are always treated as inviscid to avoid undesirable boundary layer growth. Intake lip was treated with inviscid or viscous boundary condition as discussed in the subsequent subsection.
As discussed above, a minimum of six streamlines were required to construct the Q3D duct. If more number of streamlines are considered, the cross-section of the Q3D duct at the inlet will be nearly elliptic (refer to the duct shape in Figure A1 which was extracted using ≈ 100 streamlines) unlike the rhomboidal shape in Figure 9a. Although increasing the number of streamlines can resolve the Q3D duct better, preliminary studies have shown that this has little effect on the cross-sectional area at section A-A, the corresponding streamtube contraction and intake lip loading. Streamtube contraction at the cross-section A-A (in Figure 9b) largely dictates the lip loading which can be accurately captured using six streamlines.
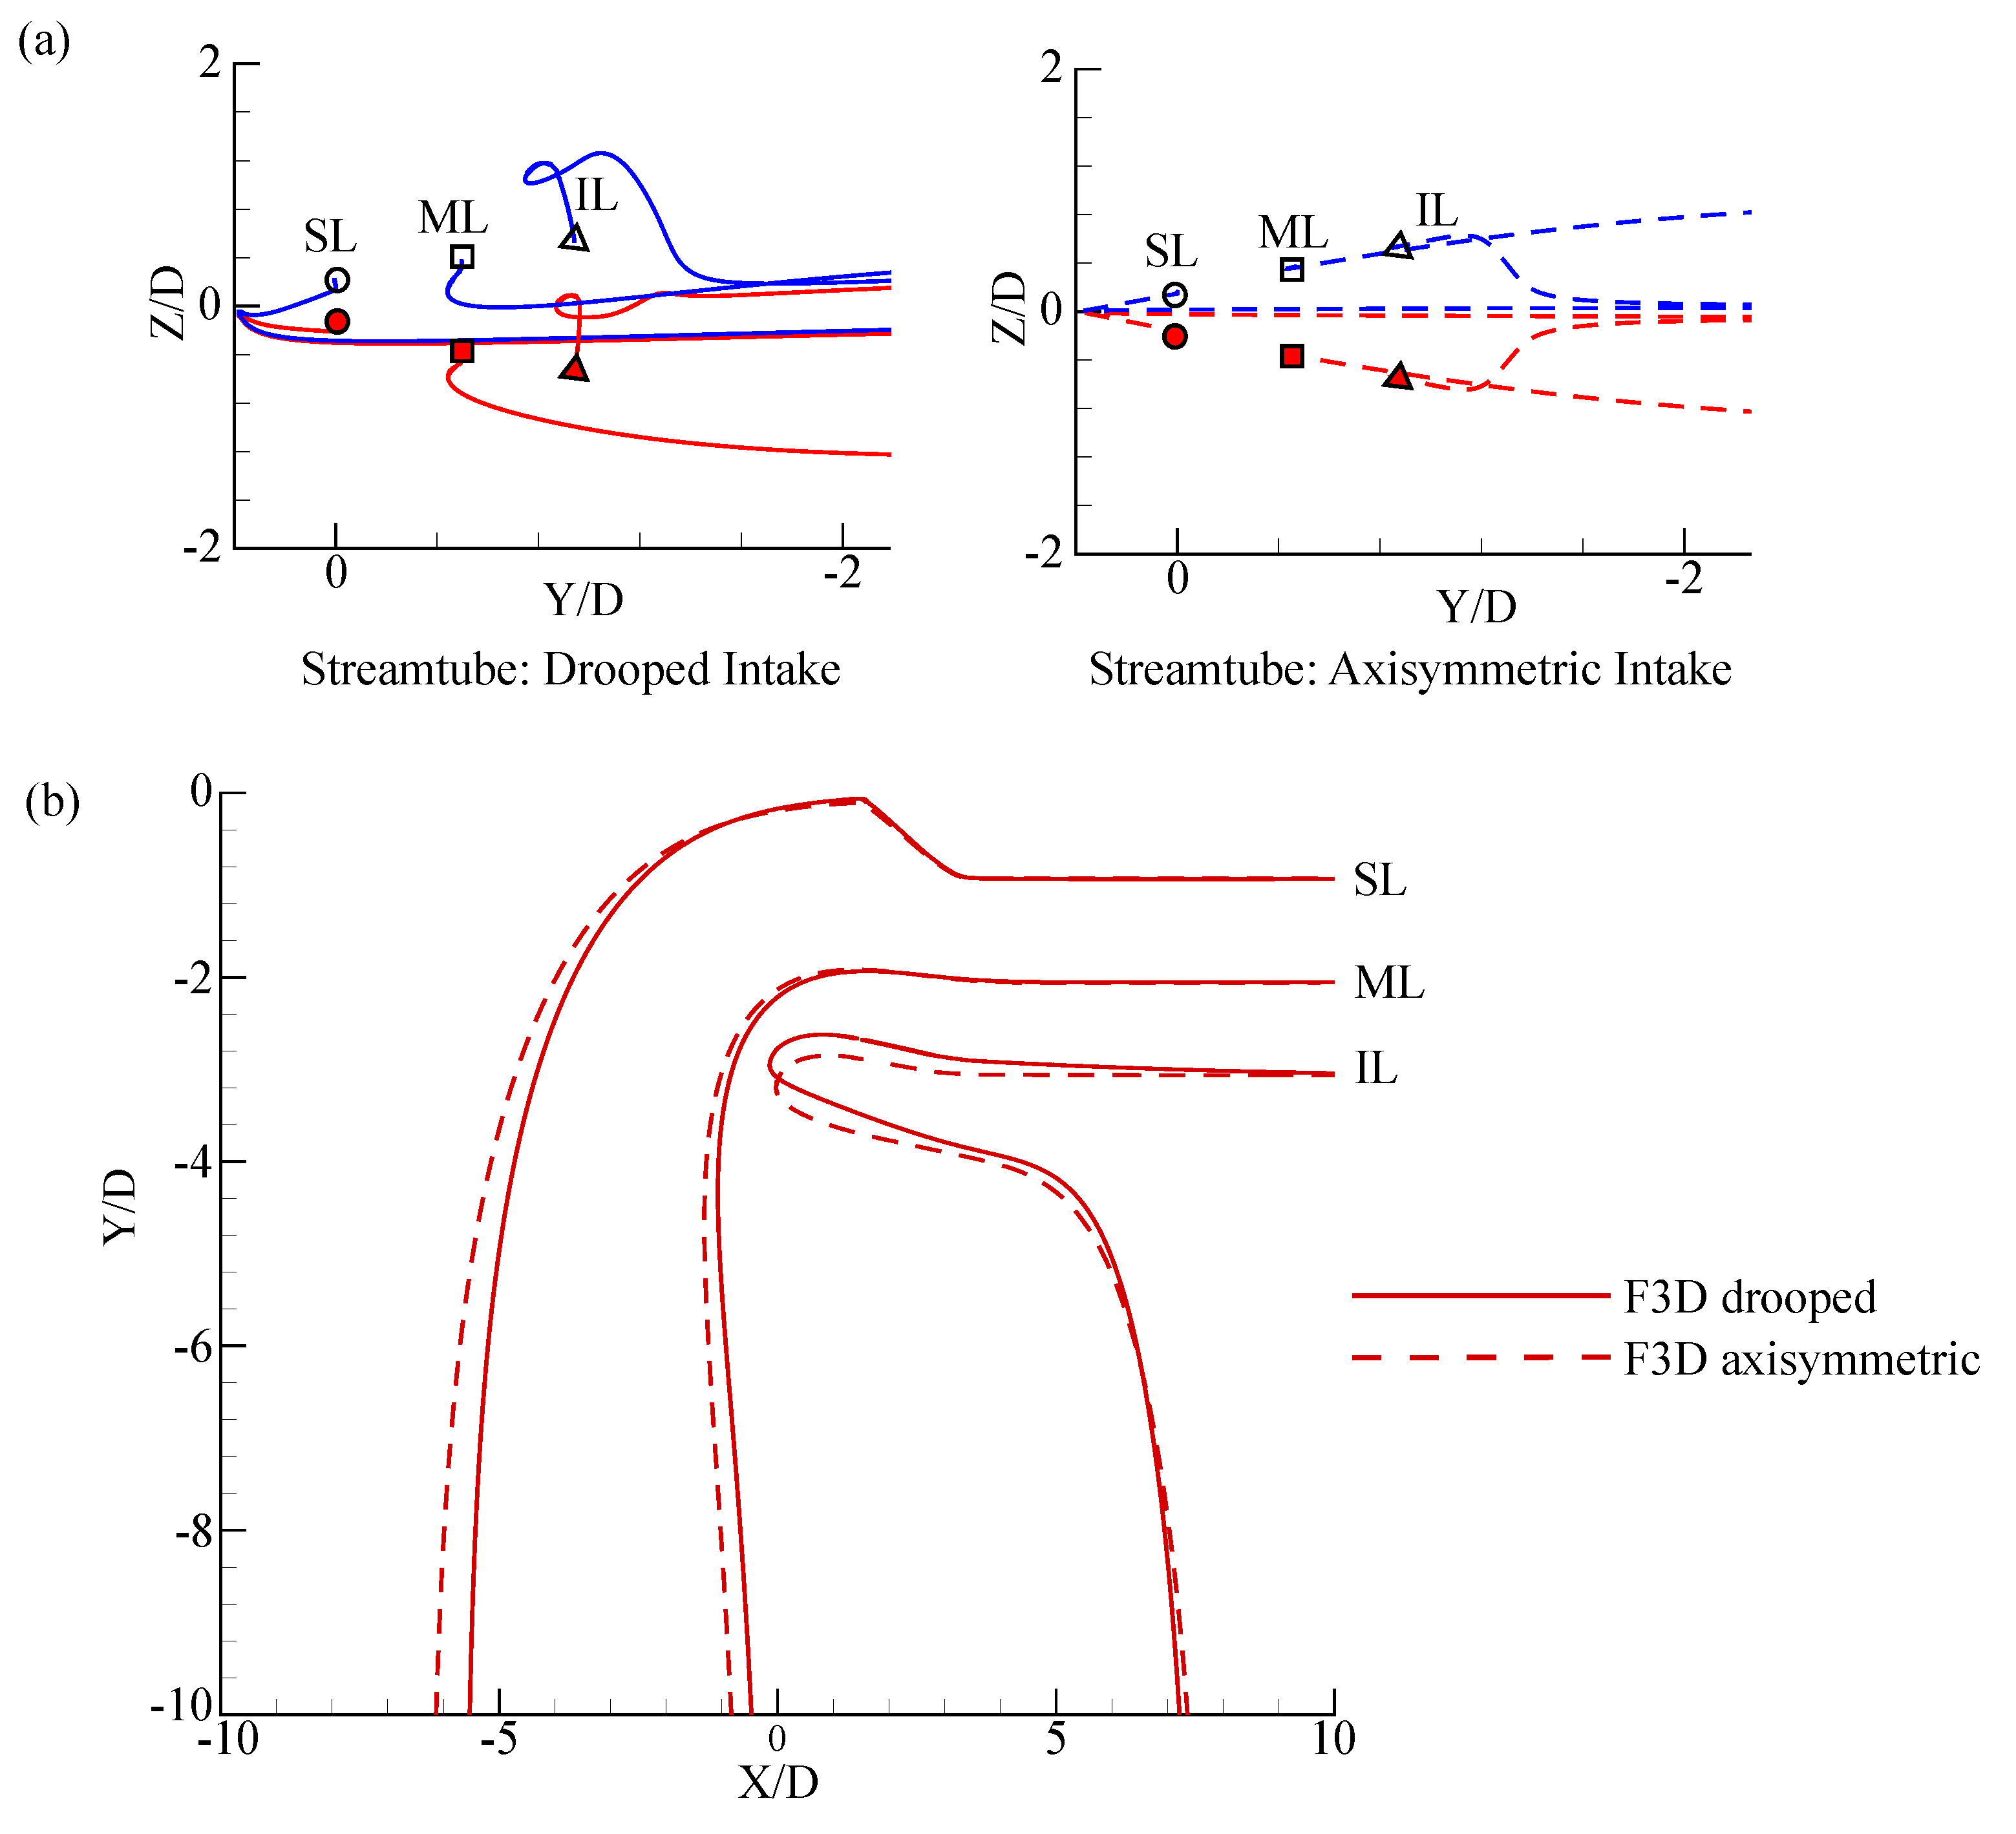
Figure 10a,b compare the complex streamtube pattern (IL,SL,ML) extracted from the real F3D drooped viscous case against the inviscid axisymmetric case on the and planes respectively. It is evident that the extracted streamlines are not symmetric about for the drooped case. Also, even in the absence of flow separation, it is impossible to extract streamlines for the viscous case that can entirely adhere to the intake surface due to the no-slip condition imposed on the wall. Hence, the assumptions made in the previous section are necessary to obtain a simplified streamtube which is capable of reproducing the trends. Nevertheless, inviscid drooped simulations can alleviate the q3d drooped duct extraction procedure to certain extent. This has been attempted and the results are presented in the Appendix A.
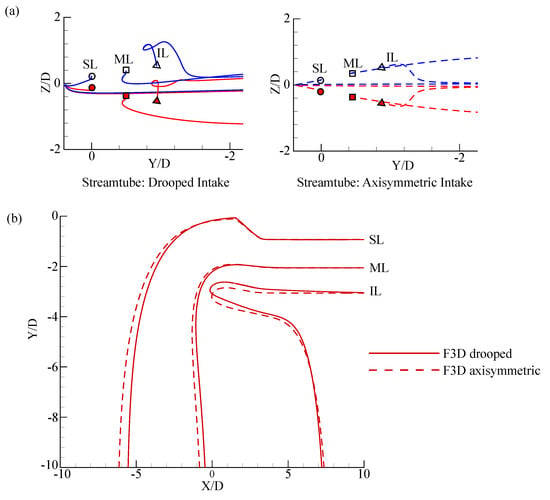
Figure 10.
F3D captured streamtubes for obtained from F3D drooped and axisymmetric simulations (a) in the plane; (b) in the plane.
3.2.2. Q3D Axisymmetric Duct Results—Comparison against F3D Simulations
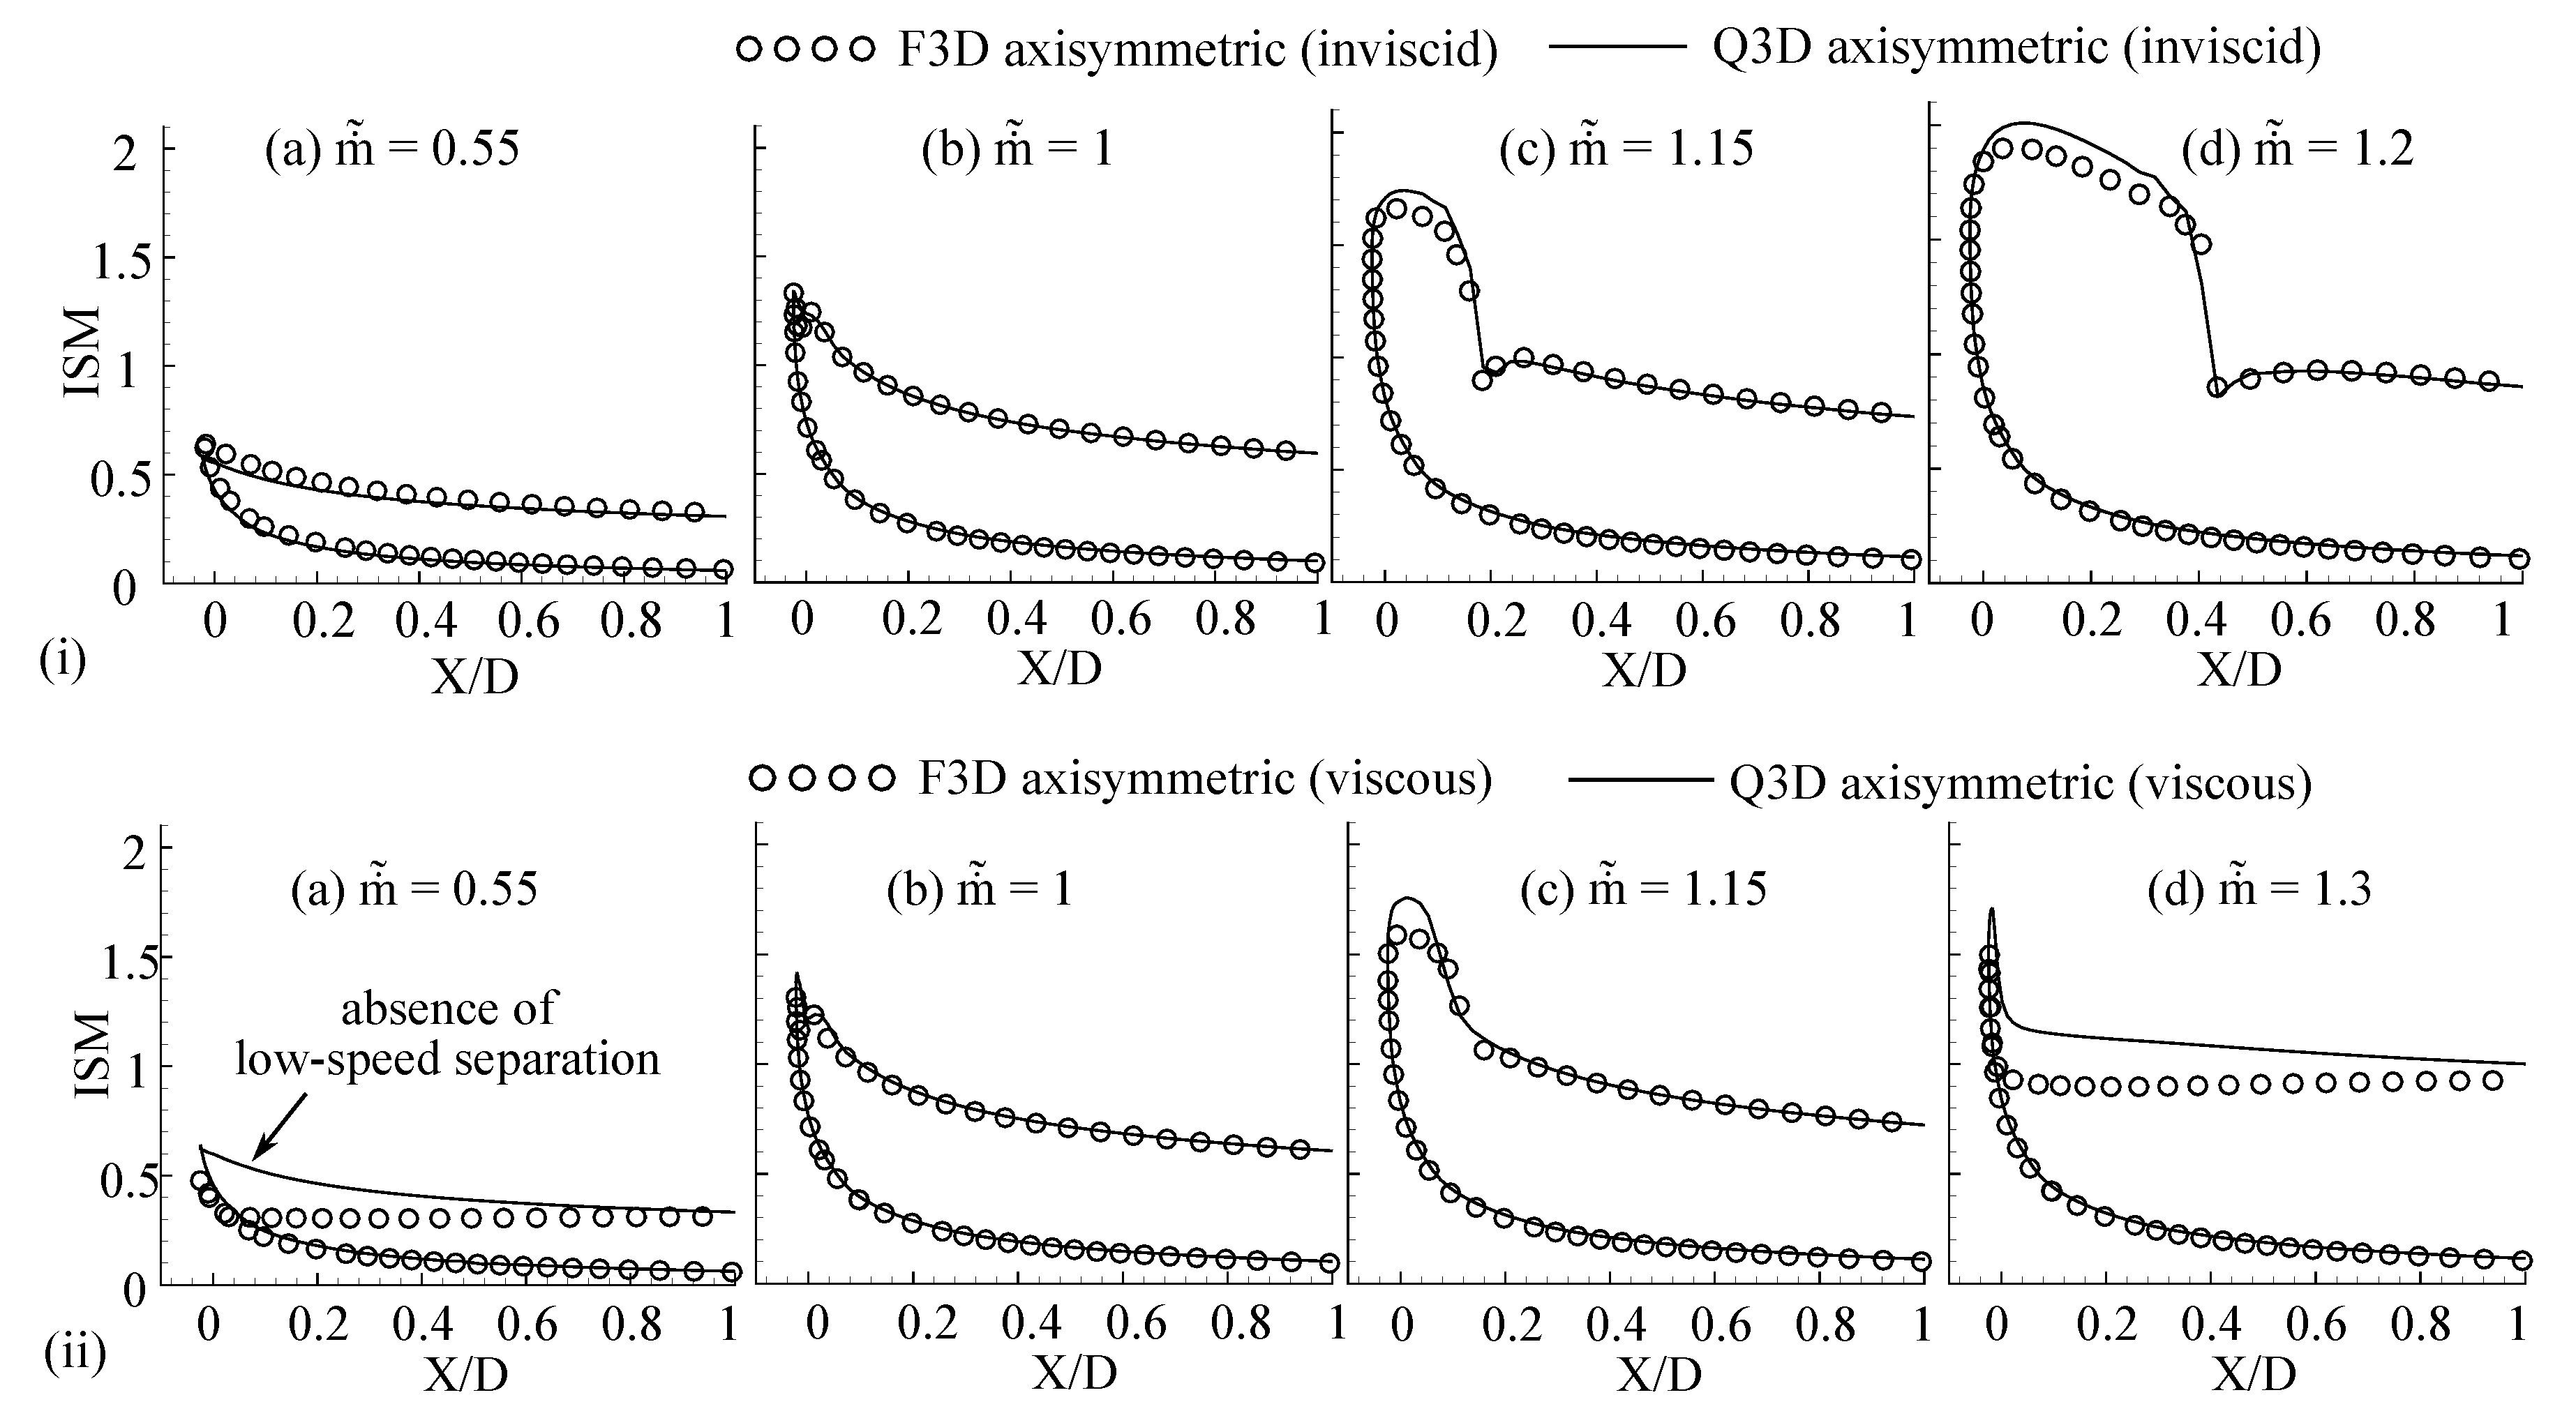
Simulations reported in this section are carried out on the Q3D duct by imposing (a) inviscid BC and (b) viscous no-slip BC on the intake lip. In addition, the averaged static pressure at the engine exit (recorded from the corresponding F3D simulations) is prescribed as the exit BC for the corresponding Q3D simulations. Figure 11(i,ii) compares the ISM distribution on the intake lip between the F3D axisymmetric intake and the Q3D duct. Frame (i) reports the results obtained using inviscid BC’s on the intake lip, while frame (ii) is obtained using viscous BC’s (and using turbulence model). Since the Q3D duct has been designed at , ISM distributions for the Q3D and F3D simulations are in excellent agreement at this mass flow rate. Discrepancies are observed when the deviates from the design value.
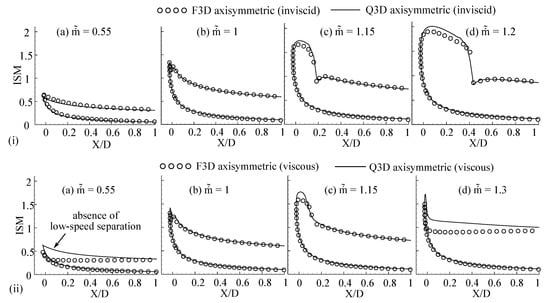
Figure 11.
Variation of ISM with axial distance for F3D axisymmetric and Q3D cases with (i) inviscid BC and (ii) viscous no-slip BC on the intake lip.
For the inviscid cases, the peak values of ISM from Q3D vary marginally: lower peaks for the case and higher peaks for the and cases. This was attributed to the fact that the shape of the Q3D duct was frozen in the current computations, and as a result its cross-sectional area normal to the intake lip was fixed (A-A in Figure 9b). However, recall from Figure 9a that the F3D simulations yielded a larger streamtube cross-section area at a higher engine mass flow, and vice-versa. Hence, when compared to the F3D, Q3D predicts a lower acceleration over the intake lip at lower () and vice versa (e.g., ).
For the viscous cases, similar observation can be made for , where the acceleration is marginally higher for Q3D (frame iic). However, case (frame iia) shows a higher peak for the Q3D simulations compared to F3D. Also, the absence of plateau in ISM distribution in Q3D simulations implies that the low-speed separation is not captured. As discussed before, this is attributed to the fact that the current Q3D duct shape (designed for ) is different from the streamtube at . Finally, at (frame iid), high-speed shock-induced separation is observed in the Q3D simulations, but the predicted lip loading deviates from the F3D results. Figure 12 compares the contours of stagnation pressure for the F3D and Q3D simulations at the fan-face, in a 20° sector with increasing engine mass flow rates. The Q3D simulations accurately predict the onset of high-speed shock-induced separation; however, it fails to reproduce the low speed separation. In addition, once separated, the distortion levels/patterns predicted by Q3D and F3D are different. Note that the endwalls of Q3D duct are treated as inviscid in the current study to avoid undesirable boundary layer growth from the inlet and this might impact the distortion pattern when the flow separates—additional studies are essential to address this.

Figure 12.
Comparison of stagnation pressure contours in a 20° sector at the fan face.
Figure 11b,c and Figure 12b demonstrate that the agreement between the F3D and Q3D is encouraging when the flow is attached or with modest level of separation. The results deviated beyond this limit. Nevertheless, it is worth noting that the simulations on Q3D duct are 50 times faster than the F3D. This speed up was primarily achieved due to the substantial reduction in the size of the computational domain and the grid. The computational time required to run an inviscid simulation at the design mass flow rate and extract the Q3D duct is also lower than the time required to run a F3D viscous simulation. To summarise, the current study shows the potential saving that can be achieved using Q3D strategy. It also, however, highlights the challenges of using Q3D strategy to (a) optimise the nacelle shapes (b) develop the lip rig experimental setup and (b) extrapolate the effects of flow control strategies from Q3D (lip rig) to F3D simulations, given the fact that the distortion patterns are largely different. To circumvent these challenges, it will be beneficial to explore additional strategies in the future, which include (a) employing multiple Q3D ducts at different or (b) alter the passing over the intake lip using bleed slots.
4. Conclusions
A numerical framework has been developed to simulate the effects of crosswind on the intake performance. The framework is demonstrated to be capable of capturing low speed separation, attached flow and high speed shock-induced separation with increasing . Interestingly, the drooped intake investigated in the current study is prone to earlier separation under crosswinds when compared to axisymmetric intake.
A quasi-3D duct extraction method from the F3D simulations has been developed. Results from the Q3D simulations are shown to largely reproduce the trends observed (ISM variations and high-speed separation behaviour) in the 3D intake at a substantially lower computational cost. The simulations on Q3D duct are 50 times faster than the F3D.
Although the quasi-3D strategy reproduces the key trends, it is found that the captured streamtube shape (and hence the Q3D duct shape) changes with the corresponding mass flow rate. The agreement between the F3D and Q3D simulations is encouraging when the flow is attached or with modest level of separation. The results deviate beyond this limit. For example, the duct used in the current study failed to capture the low speed separation. When the flow is separated, the distortion levels also differ in magnitude. Hence, sufficient care has to be taken when (a) designing the lip rig experimental setup and (b) extrapolating the effects of flow control strategies from lip rig to F3D simulations.
Author Contributions
Conceptualisation, supervision and administration N.R.V. and T.H. Investigation, formal analysis, original draft preparation A.Y. and N.R.V., review and editing N.R.V. and T.H., validation and software S.S. and N.R.V.
Funding
This research received no external funding while the APC was funded by Euroturbo.
Acknowledgments
The computational work for this project is carried out on the Darwin HPC facility at the University of Cambridge. The authors also wish to acknowledge the computational time granted on ARCHER (UK Supercomputing facility) via the EPSRC RAP call of spring 2017.
Conflicts of Interest
The authors declare no conflict of interest.
Nomenclature
| D | Nacelle lip thickness |
| Distortion coefficient | |
| Mass flow rate | |
| Reference mass flow rate | |
| Normalised mass flow rate, | |
| p | Static pressure |
| Stagnation pressure | |
| q | Dynamic pressure |
| Distance in wall units | |
| Isentropic Mach Number | |
| Quasi 3D | |
| Full 3D | |
| Spalart-Allmaras model | |
| Boundary Condition |
Appendix A
Appendix Q3D Drooped Duct Extraction
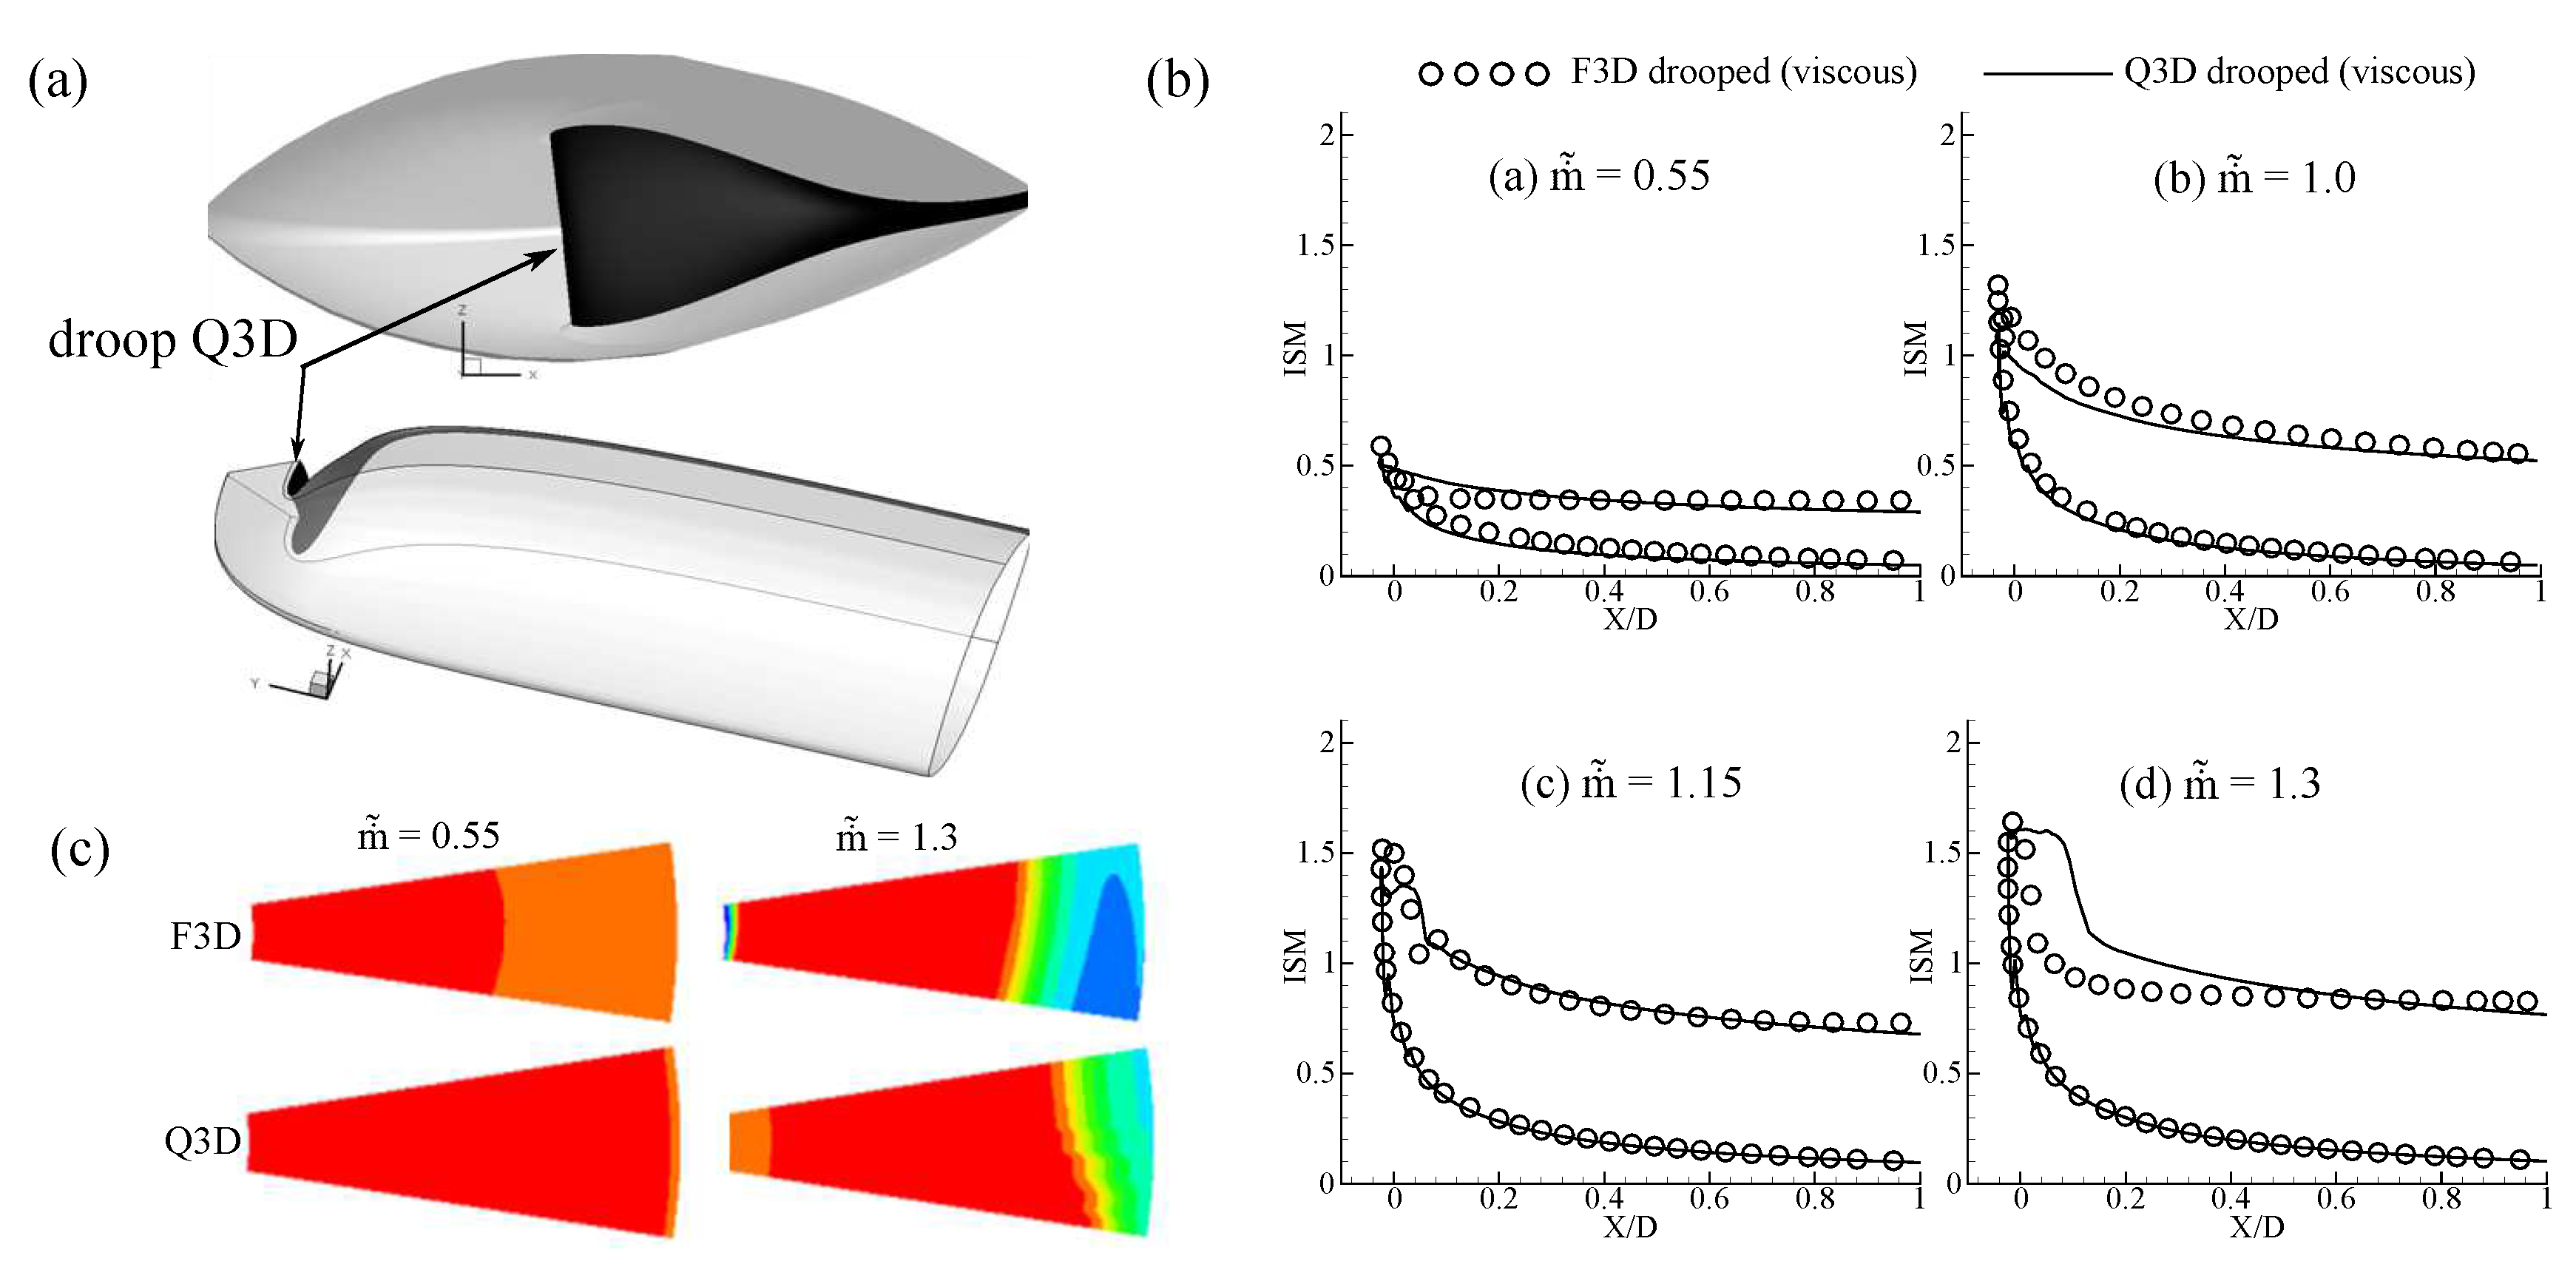
A strong asymmetry is the baseline for all industrial intakes which accommodate for the installation effects of nacelle under the wing. Geometrical effects of varying nacelle lip thickness and droop can have non-trivial impact on flow behaviour. Despite the difficulties mentioned in Section 3.1.1, attempts are made to generate a Q3D duct with these real features from F3D drooped intake using the similar extraction method described in Section 3.2. Figure A1a shows the extracted duct and Figure A1b,c show the axial variation of ISM and contours of . ISM plots of F3D and Q3D agree favourably for and . Consistent with the observations on Q3D symmetric duct, deviations are observed for lower or higher mass flow rates from operating point. Q3D drooped duct also failed to capture low speed separation. Further investigations will be carried out to alleviate these Q3D deficiencies.
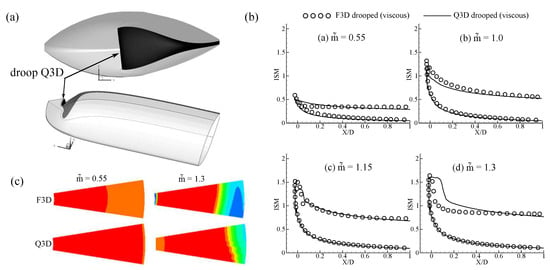
Figure A1.
(a) Q3D drooped duct (b) ISM and (c) contours for F3D, Q3D drooped cases.
Figure A1.
(a) Q3D drooped duct (b) ISM and (c) contours for F3D, Q3D drooped cases.
References
- Peters, A.; Spakovszky, Z.S.; Lord, W.K.; Rose, B. Ultrashort nacelles for low fan pressure ratio propulsors. J. Turbomach. 2015, 137, 021001. [Google Scholar] [CrossRef]
- Vadlamani, N.R.; Cao, T.; Watson, R.; Tucker, P.G. Towards Future Installations: Mutual Interactions of Short Intakes with Modern High Bypass Fans. J. Turbomach. 2019, 141, 081013. [Google Scholar] [CrossRef]
- Seddon, J.; Goldsmith, E.L. Intake Aerodynamics; AIAA Education Series; American Institute of Aeronautics and Astronautics: Washington, DC, USA, 1999. [Google Scholar]
- Wakelam, C.T.; Hynes, T.P.; Hodson, H.P.; Evans, S.W.; Chanez, P. Separation Control for Aeroengine Intakes, Part 1: Low-Speed Investigation of Control Strategies. J. Propuls. Power 2012, 28, 758–765. [Google Scholar] [CrossRef]
- Vadlamani, N.R.; Tucker, P.G. Eddy Resolving Simulations of Intake Under Crosswinds. In Direct and Large-Eddy Simulation XI; Springer: Berlin, Germany, 2019; pp. 523–529. [Google Scholar]
- Freeman, C.; Rowe, A.L. Intake Engine Interactions of a Modern Large Turbofan Engine. In Volume 1: Aircraft Engine; Marine; Turbomachinery; Microturbines and Small Turbomachinery; ASME: Indianapolis, IN, USA, 7–10 June 1999; p. V001T01A007. [Google Scholar]
- Hall, C.A.; Hynes, T.P. Measurements of Intake Separation Hysteresis in a Model Fan and Nacelle Rig. J. Propuls. Power 2006, 22, 872–879. [Google Scholar] [CrossRef]
- Colin, Y.; Aupoix, B.; Boussuge, J.; Chanez, P. Numerical Simulation of the Distortion Generated by Crosswind Inlet Flows. In Proceedings of the 8th International Symposium on Experimental and Computational Aerothermodynamics of Internal Flows, Lyon, France, 2–5 July 2007. [Google Scholar]
- Murphy, J.; MacManus, D. Ground vortex aerodynamics under crosswind conditions. Exp. Fluids 2011, 50, 109–124. [Google Scholar] [CrossRef]
- Carnevale, M.; Green, J.S.; Di Mare, L. Numerical Studies into Intake Flow for Fan Forcing Assessment. In Proceedings of the ASME Turbo Expo 2014, Dusseldorf, Germany, 16–20 June 2014. [Google Scholar]
- Wakelam, C.T. Aero Engine Intake Separation Control. Ph.D. Thesis, University of Cambridge, Cambridge, UK, 2009. [Google Scholar]
- Wakelam, C.T.; Hynes, T.P.; Hodson, H.P.; Evans, S.W.; Chanez, P. Separation Control for Aeroengine Intakes, Part 2: High-Speed Investigations. J. Propuls. Power 2012, 28, 766–772. [Google Scholar] [CrossRef]
- Vadlamani, N.R.; Tucker, P.G. Intake lip separation control using plasma actuators. In Proceedings of the 16th International Symposium on Transport Phenomena and Dynamics of Rotating Machinery, Honolulu, HI, USA, 10–15 April 2016. [Google Scholar]
- Oriji, U.R.; Tucker, P.G. Modular Turbulence Modeling Applied to an Engine Intake. J. Turbomach. 2013, 136, 051004. [Google Scholar] [CrossRef]
- Spalart, P.R.; Rumsey, C.L. Effective inflow conditions for turbulence models in aerodynamic calculations. AIAA J. 2007, 45, 2544–2553. [Google Scholar] [CrossRef]
- Cao, T.; Vadlamani, N.R.; Tucker, P.G.; Smith, A.R.; Slaby, M.; Sheaf, C.T. Fan–Intake Interaction Under High Incidence. J. Eng. Gas Turbines Power 2016, 139, 041204. [Google Scholar] [CrossRef]
- Ma, Y.; Vadlamani, N.R.; Cui, J.; Tucker, P. Comparative Studies of RANS Versus Large Eddy Simulation for Fan–Intake Interaction. J. Fluids Eng. 2019, 141, 031106. [Google Scholar] [CrossRef]
- Kalitzin, G.; Medic, G.; Iaccarino, G.; Durbin, P. Near-wall behavior of RANS turbulence models and implications for wall functions. J. Comput. Phys. 2005, 204, 265–291. [Google Scholar] [CrossRef]
- Watson, R. Large Eddy Simulation of Cutback Trailing Edges for Film Cooling Turbine Blades. Ph.D. Thesis, University of Cambridge, Cambridge, UK, 2013. [Google Scholar]
© 2019 by the authors. Licensee MDPI, Basel, Switzerland. This article is an open access article distributed under the terms and conditions of the Creative Commons Attribution (CC BY-NC-ND) license (https://creativecommons.org/licenses/by-nc-nd/4.0/).

