Article

Body Force Modeling of the Aerodynamics of a Low-Speed Fan under Distorted Inflow

by
Emmanuel Benichou
1,*,‡,
Guillaume Dufour
1,‡,
Yannick Bousquet
1,‡,
Nicolas Binder
1,‡,
Aurélie Ortolan
2,‡ and
Xavier Carbonneau
1,‡
1
ISAE-SUPAERO, Université de Toulouse, 31013 Toulouse, France
2
ALTRAN Technologies, 31700 Blagnac, France
*
Author to whom correspondence should be addressed.
This paper is an extended version of our paper published in Proceedings of the European Turbomachinery Conference ETC13, Lausanne, Switzerland, 8–12 April 2019, Paper No. 440.
These authors contributed equally to this work.
Int. J. Turbomach. Propuls. Power 2019, 4(3), 29; https://doi.org/10.3390/ijtpp4030029
Submission received: 27 May 2019 / Revised: 1 August 2019 / Accepted: 13 August 2019 / Published: 21 August 2019

Abstract

:
New propulsive concepts, such as boundary layer ingestion, involve stronger interactions between the engine and its environment, and are thus more complex flows compared to classical architectures. Usual turbomachinery design tools are inadequate, and new numerical methodologies are needed to accurately predict the engine performance with affordable CPU resources. The present paper examines the relevance of a reduced-order modeling approach—the body force modeling (BFM) method—for a low-speed cooling fan with inflow distortion. The formulation itself accounts for the blade metal blockage and compressibility effects, and it relies on a semiempirical loss model, independent of computational fluid dynamics (CFD) calibration. The BFM results obtained in the present work are assessed against full-annulus unsteady Reynolds-averaged Navier-Stokes (URANS) results and experiments. The comparison shows that the BFM approach successfully quantifies the fan stage performance. Furthermore, the distortion transfer across the stage is examined and the flow patterns observed are found to be the same as in the URANS results and in the measurements. Hence, this methodology, coming at a low CPU cost, is well-adapted to the early design phase of an innovative propulsion system.

1. Introduction

Further reducing the environmental impact of aviation requires the investigation of new aircraft architectures, among which embedded propulsion is a promising solution. Also known as boundary layer ingestion (BLI), this approach increases the overall propulsive efficiency and potentially offers significant power savings, for instance, up to 8.6% according to Uranga et al. [1].
With BLI, the fan constantly operates under severely distorted inflow conditions, with large variations in the upstream total pressure and swirl angle, among other quantities. This can have a strong impact on the fan performance, and correctly capturing the mass flow and work spatial redistributions across the blade row currently represents a challenge. Distortion transfer predictions across the stage are also important with respect to the performance of downstream components. This emphasizes the need to accurately estimate the performance of the different engine components as early as possible in a pre-design cycle. Full-annulus 3D unsteady computational fluid dynamics (CFD) simulations can be seen as a reference method to capture the aerodynamics of such flows, but the cost of this approach still remains prohibitive for early design phases. Because of time and CPU cost, even with current conventional architectures, the coupling between air intake and fan designs still relies on global distortion 0D indicators ( D C 60 is the most widely used) or, at best, 1D azimuthal flow variations. Some certification aspects such as cross-wind during take-off or ground vortex ingestion during taxiing remain very challenging. Thus, despite major advances in CFD over the last years, the interest of engine designers for low-cost and robust methods is growing, especially in order to tackle innovative propulsive configurations.
In the present paper, we examine the accuracy of a reduced-order modeling approach: the body force modeling (BFM) method. By using source terms to reproduce the passage-averaged effect of the blades on the flow, without actually meshing the blades, this method enables simulating a full-annulus stage configuration under distorted inflow with a steady approach and reduced mesh size, therefore drastically reducing the cost of the simulation. Another advantage of this method is that by using the volumic force field in the bladed areas, a fan designer can exchange data with a nacelle or an aircraft designer without involving any geometry, so that the source terms can be seen as a more direct way to communicate between partners.
The BFM approach has already been applied to BLI propulsor configurations in the literature, but some open questions remain. Hall et al. [2] used the BFM method to predict the flow in the low speed fan studied by Gunn & Hall [3], with validation against experimental results. However, their approach is purely inviscid, and their body force formulation does not model losses but uses a diffusion factor instead as a surrogate measure to efficiency. Kim & Liou [4] studied the N3-X hybrid wing configuration with a body force model that accounts for off-design losses, relying on a significant calibration process. They show good agreement with full annulus reference calculations, but validation against experimental data is not available. In this context, the main goal of the present paper is to assess a body force formulation that includes loss modeling but with minimum calibration, and to validate the results against reference unsteady calculations as well as experimental measurements.
First, the test case is presented: it is a low-speed cooling fan, for which experimental data are available with and without inflow distortion. Next, the numerical methods and the BFM model are described. Global performance are then validated against experimental data. Finally, inlet distortion simulations are analyzed. The agreement of the BFM and full-annulus unsteady RANS is very satisfactory, with only 3% discrepancy in terms of pressure ratio or isentropic efficiency. Downstream of the rotor, some differences with the experimental data are found close to the hub, but at higher spanwise locations, experimental and numerical results match fairly well. Downstream of the stator, the flow topology is also found to be reproduced by the BFM simulations.

2. Test Case

2.1. Test Rig

The test case is a low-speed cooling fan stage, designed and produced by Safran Ventilation Systems (Blagnac, France), mainly used to regulate the temperature of heat exchangers when the aircraft is on the ground. A 3D view of the fan stage is shown in Figure 1 and its main characteristics are given in Table 1.
Following the framework proposed by Binder et al. [6] for windmilling studies, the flow and loading coefficients, expressed at a mean quadratic radius (Equation (1)), are used to assess the performance of the stage. Furthermore, a reduced flow coefficient is defined in the following according to Equation (4), where the flow coefficient is referred to the free windmilling condition ϕ ^ P .
r ^ = r h u b 2 + r s h r o u d 2 2
ϕ ^ = V z U r = r ^
ψ ^ = Δ h t U 2 r = r ^
ϕ ^ = ϕ ^ ϕ ^ P
The experimental measurements are carried out in the Département Aérodynamique Energétique et Propulsion (DAEP) of ISAE-SUPAERO. More details can be found in Ortolan’s PhD [5]. Two different configurations are used:
  • Where the test rig is equipped with an asynchronous electric engine, which is located far from the test sections; this configuration corresponds to uniform upstream flow conditions (Figure 2, left).
  • Where another electric engine is inserted in the fan body, so that there is no shaft outside of the body and distortion grids can be placed upstream of the fan stage in order to create nonuniform flow conditions (Figure 2, right).

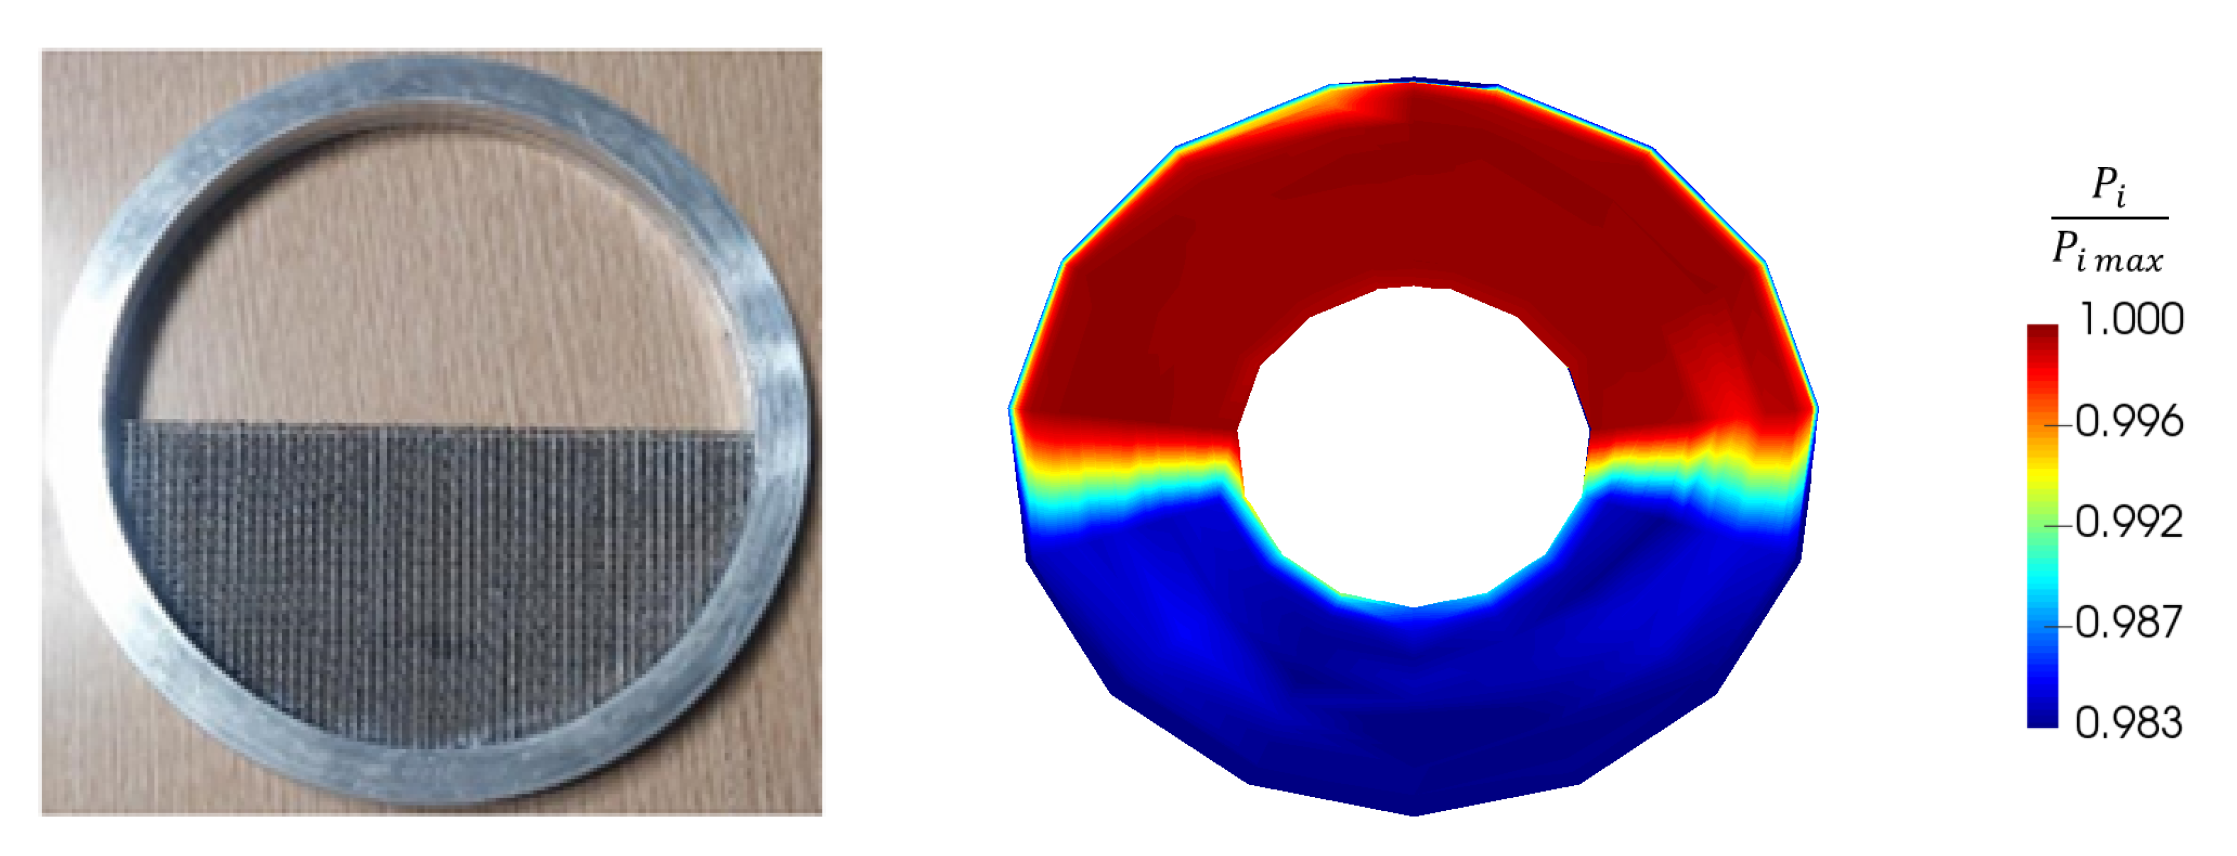
2.2. Distortion Grid

In order to keep the distortion pattern simple, a single porosity grid with regular 1 mm sidewise cells is chosen to ensure two uniform 180 zones (Figure 3). This grid is inserted between the bellmouth and the instrumented section, close to Plane 1 location, and is approximately three times the fan chord length upstream from Section 2 (Figure 2, right). The CFD results indicate that the distance between Section 1 and Section 2 is sufficient to insure that the potential effects of the fan and front bulb are negligible in the vicinity of the grid.

2.3. Instrumentation

Detailed information about the sensors used in this study can be found in Ortolan et al. [7]. Although no global measurement is available with distortion, local measurements are available in Section 2 and Section 3 (Figure 2, right). They consist of 15 equally spaced azimuthal positions over the annulus (every 24 ), which are obtained by rotating the distortion grid relatively to the probe position. For each azimuthal position, 15 radial measurements are carried out using five-hole probes.
A repeatability study carried out on the global steady-state experimental data for load-controlled windmilling showed that the measurement uncertainties due to the instrumentation are lower than the fluctuations inherent to this operating condition. The same conclusion applies to the local measurements coming from the five-hole probe located at rotor outlet. Thus, considering the most unfavorable uncertainty source, this repeatability error is considered in the following.

3. Numerical Setup

A meridional view of the numerical domain is shown in Figure 4. Two different types of simulations are used: unsteady full-annulus RANS simulations and BFM simulations. This section gives the numerical parameters used in each case.

3.1. URANS Simulations

URANS simulations are carried out with the elsA software, a cell-centered finite volume solver [8]. A multiblock structured mesh is used, comprised of approximately 60 million cells for the full-annulus domain. It is the result of a mesh independence study carried out on a more demanding operating point with flow separation, corresponding to load-controlled windmilling with ϕ ^ = 2 . 0 . The mesh comprises 1.9 Mpoints per rotor passage and 1.1 Mpoints per stator passage; the rotor tip gap is discretized with 29 points in the radial direction. The total quantities are imposed at the inlet as well as the absolute velocity direction, which is purely axial. A throttle condition with radial equilibrium is used at the outlet. All of the walls are considered to be adiabatic and the first cell size is set to 5 μm, which ensures Δ y + 1 . The one-equation turbulence model of Spalart–Allmaras is adopted, according to previous RANS simulations on this configuration which showed a satisfactory behavior compared to experimental data. Since no hot wire measurement is available upstream of the fan stage, a value of 1 is imposed for the μ t μ ratio at the inlet, which is typical of internal flows. The convective fluxes are calculated using a second-order centered scheme.
An implicit second-order Gear scheme with the dual time-stepping (DTS) method is employed for time integration, with a maximum of 20 subiterations per timestep or a decrease in residuals of two orders of magnitude. After a timestep convergence study, the number of timesteps per revolution is chosen equal to 2 N R N S , i.e., 782, which is in line with in-house best practice, with regard to the compromise between CPU resources and time precision. This number of timesteps—46/34 per rotor/stator blade passing period, respectively—is enough to accurately capture the first BPF harmonic [9]. Figure 5 shows the normalized pressure coefficient at LE and at TE of the rotor coming from unsteady experimental measurements (in black) and the equivalent probe signal extracted from a URANS simulation (in blue), for Ω = 9500 rpm and ϕ ^ = 0 . 66 .

3.2. Body Force Methodology

Initially introduced by Marble [10], the concept of BFM has been successively developed in later works [11] and used to address various problems such as fan–intake interaction in short nacelles [12], BLI distortion, or even acoustics [13]. The basic principle of this method consists of modeling the forces exerted by the blades on the fluid instead of directly simulating the flow around the complete three-dimensional geometry. With this approach, the bladed areas are replaced by source terms (red area in Figure 6) and the effect of the blades on the flow are usually decomposed into two different contributions:
  • A force normal to the relative flow field, f n , which is responsible for the turning.
  • A force parallel to the relative flow field, f p , which generates losses.
The main advantages of the BFM method are the following.
  • The 3D mesh is simply obtained by extruding a 2D meridional mesh in the azimuthal direction; not meshing the boundary layers around the blades yields a very low cell count.
  • More importantly, this method enables one to deal with distorted inflow while keeping a steady resolution, which considerably decreases the associated CPU cost.
  • Finally, the general formulation is very flexible since the expressions of f n and f p are user-defined and can easily be adapted to the problem at hand. The local definition of the two force components also lets some room for extra calibrations, which can rely either on preliminary BFM simulations or on more accurate RANS results.
The BFM formulation retained in the present originates from Thollet’s work [14]. It is adapted from Hall’s model [2] and contains three main modifications compared to the original modeling:
  • Metal blockage effects are added according to Equation (5).
  • A compressibility correction in the normal force definition was added. It has no visible effect in the present case, given the low pressure ratio involved. However, this correction has proven to be valuable in transonic configurations according to Thollet’s work [14].
  • A parallel force is also introduced, in order to account for the loss without any exterior data input. This term only relies on a local friction coefficient C f , derived from an empirical turbulent flat plate correlation, and a local chordwise Reynolds number R e z . Of course, no specific phenomenon is expected to be captured, such as an endwall corner separation or shock wave–boundary layer interaction.
This loss model can be completed by an additional calibration coming either from blade or preliminary BFM CFD calculations, which corrects the loss amount by taking into account the flow deviation. This “off-design” term implies choosing a reference operating point from which the distribution of deviation δ is extracted. The main effect of this term is to steepen the performance curve in high and low mass flow rate regions, near choke and surge, respectively. As explained in the following, only the basic friction contribution ( 2 C f term alone in f p definition) is kept for the present study.
b = θ P S θ S S 2 π / N
δ = arcsin W · n | | W | |
f n = K m a c h 2 π δ 0 . 5 W 2 s b | n θ |
f p = 0 . 5 W 2 s b | n θ | ( 2 C f + 2 π K m a c h ( δ δ r e f ) 2 )
where K m a c h = m i n ( 1 1 M r e l 2 , 3 ) if   M r e l < 1 m i n ( 4 2 π M r e l 2 1 , 3 ) if   M r e l > 1
C f = 0 . 0592 R e z 0 . 2
R e z = ρ W z μ
BFM simulations are performed with the unstructured solver of the Fine/OpenTM package of Numeca. The mesh itself is created in IGGTM and then converted to an unstructured format in HEXPRESSTM. An azimuthal step of 1 is chosen to extrude the 2D meridional mesh, which leads to 2 × 10 5 cells over a 5 angular sector for the clean case, and approximately 21 million cells over 360 with distortion. The BFM mesh follows the same Δ y + criterion as the URANS mesh at the endwalls. The same inlet conditions are imposed, as goes for the turbulence modeling. At the outlet, the mass flow value is imposed by adapting the static pressure and a radial equilibrium is prescribed. A second-order Roe scheme is used to compute the convective fluxes and a Runge–Kutta scheme with implicit residual smoothing is used with a CFL number of 1000 for pseudo-time integration.
Managing the blade blockage at the LE and TE of the blade rows (going from b = 1 to b < 1 and vice versa) proves to be critical, in the sense that the transition can cause mass flow conservativity issues. It has been observed in the course of previous studies that using buffer cells at these boundaries can significantly improve the solution. The numerical implementation of the blockage coefficients is described in Figure 7.
The OpenLabsTM feature of Fine/OpenTM enables implementing BFM source terms in the right-hand side of the Navier–Stokes equations. As the solver is unstructured, all geometric inputs (blade normal vector components n z , n r , n θ , blade metal blockage, and its derivatives b, b z , and b r ) are calculated in a preprocessing step, and then interpolated as (z, r) crossed polynomials.

3.3. Numerical Distortion

As explained previously, the objective of this work is to evaluate the BFM capacity to deal with nonuniform flows. The distortion pattern is voluntarily chosen as simple as possible: it consists of a uniform 180 zone of 1 . 7 % total pressure deficit, i.e., P i m i n P i m a x = 0 . 983 (Figure 3). As already mentioned, this value is measured experimentally in Section 2, which is very close to the rotor LE (approximately 5 mm), and thus makes it impossible to impose numerically inlet boundary conditions at this location. Consequently, without information about the upstream flow conditions in Section 1, it is hypothesized that between Section 1 and Section 2 total pressure variations can be neglected, and a similar distortion pattern is imposed as a 2D ( r , θ ) P i map at the inlet of the numerical domain of both the URANS and BFM simulations.
Since the distortion is fixed in the absolute frame, the inlet blocks of the URANS simulations are nonrotating, and a sliding mesh is introduced shortly downstream of the inlet in order to ensure the transfer of the distortion to the rotor blocks. On the other hand, in the BFM case, the additional source terms are expressed in the absolute reference frame, so that no particular interface is needed.

4. Results and Analysis

4.1. Validation of BFM in the Clean Case

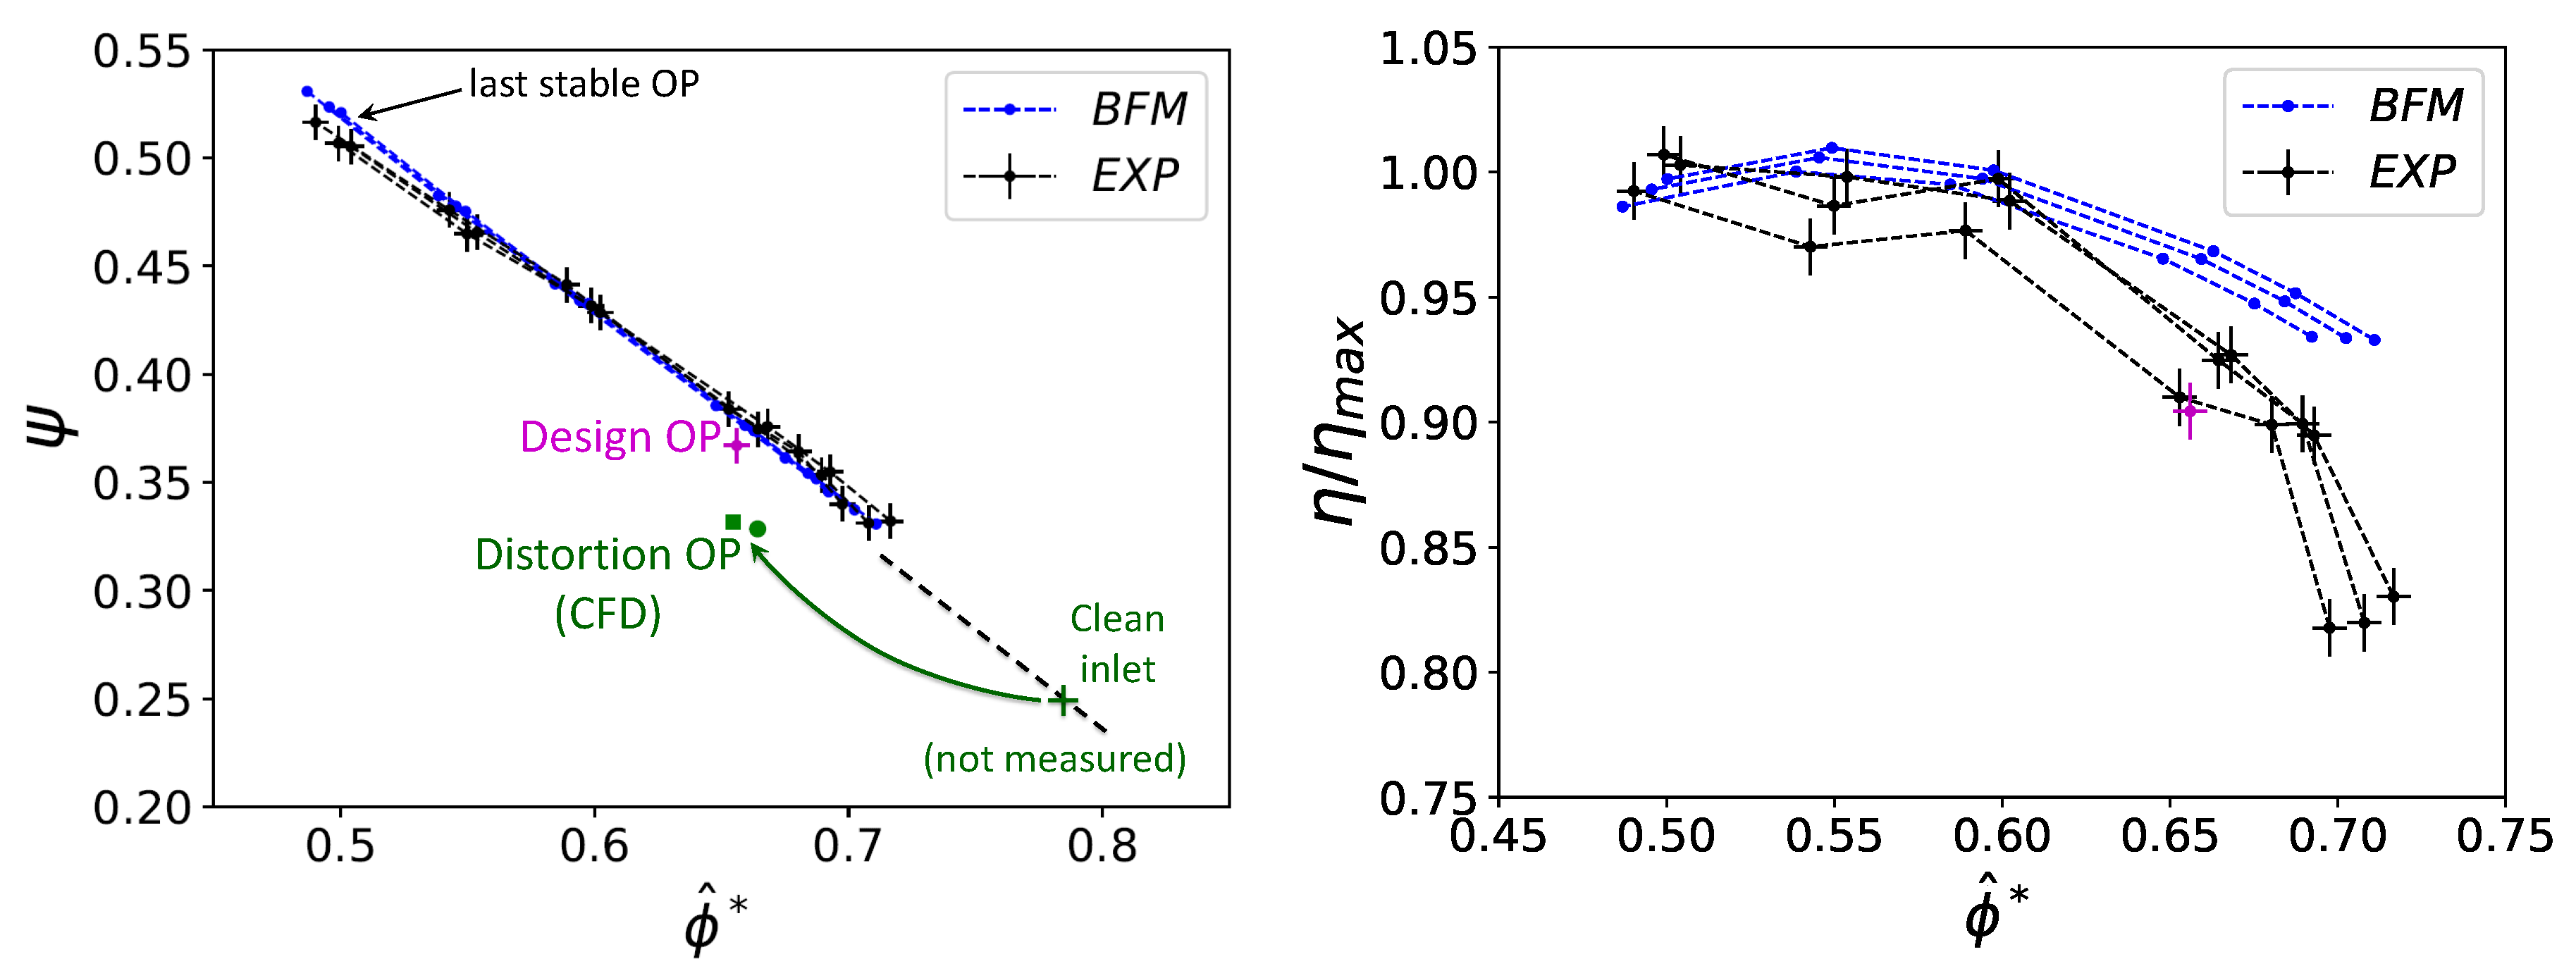
Figure 8 shows the loading coefficient and the nondimensional total-to-total isentropic efficiency of the fan stage at three rotational speeds (6500, 8000, and 9500 rpm). The design operating point, not measured here, has been added just for illustration (in magenta). The linear trends in the evolution of ψ described in [6] are illustrated here. The agreement between experimental measurements and BFM results is within 3% for ψ , and remains satisfactory for the efficiency, except at high mass flow coefficients.
Experimentally, local measurements were carried out separately for the rotor and stator, keeping the same value for ϕ ^ , but at different rotational speeds. For this reason, Figure 9 and Figure 10 represent the upstream and downstream radial profiles of total pressure and absolute flow angle for each blade row. Here, the results are shown for the design flow coefficient operating point ( ϕ ^ = 0 . 66 ). The results of a full-annulus URANS simulation are also plotted. The stagnation pressure is mass-averaged, whereas the absolute flow angle is area-averaged. The time averaging consists of a simple arithmetic averaging.
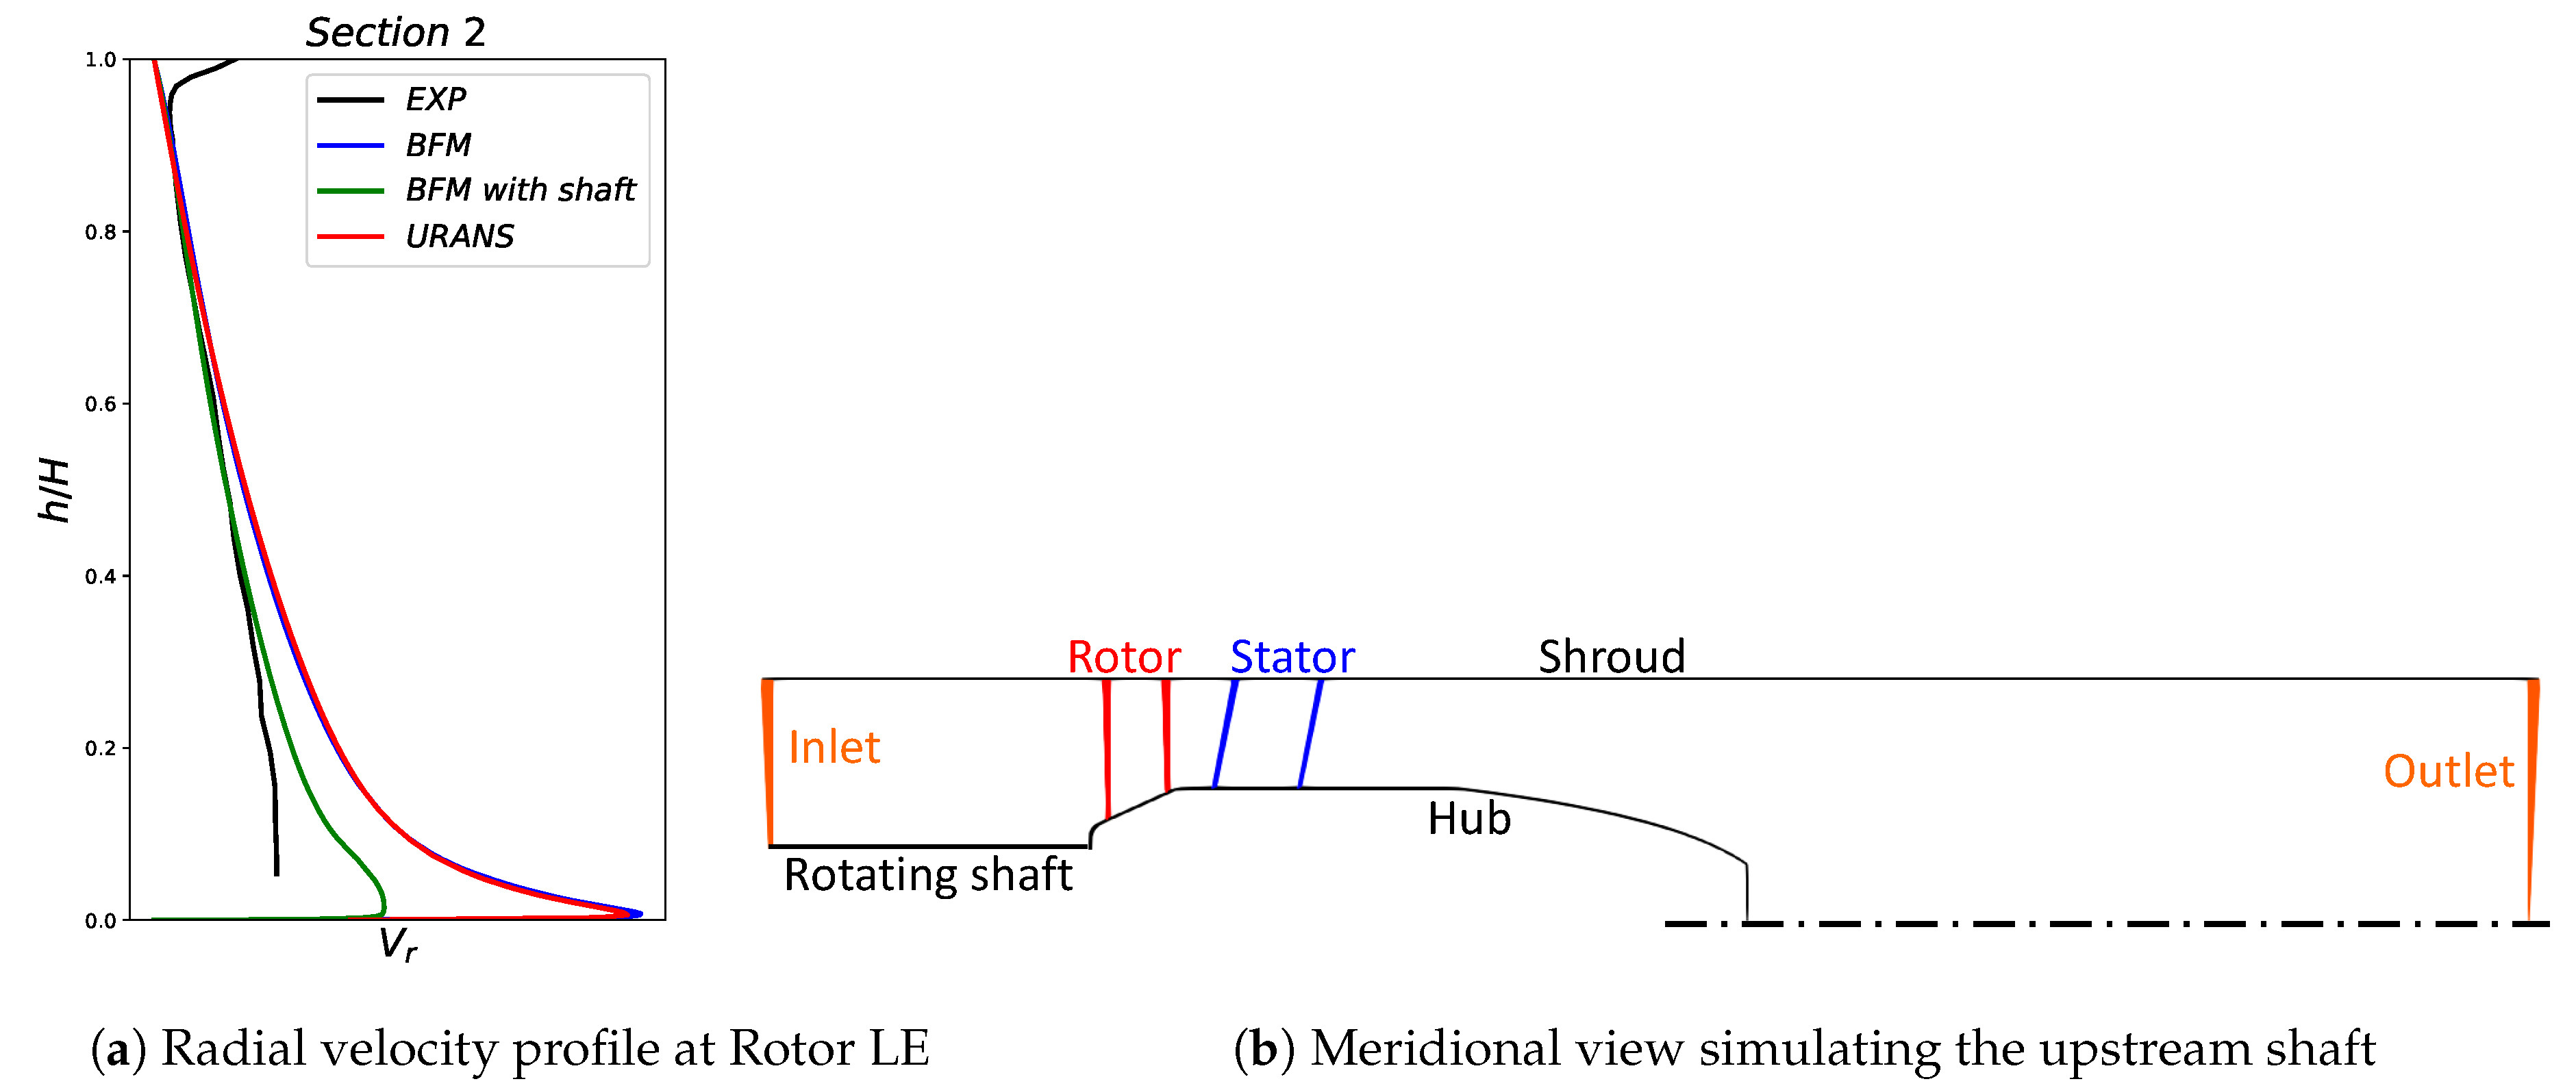
The total pressure profiles match very well (maximal relative discrepancy of 0.3%) but there is a visible difference between experimental and numerical results regarding the flow angle, especially near the hub. This is due to the fact that the rotating shaft upstream of the fan stage (Figure 2) is not simulated. A quick test run with the BFM approach showed that adding the shaft geometry upstream of the front bulb with a no-slip condition and with the rotor rotational speed greatly reduces this gap (Figure 11). Downstream of the rotor, the URANS profiles are closer to measurements at the endwalls, as could be expected, since the body force simulations cannot capture secondary flows like corner separations or rotor tip flow. The maximum flow angle discrepancy compared to URANS values is lower than 1 degree.
It should be emphasized that the body force formulation allows room for improving these trends by using user-defined calibrations (see Equation (8)). On the whole, the present results were considered satisfying enough to directly evaluate the method in the presence of an upstream flow distortion without resorting to any additional calibration. However, the one-step or two-step character of the clean inlet procedure is geometry-dependent and cannot be generalized.

4.2. Evaluation of BFM with Distortion

Only one operating point is analyzed in the present study. Some safety margins were taken with respect to the actual design point, to prevent operating in the unstable regime when introducing distortion. The valve position on the test rig associated with this operating point without any distortion corresponds to a flow coefficient value ϕ ^ = 0 . 79 . From the CFD results, the performance of the stage in the presence of distortion has been evaluated and represented in Figure 8 (green square and circle for full-annulus URANS and BFM, respectively). Table 2 gives the relative discrepancy between global performance obtained from BFM simulations, taking the URANS values as reference here, for the stage and also for each row. Due to the changes in the experimental setup, no global measurement is available in this case. This comparison shows that the stator is responsible for the discrepancies between the two simulations. Thus, in order to improve the accuracy of the BFM approach, it would be relevant to calibrate first this row. The loss level inside the stator is low (approximately 100 Pa) in this case, which makes this step particularly critical but ongoing work on the formulation of the parallel force f p is expected to improve the physics and to by-pass this two-step procedure in future studies.
π r o t o r t t = P i 3 P i 2
η r o t o r t t = π r o t o r t t γ 1 γ 1 T i 3 / T i 2 1
ω s t a t o r = P i 3 P i 4 P i 3 P s 3
π s t a g e t t = P i 4 P i 2
η s t a g e t t = π s t a g e t t γ 1 γ 1 T i 4 / T i 2 1
Local experimental measurements with distortion are not available downstream of the stator row. In the following, the axial and tangential velocity distributions in Section 3 are plotted in order to compare numerical and experimental evolutions across the rotor (Figure 12, Figure 13, Figure 14 and Figure 15).
Qualitatively, both numerical results stand in good agreement with the measurements. Near the hub, co-swirl and contra-swirl are visible where the rotor enters and leaves the axial velocity deficit area, respectively ( θ = 270 and θ = 90 ). The difference in relative flow incidence at the rotor LE between high and low axial velocity zones is around 10 . Since there is no flow separation on any blade, the relative flow angle at the rotor TE is the same in Section 3 for both zones, which explains higher values of the absolute azimuthal velocity V θ , in the low V z area. A shift of the local extrema can be seen in the azimuthal direction for V θ , but the amplitudes are correctly reproduced (Figure 14 and Figure 15). A small offset in V z is also observed at mid-span and near the shroud (Figure 13).
The only major discrepancy concern is the V z distribution at the hub. It is attributed to the strong curvature upstream of the rotor root due to the front bulb (see Figure 4). As illustrated by Figure 16, the axial velocity of the flow near the hub in Section 2 is not the same in the CFD and experiments. An iterative procedure to set the numerical inlet boundary conditions would be required to match the measurements at this location. As reported by Gunn & Hall [3], the spinner can have a significant impact on the flow radial redistribution in presence of distortion. This is why in the future a redesign of the fan stage is scheduled: it should include an aerodynamic shaped spinner upstream of the rotor, and the stage itself should be more loaded in order to be more representative of propulsive fans.
Figure 17 compares the BFM and URANS results just downstream of the stator TE. Figure 18 and Figure 19 show the envelope of the temporal fluctuations in the URANS distribution, i.e., the extremal values during a rotor blade passing period. The main feature that distinguishes both simulations here is the presence of the stator wakes in the time-averaged URANS field. Finally, the flow pattern is also similar far downstream, behind the rear bulb (Figure 20).
The satisfactory agreement between both numerical simulations proves that the BFM is well-adapted to treat this sort of configuration, provided that only large flow scales (i.e., larger than one interblade passage) are expected in the work or loss spatial redistributions. The remaining difficulty in the present study comes from the fact that the upstream flow conditions are unknown. A fine characterization of the distortion grid would be needed to ensure a proper comparison between measurements and CFD.
Concerning CPU costs, a BFM simulation takes less than 24 h to converge with 64 cores (around 1500 CPU hours). The full-annulus case took 5 revolutions to converge without distortion. Then 4 more revolutions were necessary to converge with distortion. On the whole, the URANS simulation presented here cost approximately 60,000 CPU hours, which gives a ratio of 40 compared to the BFM simulation.

5. Conclusions

Body force simulations were carried out on a cooling fan stage. The model used includes compressibility effects and a metal blockage effect and proposes a loss term accounting for viscous effects. The results are compared to full-annulus URANS on the one hand, and to experimental data on the other, in order to evaluate the capability of the BFM to predict global performance, as well as the flow physics.
With distortion, BFM and URANS results show a good agreement. Taking URANS as reference, the stage performance are quantitatively rather well predicted without resorting to any extra calibration. Except for short length scale structures like stator wakes or secondary flows, the distortion transfer across both rows is the same in terms of velocity field, total pressure, and total temperature. Some discrepancies exist when comparing with experimental results, which can be partly explained by different upstream flow conditions. More measurements would be needed just downstream of the distortion grid to reproduce exactly the same inlet conditions in the CFD. This limitation will be addressed in the coming year by a new experimental distortion campaign.
On the whole, with the simple distortion pattern studied, the body force simulation captures the main flow behavior, with a CPU cost lower than URANS by a factor of 40. This demonstrates that BFM can be a powerful tool to deal with performance prediction in innovative engine configurations during the first design loops, when the targeted accuracy is not too demanding. The next step in this research project is to evaluate this methodology with a more loaded fan stage, in order to be more representative of propulsive functions, and with a more realistic distortion pattern, closer to current BLI profiles.

Author Contributions

Numerical investigation: E.B., G.D., and Y.B.; Experimental validation: N.B. and A.O.; Supervision: X.C.

Funding

This research was funded by Safran Group. The APC was covered by Euroturbo.

Acknowledgments

This work was granted access to the HPC resources of CINES under the allocation 2018-A0032A06879 made by GENCI and to the HPC resources of CALMIP Supercomputing Center under the allocation 2018-P18021. The authors are grateful to Safran Ventilation Systems for the successful collaboration in the low-speed fan domain and to Safran Group for funding this study, which is part of the joint research initiative AEGIS engaged with ISAE-SUPAERO.

Conflicts of Interest

The authors declare no conflicts of interest.

Abbreviations

The following abbreviations are used in this manuscript:
BLIBoundary Layer Ingestion
BPFBlade Passing Frequency
CFDComputational Fluid Dynamics
CFLCourant–Friedrichs–Lewy number
DTSDual time-stepping
LELeading Edge
PSPressure Side
SSSuction Side
TETrailing Edge
URANSUnsteady Reynolds-Averaged Navier–Stokes
Symbols
bblade metal blockage
b z , b r blockage derivatives
n vector normal to the blade camber surface
sblade pitch
Nblade count
Wrelative velocity
Vabsolute velocity
R e z Reynolds number based on the chordwise direction
C f friction coefficient
μ kinematic viscosity
μ t turbulent kinematic viscosity
ρ density
Dfan diameter
Ω rotational speed
M r e l relative Mach number
ϕ flow coefficient
ψ loading coefficient
ϕ ^ reduced flow coefficient
f body force per unit mass
K m a c h compressibility correction coefficient
δ local deviation angle
π pressure ratio
η isentropic efficiency
C p static pressure recovery
ω total pressure loss
γ specific heat ratio
h / H relative span height
m ˙ c o r r corrected mass flow rate
n θ azimuthal component of n
Superscripts
r ^ assessed at the mean quadratic radius
t t total-to-total
Subscripts
x, y, zcartesian coordinates
z, r, θ cylindrical coordinates
nnormal to the flow
pparallel to the flow
istagnation quantity
1, …, 5relative to Section 1, Section 2, Section 3, Section 4 and Section 5

References

  1. Uranga, A.; Drela, M.; Greitzer, E.M.; Hall, D.K.; Titchener, N.A.; Lieu, M.K.; Siu, N.M.; Casses, C.; Huang, A.C.; Gatlin, G.M.; et al. Boundary Layer Ingestion Benefit of the D8 Transport Aircraft. AIAA J. 2017, 55, 3693–3708. [Google Scholar] [CrossRef]
  2. Hall, D.; Greitzer, E.; Tan, C. Analysis of fan stage conceptual design attributes for boundary layer ingestion. J. Turbomach. 2017, 139, 071012. [Google Scholar] [CrossRef]
  3. Gunn, E.; Hall, C. Aerodynamics of boundary layer ingesting fans. ASME Turbo Expo 2014: Turbine Technical Conference and Exposition; American Society of Mechanical Engineers: New York, NY, USA, 2014; p. V01AT01A024. [Google Scholar]
  4. Kim, H.; Liou, M.S. Flow simulation and optimal shape design of N3-X hybrid wing body configuration using a body force method. Aerosp. Sci. Technol. 2017, 71, 661–674. [Google Scholar] [CrossRef]
  5. Ortolan, A. Aerodynamic Study of Reversible Axial Fans with High Compressor/Turbine Dual Performance. Ph.D. Thesis, ISAE-SUPAERO, Toulouse, France, 2017. [Google Scholar]
  6. Binder, N.; Courty-Audren, S.K.; Duplaa, S.; Dufour, G.; Carbonneau, X. Theoretical Analysis of the Aerodynamics of Low-Speed Fans in Free and Load-Controlled Windmilling Operation. J. Turbomach. 2015, 137, 101001. [Google Scholar] [CrossRef]
  7. Ortolan, A.; Courty-Audren, S.K.; Lagha, M.; Binder, N.; Carbonneau, X.; Challas, F. Generic Properties of Flows in Low-Speed Axial Fans Operating at Load-Controlled Windmill. J. Turbomach. 2018, 140, 081002. [Google Scholar] [CrossRef]
  8. Cambier, L.; Gazaix, M. elsA—An efficient object-oriented solution to CFD complexity. In Proceedings of the 40th AIAA Aerospace Sciences Meeting & Exhibit, Reno, NV, USA, 14–17 January 2002; p. 108. [Google Scholar]
  9. Gourdain, N. High-Performance Computing of Gas Turbine Flows: Current and Future Trends; HDR, École Centrale de Lyon: Écully, France, 2011. [Google Scholar]
  10. Marble, F. Three Dimensional Flow in Turbomachines. InHigh Speed Aerodynamics and Jet Propulsion; Princeton University Press: Princeton, NJ, USA, 1964; pp. 83–166. [Google Scholar]
  11. Gong, Y.Y. A Computational Model for Rotating Stall and Inlet Distortions in Multistage Compressors. Ph.D. Thesis, Massachussets Institute of Technology, Cambridge, MA, USA, 1998. [Google Scholar]
  12. Peters, A. Ultra-Short Nacelles for Low Fan Pressure Ratio Propulsors. Ph.D. Thesis, Massachussets Institute of Technology, Cambridge, MA, USA, 2014. [Google Scholar] [Green Version]
  13. Defoe, J.J.; Spakovszky, Z.S. Shock Propagation and MPT Noise From a Transonic Rotor in Nonuniform Flow. J. Turbomach. 2012, 135, 011016. [Google Scholar] [CrossRef] [Green Version]
  14. Thollet, W. Body Force Modeling of Fan—Airframe Interactions. Ph.D. Thesis, ISAE-SUPAERO, Toulouse, France, 2017. [Google Scholar]
Figure 1. 3D view of the fan stage.
Ijtpp 04 00029 g001
Figure 2. Schematic of the two experimental configurations, without/with distortion.
Ijtpp 04 00029 g002
Figure 3. Distortion grid and measured total pressure pattern associated.
Ijtpp 04 00029 g003
Figure 4. Meridional view of the computational domain.
Ijtpp 04 00029 g004
Figure 5. Pressure fluctuations at the rotor LE and TE at peak efficiency.
Ijtpp 04 00029 g005
Figure 6. Illustration of the generic body forces methodology.
Ijtpp 04 00029 g006
Figure 7. 1D representation of blockage and its derivative.
Ijtpp 04 00029 g007
Figure 8. Global performance of the fan stage, clean inlet case, and distorted case.
Ijtpp 04 00029 g008
Figure 9. Absolute total pressure radial profiles at design flow coefficient.
Ijtpp 04 00029 g009
Figure 10. Absolute flow angle radial profiles at design flow coefficient.
Ijtpp 04 00029 g010
Figure 11. Influence of the shaft on the Rotor LE flow conditions.
Ijtpp 04 00029 g011
Figure 12. Axial velocity field in Section 3.
Ijtpp 04 00029 g012
Figure 13. Azimuthal distribution of axial velocity in Section 3.
Ijtpp 04 00029 g013
Figure 14. Absolute tangential velocity field in Section 3.
Ijtpp 04 00029 g014
Figure 15. Azimuthal distribution of absolute tangential velocity in Section 3.
Ijtpp 04 00029 g015
Figure 16. Axial velocity field in Section 2.
Ijtpp 04 00029 g016
Figure 17. Comparison of URANS and BFM results in Section 4.
Ijtpp 04 00029 g017
Figure 18. Azimuthal distribution of absolute total pressure in Section 4.
Ijtpp 04 00029 g018
Figure 19. Azimuthal distribution of absolute total temperature in Section 4.
Ijtpp 04 00029 g019
Figure 20. Comparison of URANS and BFM results in Section 5.
Ijtpp 04 00029 g020
Table 1. Fan stage characteristics, from the authors of [5].
Diameter D < 200 mm
Rotor blade count N R = 17
Stator blade count N S = 23
Design rotational speed Ω 12 . 000 rpm
Design reduced flow coefficient ϕ ^ 0.66
Design stage loading coefficient ψ ^ 0.37
Reynolds number 2 . 10 5
Axial Mach number0.1–0.2
Table 2. Relative discrepancy between URANS and body force modeling (BFM) global performance.
m ˙ corr η rotor t t ω stator Δ P t rotor Δ P t stage π stage t t η stage t t
BFM-URANS + 0.6 % + 0.2 % 31.7 % 0.4 % + 3.1 % + 0.1 % + 3.2 %