Article

Experimental Study of the Leakage Flow in an Axial-Flow Fan at Variable Loading †

Dipartimento di Ingegneria Meccanica, Energetica, Gestionale e dei Trasporti (DIME), DIME-Università di Genova, via Montallegro, 1, I-16145 Genova, Italy
*
Author to whom correspondence should be addressed.
This is an extended version of our paper ETC2021-783 presented at the 14th European Turbomachinery Conference on Fluid Dynamics & Thermodynamics ETC14, Gdansk, Poland, 12–16 April 2021.
Int. J. Turbomach. Propuls. Power 2021, 6(4), 40; https://doi.org/10.3390/ijtpp6040040
Submission received: 28 July 2021 / Revised: 24 August 2021 / Accepted: 13 October 2021 / Published: 20 October 2021

Abstract

:
The present paper reports a 2D-PIV (particle image velocimetry) study of the effect of the operating point on the leakage flow in a low-speed ring fan. First, the flow pattern has been studied at 12 operating points covering the whole characteristic curve. At very low loading, the leakage flow streams along the rotor ring and is directly reingested; then, a separation bubble attached to the ring forms that, approaching the design point, modifies in a flow streaming radially outward. As the loading further increases, a separated flow region appears in the blade tip region that finally merges with the leakage flow. A further, more detailed study has been performed at eight operating points in the neighborhood of the design one. Very small loading variations may yield the leakage flow pattern modification, but no intermittence is present during the transition, as instantaneous flow patterns of any intermediate type continuously alternate. These results provide a consistent explanation for the ones of previous acoustic measurements.

1. Introduction

Axial fans employed in automotive cooling systems are commonly provided with a rotating shroud, i.e., a ring connecting the blade tips. This ring improves the volumetric efficiency and also strengthens the whole assembly, but it has a number of undesired effects. For instance, in a recent study, Carassale et al. [1] showed that the leakage flow may cause low-frequency flutter, but the typically reported effect is a strong increase in the radiated noise due to the presence of large-scale turbulent structures, Longhouse [2]. They are contained in the leakage flow released from the gap between the ring and the stationary enclosure and are eventually reingested by the rotor. Their interaction with the rotor blades results in noise in the low- to medium-frequency range, with the appearance of narrowband humps at subharmonic frequencies and a general increase in the broadband noise. In fact, a low-speed axial-flow fan may radiate noise as a consequence of a number of noise-generating mechanisms (mainly, large- and small-scale inlet turbulence, rotor-stator interaction, leakage flow, and interaction of boundary layer turbulence with the blade trailing edge). However, sealing the gap, Canepa et al. [3] could inhibit the leakage flow; this showed that not only the leakage flow noise may constitute the major contribution to the low-frequency noise but to the overall radiation also, e.g., see Canepa et al. [4]. Although the main features of the leakage flow are known, very few works related to it are available in the literature, e.g., see Fukano et al. [5], Fukano and Jang [6], Piellard et al. [7], Magne et al. [8], Moreau and Sanjose [9], Zenger et al. [10], Na et al. [11], Canepa et al. [3,4,12,13], and Zhu et al. [14]. In order to find effective solutions for noise reduction, a deeper insight in the leakage flow features and in the effect of relevant parameters is necessary.
The present paper continues the aerodynamic and acoustic investigation reported in Canepa et al. [4]. In such a study, a correspondence between SPL spectra and leakage flow pattern was sought. Namely, a detailed analysis of the effect of both rotational speed and operating point on the noise features was reported that suggested that local modifications in the SPL trend as a function of the loading are related to modifications of the leakage flow pattern but also to the appearance of separated flow regions at the blade tip. However, aerodynamic measurements were performed at only four operating points, proving to be insufficient for a complete description. Thus, a number of questions remained open that regard the dependence of the flow pattern on the operating point and some new ones arose. The present work reports PIV measurements of the leakage flow at a large number of operating points, thus providing a detailed description of the effect of the operating point on the leakage flow pattern.
As a general remark, it should be considered that the noise generation in low-speed fans depends on the instantaneous features of the flow. Hence, the possibility of simultaneously surveying the whole measurement domain makes PIV a suitable technique indeed. Unfortunately, the complexity of the rotor geometry and the highly distorted flow constitute serious limitations to the full exploitation of the present PIV system, preventing from taking measurements inside the rotor or in planes other than the meridional one. Noise yields from the loading fluctuations resulting from the interaction between flow and blade; thus, measurements of the instantaneous blade pressure would also provide very useful information. Unfortunately, the small blade thickness and the difficulties related to taking measurements in the rotating frame constitute serious hindrances. All this results in a situation that is typical when dealing with aerodynamic noise, i.e., having to gather information on physical phenomena on the basis of limited data sets. Fortunately, this problem is mitigated by the fact that, when dealing with aeroacoustic problems, the quality of phenomena is often more important than quantitative information.

2. Experimental Procedure

2.1. Experimental Facility

The measurement campaign has been carried out in the DIME Aeroacoustics laboratory with the fan mounted on a test rig specifically conceived and designed based on ISO 5801 norms, see Figure 1a. The tested rotor is a 9-blade aluminum prototype obtained by means of a numerically controlled milling machine; hence, it is geometrically very precise and, differently from rotors commonly employed in real cooling modules, it may be considered stiff. This prevents the geometry from being altered by the aerodynamic load or by the centrifugal force, an effect that could strongly affect leakage flow and radiated noise, e.g., see Canepa et al. [12]. The rotor has a tip radius r t i p of 222 mm, a hub-to-tip diameter ratio r h u b / r t i p of 0.374, and a chord c which varies between 43 mm and 50 mm from hub to tip. At the design point, the flow coefficient is φ d e s = Q d e s u t i p π r t i p 2 = 0.0869, and the pressure rise coefficient is Ψ d e s = Δ p d e s 0.5 ρ 0 u t i p 2   = 0.0993, with Q the volume flow rate and Δ p the fan pressure rise (outlet static pressure minus inlet total one). The measurements have been carried out at constant rotational speed Ω of 2400 rev/min; depending on the operating point, the chord-based Reynolds number approximately ranges between 31,000 and 41,000 at the hub and between 186,000 and 188,000 at the tip. During the tests, Δ p and Ω have been continuously monitored; Ω has been measured by means of a one-per-revolution TTL signal generated by an optical tachometer. The gap between the rotating ring and the stationary casing is constituted by 5-mm-width axial and radial parts, see Figure 1d. No acoustic measurements have been taken in the present work.

2.2. Measurement Procedure and Data Processing Technique

In order to study the effect of the pressure rise on the leakage flow pattern, 12 Ψ values covering the whole characteristic curve have been first considered, see Figure 1b; these operating points included the ones already investigated by Canepa et al. [4]. Subsequently, in order to obtain deeper insight into the flow pattern modification already observed about the design point (from a recirculation bubble attached to the ring to a broad recirculation bubble), a second, more detailed measurement campaign has been carried out at eight Ψ values, see Table 1.
The flow field has been investigated in the meridional plane close to the tip gap by means of a 2D-PIV system. Namely, in a rectangular area located at x = 3 mm from the ring with an extension of L x = 123 mm × L r = 171 mm, i.e., r / r t i p = 0.698–1.468 and x / r t i p = 0.014–0.581, see Figure 1d. The PIV system is constituted by a double-cavity Nd:Yag pulsed laser and by two Dantec High Sense Mk II digital cameras with a maximum frame rate (i.e., sampling frequency) of 6 Hz. In order to increase the radial extension of the investigated area without losing spatial resolution, the two cameras have been mounted radially shifted with a 25-mm overlapping region used to join the two instantaneous vector fields correctly. The flow has been seeded by means of a fog generator. The velocity fields (i.e., the axial and radial velocity components v a and v r ) have been obtained using a spatial cross-correlation function yielding instantaneous vector fields constituted by 83 × 116 points on a square grid of steps Δx = Δr = 1.5 mm.
The first measurement campaign constitutes a basic survey of the flow field based on 800 instantaneous vector fields per working point; for such measurements, the available data are too few for performing sufficiently accurate ensemble averages; therefore, only time averages have been taken. In the second measurement campaign, 2000 instantaneous vector fields have been collected, and the TTL signal generated by the optical tachometer has been employed as a reference signal for the ensemble average technique. Then, the instantaneous vector fields have been sorted into 90 phase bins per revolution, each representing a particular instant within the rotational period, i.e., a 4-degree window in the relative frame. Other details may be found in Canepa et al. [4,13].
In order to increase the statistical reliability, the data related to a specific position within a blade passage have been further averaged, yielding 10 ensemble averaged meridional distributions per blade pitch based on about 198 samples, i.e., about 22 samples per each bin multiplied by nine blade passages. The 10 velocity fields may be related to 4-degree-spacing meridional planes. This further average is expected not to add fake turbulence, since the rotor geometry is very precise and the differences between blade passages should be negligible. For this set of measurements, the time averaged flow fields have been computed by means of the arithmetic average of flow fields on the 10 planes.
The following quantities will be employed for the analysis of the flow: the time-averaged velocity obtained averaging the instantaneous velocity components v a and v r , the time averaged turbulence intensity T u ¯ , and the unresolved unsteadiness T u   ˜ ¯ . Both T u ¯ and T u   ˜ ¯ are based on u t i p , but the former contains all of the velocity fluctuations, while the latter contains the non-periodic part of the velocity fluctuations only, i.e., v a and v r . In fact, v a and v r may also contain periodic components not related to the blade passage frequency (BPF) and harmonics. In the present case, as in most of low-speed turbomachines, no such periodic components are present; hence, T u   ˜ ¯ cumulates the effects of both small-scale turbulence and large-scale flow structures only. As the 2D-PIV system does not allow to measure v ϑ , T u ¯ and T u   ˜ ¯ only provide qualitative information about the flow unsteadiness. For the sake of space, only the definition of T u   ˜ ¯ is reported, see Equation (1), since the definition of T u ¯ is very similar; the reader is addressed to Hussain and Reynolds [15] or to Canepa et al. [13] for the details of the velocity decomposition technique.
T u   ˜ ¯ = ( v a 2 ˜ ¯ + v r 2 ˜ ¯ ) 2 u t i p
According to the PIV error analyses of Grant [16] and Prasad et al. [17], the experimental uncertainty for the instantaneous velocity has been estimated to be 3% for the present case. Such an estimate represents an indicative value for the whole investigated domain and the chosen operating points.
In the present case, the cross-plane velocity component v ϑ constitutes the main source of systematic bias (other causes are related to timing and synchronization, installation and alignment, peak-locking and evaluation technique, particles tracing capability, and illumination) and hence a proper estimation is difficult since v ϑ may not be measured. Such an effect increases close to the boundaries of the investigated domain, possibly yielding a spatially variable uncertainty.
Statistical errors have been computed based on a 20% T u ¯ value. With a 95% confidence level, this results in statistical uncertainties of 1.5% for the time averaged velocity components v a ¯ and v r ¯ , of 5% for T u ¯ (800 instantaneous flow fields employed) and of 3% for T u   ˜ ¯ (2000 instantaneous flow fields employed).
As already discussed, periodic oscillations provide a spurious contribution to time averaged quantities such as T u ¯ , since they may not be distinguished from fluctuations not correlated with the rotor revolution. The rotating pressure field anchored to the rotor yields an upstream potential-flow effect that, in the absolute frame, results in periodic velocity oscillations that typically take place in front of the rotor blades. As reported by Canepa et al. [13], this upstream effect may also extend to the gap region, thus yielding an erroneous contribution to T u ¯ that is expected to increase with Ψ, since such a pressure field strengthens as Ψ increases.
Although this point is deepened in the following paragraphs, it is worthy to disclose that, depending on the operating conditions, two different patterns mainly characterize the leakage flow field (e.g., see Canepa et al. [4,12,13] and Magne et al. [8]): a recirculation bubble attached to the rotor ring, which for the present rotor approximately forms below the design pressure rise, and a large separated-flow zone that forms above it. Based on the observation of the time averaged velocity fields, the cases Ψ = 0.0788 and 0.103 have been assumed as references for the two flow patterns and have been chosen as the lower and the upper limits for the Ψ range of the second measurement campaign. Then, the resemblance of the instantaneous flow fields with the two reference flow patterns has been sought; to this aim, the resemblance index RI has been employed as a quantitative metric for comparing the instantaneous vector fields with the reference ones, see Liu and Haworth [18] and Willman et al. [19]. RI is obtained by projecting one velocity field onto the other one:
RI ( x ) = v 1 ( x ) · v 2 ( x ) | v 1 ( x ) | | v 2 ( x ) |
where x is a point in the measurement domain, and the indexes 1 and 2 may refer to two operating conditions Ψ1 and Ψ2 or to two time instants t 1 and t 2 at the same Ψ. As a consequence of its definition, RI equals to the cosine of the angle between the velocities v 1 ( x ) and v 2 ( x ) and may vary in the range [−1, 1], where 1 corresponds to aligned vectors with same direction and −1 corresponds to aligned vectors but in the opposite direction. In this way, RI compares the alignment of the two vectors independently of their magnitudes. Hence, for each comparison, a matrix of 83 × 116 RI values is generated which may be spatially averaged to produce a single value that quantifies the resemblance between the two fields, i.e., the overall match in the alignment.
In the present work, RI is employed to evaluate whether a velocity field acquired at the time instant t n and related to a Ψ value is similar to the time averaged velocity field related to a reference case for which Ψ   =   Ψ r e f (either Ψ r e f   =   0.0788 or Ψ r e f   =   0.103):
RI Ψ r e f n ( Ψ ) = 1 ( i m a x i m i n + 1 ) ( j m a x j m i n + 1 ) i = i m i n i = i m a x j = j m i n j = j m a x v i j n ( Ψ ) · v i j a v ( Ψ r e f ) | v i j n ( Ψ ) | | v i j a v ( Ψ r e f ) |
where the i and j indexes represent the points in the x and r directions, i.e., x i = 3 + ( i 1 ) Δ x and r j = 155 + ( j 1 ) Δ r (quantities expressed in millimeters). n identifies the instantaneous velocity field and ranges between 1 and 2000, and the superscript av indicates that the velocity field related to the reference case is the mean one. Eliminating from the summations in Equation (3) those parts of the measurement domain where the two reference velocity fields show a similar behavior allows to highlight the differences and to better evaluate the resemblance. Hence, based on visual inspection of the vector plots, the computation of RI Ψ r e f n ( Ψ ) has been arbitrarily restricted to the rectangular area in front of the gap sub-domain, choosing suitable values for i m i n , i m a x , j m i n and, j m a x . More details are given in the following.

3. Experimental Results

3.1. Previous Measurements

Canepa et al. [3] showed that for low-speed fans of the present kind, the leakage flow mainly affects the low-frequency part of the spectrum and may constitute the major noise source, e.g., see also Longhouse [2]. However, the studied rotor was made of plastic and the deformations due to the centrifugal force and to the blade loading resulted in a sudden flow pattern transition from the attached separation bubble to the large separated-flow zone, see Canepa et al. [12]. A simultaneous decrease in the low-frequency part of the SPL spectrum was also observed. Furthermore, acoustic measurements were repeated with the rotor mounted in different axial positions with respect to the standard one in which the ring lip is flush with the mounting panel. It was found that even a few-millimeters difference in the rotor position may vary the Ψ value at which the transition takes place: a rotor protruding from the panel could decrease it, while a backward mounted rotor could have the opposite effect. This suggested that the relative position of ring lip and edge of the panel (the step in Figure 1) may vary the orientation of the flow leaving the gap and, hence, its ability to penetrate the incoming flow, thus moving away from the rotor rather than being immediately reingested. A possible effect of rotor deformation was also reported by Moreau et al. [9].
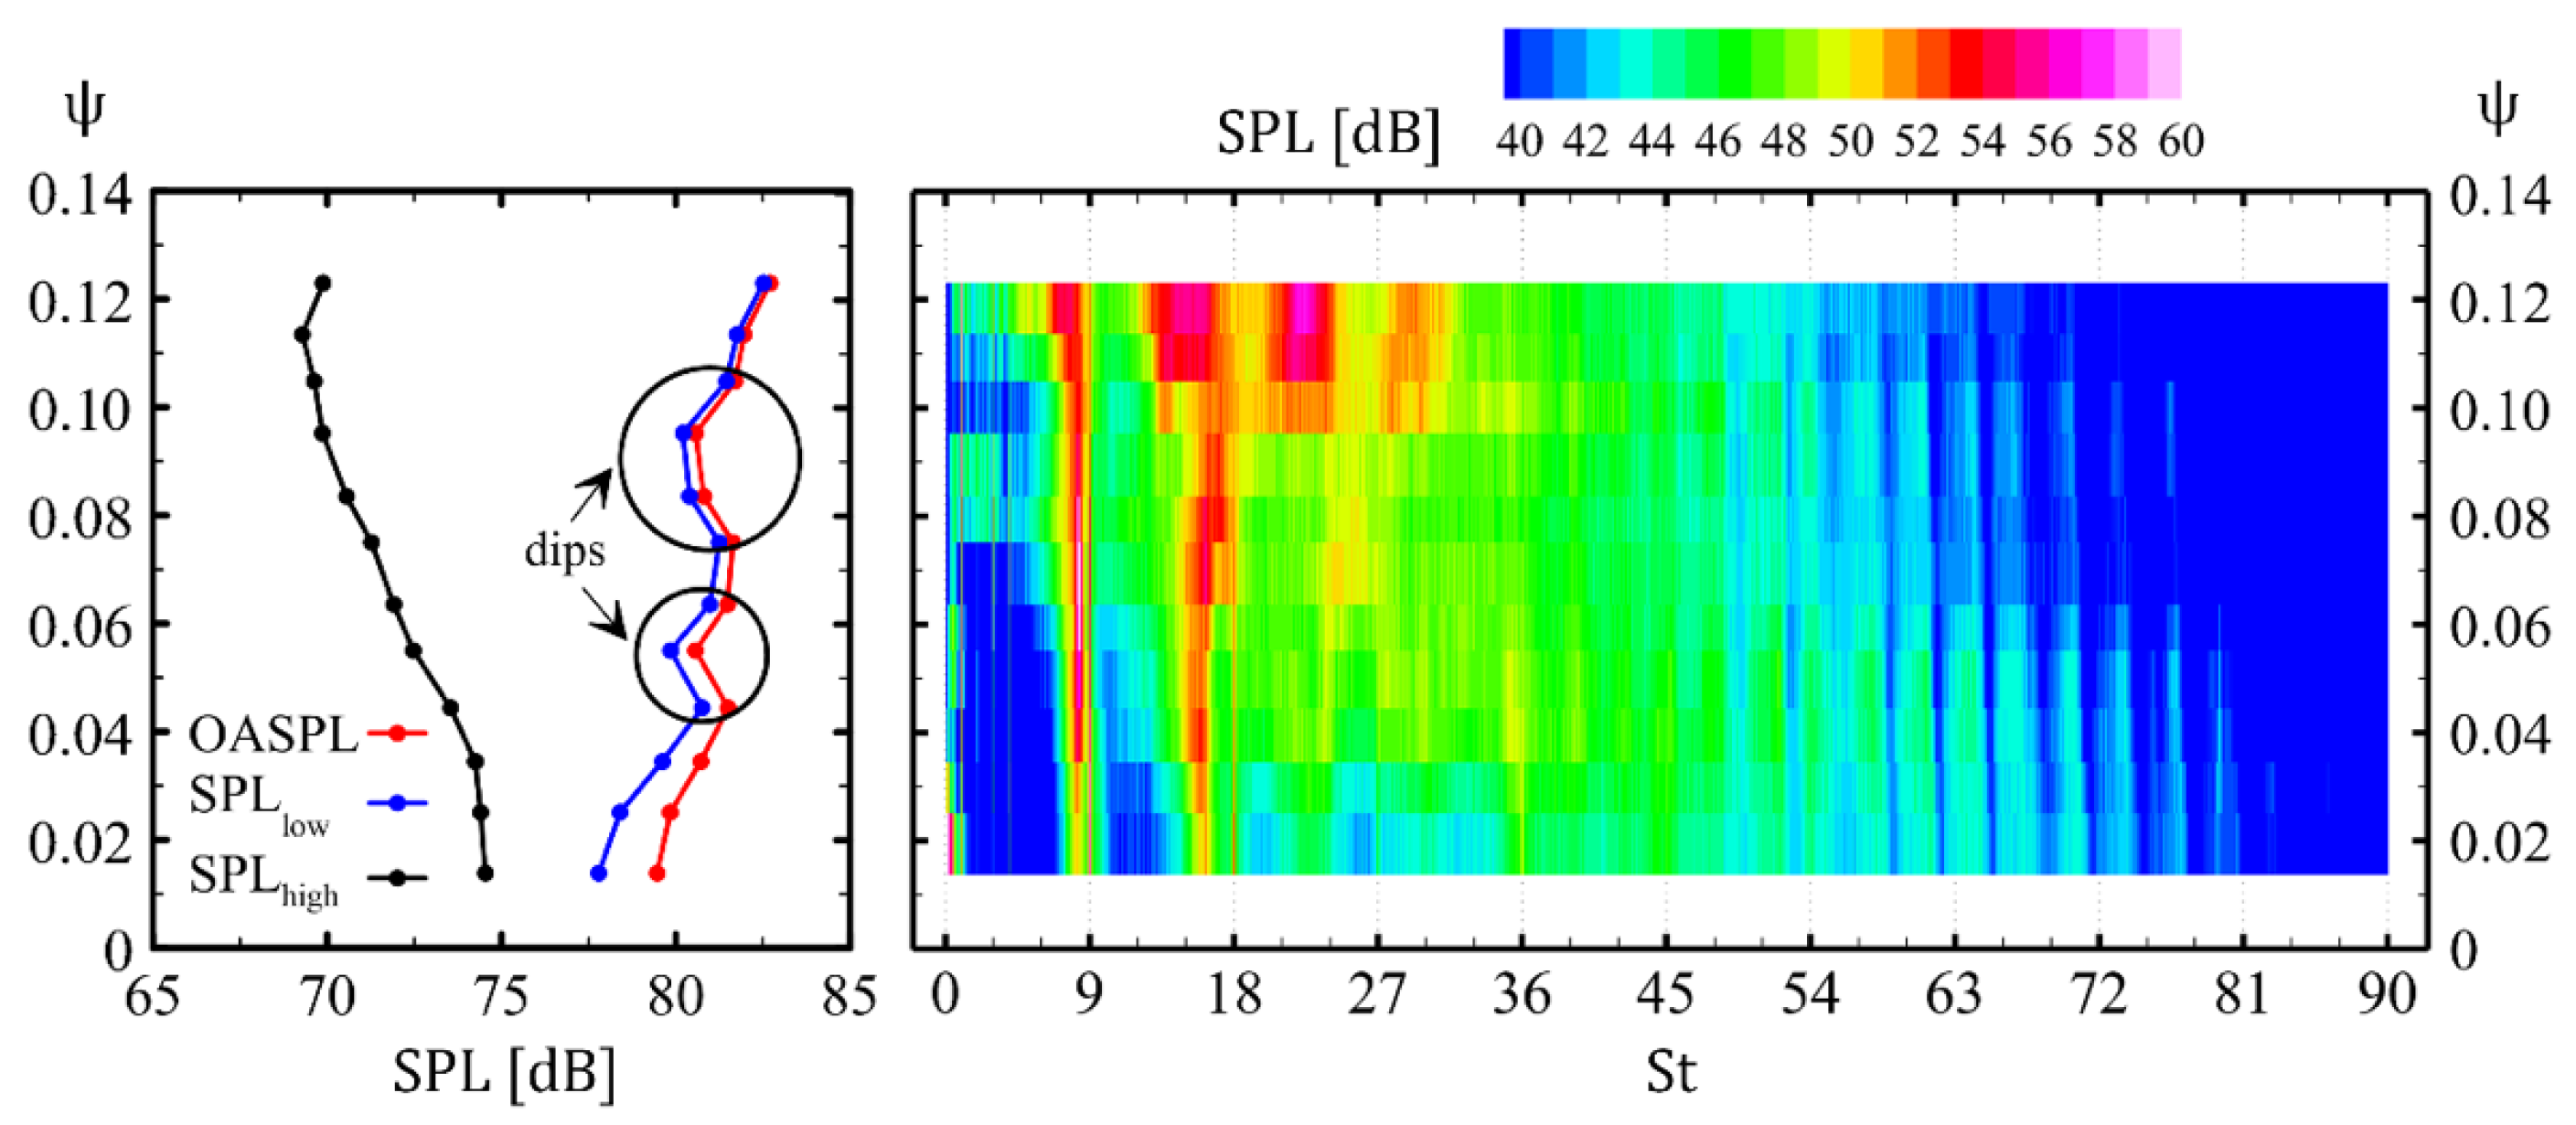
All this has suggested to study a different rotor made of aluminum, Canepa et al. [4], and to focus attention on the sound pressure level (SPL) in the low-frequency range (i.e., S t = 6–90, with S t = 60 f / Ω the Strouhal number). It was found that, as expected, the flow pattern transition takes place in stiff rotors also, and that it depends on the Ψ value. The plots reported in Figure 2, adapted from Canepa et al. [4], show the importance of the leakage flow noise. The effect of Ψ on the following acoustic quantities is considered: OASPL (the overall SPL), SPLlow and SPLhigh (the SPL in the low- and high-frequency range), and the SPL spectrum. The integral quantities provide overall information on the generated noise, while the spectrum helps identify and discriminate different noise-generating mechanisms.
The comparison between OASPL, SPLlow, and SPLhigh shows that the difference between OASPL and SPLlow decreases from 2 dB to 0 dB as Ψ increases from the minimum to the maximum value. This means that the contribution from the high-frequency part is negligible. Hence, at all Ψ , SPLlow provides the major contribution to OASPL. Furthermore, the SPL spectrum contour plot indicates that crests and humps below the first three BPF harmonics ( S t = 9 ,   18 ,   27 ) provide the major contribution to SPLlow. The ingestion of non-rotating large-scale flow structures results in spectral peaks or narrowband humps at BPF harmonics, see Hanson [20] or Majumdar and Peake [21]. Peaks and humps at subharmonic frequencies are necessarily generated by the interaction of the rotor blades with co-rotating flow disturbances, e.g., see Magne et al. [8] and Moreau et al. [9]. In the present configuration, the upstream flow has no prerotation; hence, such disturbances may only be contained in flow coming from the rotor, either through the gap or from the blades due to the reverse flow. Evidences of the existence of such a reverse flow were provided by Canepa et al. [4], and blade stall in the tip region, possibly related to flow separation on the ring connection from radial to axial, is likely its cause. Flow separation in the hub region could also result in such a flow reversal, but it should affect the lower part of the blade span only, where the low velocity should result in minor contributions to the radiated noise.
Should SPLlow be related to the leakage flow rate only, it would increase with Ψ , as the leakage flow also strengthens with it. On the contrary, SPLlow has a non-monotonic trend, since its growth is interrupted by two local minima at Ψ 0.05 and 0.09; an OASPL trend with a minimum about the design point has been reported by Moreau et al. [9]. This suggests that the noise-generating mechanism changes, i.e., that some flow features change at those operating points. A possible explanation is either a leakage flow pattern change or a flow reversal in the blade tip region. The comparison between the SPLlow plot and the SPL spectrum contour shows that the SPLlow trend is closely related to the modifications in the height of the crests at S t smaller than 9 and 18, as such modifications take place at similar Ψ values. Attention was focused on the behavior at approximately Ψ 0.09, since that point is close to the design one, and also since at Ψ 0.05 the SPL is smaller and the situation is of lesser interest. The discussion of the results suggested that: (1) the decrease that takes place from Ψ 0.08 to Ψ 0.09 is likely due to a leakage flow pattern transition from an attached recirculation bubble shortly reingested by the rotor to an outward radial flow following a long path before reingestion, and (2) the observation of the SPL spectrum shows that at Ψ 0.103, the crest at S t < 18 shifts to lower S t and becomes a broad hump; the crest at S t < 9 has a similar behavior and a further hump appears at S t < 27. This indicates that a change in the generating mechanism takes place. The possible explanation is that the further increase beyond Ψ 0.09 may likely be due to a flow separation taking place in the ring rounding/blade suction side region, i.e., that, at large Ψ , the low-frequency noise is not due to the leakage flow. This effect may seem of lesser practical interest as it takes place at Ψ values higher than the design one, where the fan is usually not operated, but it should be considered that a different design of the ring or of the shroud could move such a separation to a lower Ψ . As a general consideration, this highlights that prerotating large-scale structures may be related to flow phenomena other than the leakage flow and, hence, subharmonic humps in the SPL spectrum may be caused by different kinds of generating mechanisms.
However, the aerodynamic measurements were taken at too few Ψ values to properly investigate the flow pattern modifications. The present work stems from the need for a more systematic study.

3.2. General Trend of the Time-Averaged Flow Field

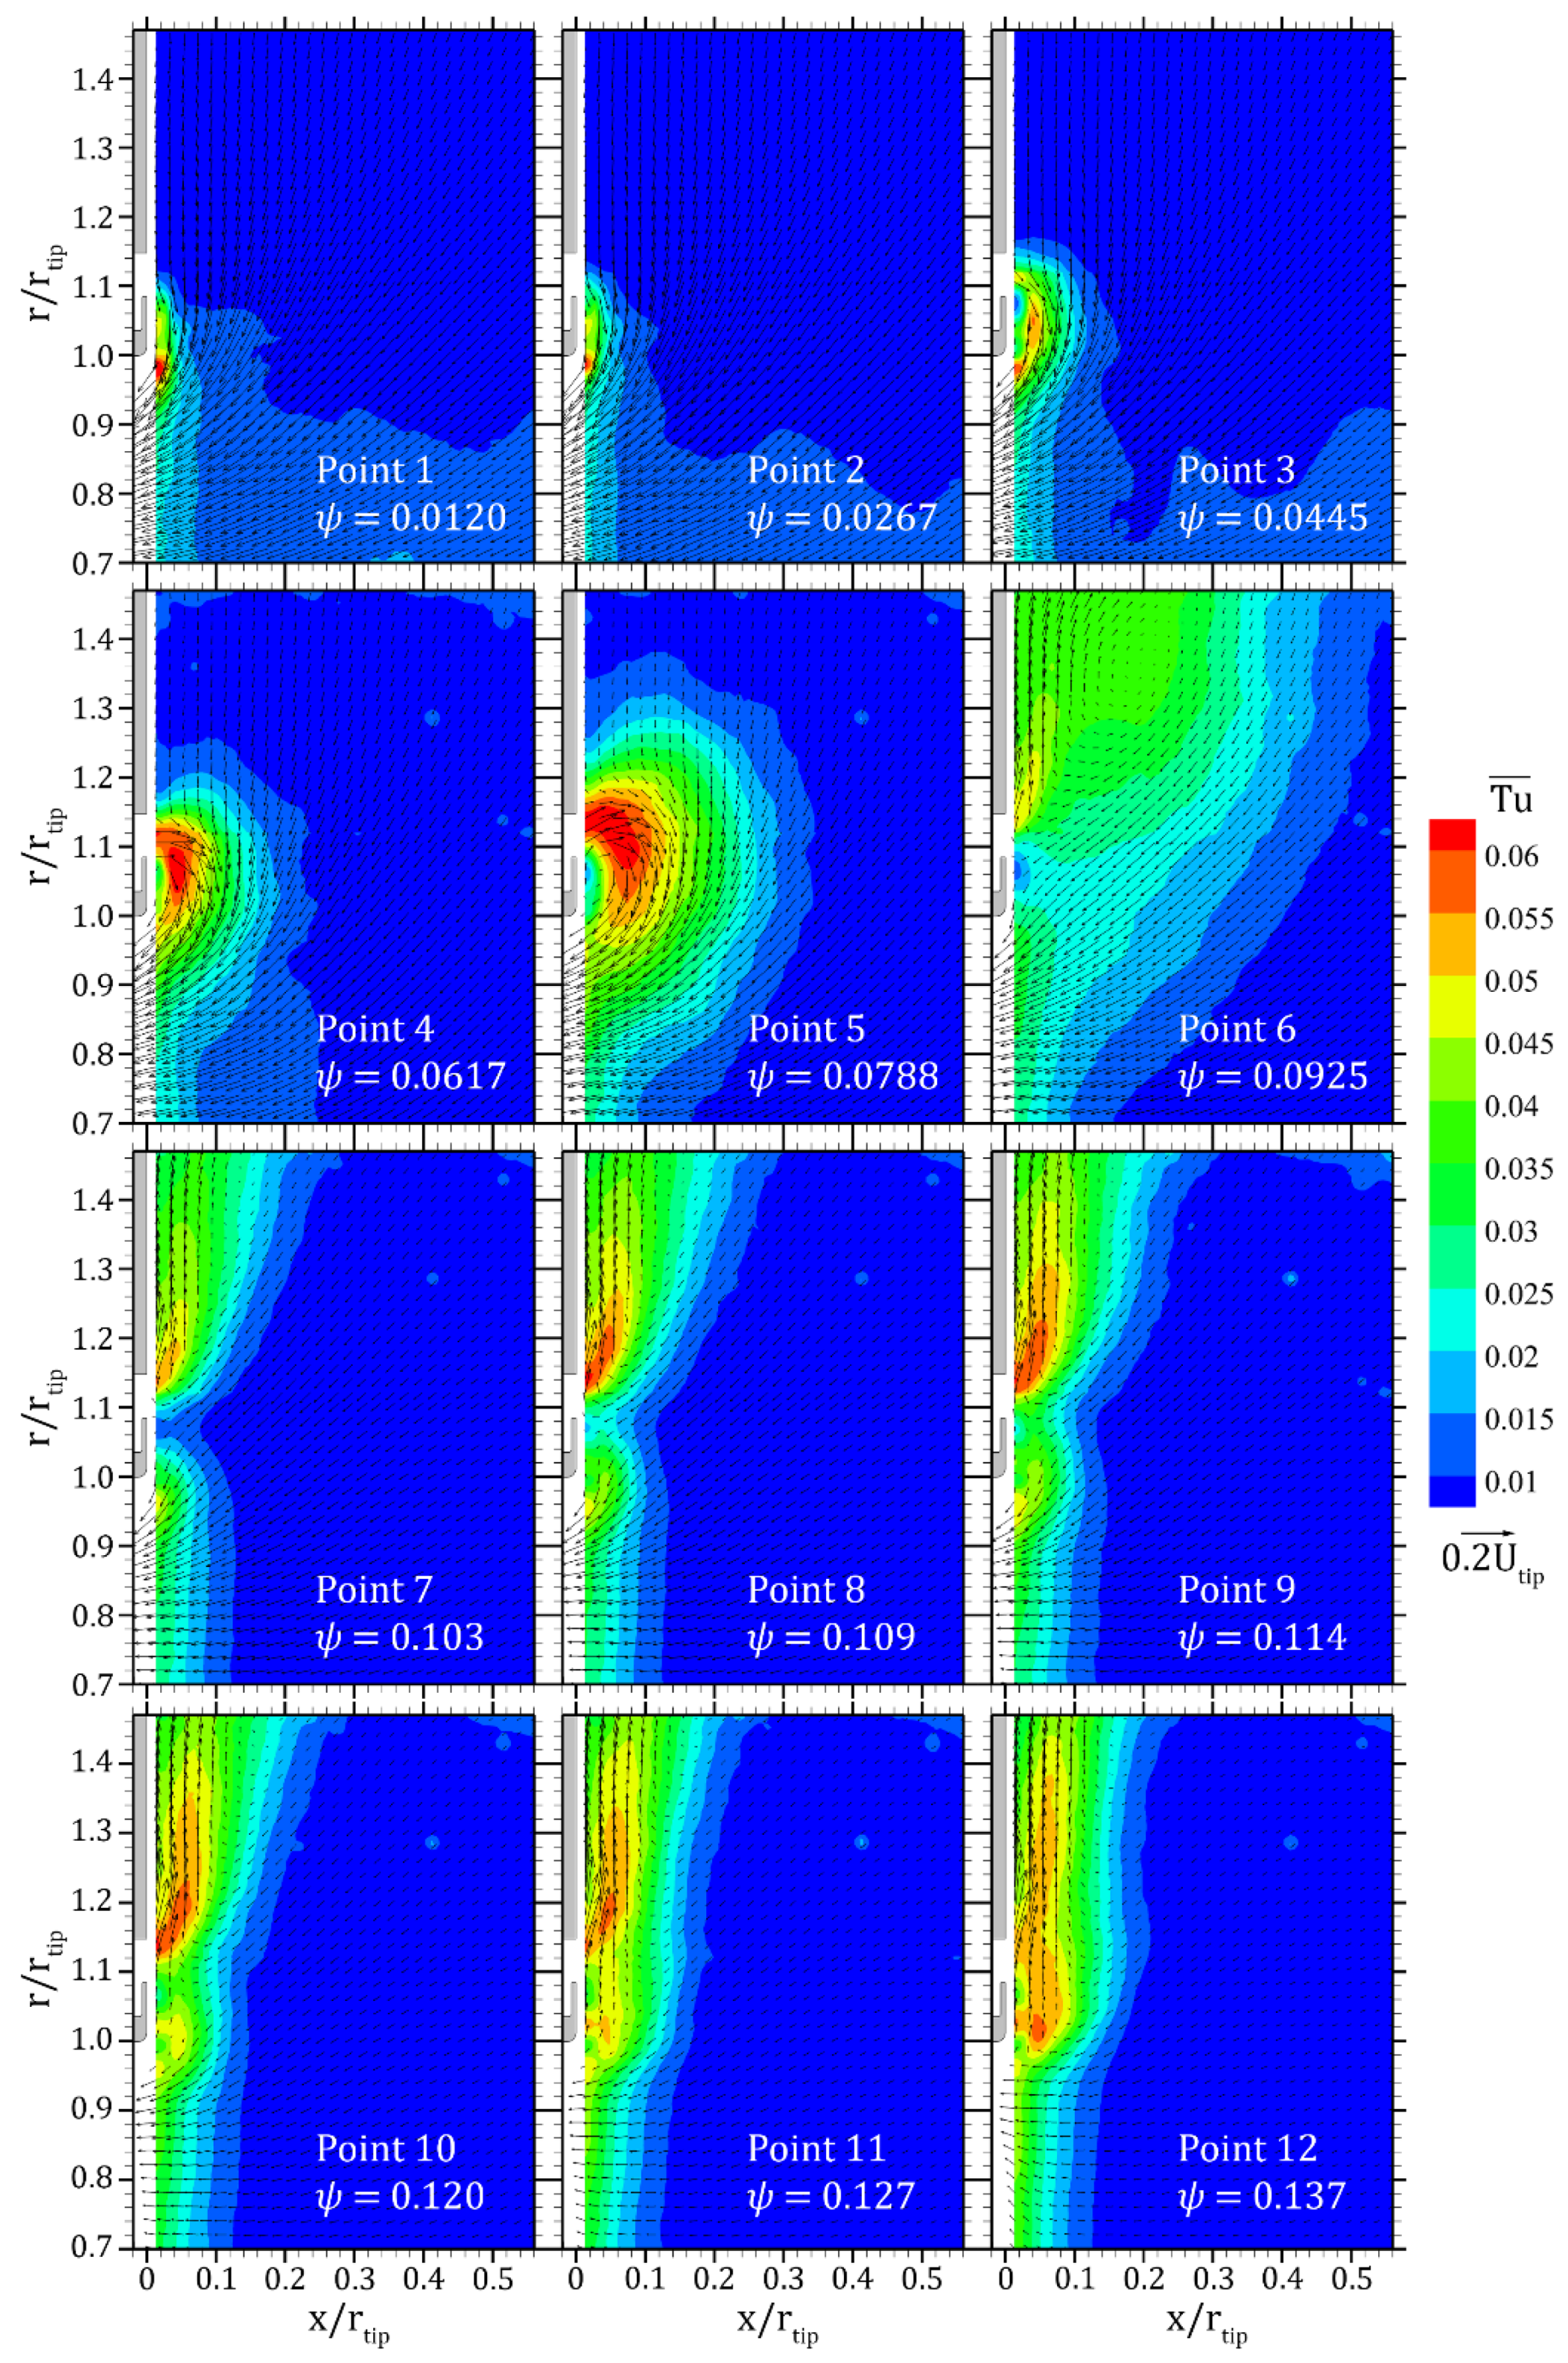
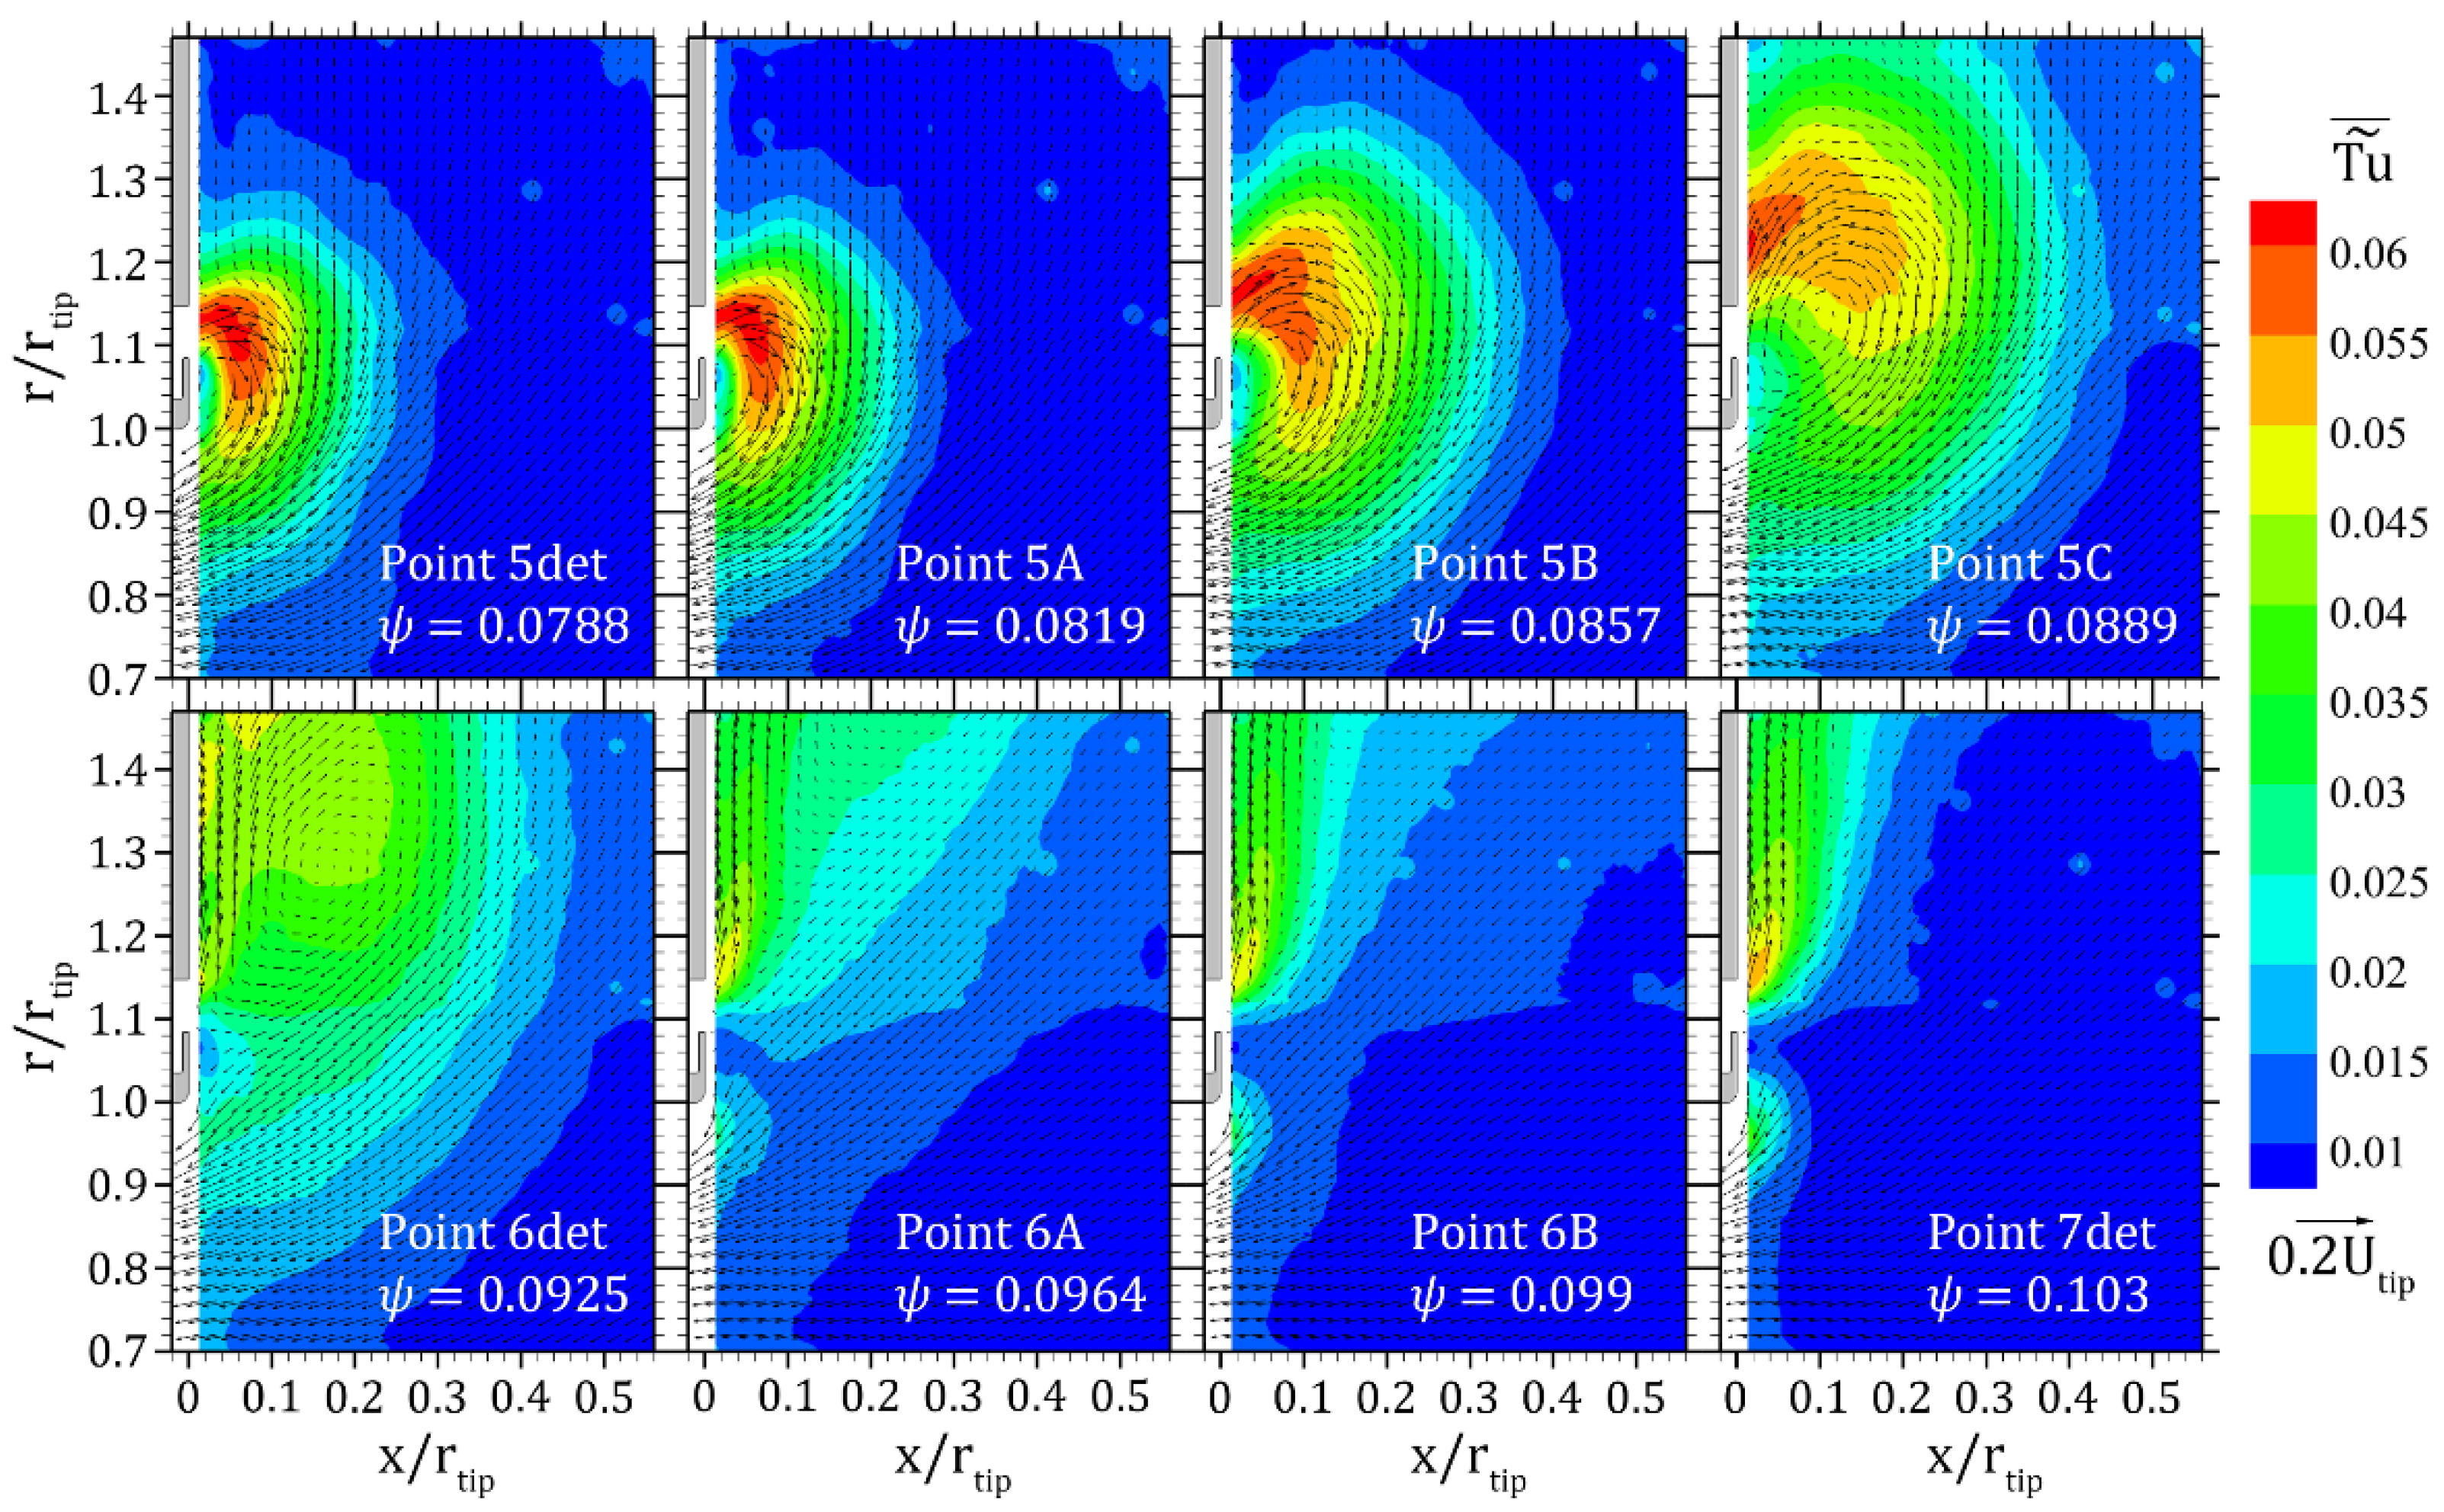
In order to provide an overall picture of the leakage flow in the gap region, 12 operating points have been first considered, see Table 1. The time averaged velocity fields are reported in Figure 3 together with the T u ¯ contour plots. At all Ψ values, the leakage flow may be identified by means of the high T u ¯ zone about the gap region, i.e., in the range r / r t i p = 1.081–1.146. A higher T u ¯ stripe is present in front of the blade at all Ψ . Physically, high turbulence may depend either on convection or on local production. As the upstream flow entering the rotor has low T u ¯ , a physical explanation for such higher values could be the presence of blade stall, which could result in an instantaneous reverse flow possibly not detected in the time averaged vector plot. In fact, as already remarked, such a T u ¯ increase is likely due to the periodic flow fluctuations associated with the blade passage, and, in such a case, it should be disregarded as it has no physical meaning. On the contrary, T u   ˜ ¯ is not affected by periodic oscillations and, hence, it provides information that is more physically reliable. The comparison between the T u   ˜ ¯ contour plots of Figure 4 and the T u ¯ ones of Figure 3 shows that, at the same operating point (5det vs. 5, 6det vs. 6, and 7det vs. 7), no high T u   ˜ ¯ stripe is present in front of the blade. Hence, it may be concluded that, at least at those conditions, no abnormal flow situation takes place in front of the blade. As such a flow behavior is typical of high blade loading, this conclusion should also apply to operation at lower Ψ , i.e., to points 1, 2, 3, and 4. On the contrary, in front of the gap region and at larger r , both T u ¯ and T u   ˜ ¯ attain similar values, thus indicating that periodicity in the leakage flow is likely weak. This observation contrasts with the case of the fan studied by Canepa et al. [13], in which a strong periodicity in the leakage flow was observed at high Ψ . The geometrical differences between the two rotors prevent from providing a definite explanation for this flow difference.
In the present section, an intuitive description of the flow features related to low-frequency noise is reported in order to help interpret the relevant flow behavior. As Ψ increases, the leakage flow rate increases due to the increase in the pressure difference in the gap, while the flow rate through the rotor decreases consistently with the negative slope of the characteristic curve. Depending on shape and proportions of the gap channel, the leakage flow leaves the gap in a direction that may be more radial or axial, e.g., see the study of the effect of the rotor axial position reported by Canepa et al. [12]. In the present rotor, see Figure 2, the radial part of the channel beyond the axial to radial bend presents a superposition of the rotor ring with the stationary walls 1.4 times longer than the meatus width. This suggests that the flow leaving the channel is likely radial. At a distance of almost three times the channel width, it encounters the step constituted by the panel edge that tends to turn the flow in the axial direction. Prerotation helps the leakage flow stream radially outwards, while the pressure gradient generated by the rotor has an opposite effect.
As a matter of fact, at high Ψ , the leakage flow streams radially outwards and a large separated-flow region forms; at low Ψ , the leakage flow has an important axial component and deflects towards the rotor resulting in a recirculation bubble attached to the ring. All this is related to the possibility for the leakage flow to penetrate the main one or being deflected. In the former case, the path followed by the leakage flow before being reingested by the rotor is longer than in the latter one. As a result, the mixing of the large-scale flow structures contained in the leakage flow with the main one is expected to be stronger than in the former case, resulting in stronger decay. Depending on the residual strength of the ingested flow structures, a stronger or weaker interaction with the rotor blades takes place, and stronger or weaker blade loading fluctuations yield. Eventually, stronger or weaker noise results. The Ψ value at which the flow transition takes place depends on the above listed parameters. Such a behavior is consistent with the modifications of both the leakage flow and the SPLlow that take place at Ψ 0.09. These aspects have been also discussed in Canepa et al. [12,13].
The vector plots show that several flow patterns may be identified:
(1)
Below the design Δ p   (points 1–5), a recirculation bubble attached to the ring lip may be clearly detected at Ψ = 0.0788, and it is also present at Ψ = 0.0617; at the interface between the leakage flow and the main one, high T u ¯ values are present. At Ψ = 0.0617, the high T u ¯ stripe in front of the rotor lip suggests that the bubble should be present. At very low Ψ , that is at points 1 and 2, no bubble may be identified; should it be present, it would be very thin since the measurement domain extends up to 3 mm from the ring lip, but, likely, the leakage flow is attached to it. In all of the cases, due the limited extension of the bubble, the flow leaving the gap is reingested by the rotor within a short distance;
(2)
At Ψ = 0.0925 (point 6), the design operating point is approached and the flow pattern has an important change: the gap flow becomes centrifugal and a large separated-flow zone appears instead of the separation bubble attached to the ring. The center of such a zone is located away from the panel wall and at radial locations far from the ring; small T u ¯ values are attained in the gap flow;
(3)
Beyond the design conditions (i.e., at Ψ = 0.103–0.109, points 7 and 8), the leakage flow remains radial with large T u ¯ values; the velocity direction, together with the absence of a center of the recirculation zone, indicates that the leakage flow leaves the measurement domain before turning towards the rotor and being eventually reingested. The large- T u ¯ zone is still present in front of the blade;
(4)
As Ψ further increases (i.e., at Ψ = 0.114–0.137, points 9 and 10), the features of the leakage flow are qualitatively unchanged, but the flow at the blade tip clearly modifies as it streams along the ring lip. It points radially outwards and then mixes with the leakage flow; at some locations v a < 0 . At large Δ p and low Q ( Ψ = 0.127–0.137, points 11 and 12), the flow deteriorates: it probably separates in the lower part of the blade span as v r > 0 at small r , and part of it leaves the rotor from the blade tip area consistently with the negative v a ; the remainder recirculates through the gap. Such a behavior may also be related to the radial breakdown of the flow downstream of the rotor, e.g., see Milanese et al. [22]. However, such operating points are of limited interest since the rotor efficiency is very small.
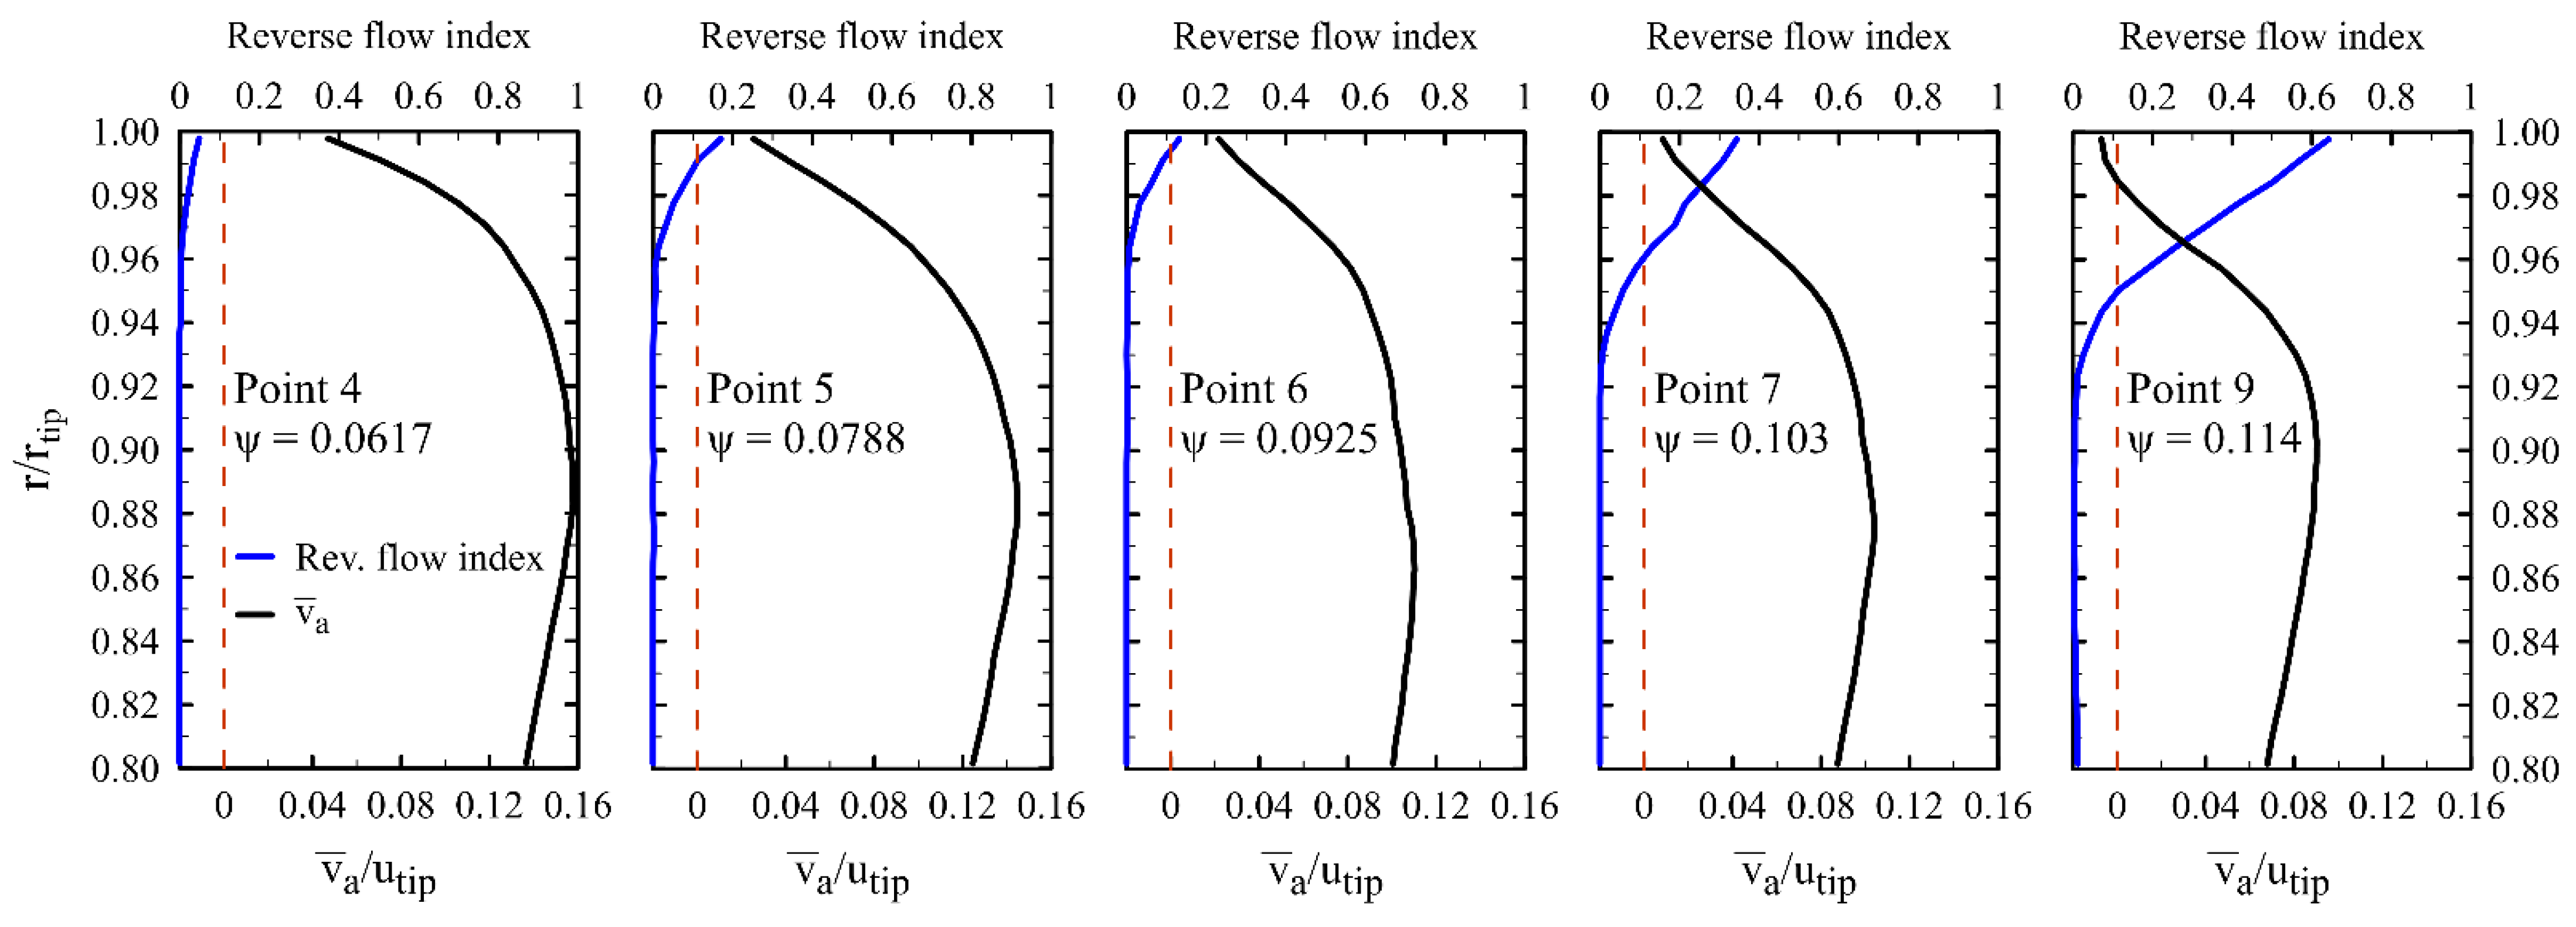
Furthermore, at all Ψ , a large- T u ¯ stripe is present in front of the blade but upstream of this area T u ¯ is smaller. This indicates that turbulence is not convected there by the main flow. As already mentioned, such high values are only partially due to the blade passage unsteadiness, since that high unsteadiness area is present in front of the blade tip in some of the T u   ˜ ¯ plots of Figure 4 also, i.e., at Ψ = 0.0964, 0.0996, and 0.103. Such a local maximum is present at all of the higher loading points also, and its presence indicates that either turbulence is produced there or some related flow features are hidden in the time averaged vector plots; the observation of some instantaneous velocity fields, see Canepa et al. [4], showed that, at high   Ψ , a reverse flow may be present at the blade tip. In order to provide further evidence to this assumption, regions of reverse flow need to be identified. To this aim, a reverse flow index RI has been computed along the radial traverse closest to the blade ( x / r t i p = 0.0135) for each Ψ . Assuming that reverse flow in front of the blade is related to negative v a values, such an index is simply defined as the percentage of instantaneous samples with v a < 0 out of the 800 acquired ones. Its profiles related to operating points 4, 5, 6, 7, and 9 are reported in the plots of Figure 5 together with the v a ¯ ones. The trend of RI is rather regular: it is very small or even null along most of the span and then it increases in front of the blade tip. At point 4, it does not reach 0.05, indicating that instantaneous negative v a is statistically not significant. At points 5 and 6, the trends are rather similar, and the maximum value is approximately 0.15. At point 7, the maximum value increases to more than 0.3 and at point 9 it reaches 0.65. The region where the reverse flow index is not null gradually increases in size with Ψ , but it extends from r / r t i p = 0.97 to 1 at point 4 and from 0.92 to 1 at point 7. The v a ¯ profiles have qualitatively similar trends, but at points 7 and 9 a change in convexity takes place at r / r t i p 0.96; furthermore, at point 9, slightly negative v a ¯ values are attained beyond r / r t i p 0.99. Instantaneous negative v a values may be related to the presence of reverse flow coming from the blade but also to turbulent vortexes convected by the mean flow. However, compared to the low   Ψ cases, at high Ψ , the strength of the turbulent vortexes associated with the leakage flow is smaller due to the higher decay that has already been discussed. Furthermore, they should not significantly contribute to the mean velocity sign, as the flow sampling is not synchronized with their passage, which is random. Hence, their contribution to the instantaneous negative v a , i.e., to RI, is expected to be less important at high Ψ . This supports the assumption that, at least at point 9 but likely at point 7 also, a reverse flow coming from the rotor is present.
Overall, the above described trend is consistent with the SPLlow growth beyond Ψ 0.05 and also with the explanation hypothesized in Canepa et al. [4] for such a growth. More precisely, it was assumed that the leakage flow rate increase results in a noise increase followed by a sudden decrease as the transition from the attached recirculation bubble to a large separated-flow zone takes place; then, a further strong increase takes place as separation takes place in the blade tip region. A transition from a leakage flow attached to the ring lip to a separated flow region is a possible explanation for the SPLlow dip at Ψ 0.05 but, though reasonable, this remains a conjecture only, since at such low Ψ the leakage flow is weak and is restrained between the main flow and the ring lip. On the other hand, the laser light reflections from the ring further complicate taking PIV measurements close to the wall. Hence, the study focuses on the flow transition at approximately Ψ 0.09.

3.3. Flow Pattern Modification about Ψ ≅ 0.09

The SPLlow decrease that takes place between Ψ = 0.08 and 0.09 suggests that a way to decrease the leakage noise is realizing a leakage flow that points radially outwards instead of a more axial one, as the latter is directly reingested by the rotor with a lesser decay of large-scale structures. Hence, it is interesting to deepen how the transition from the attached recirculation bubble to such a flow takes place. In Canepa et al. [12], the flow pattern modification was sudden, but it was observed during a constant Ψ rotational speed ramp with a continuous rotor deformation. Despite the differences between the two cases, this showed that even small modifications in geometrical parameters or operating conditions may have relevant effects on both flow pattern and noise level. In the present stiff rotor, the SPL decrease is less abrupt, suggesting that in the absence of deformation either the flow changes more gradually or an intermittent behavior between two different flow patterns takes place. In order to deepen insight into such an aspect, cases Ψ = 0.0788 and Ψ = 0.103 have been assumed as references for the attached recirculation bubble and the large recirculating flow zone, respectively. Then, measurements have been repeated at eight intermediate operating conditions with a Δ p spacing of about 6 Pa, see Table 1. The related time averaged vector plots are reported in Figure 4. They show that the modification in the flow pattern seems rather gradual, as the separation bubble increases in size, its center displaces away from the wall and at larger radii, and eventually it exits the measurements domain upper boundary. However, a more careful observation shows that in cases Ψ = 0.0788, 0.0819, 0.0857, and 0.0889, the time averaged leakage flow is directly reingested by the rotor, while in cases Ψ = 0.0925, 0.0964, 0.0996, and 0.103, it streams radially outwards along the panel. This would suggest that the transition between the two flow patterns takes place between Ψ = 0.0889 and Ψ = 0.0925.
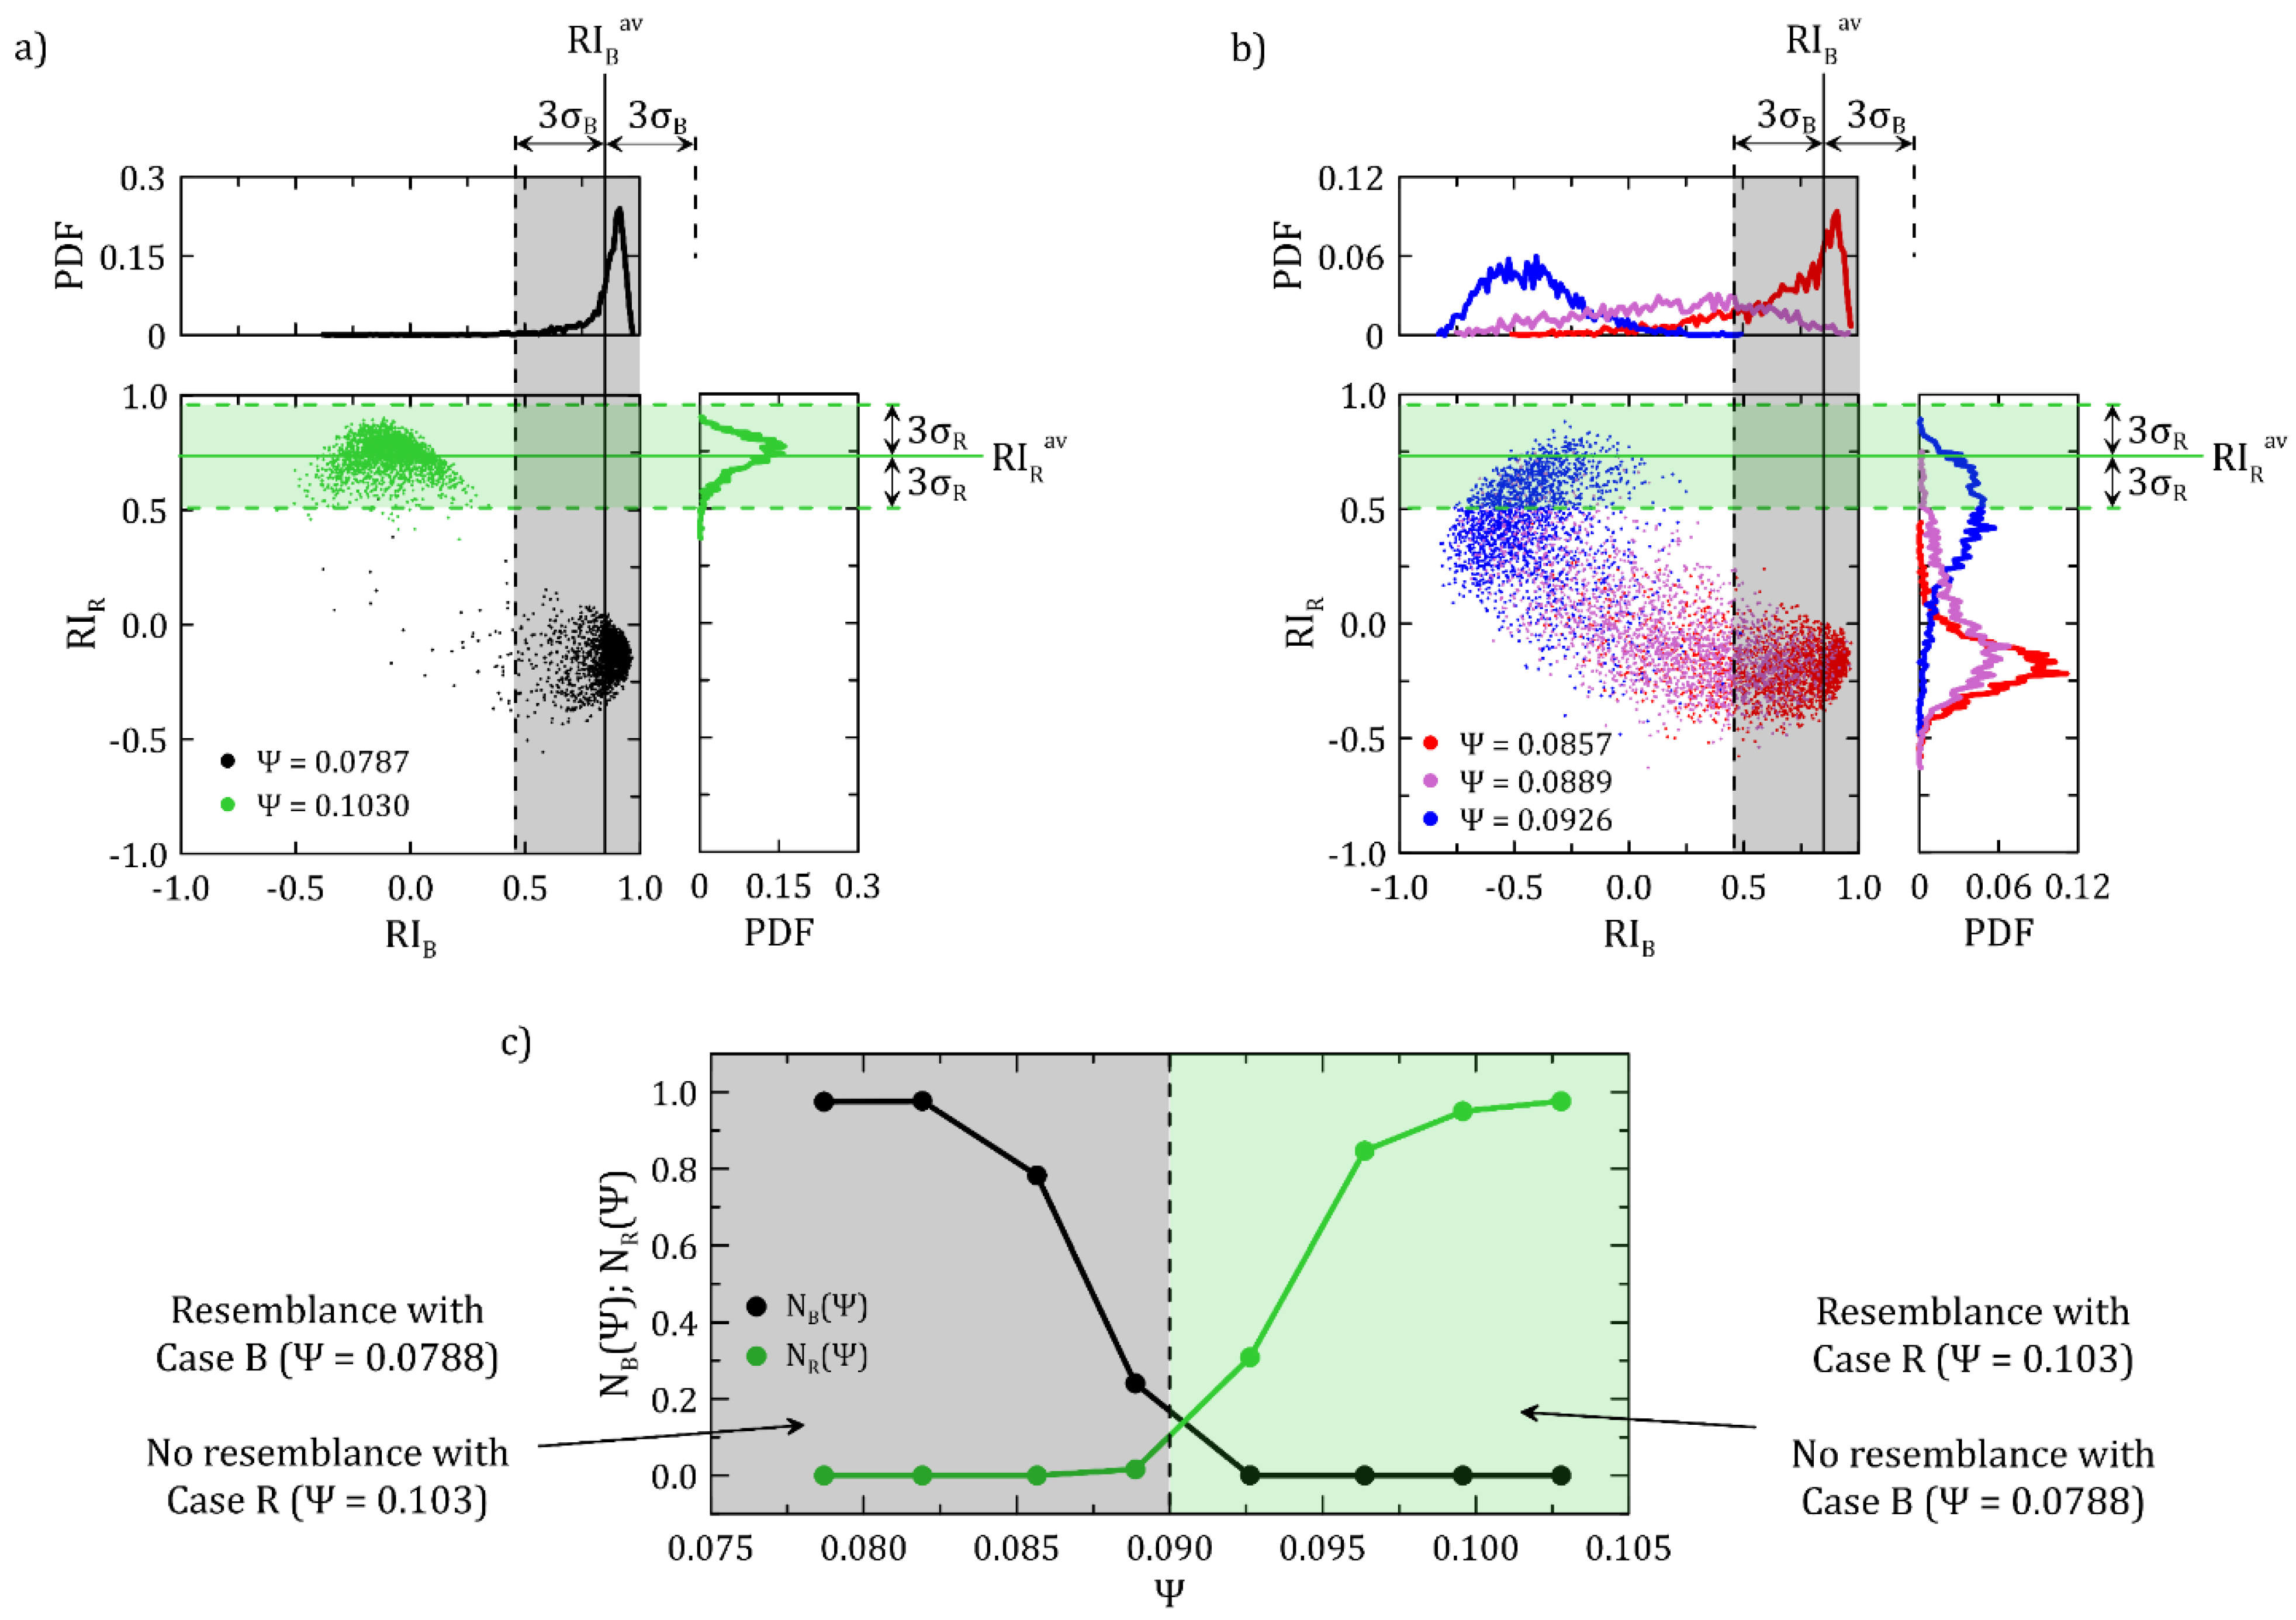
However, the flow features are related to the instantaneous flow field, which may largely differ from the time averaged one especially across a flow modification or in presence of intermittency. In order to evaluate how much the flow pattern related to each operating point resembles either of the two reference flow fields, the 2000 instantaneous flow fields related to each of the eight operating points have been compared to the time averaged reference flow fields. To this aim, the flow in the rectangular region close to the wall ( r / r t i p = 1.120–1.468 and x / r t i p = 0.014–0.176) has been considered since it is either centripetal (case Ψ = 0.0788) or centrifugal (case Ψ = 0.103) and, hence, it easily allows distinguishing the flow patterns; for the sake of simplicity, the two cases will be referred to as B (recirculation Bubble) and R (Radial flow), respectively. Then, for each Ψ , RI B n ( Ψ ) and RI R n ( Ψ ) have been computed according to Equation (3) for any n = 1, 2000 (i.e., for each instantaneous flow field); this has yielded eight sets of 2000 RI B and eight sets of 2000 RI R values. Then, the mean value and rms of the sets RI B n ( 0.0788 ) and RI R n ( 0.103 ) have been computed, yielding the pairs RI B a v ( 0.0788 ) and σ B ( 0.0788 ) and RI R a v ( 0.103 )   and σ R ( 0.103 ) , see Figure 6a. As expected, for these cases the mean value is large, but it does not equal 1, and the rms is smaller than in the other cases, since fluctuations in the instantaneous flow fields are present anyway.
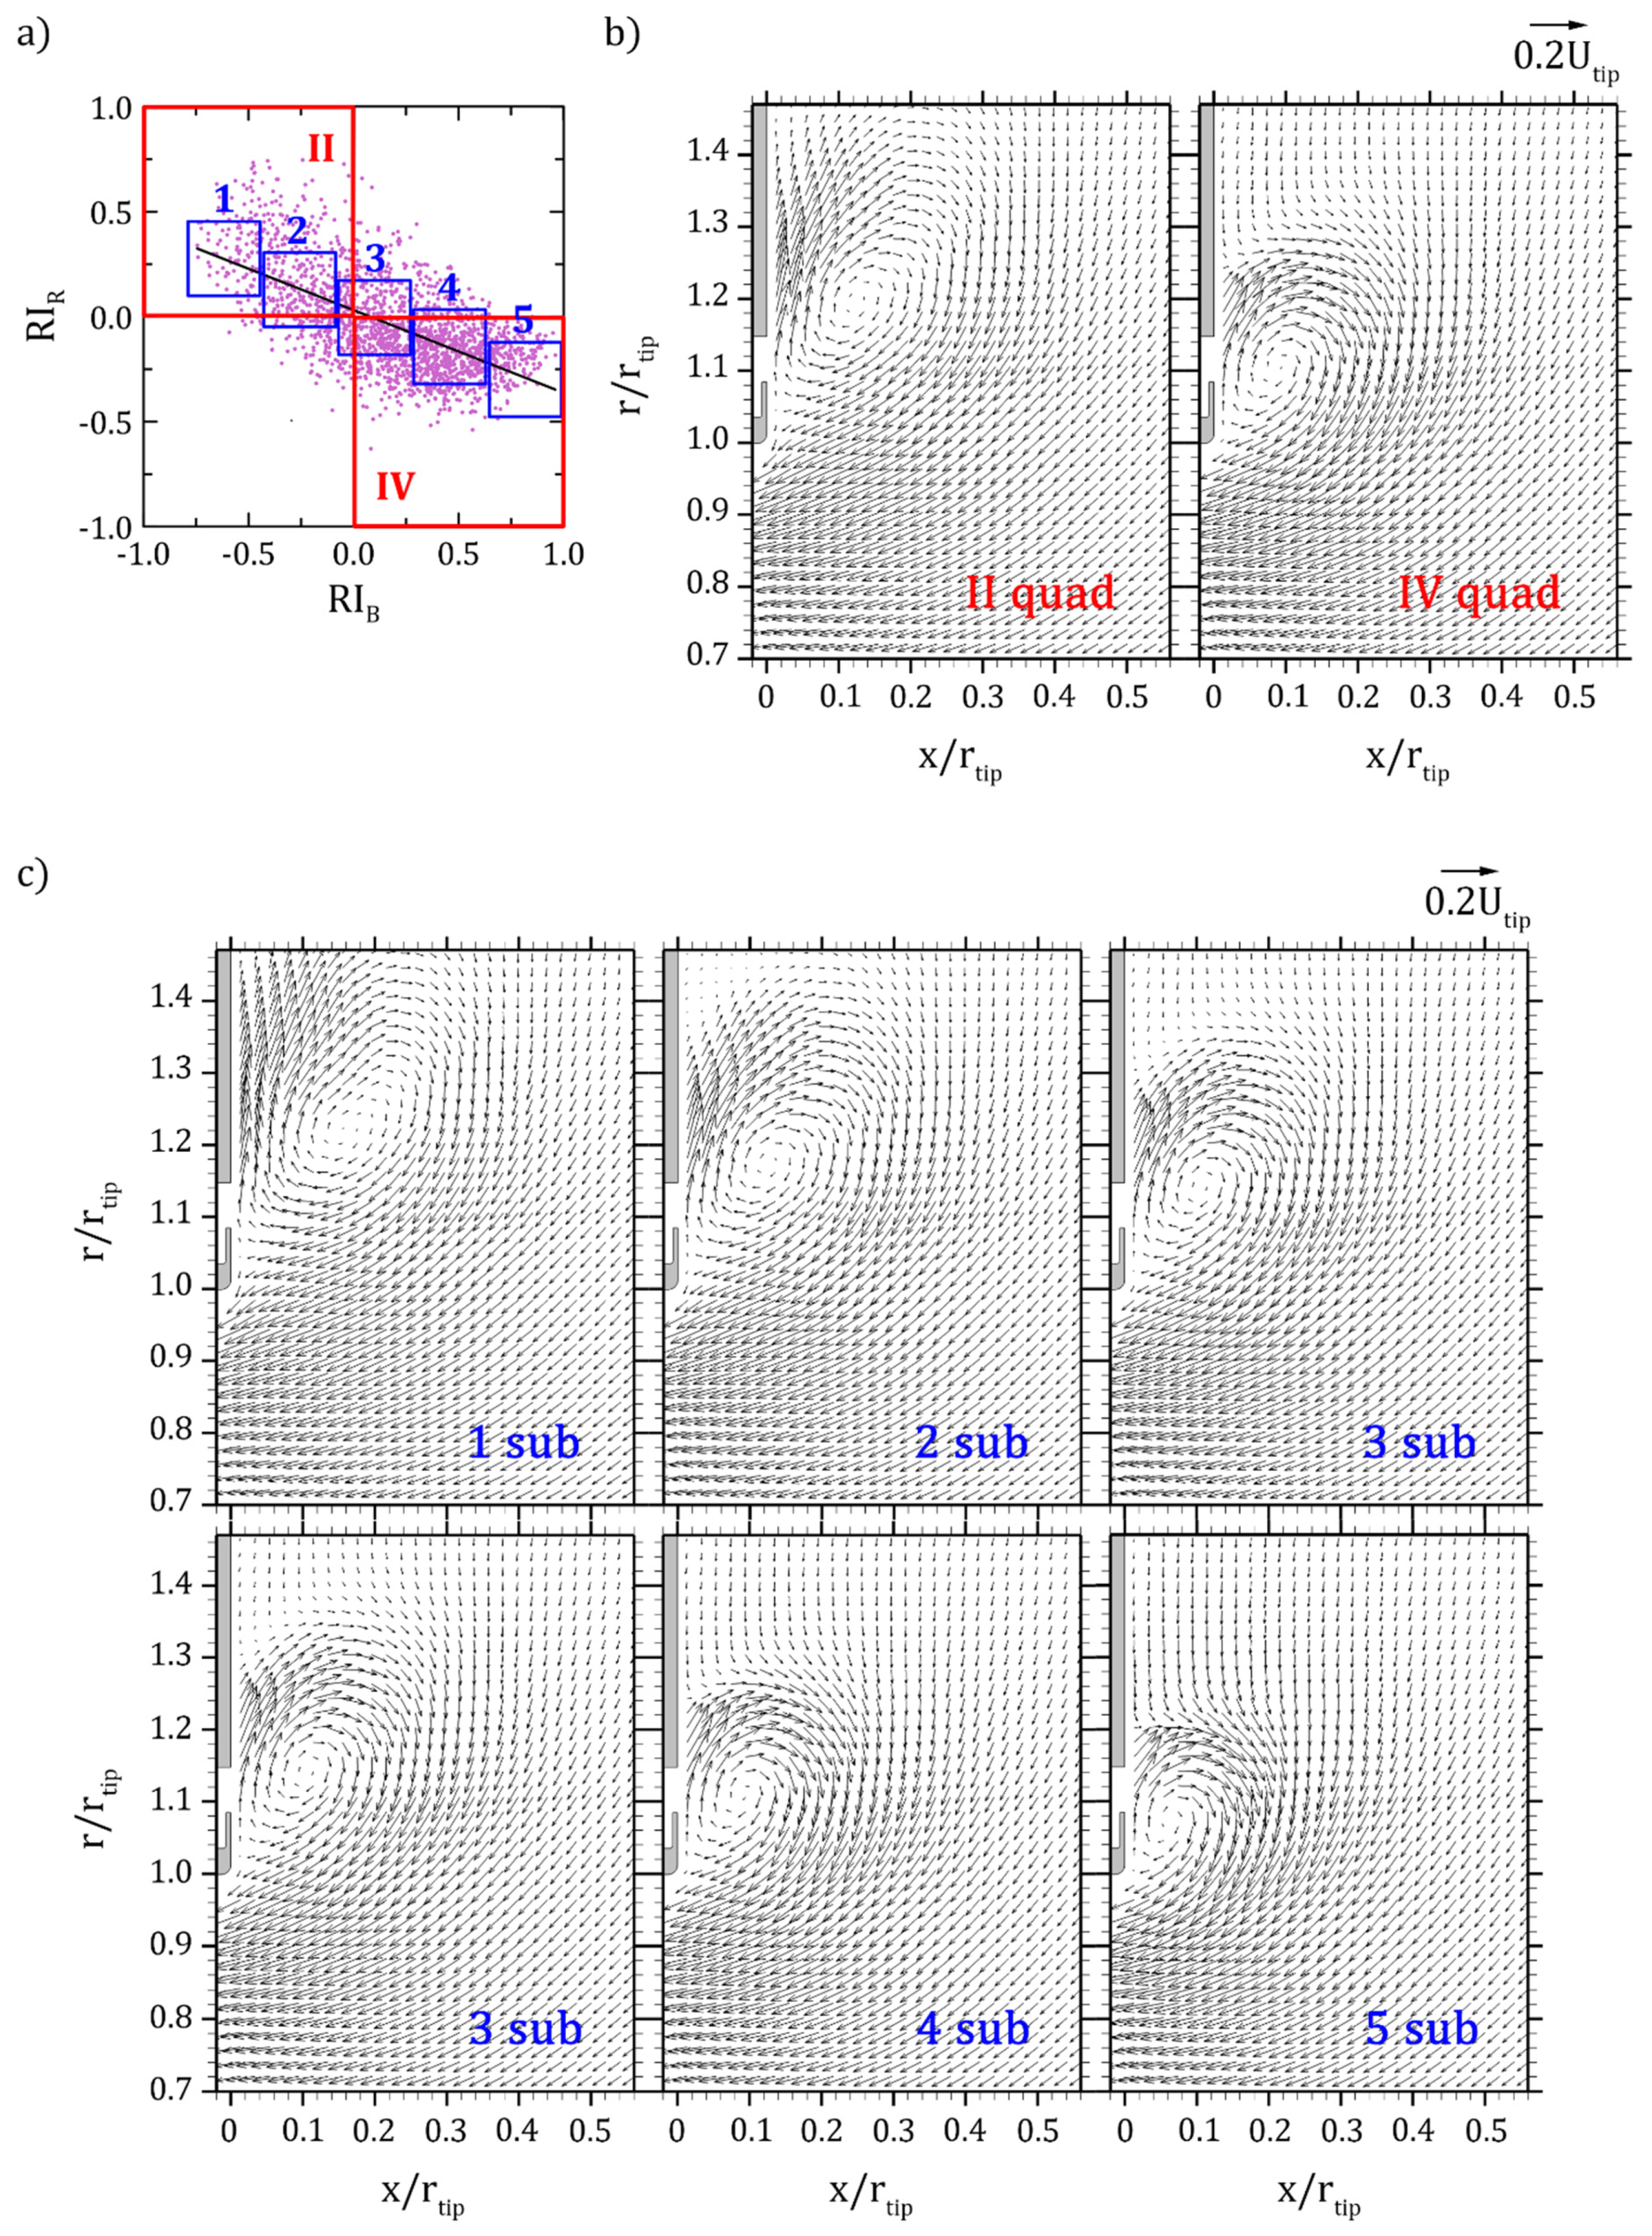
For any Ψ , the resemblance of the instantaneous flow fields with the two reference cases has been evaluated building the probability density functions (PDFs) of both RI B n ( Ψ ) and RI R n ( Ψ ) . Then, the percentages of RI B n ( Ψ ) and RI R n ( Ψ ) belonging to the ranges RI B a v ( 0.0788 ) ± 3 σ B ( 0.0788 ) and RI R a v (   0.103 ) ± 3 σ R ( 0.103 ) have been computed, see Figure 6b. Such percentages are referred to as N B ( Ψ ) and N R ( Ψ ) , respectively, and are plotted in Figure 6c versus Ψ . Based on that criterion, for Ψ 0.09 , there should not be any resemblance with the radial flow of case Ψ = 0.103 since N R ( Ψ ) 0 , while for Ψ 0.09 , there should not be any resemblance with the recirculating flow of case Ψ = 0.0788 since N B ( Ψ ) 0 . For both N B ( Ψ ) and N R ( Ψ ) , only two points lay in the range 0.2–0.85: Ψ = 0.0857, 0.0889 and Ψ = 0.0925, 0.0964, respectively; this suggests that the transition takes place at approximately Ψ = 0.09. However, low RI absolute values not only are due to completely different flow fields but also to the sensitivity of the scalar product to vector misalignment; for instance, such a misalignment may result from a different location of the center of a recirculation bubble. Hence, small values do not necessarily indicate an absence of resemblance. Furthermore, the employed criterion has a certain degree of arbitrariness and, thus, a deeper analysis has been performed which also considers the vector fields. To this aim, the pairs RI R n ( Ψ ) and RI B n ( Ψ ) have been plotted for the reference cases ( Ψ = 0.0788 ,   0.103 ), yielding the scattered plots of Figure 6a. Cases Ψ = 0.0857, 0.0889, and 0.0925 have been selected out of the eight ones since they are close to Ψ = 0.09; the related scattered plots are reported in Figure 6b. The comparison of such plots with the ones related to the reference cases (see Figure 6a) shows that a certain similarity exists between cases Ψ = 0.0857 and Ψ = 0.0788 on the one hand and between cases Ψ = 0.0925 and Ψ = 0.103 on the other hand. On the contrary, case Ψ = 0.0889 (see Figure 7a) shows a continuous spread about a regression line with a negative slope. The cluster is denser in the IV quadrant where RI B n > 0 and RI R n < 0 , (56% of points) than in the II quadrant where RI B n < 0 and RI R n > 0 (23% of points). It is straightforward to assume that high density in the IV quadrant implies high resemblance with case Ψ = 0.0788 and, conversely, with case Ψ = 0.103 when density in the II quadrant is high. Hence, the instantaneous vector fields related to the two quadrants have been averaged, showing that, basically, resemblance to either the former case or the latter one exists, see Figure 7b. The rather uniform cluster does not suggest the presence of any bimodality. However, an intermittent behavior between the two reference flow patterns could be present, but it could not have been detected due to the arbitrariness of the resemblance criterion. Hence, the whole set of instantaneous flow fields has been divided in five square subsets with side Δ RI = 0.35, and the related averaged vector fields have been compared to the reference ones. They are plotted in Figure 7c and show that a gradual modification from one reference flow pattern to the other one is present. It appears as a displacement of the recirculation zone center away from the ring and in a leakage flow which becomes more radial as RI B n decreases and RI R n increases. This excludes the presence of an intermittent behavior. In terms of Δ p , the operating points are uniformly spaced at approximately 6 Pa, thus showing that, overall, the flow pattern is very sensitive to the pressure rise as the transition from one flow pattern to the other one takes place in less than a 12-Pa- Δ p variation, i.e., Δ Ψ = 0.0064. Furthermore, this analysis shows that, despite the arbitrariness in the way RI B n , RI R n , N B , and N R have been computed, the choice done allows to properly identifying the actual features of the flow pattern.

4. Conclusions

The present work regards the leakage flow in axial fans provided with a rotating shroud and stems from a previous study, based on the comparison between aerodynamic and acoustic measurements. Such a study provided useful information about the noise generating mechanisms influencing the low-frequency range. Unfortunately, the limited number of operating points at which PIV measurements were taken resulted in a number of unsolved questions. To this aim, in the present investigation, the characteristic curve has been surveyed at a large number of points yielding a thorough study of the leakage flow development as the pressure rise varies. The results of the work are:
(1)
A detailed description of the evolution of the leakage flow as a function of the loading.
It has been found that, starting from very low pressure rise, the leakage flow streams along the rotor ring and is immediately ingested by the rotor. Then, a recirculation bubble attached to the ring forms with a large turbulent fluctuation interface. As the pressure rise further increases, the separation bubble also increases in size together with the highly turbulent region. Finally, as the design point is approached, a flow pattern transition takes place with the leakage flow streaming radially outward and forming a large separated flow zone. Such a configuration is stable and nearly unchanged in the remainder of the characteristic curve with a general decrease of the turbulence intensity. Such a transition depends on a combination of factors that include the loading, but it may be expected that changing shape and/or size of the gap clearance may change the operating point at which it takes place;
(2)
A detailed analysis of the flow pattern transition that, for the present geometry, takes place about the design operating point.
In light of these results, the investigation has focused on the flow pattern transition; two operating points, above and below the design one, have been assumed as the reference for flow patterns and the measurements have been repeated with very small pressure rise steps. At each operating condition, a statistical quantitative metric, based on the resemblance index, has allowed to identify the percentage of instantaneous vector fields resembling to the reference cases. This has shown that the shift from the attached recirculation bubble to the large separated-flow zone takes place within a pressure rise range of less than 5% of the maximum pressure rise. Namely, at all surveyed operating conditions but one, either one flow pattern or the other one is present. At that single point, the behavior is not intermittent, since the velocity field may resemble both reference ones or any intermediate pattern where the separation bubble is progressively displaced apart from the fan ring. This indicates that, within a very small pressure rise range, the interaction between the leakage flow and the main one is far from being univocal. Despite the arbitrariness in its computation, the resemblance index has proven effective in detecting and analyzing the transition process and the different flow patterns. Considering the strong sensitivity of the leakage flow to the details of the gap geometry, this indicates that a careful design of the gap may have a positive effect on the radiated noise;
(3)
The establishment of a correspondence between leakage flow and SPL growth.
The comparison of the flow patterns with a previously reported trend of the SPL shows that interruptions in the SPL growth with increasing head may be due to modifications in the leakage flow pattern; this may also help interpret the results of acoustic measurements that sometimes may appear inconsistent;
(4)
Further evidence of the existence of a flow reversal at the blade tip has been provided.
Such a flow separation at the blade tip is likely responsible for the low-frequency noise generation at high-loading; unfortunately, a detailed study of that phenomenon has not been performed for reasons of space, but it will be the next extension of the present work.

Author Contributions

E.C.: Conceptualization, Supervision, Investigation, Writing—original draft. A.C.: Conceptualization, Supervision, Writing—review. M.M.: Investigation, Data curation, Visualization, Writing—original draft. A.N.: Investigation, Visualization, Writing—original draft. All authors have read and agreed to the published version of the manuscript.

Funding

This research received no external funding.

Institutional Review Board Statement

Not applicable.

Informed Consent Statement

Not applicable.

Data Availability Statement

Not applicable.

Acknowledgments

The authors kindly acknowledge Johnson Electric Asti srl for having provided the tested rotor.

Conflicts of Interest

The authors declare no conflict of interest.

Nomenclature

OASPLoverall sound pressure level, ref. 20 μPa
Npercentage of instantaneous flow fields similar to the reference one
Qvolume flow rate
rradial coordinate
SPLsound pressure level spectrum, ref. 20 μPa
SPLlowsound pressure level in the range 6 < St < 90, ref. 20 μPa
SPLhighsound pressure level in the range 90 < St < 300, ref. 20 μPa
RIresemblance index
StStrouhal number (frequency normalized with Ω/60)
Tu turbulence   intensity   based   on   u t i p
u t i p peripheral speed of the blade
v a , v r , v ϑ components of the absolute velocity
xaxial coordinate
Δppressure rise through the rotor (static outlet minus total inlet)
ϑ tangential (azimuthal) coordinate
ρ0air density
φ flow   coefficient ,   Q u t i p π r t i p 2
Ψ pressure   rise   coefficient ,   Δ p 0.5 ρ 0 u t i p 2  
Ωrotational speed (expressed in rev/min)
Superscripts
˜ related to the ensemble average
¯ related to the time average
related to non-periodic instantaneous fluctuations
Subscripts
Brelated to the reference case with recirculation bubble
Rrelated to the reference case with radial leakage flow
tiprelated to the blade tip

References

  1. Carassale, L.; Cattanei, A.; Mazzocut Zecchin, F.; Moradi, M. Leakage flow flutter in a low-speed axial-flow fan with shrouded blades. J. Sound Vib. 2020, 475, 115275. [Google Scholar] [CrossRef]
  2. Longhouse, R. Control of tip-vortex noise of axial flow fans by rotating shrouds. J. Sound Vib. 1978, 58, 201–214. [Google Scholar] [CrossRef]
  3. Canepa, E.; Cattanei, A.; Mazzocut Zecchin, F.; Milanese, G.; Parodi, D. An experimental investigation on the tip leakage noise in axial-flow fans with rotating shroud. J. Sound Vib. 2016, 375, 115–131. [Google Scholar] [CrossRef]
  4. Canepa, E.; Cattanei, A.; Mazzocut Zecchin, F. Leakage Noise and Related Flow Pattern in a Low-Speed Axial Fan with Rotating Shroud. Int. J. Turbomach. Propuls. Power 2019, 4, 17. [Google Scholar] [CrossRef] [Green Version]
  5. Fukano, T.; Takamatsu, Y.; Kodama, Y. The effects of tip clearance on the noise of low pressure axial and mixed flow fans. J. Sound Vib. 1986, 105, 291–308. [Google Scholar] [CrossRef]
  6. Fukano, T.; Jang, C.-M. Tip clearance noise of axial flow fans operating at design and off-design condition. J. Sound Vib. 2004, 275, 1027–1050. [Google Scholar] [CrossRef]
  7. Piellard, M.; Coutty, B.; Le Goff, V.; Vidal, V.; Pérot, F. Direct Aeroacoustics Simulation of Automotive Engine Cooling Fan System: Effect of Upstream Geometry on Broadband Noise. In Proceedings of the 20th AIAA/CEAS Aeroacoustics Conference, Atlanta, GA, USA, 16–20 June 2014. AIAA Paper 2014–2455. [Google Scholar]
  8. Magne, S.; Moreau, S.; Berry, A. Subharmonic tonal noise from backflow vortices radiated by a low-speed ring fan in uniform inlet flow. J. Acoust. Soc. Am. 2015, 137, 228–237. [Google Scholar] [CrossRef] [PubMed]
  9. Moreau, S.; Sanjose, M. Sub-harmonic broadband humps and tip noise in low-speed ring fans. J. Acoust. Soc. Am. 2016, 139, 118–127. [Google Scholar] [CrossRef] [PubMed]
  10. Zenger, F.J.; Renz, A.; Becher, M.; Becker, S. Experimental investigation of the noise emission of axial fans under distorted inflow conditions. J. Sound Vib. 2016, 383, 124–145. [Google Scholar] [CrossRef]
  11. Na, G.-D.; Kameier, F.; Springer, N.; Mauß, M.; Paschereit, C.O. URANS Simulations and Experimental Investigations on Unsteady Aerodynamic Effects in the Blade Tip Region of a Shrouded Fan Configuration. In Proceedings of the ASME Turbo Expo 2017: Turbomachinery Technical Conference and Exposition, Charlotte, NC, USA, 26–30 June 2017. ASME Paper GT2017-6. [Google Scholar]
  12. Canepa, E.; Cattanei, A.; Jafelice, F.; Mazzocut Zecchin, F.; Parodi, D. Effect of rotor deformation and blade loading on the leakage noise in low-speed axial fans. J. Sound Vib. 2018, 433, 99–123. [Google Scholar] [CrossRef]
  13. Canepa, E.; Cattanei, A.; Mazzocut Zecchin, F.; Parodi, D. Large-scale unsteady flow structures in the leakage flow of a low-speed axial fan with rotating shroud. Exp. Therm. Fluid Sci. 2019, 102, 1–19. [Google Scholar] [CrossRef]
  14. Zhu, T.; Lallier-Daniels, D.; Sanjose, M.; Moreau, S.; Carolus, T. Rotating coherent flow structures as a source for narrowband tip clearance noise from axial fans. J. Sound Vib. 2018, 417, 198–215. [Google Scholar] [CrossRef]
  15. Hussain AK, M.F.; Reynolds, W.C. The mechanics of an organized wave in turbulent shear flow. J. Fluid Mech. 1970, 41, 241–258. [Google Scholar] [CrossRef]
  16. Grant, I. Particle image velocimetry: A review. Proc. Inst. Mech. Eng. Part C J. Mech. Eng. Sci. 1997, 211, 55–76. [Google Scholar] [CrossRef]
  17. Prasad, A.K.; Adrian, R.J.; Landreth, C.C.; Offutt, P.W. Effect of resolution on the speed and accuracy of particle image velocimetry interrogation. Exp. Fluids 1992, 13, 105–116. [Google Scholar] [CrossRef]
  18. Liu, K.; Haworth, D.C. Development and Assessment of POD for Analysis of Turbulent Flow in Piston Engines. In Proceedings of the SAE 2011 World Congress and Exhibition, Detroit, MI, USA, 12–14 April 2011. SAE Technical Paper: 2011-01-0830. [Google Scholar]
  19. Willman, C.; Scott, B.; Stone, R.; Richardson, D. Quantitative metrics for comparison of in-cylinder velocity fields using particle image velocimetry. Exp. Fluids 2020, 61, 62. [Google Scholar] [CrossRef] [Green Version]
  20. Hanson, D.B. Spectrum of rotor noise caused by atmospheric turbulence. J. Acoust. Soc. Am. 1974, 56, 110–126. [Google Scholar] [CrossRef]
  21. Majumdar, S.J.; Peake, N. Noise generation by the interaction between ingested turbulence and a rotating fan. J. Fluid Mech. 1998, 359, 181–216. [Google Scholar] [CrossRef]
  22. Milanese, G.; Cravero, C. Analysis of the Design Bounds in Performance Limits for Industrial Axial Flow Fans. In Proceedings of the ASME Turbo Expo 2020: Turbomachinery Technical Conference and Exposition, Virtual, Online, 21–25 September 2020. ASME Paper no. GT2020-16058. [Google Scholar]
Figure 1. Experimental facility: (a) test rig; (b) rotor characteristic curve and investigated conditions; (c) rotor prototype; (d) rotor geometry.
Ijtpp 06 00040 g001
Figure 2. Dependence of the SPL on the operating conditions.
Ijtpp 06 00040 g002
Figure 3. Time averaged flow field in the gap region: basic survey.
Ijtpp 06 00040 g003
Figure 4. Time averaged flow field in the gap region: detailed survey.
Ijtpp 06 00040 g004
Figure 5. Radial profiles of the reverse flow index, time averaged axial velocity, and turbulence intensity ( x / r t i p = 0.0135).
Ijtpp 06 00040 g005
Figure 6. Resemblance index properties: (a) scatter plots of RIB and RIR for the reference cases; (b) scatter plots of RIB and RIR at Ψ = 0.0857, 0.0889, and 0.0925; (c) NB and NR dependence on Ψ.
Ijtpp 06 00040 g006
Figure 7. Averaged velocity fields at Ψ = 0.0889: (a) subsets employed for the averaged velocity fields; (b) averaged fields related to the II and IV quadrants; (c) averaged fields related to smaller subsets (the case 3 sub was reported in both rows in order to ease comparisons).
Ijtpp 06 00040 g007
Table 1. Investigated operating conditions.
First Set of
Measurements
ΨSet of Detailed
Measurements
Ψ
10.0120--
20.0267--
30.0445--
40.0617--
50.07885det0.0788
--5A0.0819
--5B0.0857
--5C0.0889
60.09256det0.0925
--6A0.0964
--6B0.0996
70.1037det0.103
80.109--
90.114--
100.120--
110.127--
120.137--
Publisher’s Note: MDPI stays neutral with regard to jurisdictional claims in published maps and institutional affiliations.