Article

Intelligent Recommender System for Big Data Applications Based on the Random Neural Network †

Intelligent Systems Group, Electrical and Electronic Engineering, Imperial College London, London SW7 2AZ, UK
This article is an extended version of the papers presented in the International Neural Network Society Conference on Big Data (2018) and International Conference on Artificial Intelligence Applications and Innovations (2018).
Big Data Cogn. Comput. 2019, 3(1), 15; https://doi.org/10.3390/bdcc3010015
Submission received: 26 December 2018 / Revised: 10 February 2019 / Accepted: 15 February 2019 / Published: 18 February 2019
(This article belongs to the Special Issue Big-Data Driven Multi-Criteria Decision-Making)

Abstract

:
Online market places make their profit based on their advertisements or sales commission while businesses have the commercial interest to rank higher on recommendations to attract more customers. Web users cannot be guaranteed that the products provided by recommender systems within Big Data are either exhaustive or relevant to their needs. This article analyses the product rank relevance provided by different commercial Big Data recommender systems (Grouplens film, Trip Advisor and Amazon); it also proposes an Intelligent Recommender System (IRS) based on the Random Neural Network; IRS acts as an interface between the customer and the different Recommender Systems that iteratively adapts to the perceived user relevance. In addition, a relevance metric that combines both relevance and rank is presented; this metric is used to validate and compare the performance of the proposed algorithm. On average, IRS outperforms the Big Data recommender systems after learning iteratively from its customer.

1. Introduction

Recommender systems were developed to address the search needs and relevant product selection within the Big Data from the biggest market place: the Internet. Whereas their benefit is the provision of a direct connection between customers and the desired products while reducing users’ browsing time, any recommendation outcome will be influenced by a commercial interest as well as by the customers’ own ambiguity in formulating their requests, queries or lack of product information. Online market places enable the trade of products provided by third party sellers while transactions are processed by the online market place operator; customers are provided with a service that search for products by their description or different properties such as department, brand, reviews or price. Another relevant application of Recommender Systems is travel industry: real time travel industry’s information and services have been enabled by The Internet; customers directly purchase flight tickets, hotels and holiday packages via Web Pages and mobile applications where additional distribution costs have been eliminated due a shorter value chain. Although this direct purchase has benefited both customers and travel service providers, it has also created a reliance on Recommender Systems as products not presented on higher ranks within the suggestions may lose potential interested customers and revenue. In both examples, online market place and travel industry, product relevance is decided by ranking algorithms to transform information and products as visible or hidden to customers. Under this business model, Recommender System ranking algorithms could be tuned for a fee in order to artificially increase the rank of specific products whereas also product providers can be tempted to optimize the description of their products to manipulate the ranking algorithms. The main consequence to the final customer is that irrelevant products may be shown with a higher rank whereas relevant ones hidden at the very bottom of the recommended list.
In order to solve the described recommendation economic bias; this article presents a Big Data Intelligent Recommender System (IRS) based on the Random Neural Network as an interface between a customer’s request and the recommender systems. IRS gets a request from the customer and obtains products from the recommender system data set allocating one neuron to each product dimension. The product relevance is evaluated by calculating an innovative cost formula that divides a request into a multidimensional vector and calculates its dimension terms with several relevance functions.
IRS adjusts and acquires the perceived customer’s relevance and rearranges the obtained products based on the related centre point of the product’s dimensions. IRS acquires product relevance on an iterative process where the customer assesses directly the presented products. Its performance is evaluated and compared against the Big Data Recommender Systems (Grouplens film, Trip Advisor and Amazon) with an innovative presented quality metric that combines relevance and rank. This article considers the term iteration as customer recommendation iterations rather than the learning algorithm iterations of the machine learning methods. Two different and independent learning algorithms are included, either Gradient Descent learns the related dimension centre or Reinforcement Learning updates the network weights recompensing related attributes while penalizing irrelevant ones. The research has compared IRS against the Big Data Recommender Systems with customer queries provided directly by validators. In addition, Gradient Descent and Reinforcement Learning algorithms have been independently analysed based on learning rate and product relevance.
The use of neural networks in recommender systems is described in Section 2. The Intelligent Recommender System mathematical model is defined in Section 3, Implementation in Section 4 and its validation against Big Data Recommender Systems is shown in Section 5. Finally, conclusions are shared in Section 6.

2. Recommender Systems

Customers interact with Recommender Systems via a user interface based on a Web portal or mobile app where a profiler extracts the customer properties based on feedback obtained from explicit and implicit methods; customers’ interest on different products is predicted by ranking algorithms which provide a list of proposed items based on its calculated personalized relevance. Recommender system data architecture is mostly based on a database that stores and continuously updates item description and customer ratings (Figure 1). Due to the clustering and filtering services, Recommender Systems are extensively used within e-commerce [1] as they guide customers to discover new and rare products not found by themselves otherwise.
The model of a Recommender system (Figure 2) consists on:
  • a set Q of N users, Q = {u1, u2, …, uN}
  • a set I of M items, I = { i1, i2, …, iM}
  • a rating matrix R, R = [rij] where i ∈ Q and j ∈ I
  • a set X of N feature vectors, X = {x1, x2, …, xN}
  • a weight matrix W, W = [wij] where i ∈ N and j ∈ N+M
The set of user-items {uN, iM} has an associated set of feature vector {xN} that represents customers with the different products assigned to them in the Content model. The relevance judgement pred(u,i) is a binary score, order or decision, based on the similarity between customers and products in the Collaborative model and weights in the Content model.

2.1. Recommender System Classification

Recommender systems can be mainly classified into two groups [2]. Content-based recommender systems are founded on a product representation and a customer’s preference profile; relevant products with similar features are identified based on the item and user properties without considering other customer’s evaluations. Content-based approach suffer from some drawbacks [3] such as its incapability to suggest very different products and the need for the customer to rank numerous products beforehand in order to obtain useful recommendations. Collaborative recommender systems are based on the product feedback made by similar users and the customer’s preceding ratings to other products; product suggestions are ranked based on the correlation between products and customers. Even though collaborative recommendation decreases the disadvantages from the Content-based option; it has also another issues such as the requirement of a significant volume of customer evaluation information in order to compute precise correlations and predictions, it also ignores on its calculations newly additional products or customers. Finally, Hybrid Recommender Systems combines both approaches to optimize their features while reducing their drawbacks.
Customers provide ratings of the various properties of a product as a rating vector in multi-criteria ranking recommender systems [4], whereas products from several sources with locality collaborative filtering algorithms are suggested by cross domain recommender systems [5]; they function by first modelling the typical similarity of the customer-product relation as a direct interconnected path and then analysing all the possible paths that connect customer or products in order to find new cross domain relations.
The evaluation of Recommender Systems in different e-commerce solutions is performed by various relevance metrics [6]; accuracy assessment measurements are divided into three different groups: classification of the correct decision making, rank of the right order and prediction of the difference between real and projected customer rankings.
A supplementary contribution to increase accuracy on Recommender Systems is based on the inclusion of Social network customer data [7]; social recommender systems using Collaborative Filtering methods are divided into two types: neighbourhood social approach based on social network graphs and matrix factorization approach based on the integration of customer item feedback history with customer to customer social data.

2.2. Personalized Information and Recommender Systems

Personal Recommender Systems are one of the most efficient tools to solve the information overload problem such as shopping online in an Internet marketplace. The common issue faced by different recommender systems is that both the customer and product information are dynamically changing [8]; in order to overcome this problem, an improved dynamic method based on updating local information is proposed to avoid the computational expensive process to update static information when an additional information is generated by the customer or product. A personalized recommendation methodology to increase the efficiency and value of suggestions when used to e-commerce applications consists on several of data mining methods such as Web usage learned from a clickstream, a decision tree induction that minimizes recommendation mistakes by providing recommendations only to users who are expected to purchase the recommended products, product taxonomy and finally association rule that chooses high e-commerce valuable items between possible recommendable products [9].
Models relevant to the application of personalized content services and their result on an improved customer experience and satisfaction can be identified as [10]: information overload theory that implies that customer satisfaction improves when the recommended content adjusts to customer interests, uses and gratifications theory focuses on incentives for access to information and customer involvement theory covers the customer’s preferred content provided by a method that enables the costumer explicit participation. The Internet of Things (IoT) and Big Data sharing enable Personal Recommender Systems to model their customer models from external sources [11]; data from a variety of social Web services such as Facebook, LinkedIn can improve Personal Recommender System quality as it contains large amounts of personal information about customers.
Personal Recommender Systems can also be applied in traditional transport information systems [12], currently, customers must explicitly provide information related to both their profiles and journeys in order to receive a personalized response at additional extra effort from the customer in terms of search time; the proposed model identifies implicit customers’ information and predicts their needs even if some data is missing by the use of an ontology that models more accurately semantic data. The inconsistency between the growth of tourism data and the struggle of tourists to retrieve tourism relevant information creates a business model for Tourism Information Recommender System [13]; the Recommender System solution merges the existing tourism information recommendation Websites where key relevance algorithms enable to take tourism decisions more accurately and promptly while permitting customers to expand their user experience of the tourism information service.
A customer model Web recommender system that predicts and personalizes music playlists is based on a hybrid similarity matching function that merges ontology-based semantic error measurements with collaborative filtering [14]; a personalized music playlist is dynamically produced from a collection of recommended playlists comprising the user most relevant tracks. A hybrid travel recommender system that suggests what suits the customer is based on the individual demographic information to make more intelligent and user acceptable recommendations [15]; the model merges demographic and collaborative filtering methods with the characteristics of content-based travel.

2.3. Neural Networks in Recommender System

Recommender Systems have also used Neural Networks as a solution to cluster customers or products into different groups or to detect and forecast customer rankings to different products.
Adaptive Resonance Theory (ART) is formed of a recognition threshold, a reset module and two layers of neurons: comparative and identification; the ART neural network is trained with an unsupervised learning algorithm. The k-separability algorithm has been applied in a collaborative filtering recommender system [16], the method is developed for each customer on several phases: a group of customers is clustered based on their similarity using an ART where the Singular Value Decomposition (SVD) matrix is determined with the k-separability algorithm applied to its neural configuration. The feed forward structured network has an input layer that consists of n neurons assigned to the customer rankings’ matrix and an output layer that is formed on m neurons that feed the customer model. Customers are clustered into diverse categories using an ART model [17] where the vector that models the customer’s features corresponds the neural network input layer and the output layers represent the applicable category.
A Self Organizing Map (SOM) is a neural network trained with unsupervised learning that reduces the dimensions of a quantified model for an input space. A Recommender System that applies a SOM with collaborative classification [18] is based on segmenting users by demographic characteristics in which users that correspond to the segments are clustered based on their item selection; then, the collaborative classification process is applied on the cluster allocated to the customer to recommend items where the product selection in each cluster is learned by the SOM, the input layer is the user cluster and the output layer is the group classification. The customer rating in a Recommender System application is calculated by a SOM [19] that forecasts the relevance of the unassessed products, the SOM is applied to classify the ranking group in order to fulfil a sparse ranking matrix.
Several solutions merge neural networks with collaborative filtering. A neural network recognizes implicit associations between customer preferences and potential relevant products to overcome the recommender system sparsity problem [20]; the patterns are applied to enhance personalized recommendations with collaborative filtering where the multilayer feed forward neural network structure is trained on every customer ranking vector, the output layer provides a prediction of the customer ranking vector that completes the unassessed products. A study of the hypothetic relationship between the students’ final results and previous grades is founded on an Intelligent Recommender model framework [21] with a feed forward structure in a multi layered neural network that finds structures and relationships within the data based on a supervised learning process.
Any Machine Learning algorithm based on a feed forward neural network structure that consists on n input neurons, two hidden neurons and a single output neuron [22] could model collaborative filtering processes; the proposed algorithm reduces dimensionality using the Singular Value Decomposition (SVD) of an initial customer rating matrix that eliminates the need for users to rate common products with the purpose of predicting other user’s interest. The input layer of the neural solution corresponds to a n singular vector that represents the averaged customer ranking whereas the output neuron characterizes the forecasted customer ranking.
Film recommendation systems have also been deployed with Neural Networks. A feed forward neural structure with only a hidden layer models a recommendation service that forecasts customer relevance to films based on its description, contextual data and feedback provided [23]; a TV program is characterized by a 24 dimensional attribute vector whereas the neural structure is formed of an input layer of five neurons (one for the day, three for the genre and one for the hour), a hidden layer and an output layer of two neurons: one for relevance and the other for irrelevance. A household viewer is assigned to its film ranking at a precise time by a neural network [24]; the input layer is formed of 68 nodes which correspond to the customer’s temporal information and the 3 output nodes represents the different classifiers. An “Interior Desire System” solution [25] is based on the concept that if customers have similar browsing patterns, then they might have similar preference for explicit items; the back propagation neural structure organizes customers with matching navigation behaviour into clusters with comparable purchasing purpose patterns based on supervised learning.

2.4. Deep Learning in Recommender Systems

Recommender Systems algorithms have also been based on Deep Learning. A deep feature characterization [26] learns content data capturing the probability and implicit connection between products and customers where a Bayesian probabilistic model for the ranking matrix enables Collaborative classification. Customers and products are allocated into a vector space representation that improves the association among users and their preferred items by a Deep Learning method [27]; the method is expanded to acquire features of products from diverse groups and customer properties based on their search query log and Web browsing history, two diverse high dimensional sparse features are mapped by the neural structure into low dimensional dense features within a combined semantic space.
Deep neural networks are able to better generalize hidden feature interactions with low-dimensional dense embedding learned from the sparse characteristics, however this approach can over-generalize and recommend less relevant products when the customer-item combinations are sparse or with high ranks [28]; the proposed solution joins the benefits of wide linear learning that memorizes the sparse feature combinations using cross-product features with Deep Learning that generalizes previously unrevealed feature combinations. An approach that merges a collaborative filtering recommendation model with Deep Learning [29] applies a feature representation calculation using a quadric polynomial regression algorithm, which calculates more precisely the latent characteristics by improving the standard matrix factorization algorithm and the deep neural network method to predict the ranking values.
Most music is currently distributed, sold and consumed digitally making automatic music recommendation an increasingly relevant business opportunity in the last recent years. Deep convolutional neural networks are applied as a latent factor method for recommendation and prediction of the latent factors from music audio when they cannot be obtained from usage data [30], although a large semantic gap is found among the corresponding audio signal and the characteristics of a song that affect customer preference. Current content-based music recommendation methods normally extract traditional audio content characteristics such as Mel-frequency cepstral parameters before predicting customer preferences [31]; however, these standard features were not initially generated for music recommendation, a structure based on a deep belief network with a probabilistic graphical model automates the method that simultaneously learns characteristics from audio content and generates personalized recommendations.

2.5. Recommender Systems for Big Data

Big Data shall be processed and filtered before traditional Recommender Systems techniques can be applied to it due its extensive size and analysis time. A Recommendation System for the Big Data available on the Web in the structure of ratings, reviews, opinions, complains remarks, feedback and comments about any product is developed using Hadoop Framework [32]; the method uses a hybrid filtering technique based on numerical data such as ratings or ranks. Collaboratively Filtering does not provide enough scalability and accuracy when applied into Big Data Recommender Systems [33]; in order to overcome this issue, Big Data techniques such as association rule mining are inserted in three steps: Feature Extraction to generate the customer’s product rating matrix, Low Dimension Latent Factor Matrix that uses the alternating least square method and Association Rule Mining Algorithm for generating multistage rule recommendations.
A hybrid recommendation technique for Big Data systems combines collaborative and content based filtering methods [34]; in addition, it also applies a product ranking and classification algorithm and social media opinion mining to analyse user feelings and hidden preferences from its posts. A personalized information recommendation method applies the measurement for context contribution and item correlation [35], the model improves the association rule algorithm and applies the Frequent-Pattern (FP) tree to increase the efficacy of the user behaviour pattern by mining in the Big Data structure.
A Big Data model for Recommender Systems uses social network data [36], the model incorporates factors such as human behaviour in the relationship and structure of the data in order to make better recommendations. A group centre recommender solution in the Cyber Physical Social Systems domain covers the detection of group activity, the analysis of ranking data for enhanced accuracy and the modelling of a group preference to enable context mining from several data sources [37], the proposed architecture is based on three components: group discovery for behavioural similarity, rating revision and multidimensional group preference modelling.
News platforms also present the challenges and prospects for applying the services of Big Data structures in recommendation services [38]; a news recommendation method is proposed to generate recommendation instructions at article level following the value model, the integration of the value and likelihood theme representations where the generation of recommendation instructions at theme level reduces the cold start issue. A Recommender System is based on the technical features that define a Big Data platform with a JSON wrapper data source layer, Hadoop knowledge based data management layer and rest API application layer [39]; the application has the capability to obtain information from distributed and diverse data sources, advanced data techniques, analysis, technologies, ability to provide personalized data to customers based on their preferences and enhanced information retrieval services. Matrix Factorization is an algorithm for collaborative filtering recommendation. A fast Tensor Factorization (TF) algorithm is applied for context-aware recommendation from implicit feedback [40]; for better accuracy, it includes all unobserved data to train a TF based context-aware recommender method by scrutinizing the matrix calculation of the closed form solution and memorizing the repetitive calculation to accelerate the process.
Matrix Factorization methods have confirmed a higher performance in data and image processing, however they have associated a greater computational complexity [41], a hybrid fusion collaborative recommendation solution maximizes feature engineering with feed forward neural networks to associate customer and product relationship into a dimensional feature space where product-customer similarity and the preferred products is optimized; Tensor Factorization (TF) improves generalization representing a multi-view data from customers that follow their purchasing and rating history. An improved recommendation model based on item-diversity adds customer interests and implicit feedback [42], it is based on the variance to the matrix factorization algorithm. A collaborative filtering application based on a deep learning method with a deep matrix factorization integrates any type of data and information [43]; two functions that transform features are incorporated to produce latent features of customers and products from diverse input data, in addition, an implicit feedback embedding transforms the implicit sparse and high-dimensional feedback data into a low dimension and real value vector that retains its primary factors.

3. Intelligent Recommender System Model

The Intelligent Recommender System is based on the Random Neural Network (RNN) [44,45,46]. The RNN is a spiking recurrent stochastic structure that models more accurately how signals are transmitted in many biological neural structures propagating as impulses or spikes instead of analogue levels (Figure 3). Its mayor mathematical characteristics are the single neural network resolution for steady state and its product form equation. The RNN has been applied in several solutions such as the cognitive packet networks that search and select paths that meet specific Quality of Service metrics [47,48,49,50,51].
The RNN is composed of M neurons or nodes with a firing rate r(i), each node accepts excitatory and inhibitory spikes from outside sources which may be other nodes or sensors. The impulses are fired according to independent Poisson methods of rates λ+(i) for the excitatory impulse and λ(i) for the inhibitory impulse respectively to neuron or node i Є {1,…M}.
The state qi is the likelihood that the neuron i is active or excited which satisfies the non-linear equation:
q i = λ + ( i ) r ( i ) + λ ( i )
The examples used by animals when they search in a large unknown space were investigated and the role of teamwork was discussed [52]; these ideas were then applied to the search for information when N concurrent “search agents” with similar characteristics are being used [53] establishing that the total average search time can be reduced by aborting and re-starting a search process after a pre-determined time-out, if it has not been successful. The use of more concurrent agents can actually reduce the total energy costs, despite the increase in the number of agents, as well as the search times [54]; these results were confirmed in terms of large data sets distributed over large networks [55].

3.1. Recommendation Model

Recommendation of products or information needs the specification of three key components:
  • a N-dimensional universe of Z products to be recommended;
  • a request that defines the M-concepts or properties desired by a customer;
  • a process that finds and chooses X products from the universe Z, presenting the top Y products to the customer following a rule or method.
Each product in the universe is different from each other in a concept or property; on the other hand, the recommender model considers products to be different if they possess any distinct concept or meaning, even though if the customer may find them identical with respect to its request.
The Recommendation model considers the universe searched by the customer as a relation V formed of a set of Z N-tuples, V = {u1, u2 … uZ}, where uo = (co1, co2 … coN) and co are the N attributes for o = 1, 2 … Z. The relation V consists on N >> M attributes. CRt(m(t)) = (CRt(1), CRt(2), …, CRt(m(t))) defines a customer request where:
  • m(t) characterizes a variable M-dimension attribute vector with 1 < M < N;
  • t represents the recommendation iteration with t > 0.
m(t) is variable to enable the addition or removal of attributes according to their relevance during the recommendation process. CRt(m(t)) obtains its parameters from the attributes that form the domain D(m(t)), where D represents the associated domain from which the universe V is created, therefore, D(m(t)) is a set of concepts or properties.
The reply R associated to the request CRt(m(t)) is a set of X N-tuples R = {u1, u2 … uX} where ui = (ci1, ci2 … ciN) and ci are the N attributes for i = 1, 2 … X. The Intelligent Recommender System only displays to the customer the top set of Y tuples that have the largest neuron potential value between the set of X tuples (Figure 4); the neuron potential is computed at every t iteration and characterizes the relevance of the M-tuple ui. The customer or the request itself are limited mainly by two mayor reasons:
  • the customer’s absence of information or visibility to the entire attributes that create the universe V of products;
  • the customer’s deficiency of defined understanding about the product it is searching.

3.2. Product Cost Formula

The Intelligent Recommender System model considers the universe V is created from the entire products that can be recommended. Each presented product is assigned to an N-tuple ui of the reply set R. The product relevance is calculated according to a product cost formula defined in this section.
The attributes the customer considers related are specified by the customer request CRt(m(t)) as a variable M-dimension vector where the dimension number of the attribute vector m(t) changes as the recommendation iteration t advances. The Intelligent Recommender System chooses products from the universe V assigning a N-tuple ui to every presented product generating a replay set R of X N-tuples. The product cost formula is applied to every product or N-tuple ui from the replay set R of X N-tuples where every ui is considered as a N-dimensional vector. The product cost formula is initially calculated using the related M attributes introduced by the customer on the request, CR1(m(1)) based on the domain D’(m(t)). The final Product Score, PS, is calculated by quantifying the relationship among the figures of the several attributes that it is formed:
PS   =   PV   ×   SF
where PV is the Product Value that quantifies the product relevance and SF defines the Similarity Factor. The Similarity Factor (SF) recompenses products that have relevance scattered among their attributes where the dimensions or attributes of the customer request CRt(m(t)) are more related in the first positions rather than final ones:
SF =   m = 1 M SW [ m ] M
where SW[m] is the Similarity Weight, a M-dimension vector connected to the product or N-tuple ui and m is the attribute index from the customer request CRt(m(t)):
SW [ m ] = { M m M if   SD [ m ] > 0 0 if   SD [ m ] = 0 }
Score Dimension SD[m] is defined as a M-dimension vector that symbolizes the attribute values of every product or N-tuple ui connected the customer request CRt(m(t)). The Product Value (PV) is the addition of every dimension separate figure:
PV =   m = 1 M SD [ m ]
where m is the attribute index from the customer request CRt(m(t)). Each dimension of the Score Dimension vector SD[m] is computed autonomously for every m-attribute figure that generates the customer request CRt(m(t)):
SD [ m ] = S   ×   PPF   ×   RPF   ×   DPF
The Intelligent Recommender System only considers three diverse types of domains of customer interest for this article: words, numbers and prices. The score S is assessed dependent if the domain of the attribute is a word, number or price. If the domain D(m) is a word, IRS computes the value of Score according to the equation:
S = WCR NWR
where the figure of WCR is 1 if the word of the m-attribute of the customer request CRt(m(t)) is present in the recommended product or it is assigned the value of 0 otherwise. NWR represents the amount of words in the recommended product. If the domain D(m) is a number, IRS selects the best score S from the numbers they are present in the recommended product that optimizes the product cost formula:
S = ( 1 ( | DVR PVR | | DVR | + | PVR | ) ) NNP
where DVR represents the number of the m-attribute of the customer request CRt(m(t)), PVR defines the number within the product and NNP is the overall amount of numbers in the product. If the domain D(m) is a price, IRS selects the greatest Score from the prices in the product that optimizes the product cost formula:
S = ( DVR PVR ) NP
where DVR represents the price of the m-attribute of the customer request CRt(m(t)), PVR is the price in the product and NP is the overall amount of prices in the product. If the recommended product presents irrelevant price information, this is penalized by dividing the Score by the overall amount of prices in the product. The Position Parameter Factor (PPF) is created on the concept that an attribute displayed in the initial locations of the product recommendation is more related than if it is displayed at the final places:
PPF = NCP DVP NC
where NCP defines the amount of characters in the product and DVP corresponds to the location in the product where the dimension is displayed. The Relevance Parameter Factor (RPF) includes the customer’s observation of relevance by recompensing the first attributes of the customer request CRt(m(t)) as very sought and penalizing the last attributes:
RPF = 1 PDR M
where PDR is the location of the m-attribute of the customer request CRt(m(t)) and M is the overall amount of dimensions of the request vector CRt(m(t)). The Dimension Parameter Factor (DPF) includes the quantification of customer interest within the type of domains D(m(t)) by scoring higher on the domains that the customer has included more on the request:
DPF = NDT M
where NDT corresponds to the sum of the dimensions within equal domain (word, number or price) on the customer request CRt(m(t)) and M is the overall amount of dimensions of the request vector CRt(m(t)). The final Product Score figure (PS) is assigned to every N-tuple ui of the replay set R, this figure is applied by IRS to rearrange the reply set R of X N-tuples, displaying to the customer the top set of Y products which have the largest potential.

3.3. Customer Iteration

The customer, based on the replay set R evaluates the products provided and selects a subset of Q related products, IQ, of R. IQ is a set formed of Q N-tuples IQ = {u1, u2 … uq}, uq is considered as a vector of N dimensions; uq = (cq1, cq2 … cqN) where cq are the N distinct attributes for q = 1, 2 … Q. Equally, the customer also chooses a subset of P unrelated products, IP of R, IP = {u1, u2 … up}, up is defined as a vector of N dimensions; up = (cp1, cp2 … cpN) where cp are the N distinct attributes for p = 1, 2 … P. Following the customer iteration, the Intelligent Recommender System shows to the customer an updated reply set R of Y N-tuples reordered to the lowest distance to the Related Centre and Unrelated Centre for the products selected.
The Related Centre Point is calculated according to the equation:
RCP [ m ] = q = 1 Q SD q [ m ] Q = q = 1 Q c qm Q
where Q is the amount of related products chosen, m is the attribute index from the customer request CRt(m(t)) and SDq[m] the related Score Dimension vector to the product or N-tuple uq formed of cqm attributes. An equivalent formula is applied to the evaluation of the Unrelated Centre Point.
UCP [ m ] = p = 1 P SD p [ m ] P = p = 1 P c pm P
where P is the amount of unrelated products chosen, m the attribute index from the customer request CRt(m(t)) and SDp[m] the related Score Dimension vector to the product or M-tuple up formed of cpm attributes. The Intelligent Recommender System rearranges the retrieved X set of N-tuples displaying only to the customer the top Y set of N-tuples based on the minimum value among the difference of their distances to the Related Centre Point and the Unrelated Centre Point:
LD = RD UD
where LD is the Lowest Distance, RD represents the Related Distance to the product or N-tuple ui and UD corresponds to the Unrelated Distance to the same product. The Related Distance to every product or N-tuple ui is defined:
RD = m = 1 M ( SD [ m ] RCP [ m ] ) 2
where SD[m] corresponds to the Score Dimension vector of the product or M-tuple ui and RCP[m] represents the Related Centre Point spatial coordinates. Corresponding formula applies to the calculation of the Unrelated Distance:
UD = m = 1 M ( SD [ m ] ICP [ m ] ) 2
where SD[m] is the Score Dimension vector of the product or M-tuple ui and UCP[m] is the coordinate of the Unrelated Centre Point (Figure 5).
An iterative recommendation process is presented that acquires and adjusts to the perceived customer relevance according to the dimensions or attributes the customer has initially selected on its request.

3.4. Attribute Learning

The replay set A to the request CR1(m(1)) is based on the M dimension customer request however products are generated of N dimensions consequently the subset of products the customer has evaluated as related might contain additional related hidden properties the customer did not thought on the initial request. The universe V is created from the domain D(n) or the N attributes which are considered as diverse and independent concepts from which the obtained set of X products are formed. The product cost formula is extended from the M attributes defined in the request CR1(m(1)) to the N attributes that generate the recommended products. The Score Dimension vector, SD[n], is now based on N-dimensions instead of M; a similar attribute extension is adjusted to calculate the Related Centre Point, RCP[n].
The request CR1(m(1)) consists on the M-Dimension vector inserted by the customer however the replay set R is formed of X N-tuples. The customer, according to the displayed replay set R, selects a subset of Q related products, IQ and a subset of P unrelated products, IP. IQ is considered as a set formed of Q M-tuples IQ = {u1, u2 … uq} where uq is a vector of N dimensions; uq = (cq1, cq2 … cqN) and cq are the N distinct attributes for q = 1, 2 … Q. The N-dimension vector Dimension Average, DA[n], is the average figure of the n-attributes for the chosen related Q products:
DA [ n ] = q = 1 Q SD q [ n ] Q = q = 1 Q c qn Q
where Q represents the amount of related products selected, n the attribute index of the relation V and SDq[n] the related Score Dimension vector to the product or N-tuple uq created of cqN attributes. ADV is considered as the Average Dimension Value of the N-dimension vector DA[n]:
ADV = n = 1 N DA [ n ] N
where N represents the overall amount of attributes that generate the relation V. The correlation vector σ[n] is the error between the dimension figures of every product with the average vector:
σ [ n ] = q = 1 Q | SD q [ n ] DA [ n ] | Q =   q = 1 Q | c qn DA [ n ] | Q
where q is the amount of related products chosen, n the attribute index of the relation V and SDq[n] the related Score Dimension vector to the product or M-tuple uq generated of cqN attributes. C is defined as the average correlation figure of the N-dimensions of the vector σ[n]:
C = n = 1 N σ [ n ] N
where N is the overall amount of attributes that generate the relation V. An n-attribute is considered related if:
  • its Dimension Average figure DA[n] is greater than the average dimension ADV
  • its Correlation figure σ[n] is lower than the average correlation C.
On the following customer iteration, the request CR2(m(2)) is generated by the attributes the IRS has evaluated as related based on the above conditions. The replay to the request CR2(m(2)) is an updated set R of X N-tuples; this method reiterates until no new related products can be displayed to the customer (Figure 6).

3.5. Gradient Descent Learning

Gradient Descent learning adjusts to the appreciated customer relevance or comprehension of concepts by associating the attribute figures of every product; it analyses comparable concepts and rejects redundant ones. The IRS Gradient Descent learning algorithm consists on a recurrent structure where the input nodes i = {i1,…,iQ} are the N-tuples uQ that correspond to the chosen related product subset IQ and the output nodes y = {y1,…,yQ} are fixed to the same values as the input nodes. IRS retrieves the network weights, computes the related attributes and finally rearranges the products following the lowest distance to the updated Related Centre Point that focus on the related attributes (Figure 7).

3.6. Reinforcement Learning

The customer choses the related product set IQ to provide the Reinforcement Learning exterior contact with the environment. Reinforcement Learning adjusts to the appreciated customer relevance by increasing the figure of related attributes and decreasing it for the unrelated ones. Reinforcement Learning adjusts the figures of the n attributes of the products, highlighting unseen related properties and ignoring unrelated concepts. The network weights are connected to the replay set R; W = R. IRS adjusts the network weights W by recompensing the product related attributes following:
w ( q , n ) = c qn s 1 +   c qn s 1 × ( c qn s 1 n = 1 N c qn s 1 )
where q is the product or M-tuple uQ created of cqm attributes, n is the product attribute index, M is the overall amount of attributes and s is the iteration value. IRS similarly adjusts the network weights by penalizing the product unrelated attributes according to:
w ( q , n ) = c qn s 1   c qn s 1 × ( c qn s 1 n = 1 N c qn s 1 )
IRS then calculates the potential value of every product following the adjusted network weights and rearranges them displaying to the customer the products that have the greater potential value (Figure 8).

4. Implementation

The Intelligent Recommender System has been implemented in a server to enable online access to customers and validators. The main index page is developed using Java Server Pages (JSP) and Hyper Text Markup Language (HTML). Customers and validators access to the Web server via a Web browser and interact iteratively with the IRS invoking Java Servlets (Figure 9). The main software platform developed is Java Netbeans and the Web Server retrieval of data from the Internet is through Selenium Web-driver. The chosen server for this application is Apache Tomcat due its designed functionality to support Java.
The Intelligent Recommender System acquires different dimensions values (Figure 10) from the user and the Learning Algorithm to use.
The IRS has been programmed to retrieve Big Data from Recommender Systems data sets: GroupLens film, Trip Advisor and Amazon snippets. The process is transparent; IRS gets the request from the user and retrieves the Big Data without altering it. Once results have been retrieved from the data sets, our IRS applies the cost function to calculate their relevance. IRS finally reorders the results according to their relevance value.
The Intelligent Recommender System provides to the customer a reordered list of products re-ranked based on a predetermined cost function using the Random Neural Network; the customer then ticks the relevant results and then the IRS provides to the customer with a reordered list based on the perceived customer relevance; this process repeats iteratively until the customer is satisfied with the recommendation or no additional products are found.

5. Validation

5.1. Quality

The following formula is proposed to measure recommender system quality; it is founded on the idea that a better recommender system suggests a list of more related products on higher order; in a set of P products, P is scored to the top product and 1 to the last product, the proposed quality figure is the addition of the order value for every selected product by the customer. The definition of Quality, Q, is represented as the following equation:
Q = i = 1 Z RP i
where RPi is the rank of the product i with a figure of P if the product is in the top rank and 1 if the product is in the final rank. Z is the entire figure of products chosen by the customer. The best recommender system would provide the greatest Quality figure. Normalized quality, Q ¯ , is defined as the division of the quality, Q, by the optimum figure which it is when the customer evaluates as relevant all the products presented by the recommender system. In this circumstance, Z and P have identical figure:
Q ¯ = Q P ( P + 1 ) 2
It is defined as the quality improvement between different iterations:
I = Q R S Q R Q R
where I is the Improvement, QRS represents the quality of the Recommender System and QR defines the quality reference.

5.2. Experiments

The Intelligent Recommender System is implemented to rearrange the products from three different and independent Big Data Recommender Systems data sets: GroupLens film, Trip Advisor and Amazon. The IRS rearranges the products or films based on the updated product relevance computed by combining only the number of the selected dimensions. The larger the figure, the more relevant the product or film would be. IRS presents to the customer the first 20 products; the customer then selects the more relevant films or products on the first iteration; this ranking has been previously calculated by combining customer reviews to the same products and computing the average figure. Once IRS obtains customer feedback, it reorders the products based on the calculated relevance and presents to the customer a reordered list for further customer evaluation on the second iteration; this process repeats iteratively until the customer is satisfied with the recommendation or no additional products are found (Figure 11). This article considers the term iteration as customer recommendation iterations rather than the algorithm iterations of the machine learning methods.
In the evaluation, validators are asked to select relevant products, not to rank them, as they normally do when using a Recommender System therefore a product is considered as either relevant or irrelevant. Validators are 15 personal friends from Imperial College students, researchers and London young professionals degree educated.

5.2.1. GroupLens Film Data Set

GroupLens is a research group in the Department of Computer Science and Engineering at the University of Minnesota. Since its creation in 1992 GroupLens’ research projects have consisted on Recommender Systems, Online Communities, Mobile Technologies, Digital Libraries and Local Geographic Information Systems. The data set is based on a 5-star rating and genre tagging from MovieLens. It contains 21063128 ratings and 470509 tags across 27303 films. The data set was created by 229060 users between January-1995 and March-2015.
The data sets files are written as comma-separated values, csv extension. The files are encoded as UTF-8. The ratings data file consists of userId, movieId, rating and timestamp, whereas the film data file consists on movieId, title, genres. Genres are: Action, Adventure, Animation, Children, Comedy, Crime, Documentary, Drama, Fantasy, Film-Noir, Horror, Musical, Mystery, Romance, Sci-Fi, Thriller, War, Western and IMAX. The data set is processed by extracting the relevant information; movieId, rating title and genres. All the ratings from individual customers are combined to the same different products where the average value is the final product rating. Each film is considered as a multidimensional vector consisting on the different genres. The film relevance is the averaged film rating which is equally divided between the different genres it is classified.
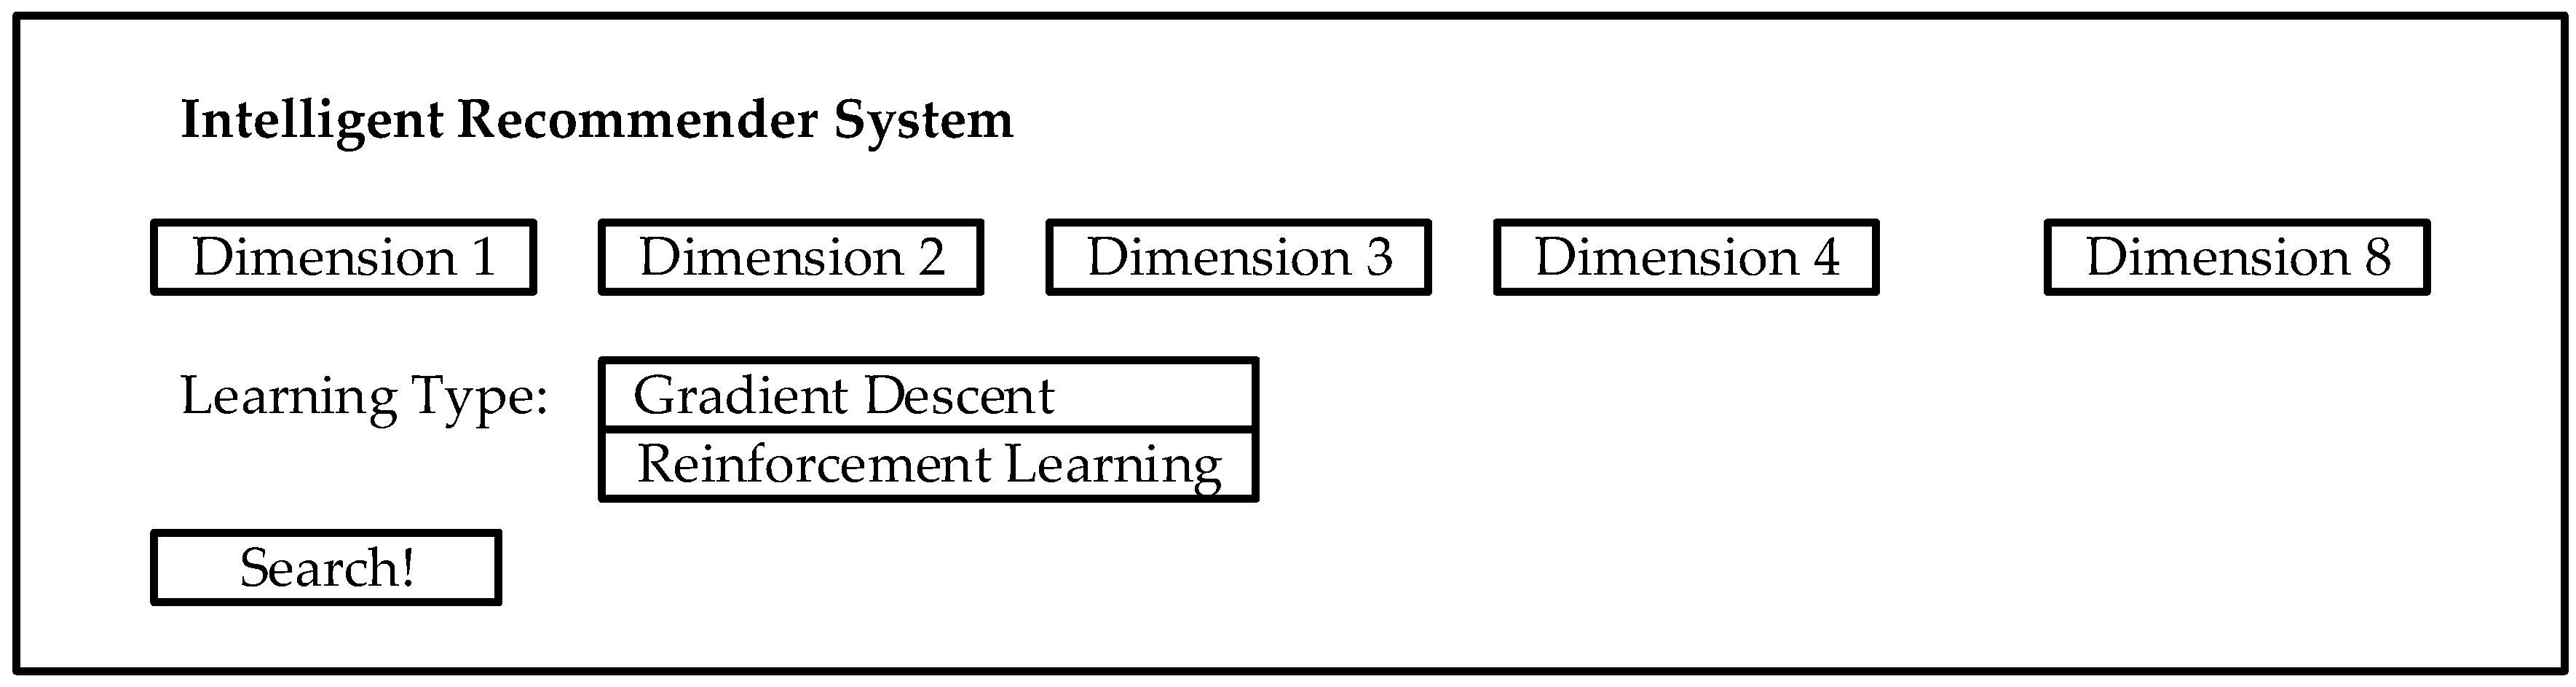
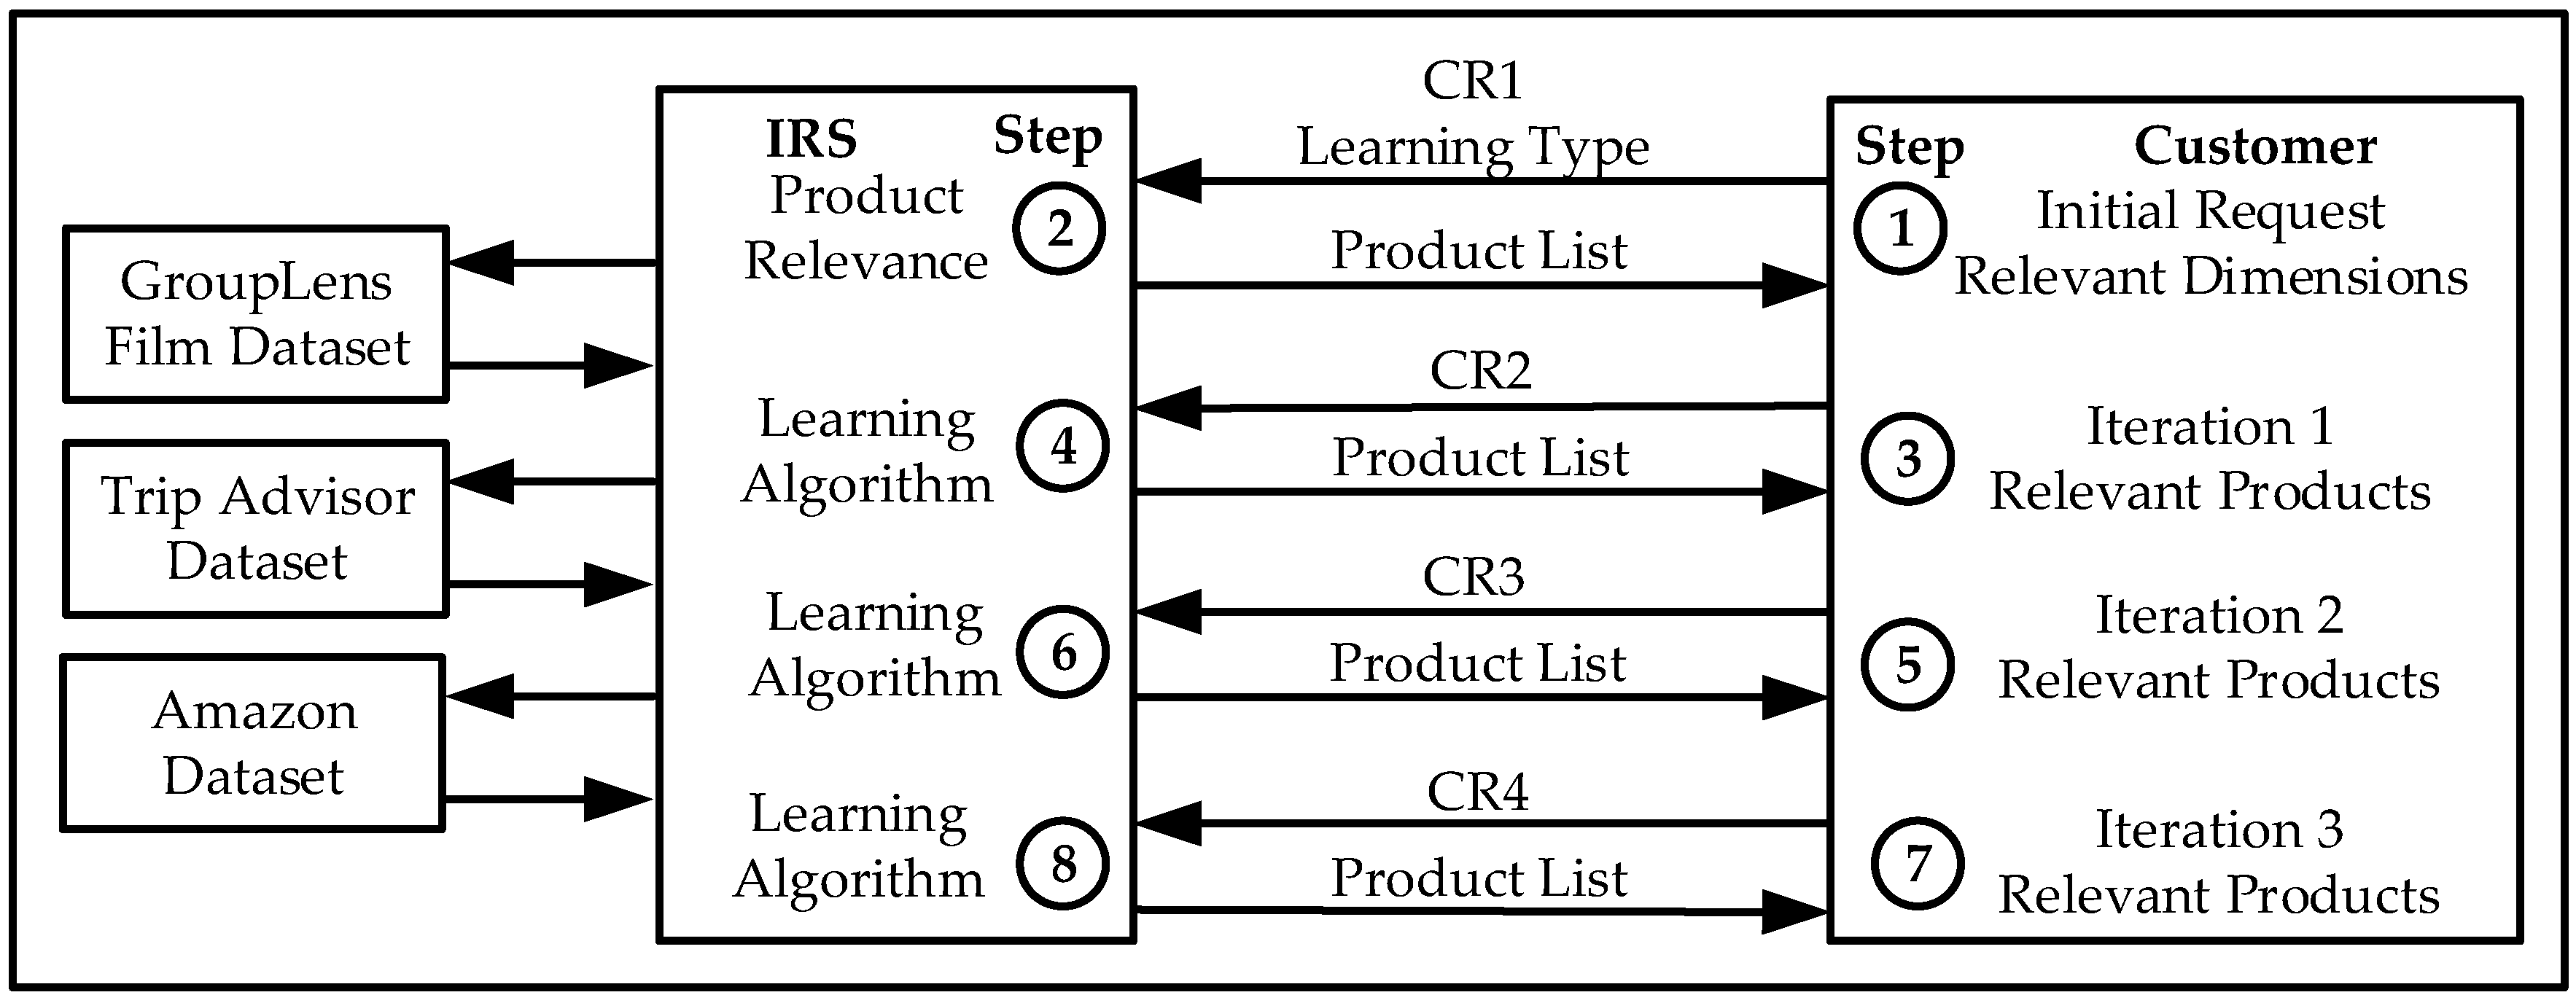
The IRS is programmed to retrieve the user’s relevant film genres and the type of learning (Gradient Descent or Reinforcement Learning). The IRS then reorders the films based on their relevance which is the combined value of the user selected genres only. The Intelligent Recommender System provides a reordered list of film titles to the user based on the higher values of the selected genres; the customer then selects the most relevant products with a higher overall rating; the IRS then continues the recommendation iterative process or provides with the final film titles.
Gradient Descent and Reinforcement Learning have been validated independently for five different queries with ten recommendations in total. Table 1 and 
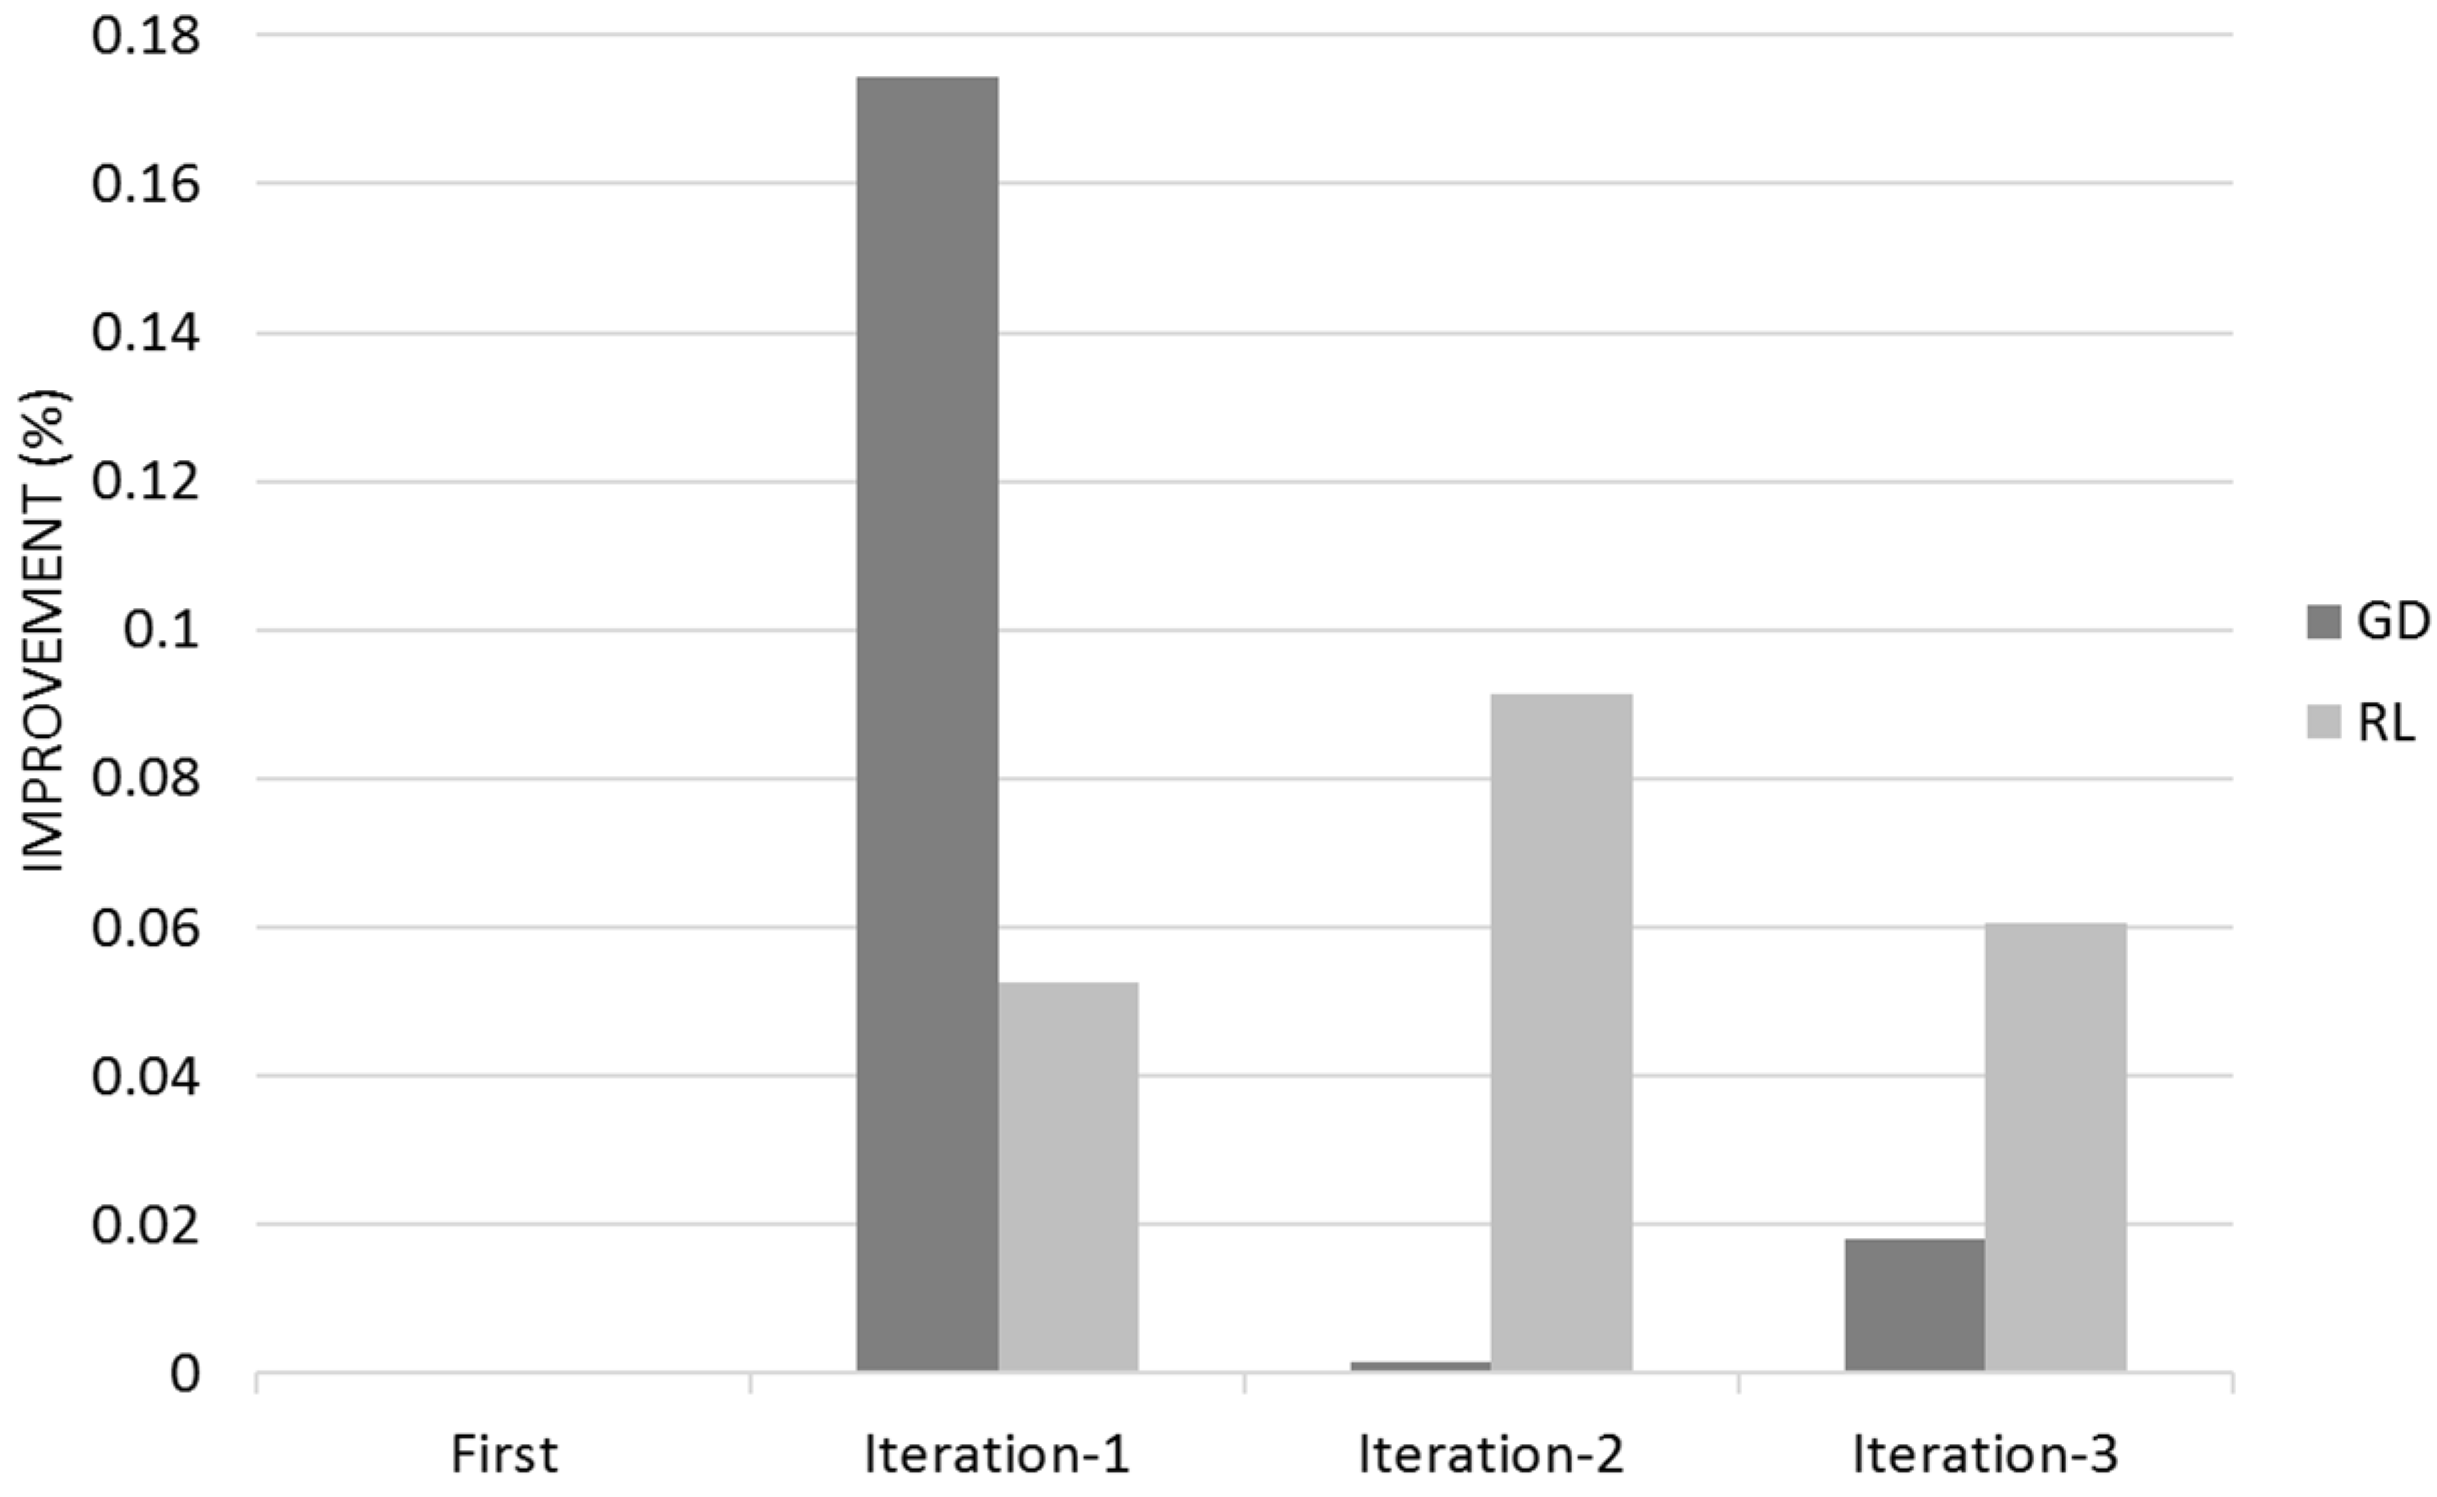
Table 2 show the Quality for the different iterations with its associated 95% Confidence Range. I represents the improvement from IRS against the Recommender System; the second I is between IRS iterations 2 and 1 and finally the third I is between IRS iterations 3 and 2.
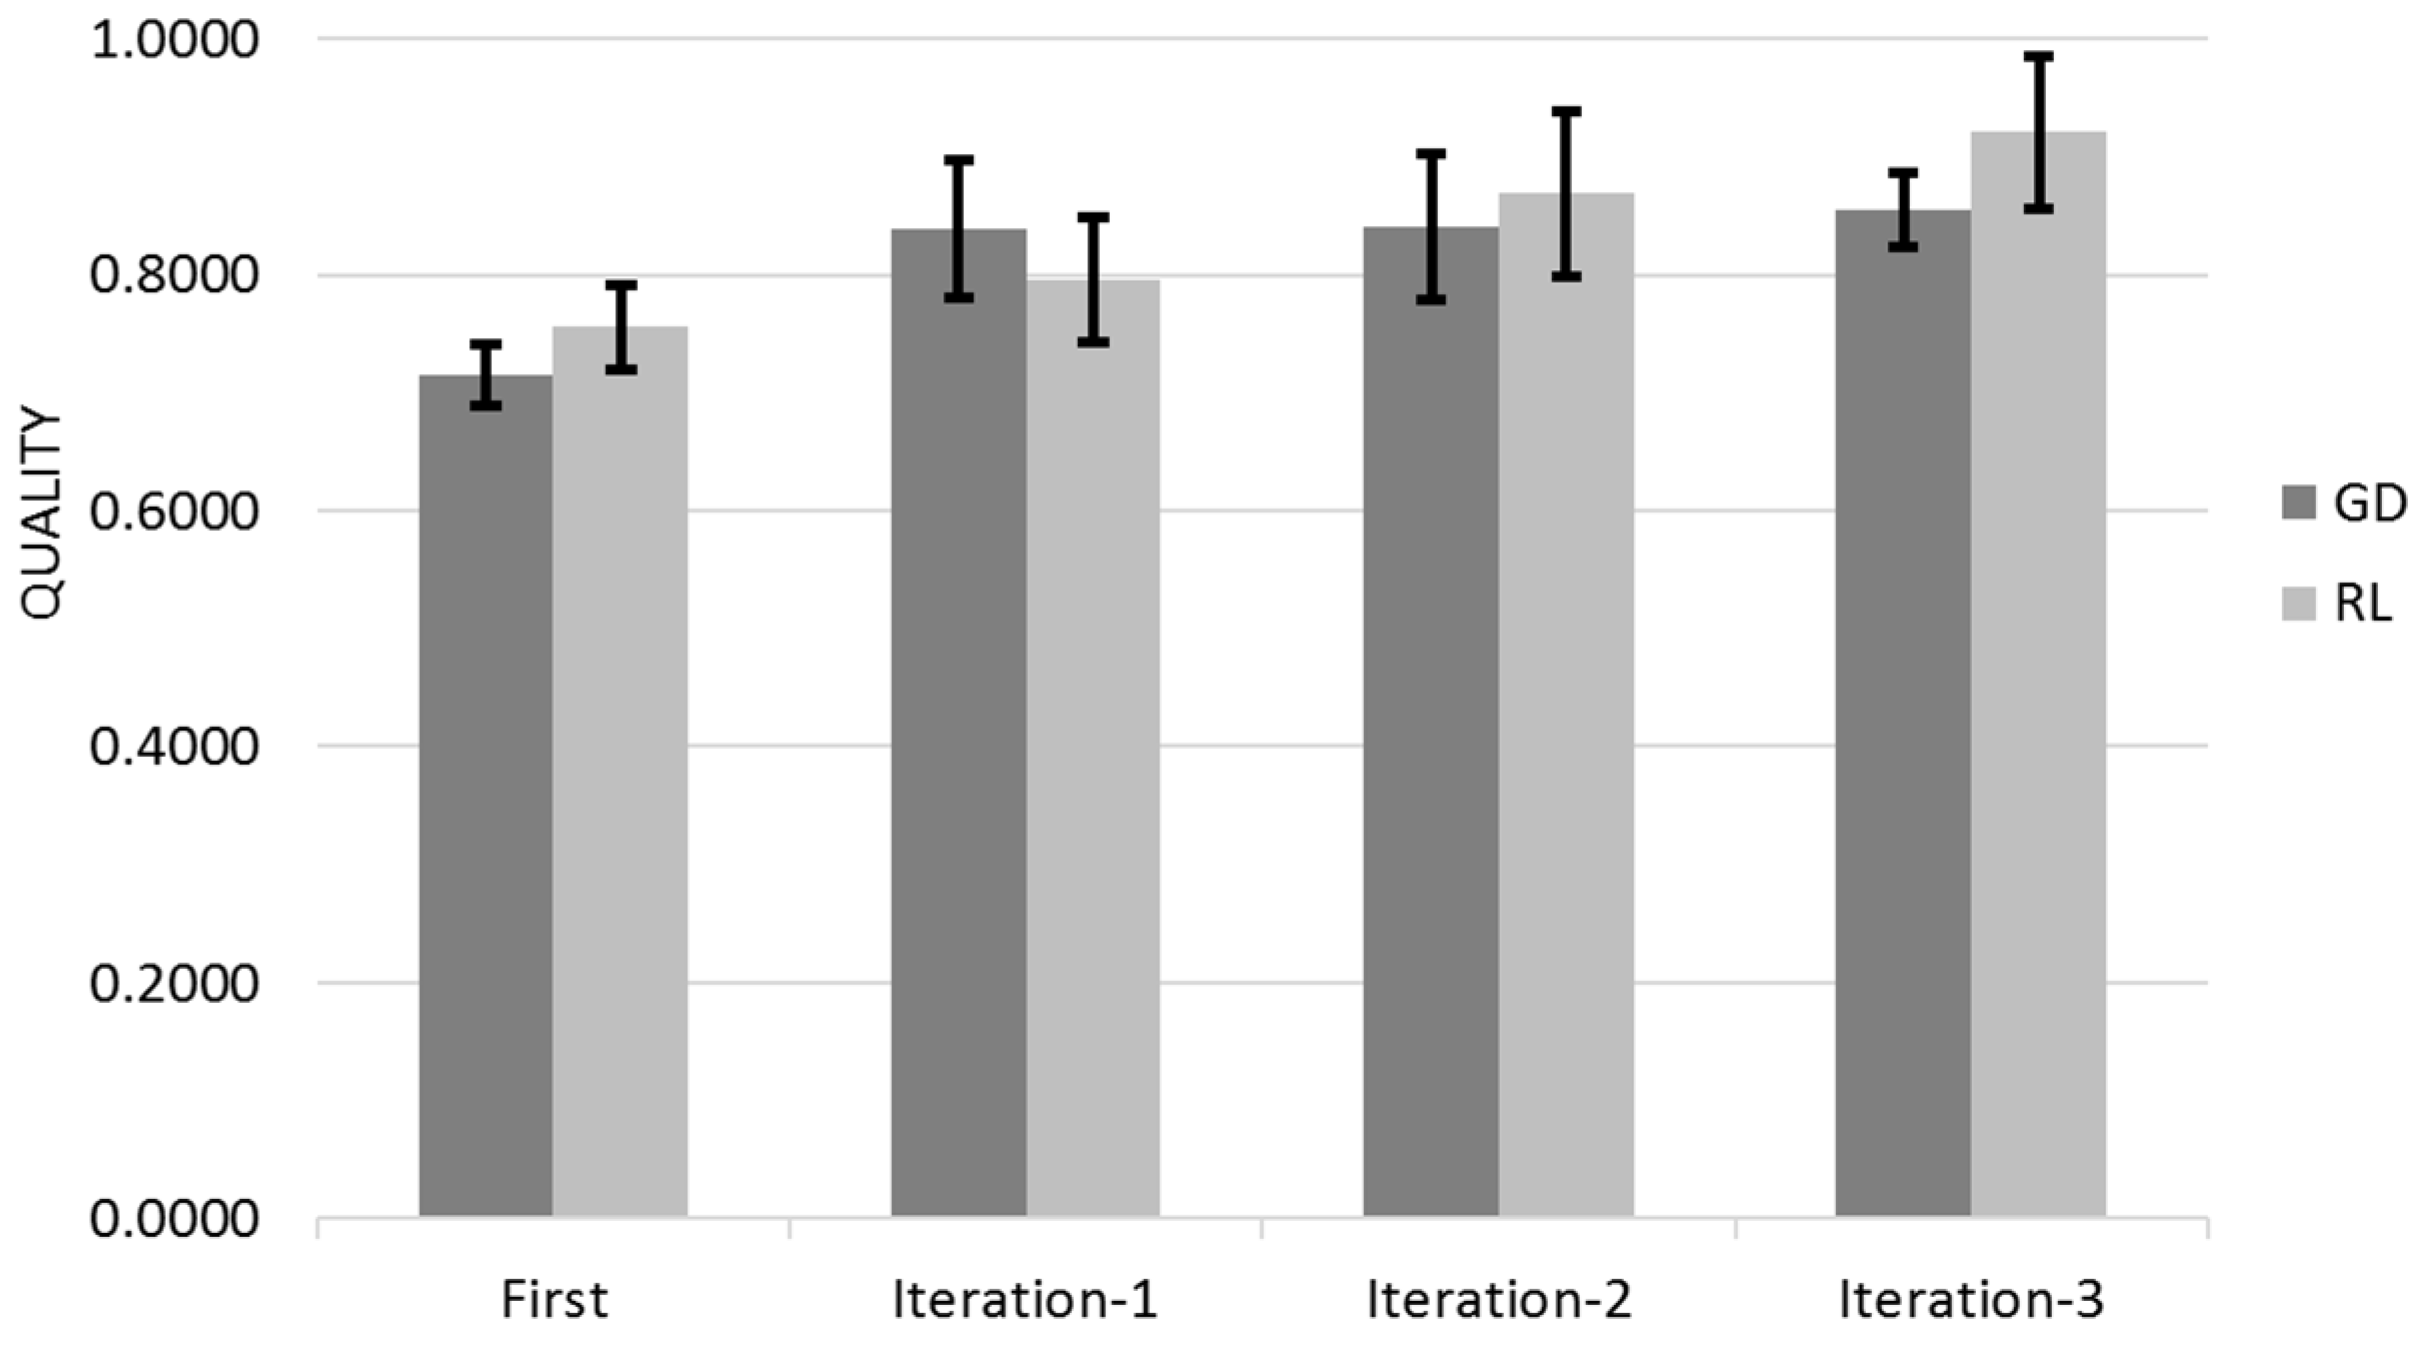
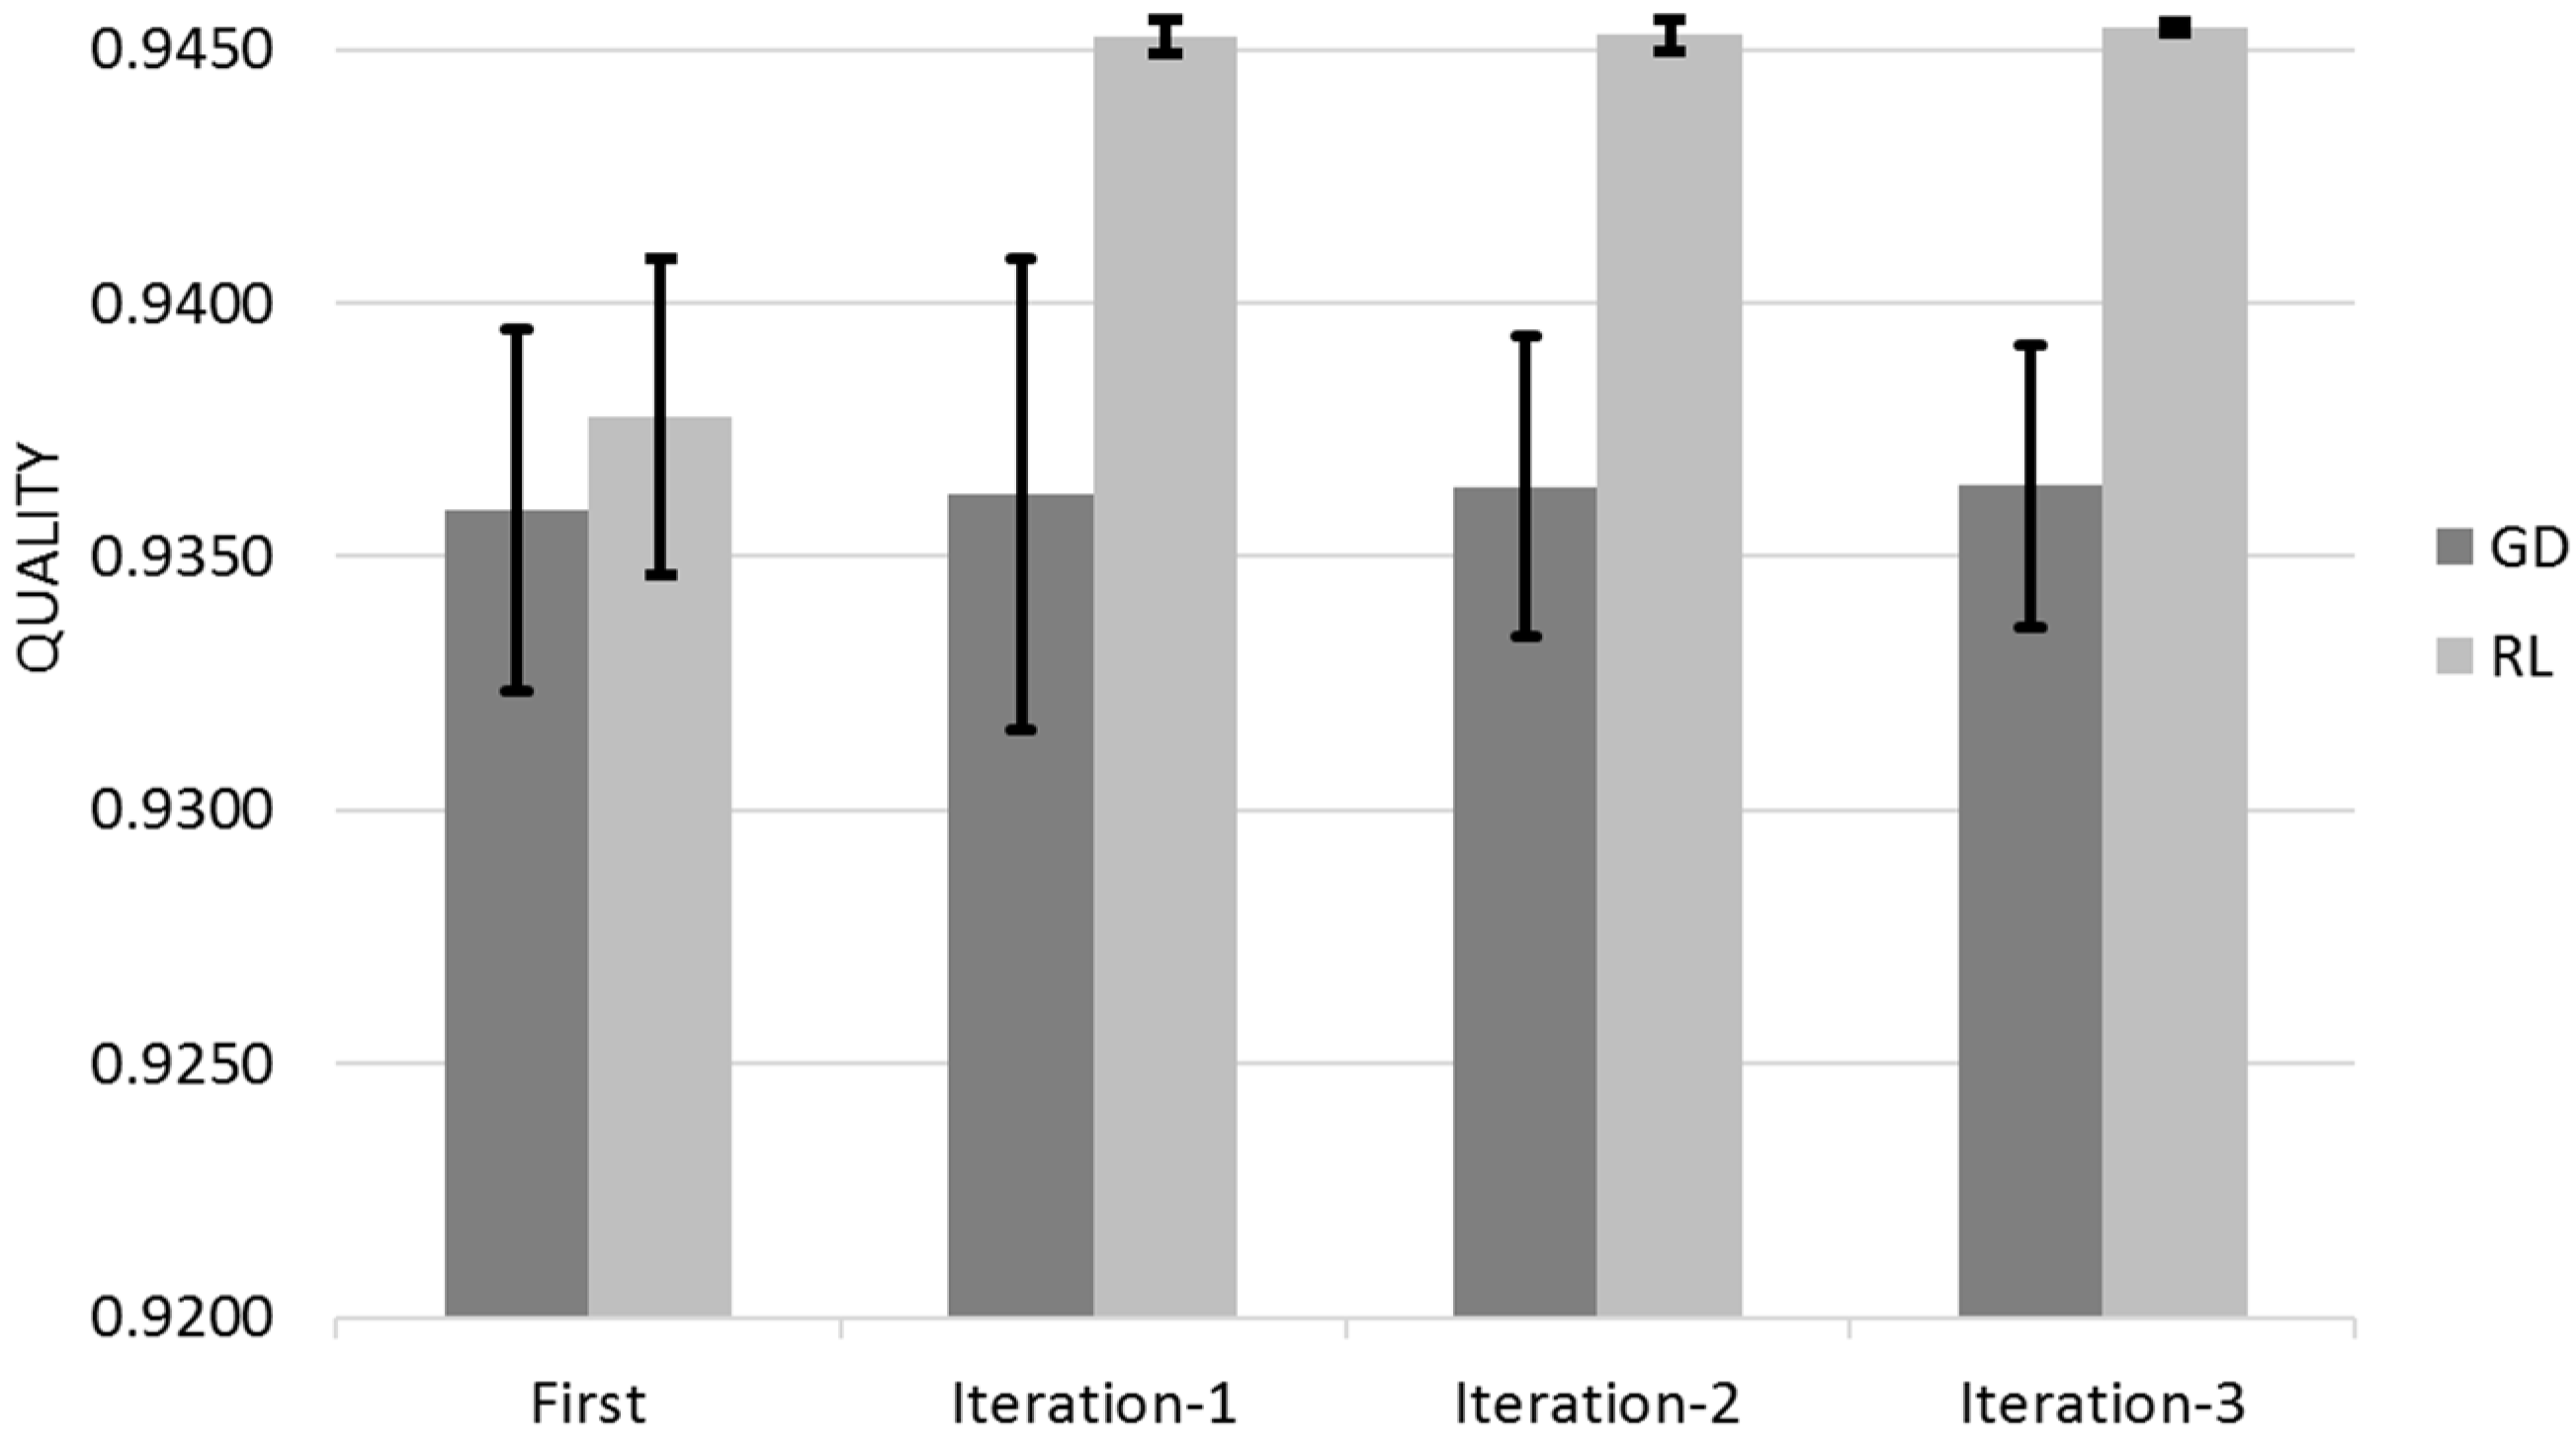
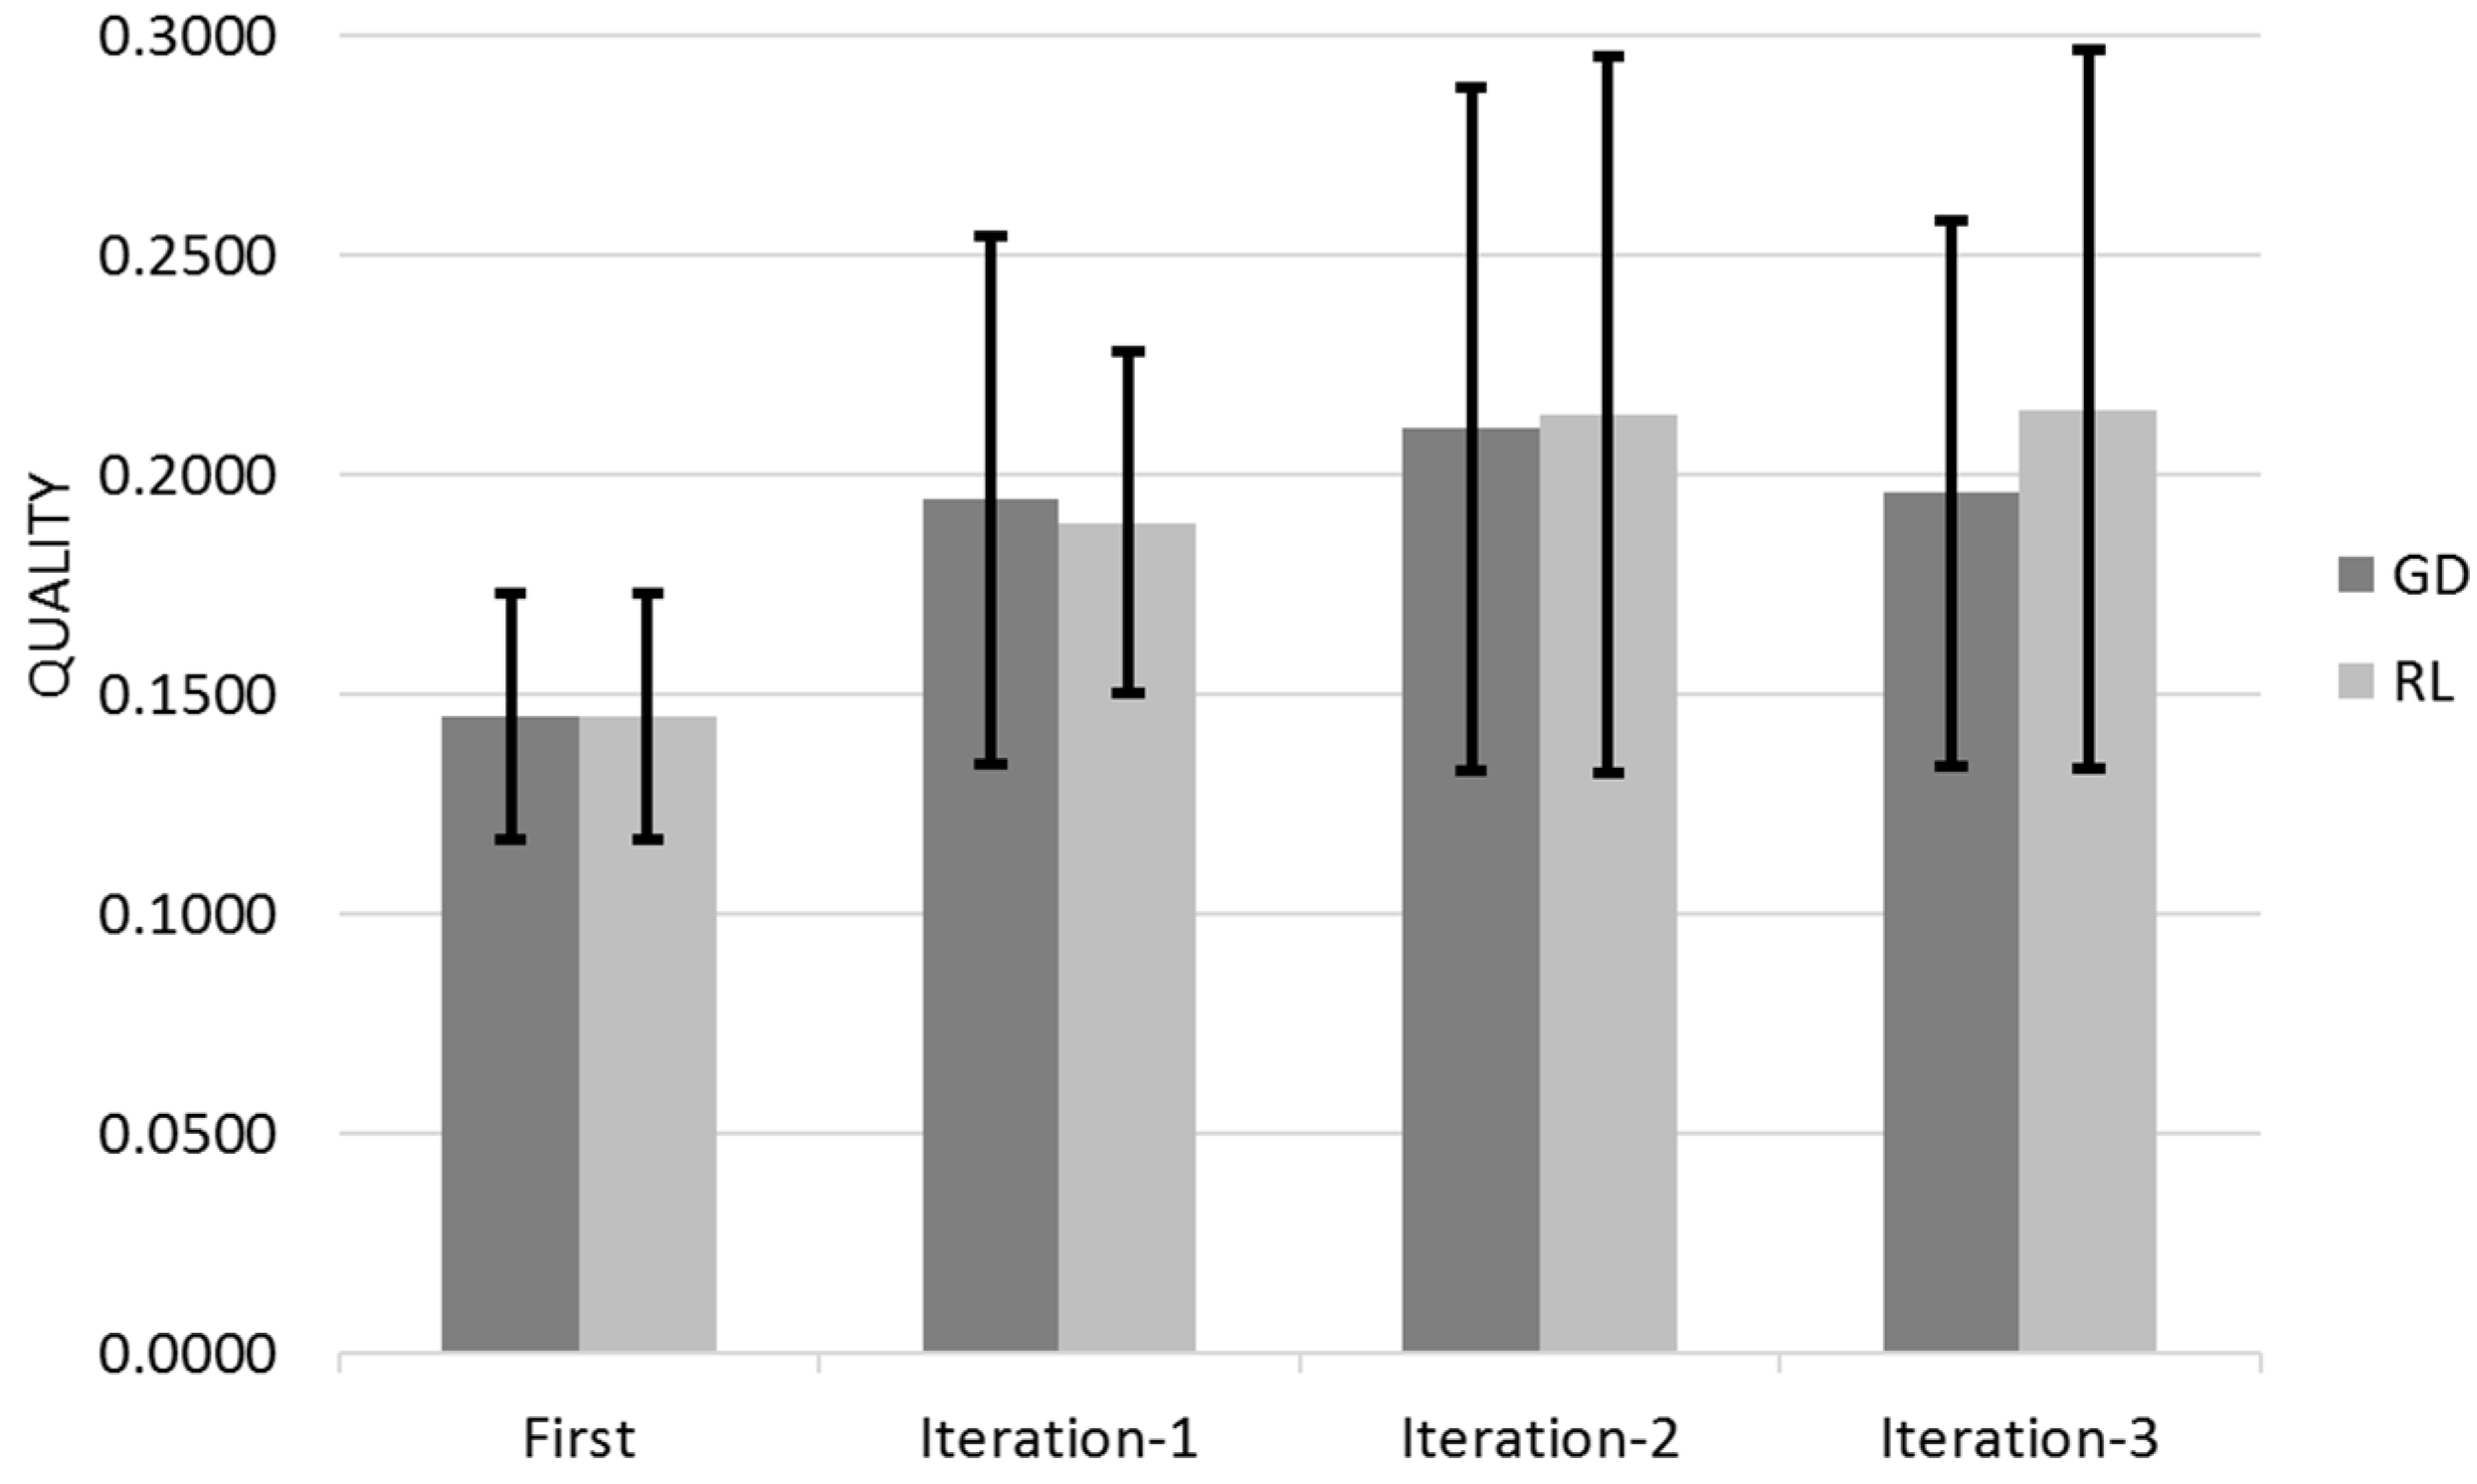
Figure 12 shows the Quality for across the three different iterations for Gradient Descent (GD) and Reinforcement Learning (RL) Algorithms with the 95% Confidence Interval that corresponds to Q ± 95%CR.
Figure 13 shows the associated improvement.
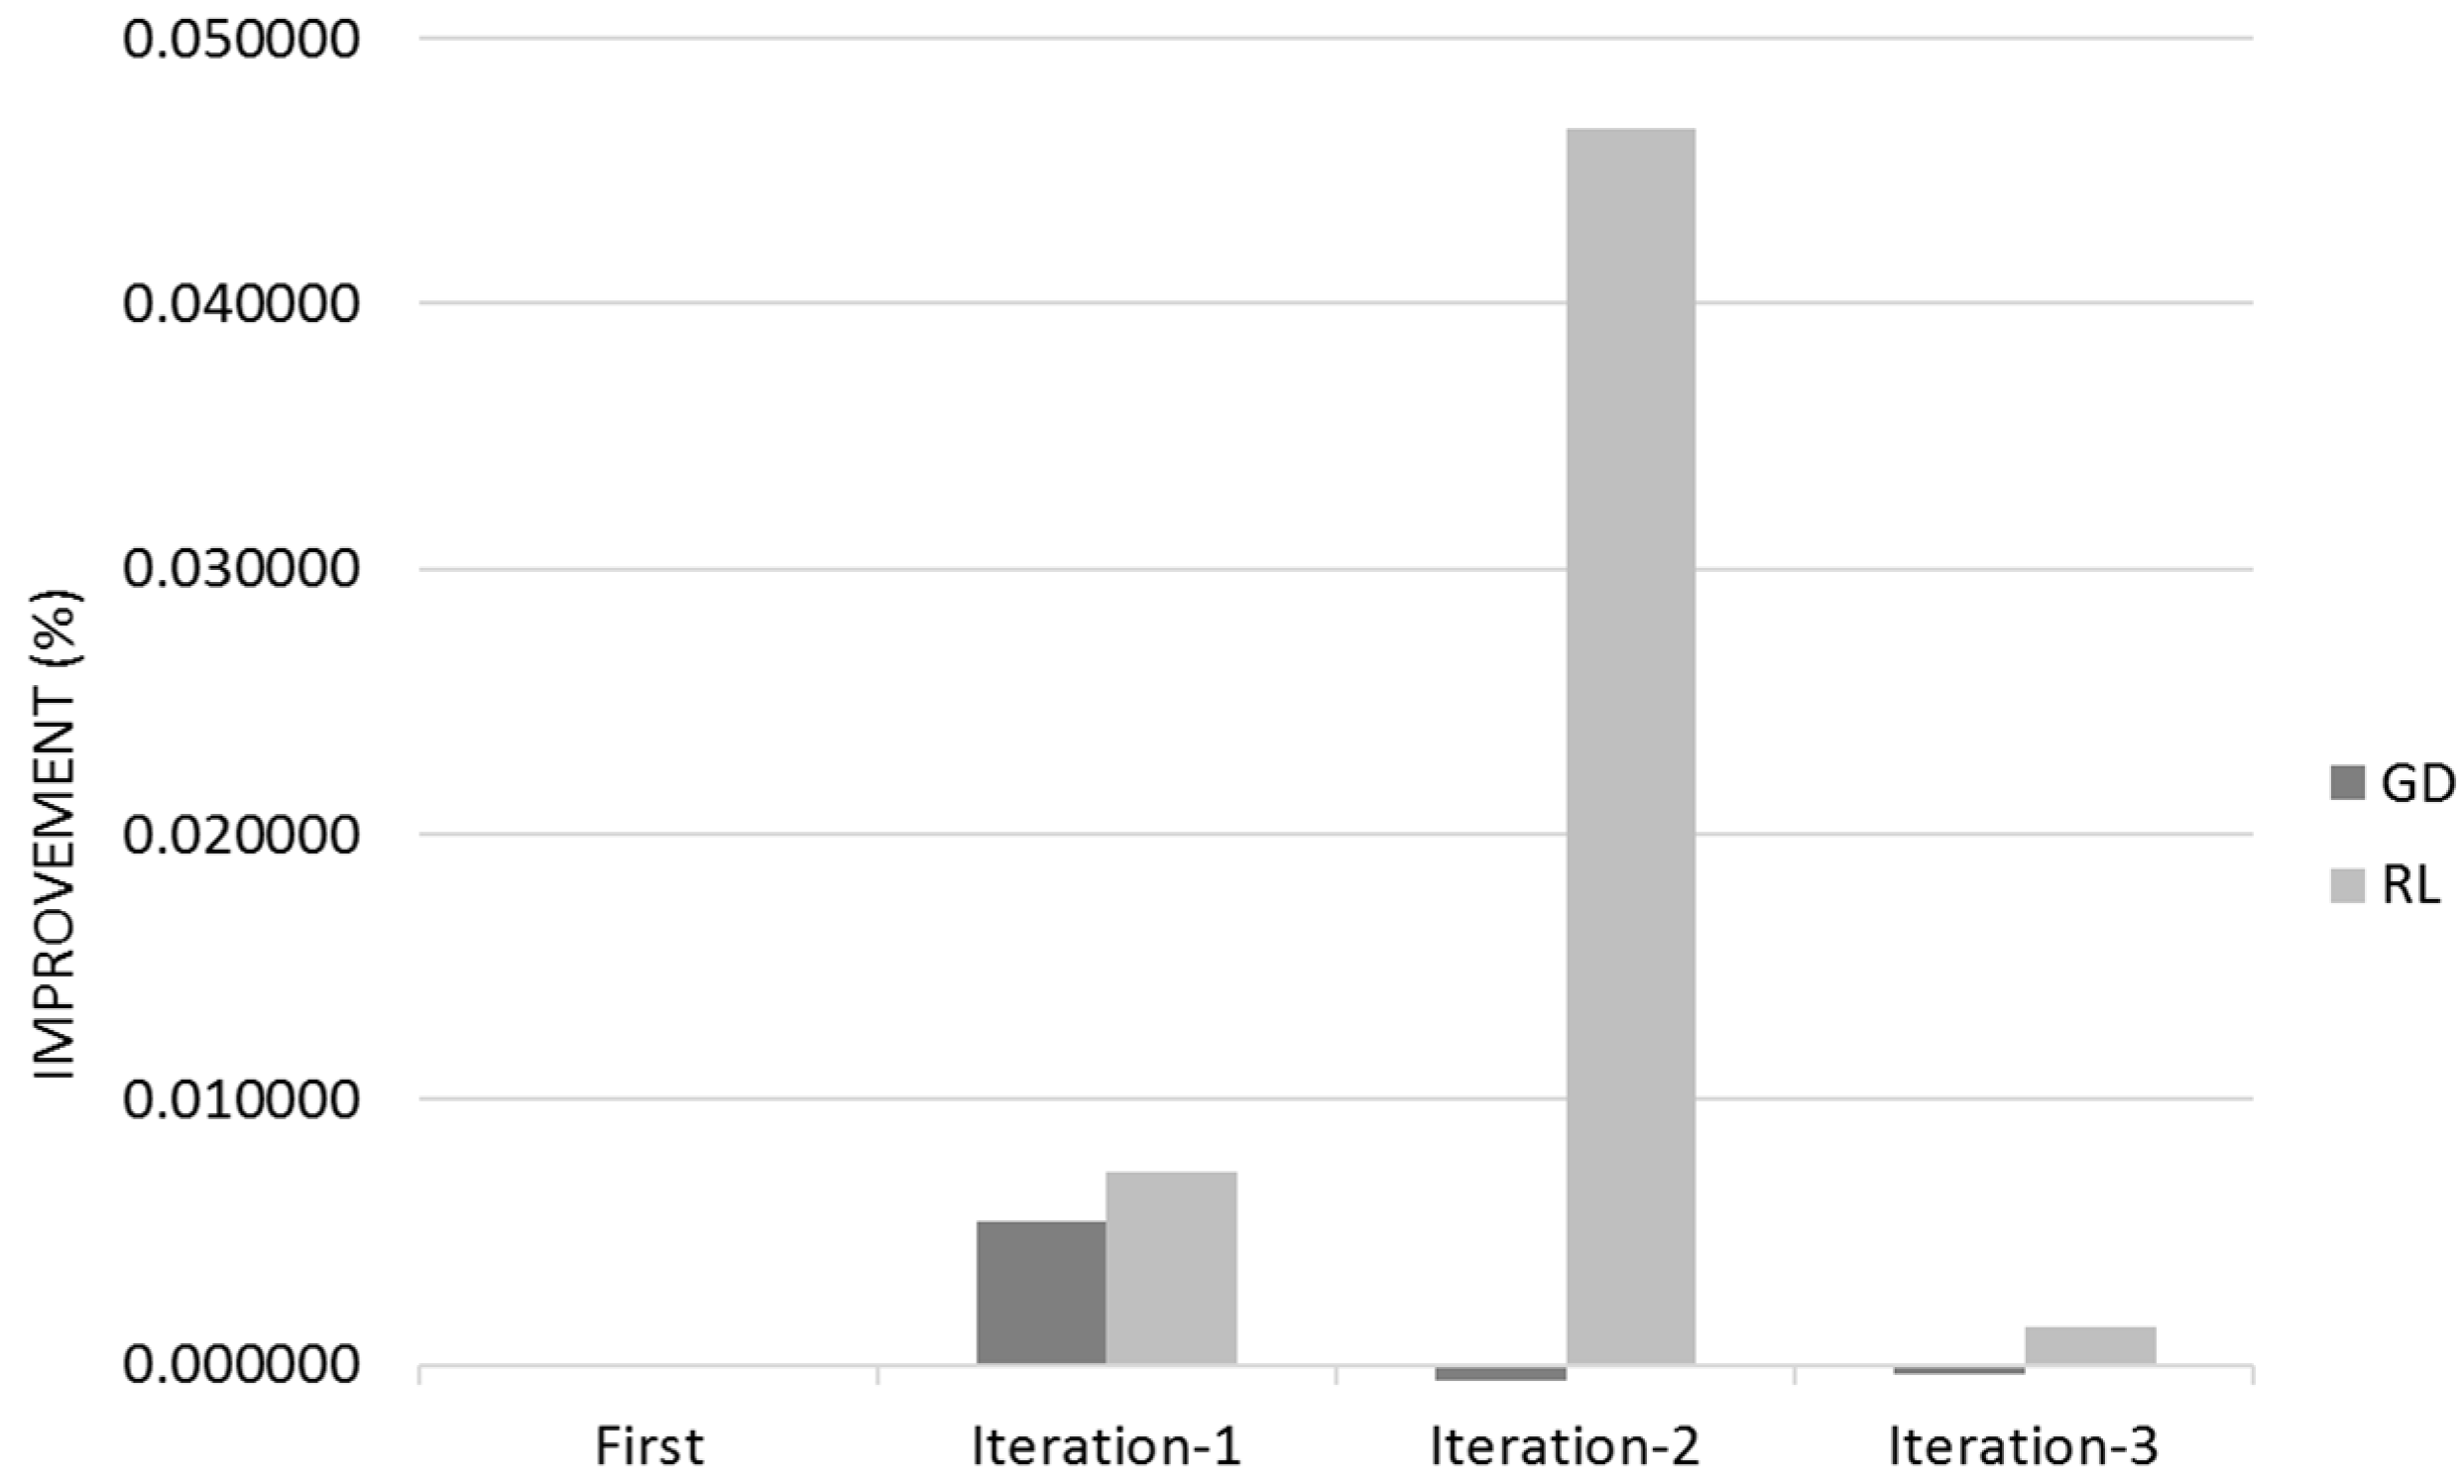
Gradient Descent learns mostly on its first customer iteration whereas Reinforcement Learning improvement is dispersed between the different user iterations (Figure 12 and Figure 13). The 95% Confidence Interval product regions overlaps. Gradient Descent outperforms Reinforcement Learning in the first iteration however Reinforcement Learning overtakes Gradient Descent due its continued learning rate.

5.2.2. Trip Advisor Data Set

Trip Advisor data set has been obtained from University of California-Irvine (UCI), Machine Learning repository, Centre for Machine Learning and Intelligent Systems. It is formed on two data sets; car and hotels reviews.
The car data set is the full review of cars for model years 2007, 2008 and 2009. There are approximately from 140 to 250 different cars for each model year. The total number of reviews is approximately 42,230, (Year 2007: 18,903 reviews, Year 2008: 15,438 reviews and Year 2009: 7947 reviews). The data set format is car model, year, number of reviews, Fuel, Interior, Exterior, Build, Performance, Comfort, Reliability, Fun and overall rating.
The Hotel data set is the full reviews of hotels in 10 different cities (Dubai, Beijing, London, New York City, New Delhi, San Francisco, Shanghai, Montreal, Las Vegas, Chicago). There are approximately from 80 to 700 hotels in each city. The total number of reviews is approximately 259,000. The data set format is hotel id, hotel name, hotel url, street, city, state, country, post code, number of reviews, Cleanliness, Room, Service, Location, Value, Comfort and overall rating.
The data set is processed by extracting its relevant information; the ratings from different years are combined into the same car type. The hotel and car data sets are joined into one where the average rating value is the final product (hotel or car) rating. Each product is a multidimensional vector consisting on the different variables the user can select; the product relevance is the product rating which it is equally divided between the different variables that is classified.
The IRS is programmed to retrieve the recommendation product (hotel or car) related attributes and the type of learning (Gradient Descent or Reinforcement Learning). The IRS then reorders the products based on their relevance which is the combined value of the user selected variables only. The IRS provides to the customer a reordered list of either hotels or cars re-ranked based on the higher values for the related attributes using the Random Neural Network; the customer then selects the most relevant products and the IRS continues the user feedback iterative process or provides the final hotel or car products.
Gradient Descent and Reinforcement Learning are evaluated independently for five different queries with ten recommendations in total for cars. Table 3 and 
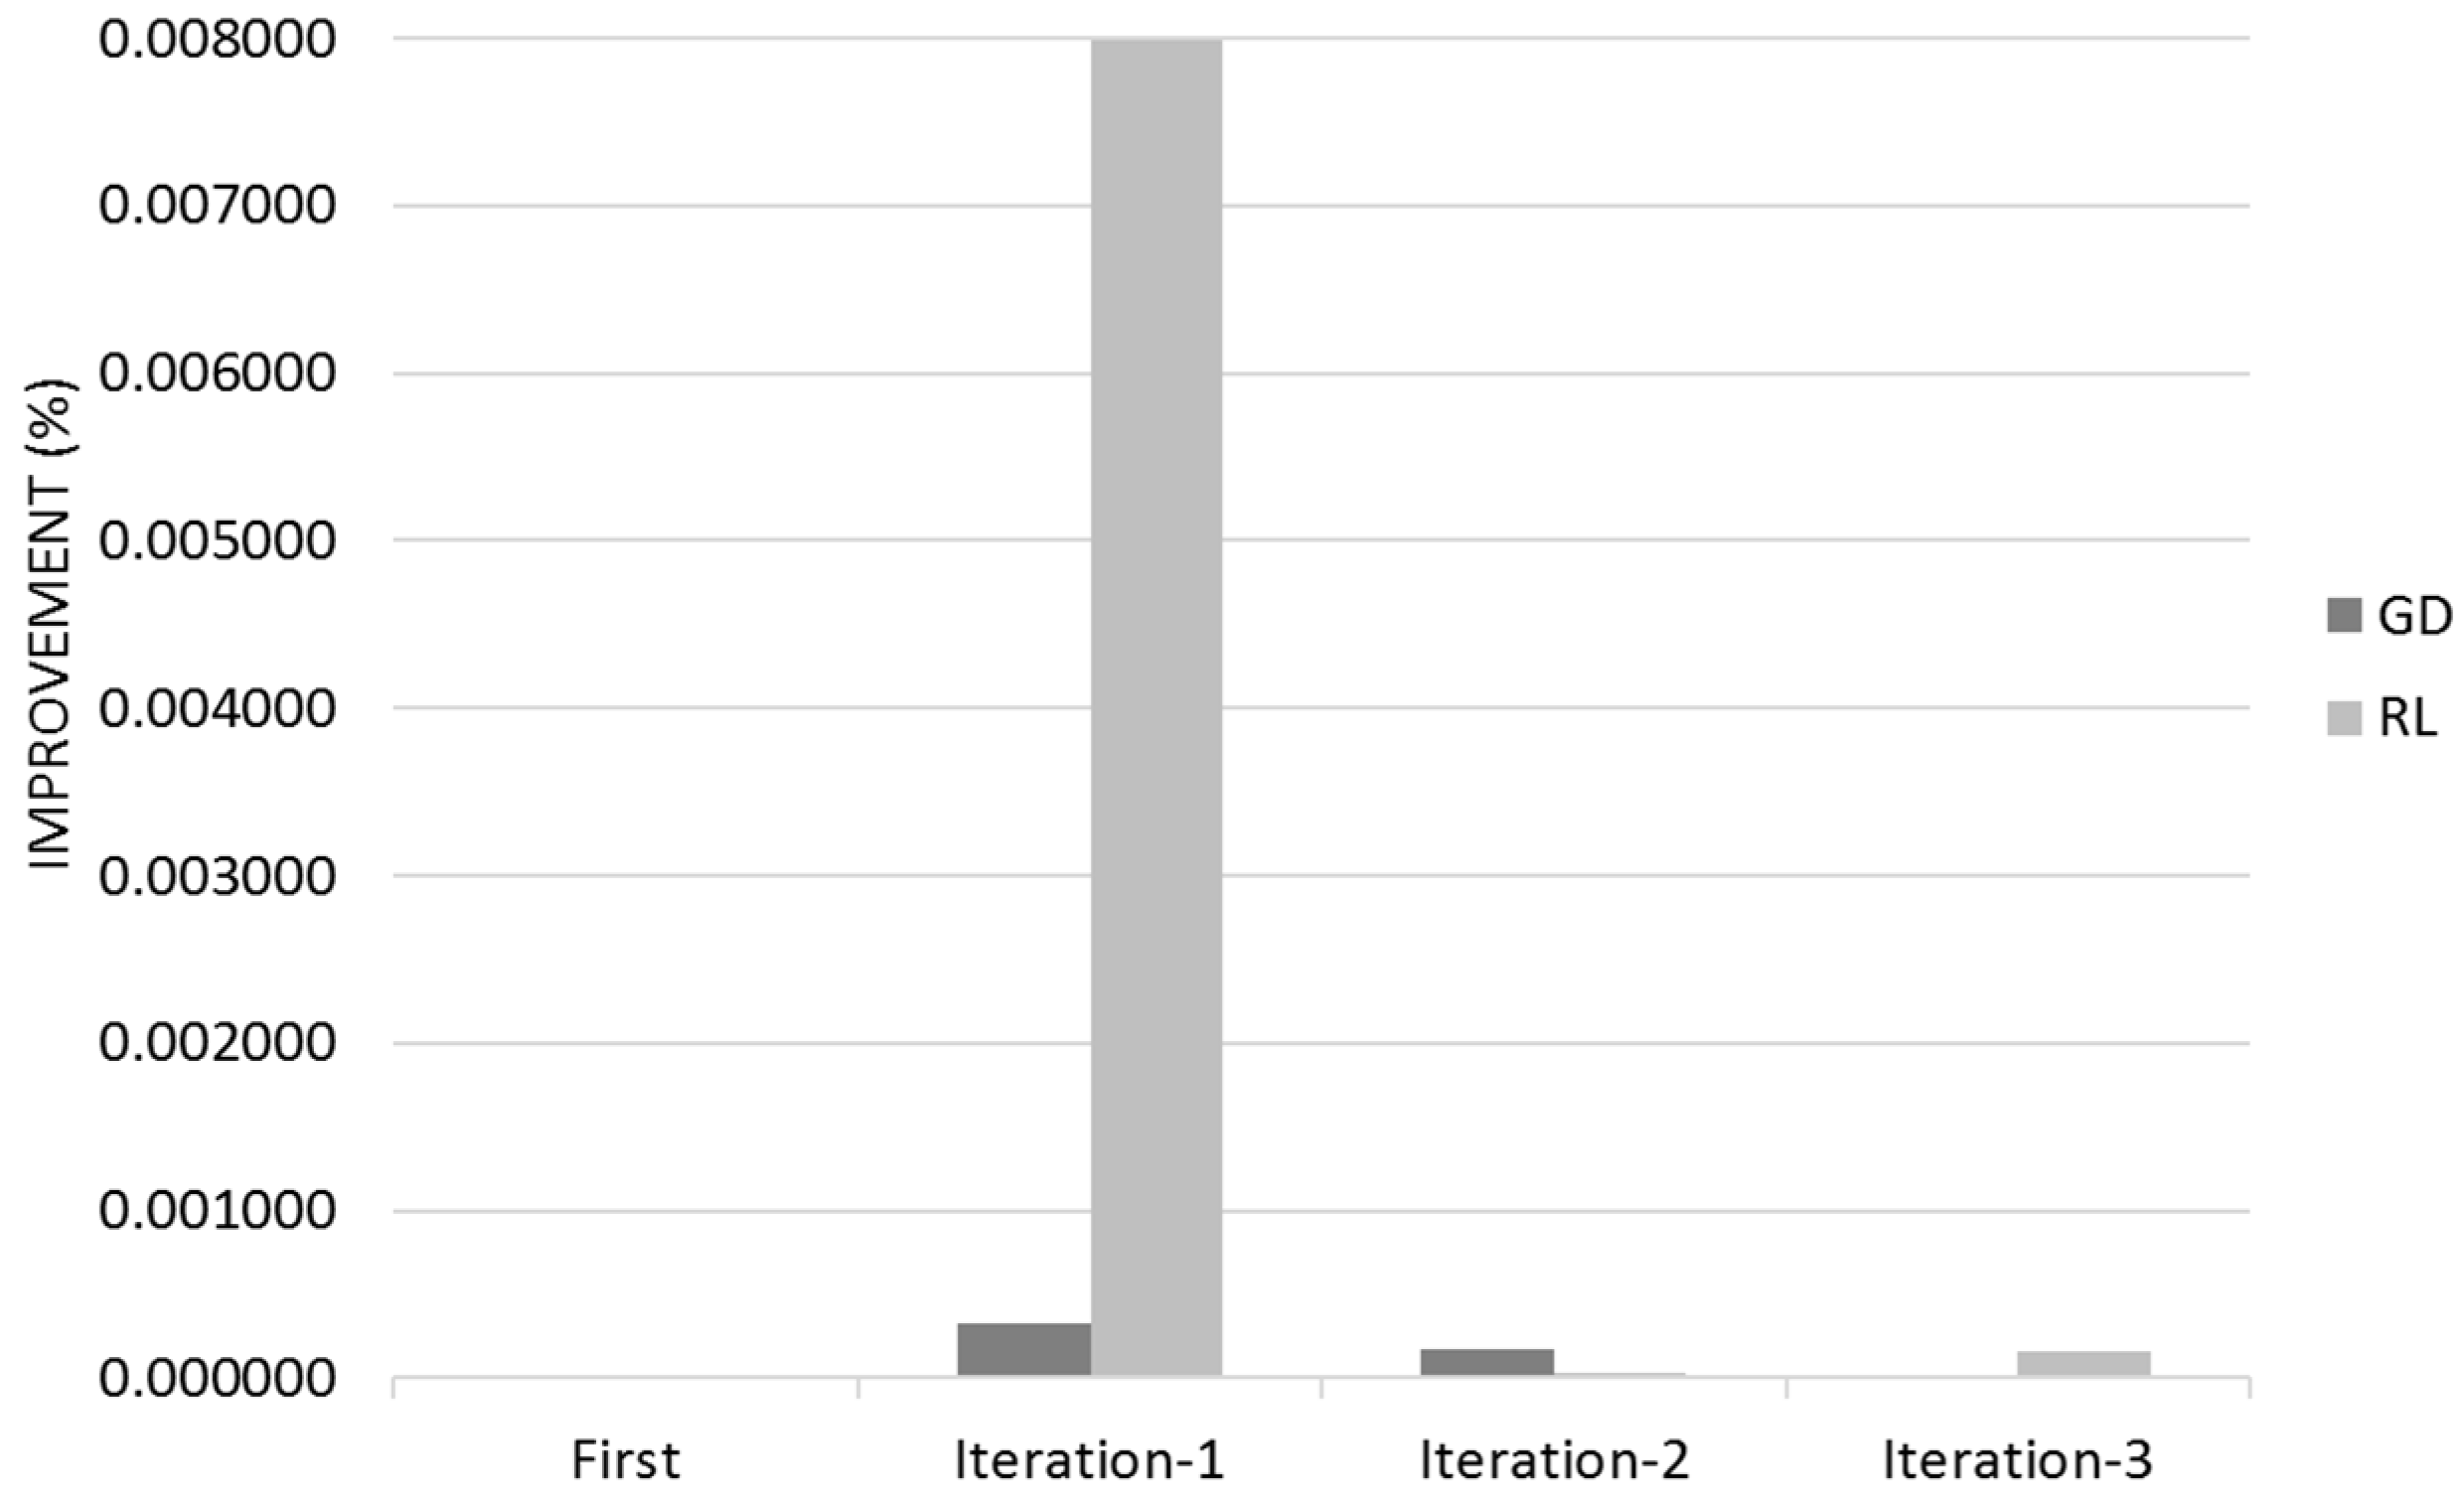
Table 4 show the Quality for different iterations with the associated 95% Confidence Range. I represents the improvement from IRS against the Recommender Systems; the second I is between IRS iterations 2 and 1 and finally the third I is between IRS iterations 3 and 2.
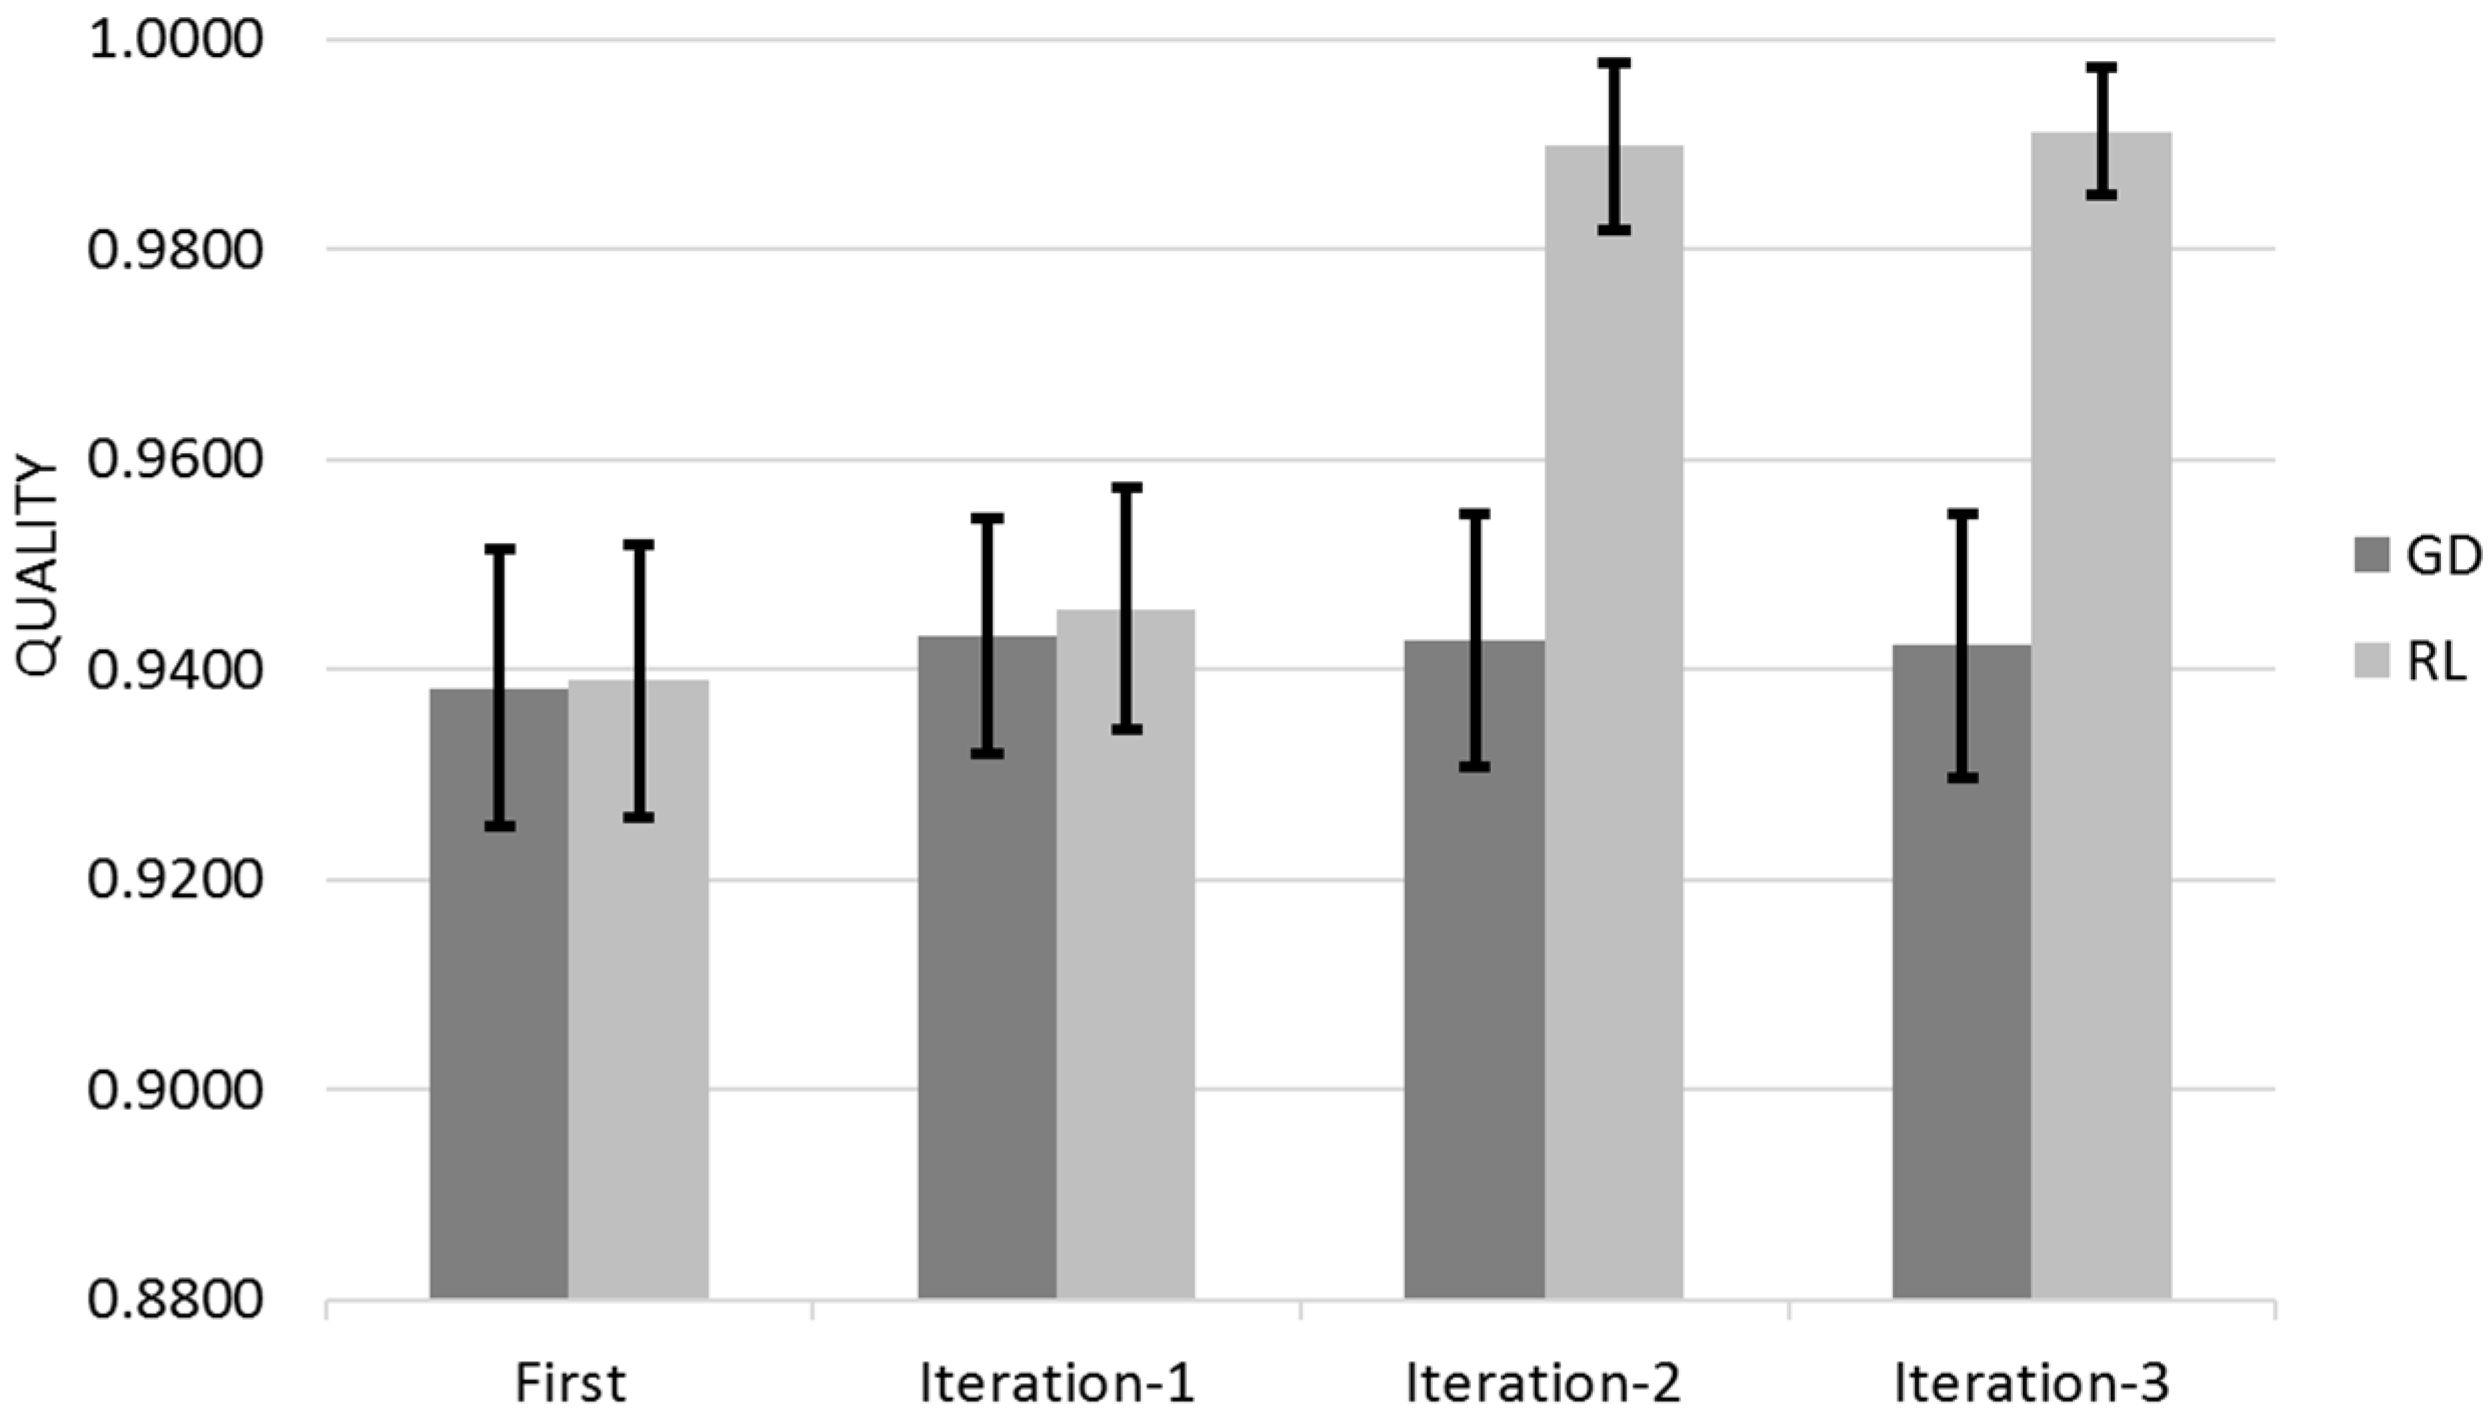
Figure 14 shows the Quality for across the three different iterations for Gradient Descent (GL) and Reinforcement Learning (RL) Algorithms with the 95% Confidence Interval that corresponds to Q ± 95%CR.
Figure 15 shows the associated improvement.
Both Gradient Descent and Reinforcement learn mostly on their customer first iteration with a residual learning on their successive iterations (Figure 14 and Figure 15). This learning rate is mostly because the initial quality was very high therefore difficult to improve. The 95% Confidence Interval is reduced and negligible when Reinforcement Learning reaches its optimum value; Reinforcement Learning manages to obtain a higher value of quality than Gradient Descent.
Gradient Descent and Reinforcement Learning are independently evaluated for five different queries with ten recommendations in total for hotels. Table 5 and Table 6 show the Quality for different iterations with the associated 95% Confidence Range. I represents the improvement from IRS against the Recommender Systems; the second I is between IRS iterations 2 and 1 and finally the third I is between IRS iterations 3 and 2.
Figure 16 shows the Quality for across the three different iterations for Gradient Descent (GL) and Reinforcement Learning (RL) Algorithms with the 95% Confidence Interval that corresponds to Q ± 95%CR.
Figure 17 shows the associated improvement.
The obtained results are consisting with the previous evaluation; Both Gradient Descent and Reinforcement algorithms learn mostly on their customer first iteration with a residual learning on their successive iterations (Figure 16 and Figure 17). Reinforcement Learning has a learning peak on its second iteration, this is because it provides the best scoring hotels in all cities whereas Gradient Descent still provides the best scoring hotels in the selected city only.

5.2.3. Amazon Data Set

The Amazon data set contains product reviews and metadata, including 143.7 million reviews spanning from May 1996 to July 2014; the review data is an 18 GByte file. The subsets are: Books; Electronics; Movies and TV; CDs and Vinyl; Clothing; Shoes and Jewellery; Home and Kitchen; Kindle Store; Sports and Outdoors; Cell Phones and Accessories; Health and Personal Care; Toys and Games; Video Games; Tools and Home; Improvement; Beauty; Apps for Android; Office Products; Pet Supplies; Automotive; Grocery and Gourmet Food; Patio, Lawn and Garden; Baby; Digital Music; Musical Instruments and Amazon Instant Video.
Due the large processing time to analyse the entire data set, only the Films & TV subset is selected. Each Amazon subclass data set is form of two different sub sets:
  • The review set contains the reviewerID, productID, reviewer name, rating of the review, review text, rating of the product, summary of the review, time of the review.
  • The metadata set contains productID, name of the product, price, url of the product image, related products (also bought, also viewed, bought together, buy after viewing), sales rank information, brand name and the list of categories the product belongs to.
The data set is processed by extracting its relevant information and combining all the ratings from individual customers to the same products; the average value is the final product rating. Each product is a multidimensional vector consisting of the different properties or dimensions defined by the customer on its request. The Intelligent Recommender System provides to the customer a reordered list of products re-ranked; the customer then selects the most relevant products and the IRS continues the customer feedback iterative process or provides the final products.
Gradient Descent and Reinforcement Learning are independently validated for five different queries with ten recommendations in total. Table 7 and Table 8 show the Quality for different iterations with its associated 95% Confidence Range. I represents the improvement from IRS against the Recommender System; the second I is between IRS iterations 2 and 1 and finally the third I is between IRS iterations 3 and 2.
Figure 18 shows the Quality for across the three different iterations for Gradient Descent (GD) and Reinforcement Learning (RL) Algorithms with the 95% Confidence Interval that corresponds to Q ± 95%CR.
Figure 19 shows the associated improvement.
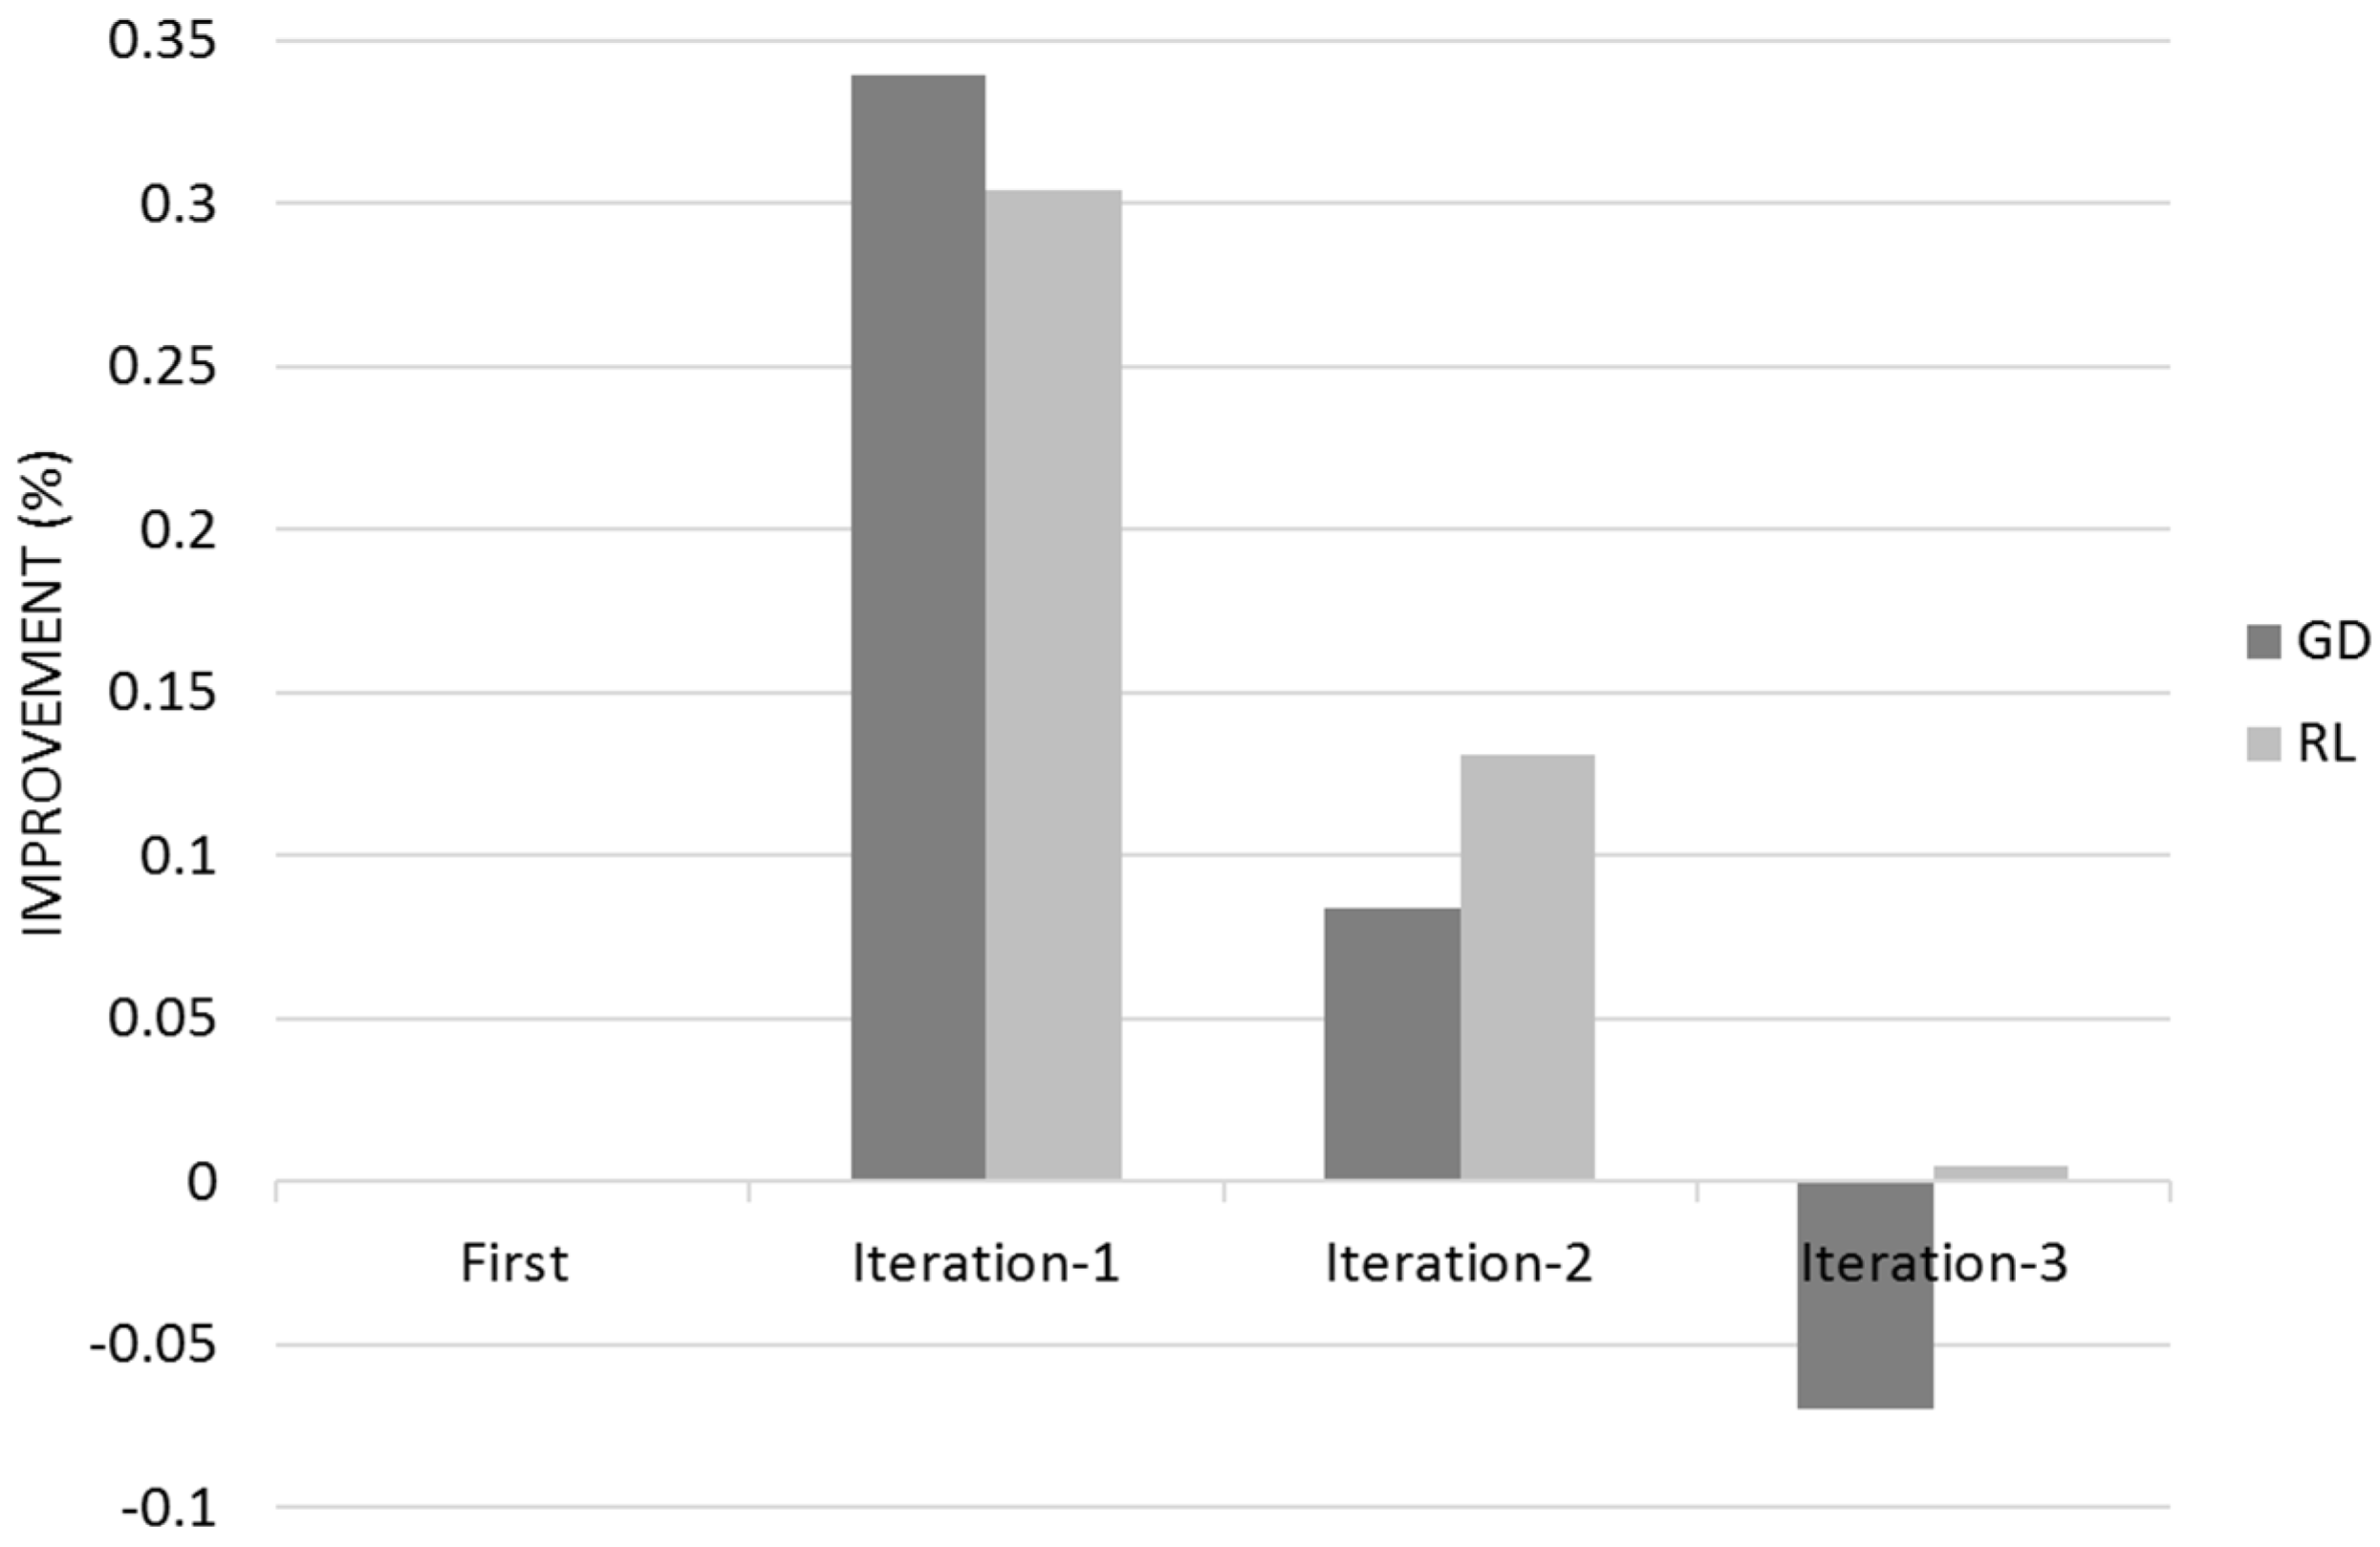
Gradient Descent learns predominantly during its first customer iteration whereas Reinforcement Learning improvement is more dispersed among the different user iterations (Figure 18 and Figure 19). The 95% Confidence Interval is greater in the amazon data set with a significant product overlap. Gradient Descent outperforms Reinforcement Learning in the first iteration however Reinforcement Learning overtakes Gradient Descent because of its continued learning speed. The Related Centre learned by Gradient Descent has defocused on its third iteration producing a decrement on Quality.
Overall, Gradient Descent predominantly acquires relevance on its first customer iteration with a decreasing learning speed in further stages. Reinforcement algorithm learns gradually with a learning speed dispersed within the customer iteration stages until it reaches its largest quality. IRS algorithm provides very high quality with the Trip Advisor data set at its first customer iteration stage therefore the learning speed decreased significantly in further iterations, however it maintained equal learning pattern: Gradient Descent learns better on its first customer iteration while Reinforcement Learning progressively maintains its learning speed.

6. Discussion

A novel approach to recommendation systems in the Big Data is proposed where the customer recursively trains the neural network while searching for relevant products. An innovative method is defined: the use of the Random Neural Network as a biological inspired algorithm to quantify customer relevance and product ranking based on a cost formula.
The Intelligent Recommender System adjusts iteratively to the customer and acquires relevance based from customer feedback improving its quality in the initial iteration. Reinforcement Learning algorithm learns more than Gradient Descent. Although Gradient Descent presents larger quality on the initial iteration; Reinforcement Learning outpaces on the next iteration due its greater learning speed where both algorithms learn negligible in their final iteration. If only one customer iteration is possible, Gradient Descent shall be chosen learning algorithm; however, if two customer interactions are enabled, Reinforcement Learning is the best choice. More than three customer iterations are not recommended due to their learning is minimal.
The main challenge presented during this research has been the retrieval of evaluation data; the difficulty to obtain numerous user recommendations and experiments (in the order of 10 s rather than 1000 s) has increased our 95% Confidence Interval with regions of overlap products. The results are shown as “proof of concept” rather than statistically significant or small confidence intervals however statistical significance to demonstrate estimation and hypothesis of the research data has been also reported within the evaluation sections.

Funding

This research received no external funding.

Acknowledgments

This research has used Groupfilms data set from the Department of Computer Science and Engineering at the University of Minnesota; Trip Advisor data set from the University of California-Irvine, Machine Learning repository, Centre for Machine Learning and Intelligent Systems and Amazon data set from Julian McAuley Computer Science Department at University of California, San Diego.

Conflicts of Interest

The author declares no conflict of interest.

References

  1. Wei-Po, L.; Chih-Hung, L.; Cheng-Che, L. Intelligent agent-based systems for personalized recommendations in Internet commerce. Expert Syst. Appl. 2002, 22, 275–284. [Google Scholar]
  2. Almazro, D.; Shahatah, G.; Albdulkarim, L.; Kherees, M.; Martinez, R.; Nzoukou, W. A Survey Paper on Recommender Systems. arXiv 2010, arXiv:1006.5278. [Google Scholar]
  3. Gediminas Adomavicius, A.T. Toward the Next Generation of Recommender Systems: A Survey of the State-of-the-Art and Possible Extensions. IEEE Trans. Knowl. Data Eng. 2005, 17, 734–749. [Google Scholar] [CrossRef]
  4. Adomavicius, G.; Manouselis, N.; Kwon, Y. Multi-Criteria Recommender Systems. In Recommender Systems Handbook; Springer: Boston, MA, USA, 2011; pp. 769–803. [Google Scholar]
  5. Cremonesi, P.; Tripodi, A.; Turrin, R. Cross-Domain Recommender Systems. In Proceedings of the International Conference on Data Mining Workshops, Mesa, AZ, USA, 14 October 2011; pp. 496–503. [Google Scholar]
  6. Schröder, G.; Thiele, M.; Lehner, W. Setting Goals and Choosing Metrics for Recommender System Evaluations. In Proceedings of the Conference on Recommender Systems, Chicago, IL, USA, 23–27 October 2011; pp. 78–85. [Google Scholar]
  7. Yang, X.; Guo, Y.; Liu, Y.; Steck, H. A survey of collaborative filtering based social recommender systems. Comput. Commun. 2014, 41, 1–10. [Google Scholar] [CrossRef]
  8. Liu, Ji.; Chen, M.Z.Q.; Chen, J.; Deng, F.; Zhang, Ha.; Zhang, Zi.; Zhou, T. Recent Advances in Personal Recommender Systems. Int. J. Inf. Syst. Sci. 2009, 5, 230–247. [Google Scholar]
  9. Cho, Y.H.; Kim, J.K.; Kim, S.H. A personalized recommender system based on web usage mining and decision tree induction. Expert Syst. Appl. 2002, 23, 329–342. [Google Scholar] [CrossRef]
  10. Liang, T.; Lai, H.; Ku, Y. Personalized Content Recommendation and User Satisfaction: Theoretical Synthesis and Empirical Findings. J. Manag. Inf. Syst. Arch. 2007, 23, 45–70. [Google Scholar] [CrossRef]
  11. Tiroshi, A.; Kuflik, T.; Kay, J.; Kummerfeld, B. Recommender Systems and the Social Web. In Proceedings of the 19th International Conference on Advances in User Modeling, Girona, Spain, 11–15 July 2011; pp. 60–70. [Google Scholar]
  12. Aroua Essayeh, M.A. A Recommendation System for Enhancing the Personalized Search Itineraries in the Public Transportation Domain. In Proceedings of the 19th International Conference on Enterprise Information Systems, Porto, Portugal, 26–29 April 2017; Volume 1, pp. 415–423. [Google Scholar]
  13. Yu, H.; Dan, Y.; Jing, L.; Mu, Z. Research on Personalized Recommender System for Tourism Information Service. Comput. Eng. Intell. Syst. 2013, 4, 32–45. [Google Scholar]
  14. Zeina Chedrawy, S.S.R.A. A Web Recommender System for Recommending, Predicting and Personalizing Music Playlists. In Proceedings of the International Conference on Web Information Systems Engineering. Web Information Systems Engineering, Poznan, Poland, 5–7 October 2009; pp. 335–342. [Google Scholar]
  15. Shini Renjith, C.A. A personalized mobile travel recommender system using hybrid algorithm. In Proceedings of the First International Conference on Computational Systems and Communications, Kerala, India, 17–18 December 2014; pp. 12–17. [Google Scholar]
  16. Patil, S.K.; Mane, Y.D.; Dabre, K.R.; Dewan, P.R.; Kalbande, D.R. An Efficient Recommender System using Collaborative Filtering Methods with K-separability Approach. Int. J. Eng. Res. Appl. 2012, 1, 30–35. [Google Scholar]
  17. Chang, C.; Chen, P.; Chiu, F.; Chen, Y. Application of neural networks and Kano’s method to content recommendation in web personalization. Expert Syst. Appl. 2009, 36, 5310–5316. [Google Scholar] [CrossRef]
  18. Lee, M.; Choi, P.; Woo, Y. A Hybrid Recommender System Combining Collaborative Filtering with Neural Network. Adapt. Hypermed. Adapt. Web-Based Syst. 2002, 2347, 531–534. [Google Scholar]
  19. Devi, M.K.K.; Samy, R.T.; Kumar, S.V.; Venkatesh, P. Probabilistic neural network approach to alleviate sparsity and cold start problems in collaborative recommender systems. In Proceedings of the International Conference on Computational Intelligence and Computing Research, Coimbatore, India, 28–29 December 2010; pp. 1–4. [Google Scholar]
  20. Vassiliou, C.; Stamoulis, D.; Martakos, D.; Athanassopoulos, S. A recommender system framework combining neural networks & collaborative filtering. In Proceedings of the International Conference on Instrumentation, Measurement, Circuits and Systems, Hangzhou, China, 16–18 April 2006; pp. 285–290. [Google Scholar]
  21. Kanokwan Kongsakun, C.C.F. Neural Network Modeling for an Intelligent Recommendation System Supporting SRM for Universities in Thailand. World Sci. Eng. Acad. Soc. Trans. Comput. 2012, 2, 34–44. [Google Scholar]
  22. Daniel Billsus, M.J.P. Learning Collaborative Information Filters. In Proceedings of the International Conference on Machine Learning, Madison, WI, USA, 24–27 July 1998; pp. 46–54. [Google Scholar]
  23. Marko Krstic, M.B. Context-aware personalized program guide based on neural network. IEEE Trans. Consum. Electron. 2012, 58, 1301–1306. [Google Scholar] [CrossRef]
  24. Biancalana, C.; Gasparetti, F.; Micarelli, A.; Miola, A.; Sansonetti, G. Context-aware movie recommendation based on signal processing and machine learning. In Challenge on Context-Aware Movie Recommendation; ACM: New York, NY, USA, 2011; pp. 5–10. [Google Scholar]
  25. Chou, P.; Li, P.; Chen, K.; Wu, M. Integrating web mining and neural network for personalized e-commerce automatic service. Expert Syst. Appl. 2010, 37, 2898–2910. [Google Scholar] [CrossRef]
  26. Wang, H.; Wang, N.; Yeung, D. Collaborative Deep Learning for Recommender Systems. In Special Interest Group on Knowledge Discovery and Data Mining; ACM: New York, NY, USA, 2015; pp. 1235–1244. [Google Scholar]
  27. Elkahky, A.M.; Song, Y.; He, X. A Multi-View Deep Learning Approach for Cross Domain User Modeling in Recommendation Systems. In Proceedings of the International World Wide Web Conferences Steering Committee, Florence, Italy, 18–22 May 2015; pp. 278–288. [Google Scholar]
  28. Cheng, He.; Koc, L.; Harmsen, J.; Shaked, T.; Chandra, T.; Aradhye, H.; Anderson, G.; Corrado, G.; Chai, W.; Ispir, M.; et al. Wide & Deep Learning for Recommender Systems. In Proceedings of the 1st Workshop on Deep Learning for Recommender Systems, Boston, MA, USA, 15 September 2016; pp. 7–10. [Google Scholar]
  29. Zhang, L.; Luo, T.; Zhang, F.; Wu, Y. A Recommendation Model Based on Deep Neural Network. IEEE Access. 2018, 6, 9454–9463. [Google Scholar] [CrossRef]
  30. Van den Oord, A.; Dieleman, S.; Schrauwen, B. Deep content-based music recommendation. In Proceedings of the 26th International Conference on Neural Information Processing Systems, Lake Tahoe, Nevada, 5–10 December 2013; Volume 2, pp. 2643–2651. [Google Scholar]
  31. Xinxi Wang, Y.W. Improving Content-based and Hybrid Music Recommendation using Deep Learning. In Proceedings of the 22nd ACM International Conference on Multimedia, Orlando, FL, USA, 3–7 November 2014; pp. 627–636. [Google Scholar]
  32. Verma, J.P.; Patel, B.; Patel, A. Big Data Analysis: Recommendation System with Hadoop Framework. In Proceedings of the IEEE International Conference on Computational Intelligence & Communication Technology, Ghaziabad, India, 13–14 February 2015; pp. 92–97. [Google Scholar]
  33. Gandhi, S.; Gandhi, M. Hybrid Recommendation System with Collaborative Filtering and Association Rule Mining Using Big Data. In Proceedings of the International Conference for Convergence in Technology, Pune, India, 15 December 2018; pp. 1–5. [Google Scholar]
  34. Nundlall, C.; Sohun, G.; Nagowah, S.D. A Hybrid Recommendation Technique for Big Data Systems. In Proceedings of the International Conference on Intelligent and Innovative Computing Applications, Mauritius, Mon Tresor, Plaine Magnien, Mauritius, 6–7 December 2018; pp. 1–7. [Google Scholar]
  35. Lu, Q.; Guo, F. Personalized Information Recommendation Model based on Context Contribution and Item Correlation. Measurement 2018, 1–23. [Google Scholar] [CrossRef]
  36. Han, X.; Tian, L.; Yoon, M.; Lee, M. A Big Data Model Supporting Information Recommendation in Social Networks. In Proceedings of the International Conference on Cloud and Green Computing, Xiangtan, China, 1–3 November 2012; pp. 810–813. [Google Scholar]
  37. Zihayatat, M.; Ayansob, A.; Zhaoc, X.; Davoudic, H.; An, A. A utility based news recommendation system. Decis. Support Syst. 2019, 117, 14–27. [Google Scholar] [CrossRef]
  38. Amato, F.; Moscato, V.; Picariello, A.; Sperl, G.Í. KIRA: A System for Knowledge-Based Access to Multimedia Art Collections. In Proceedings of the IEEE 11th International Conference on Semantic Computing, San Diego, CA, USA, 30 January 2016–1 February 2017; pp. 338–343. [Google Scholar]
  39. Chou, S.; Jang, J.R.; Yang, Y. Fast Tensor Factorization for Large-scale Context-aware Recommendation from Implicit Feedback. IEEE Trans. Big Data 2015, 1–8. [Google Scholar] [CrossRef]
  40. Aboagye, E.O.; Gao, J. Computational Intelligence Strategies for Effective Collaborative Decisions. In Proceedings of the IEEE 9th Annual Information Technology, Electronics and Mobile Communication Conference, Vancouver, BC, USA, 1–3 November 2018; pp. 776–782. [Google Scholar]
  41. Yang, W.; Fan, S.; Wang, H. An item-diversity-based collaborative filtering algorithm to improve the accuracy of recommender system. In Proceedings of the IEEE SmartWorld, Ubiquitous Intelligence & Computing, Advanced & Trusted Computing, Scalable Computing & Communications, Cloud & Big Data Computing, Internet of People and Smart City Innovations, Guangzhou, China, 8–12 October 2018; pp. 106–110. [Google Scholar]
  42. Yi, B.; Shen, X.; Liu, H.; Zhang, Z.; Zhang, W.; Liu, S.; Xiong, N. Deep Matrix Factorization with Implicit Feedback Embedding for Recommendation System. IEEE Trans. Ind. Inform. 2019, 1–11. [Google Scholar] [CrossRef]
  43. Zhang, Y. GroRec: A Group-Centric Intelligent Recommender System Integrating Social, Mobile and Big Data Technologies. IEEE Trans. Serv. Comput. 2016, 9, 786–795. [Google Scholar] [CrossRef]
  44. Gelenbe, E. Random Neural Networks with Negative and Positive Signals and Product Form Solution. Neural Comput. 1989, 1, 502–510. [Google Scholar] [CrossRef]
  45. Gelenbe, E. Stability of the Random Neural Network Model. Neural Comput. 1990, 2, 239–247. [Google Scholar] [CrossRef]
  46. Gelenbe, E. Learning with the Recurrent Random Neural Network. IFIP Congr. 1992, 1, 343–349. [Google Scholar]
  47. Gelenbe, E. Cognitive Packet Network. U.S. Patent 6804201 B1, 12 October 2004. [Google Scholar]
  48. Gelenbe, E.; Xu, Z.; Seref, E. Cognitive Packet Networks. In Proceedings of the International Conference on Tools with Artificial Intelligence, Chicago, IL, USA, 8–10 November 1999; pp. 47–54. [Google Scholar]
  49. Gelenbe, E.; Lent, R.; Xu, Z. Networks with Cognitive Packets. In Proceedings of the Modeling, Analysis, and Simulation on Computer and Telecommunication Systems, San Francisco, CA, USA, 29 August–1 September 2000; pp. 3–10. [Google Scholar]
  50. Gelenbe, E.; Lent, R.; Xu, Z. Measurement and performance of a cognitive packet network. Comput. Netw. 2001, 37, 691–701. [Google Scholar] [CrossRef]
  51. Gelenbe, E.; Lent, R.; Montuori, A.; Xu, Z. Cognitive Packet Networks: QoS and Performance. Modeling, Analysis, and Simulation on Computer and Telecommunication Systems. In Proceedings of the 10th IEEE International Symposium on Modeling, Analysis and Simulation of Computer and Telecommunications Systems, Fort Worth, TX, USA, 16 October 2002; pp. 3–9. [Google Scholar]
  52. Gelenbe, E.; Schmajuk, N.; Staddon, J.; Reif, J. Autonomous search by robots and animals: A survey. Robot. Auton. Syst. 1997, 22, 23–34. [Google Scholar] [CrossRef]
  53. Gelenbe, E. Search in unknown random environments. Phys. Rev. E 2010, 82, 1–8. [Google Scholar] [CrossRef] [PubMed]
  54. Abdelrahman, O.H.; Gelenbe, E. Time and energy in team-based search. Phys. Rev. E 2013, 87, 1–6. [Google Scholar] [CrossRef]
  55. Gelenbe, E.; Abdelrahman, O.H. Search in the universe of big networks and data. IEEE Netw. 2014, 28, 20–25. [Google Scholar] [CrossRef]
Figure 1. Recommender System Architecture.
Bdcc 03 00015 g001
Figure 2. Recommender System Model.
Bdcc 03 00015 g002
Figure 3. The Random Neural Network.
Bdcc 03 00015 g003
Figure 4. Intelligent Recommender System Model.
Bdcc 03 00015 g004
Figure 5. Intelligent Recommender System Customer Iteration.
Bdcc 03 00015 g005
Figure 6. Intelligent Recommender System Attribute Learning.
Bdcc 03 00015 g006
Figure 7. Intelligent Recommender System Model—Gradient Descent Learning.
Bdcc 03 00015 g007
Figure 8. Intelligent Recommender System Model—Reinforcement Learning.
Bdcc 03 00015 g008
Figure 9. Intelligent Recommender System—Server Side Implementation.
Bdcc 03 00015 g009
Figure 10. Intelligent Recommender System—Customer Interface.
Bdcc 03 00015 g010
Figure 11. ISA Validation.
Bdcc 03 00015 g011
Figure 12. Recommender Evaluation—Film Database.
Bdcc 03 00015 g012
Figure 13. Recommender Evaluation—Improvement—Film Database.
Bdcc 03 00015 g013
Figure 14. Recommender Evaluation—Trip Advisor Car Database
Bdcc 03 00015 g014
Figure 15. Recommender Evaluation—Improvement—Trip Advisor Car Database.
Bdcc 03 00015 g015
Figure 16. Recommender Evaluation—Trip Advisor Hotel Database.
Bdcc 03 00015 g016
Figure 17. Recommender Evaluation -Improvement—Trip Advisor Hotel Database.
Bdcc 03 00015 g017
Figure 18. Recommender Evaluation—Amazon Database.
Bdcc 03 00015 g018
Figure 19. Recommender Evaluation—Improvement—Amazon Database.
Bdcc 03 00015 g019
Table 1. Recommender Evaluation—Film—Gradient Descent.
FirstIT-1IT-2IT-3
Request 01: Crime Documentary Drama Mystery—Gradient Descent
0.73540.8770723630.8770723630.876957785
Request 02: Action Adventure Thriller—Gradient Descent
0.7542494150.8062709530.8062709530.806270953
Request 03: Fantasy Mystery SciFi—Gradient Descent
0.6865512180.7371182670.7325606230.82911265
Request 04: Animation Children Fantasy Musical—Gradient Descent
0.7057787380.8859397370.896490930.875310848
Request 05: Crime Drama Horror—Gradient Descent
0.6904779930.8895325840.88963720.8896372
With Average Values 
With Average Values 
MetricFirstIT-1IT-2IT-3
Q0.71450.83920.84040.8555
σ0.02940.06640.07020.0358
CR 95%0.02570.05820.06150.0314
I-17.45%0.15%1.79%
σ20.00090.00440.00490.0013
Table 2. Recommender Evaluation—Film—Reinforcement Learning.
FirstIT-1IT-2IT-3
Request 01: Crime Documentary Drama Mystery—Reinforcement Learning
0.8039314370.8407790160.9480780931
Request 02: Action Adventure Thriller—Reinforcement Learning
0.7542494150.7542494150.8004736050.842576506
Request 03: Fantasy Mystery SciFi—Reinforcement Learning
0.7188187750.7728872830.8399540790.874032301
Request 04: Animation Children Fantasy Musical—Reinforcement Learning
0.7132558040.7337758520.7950610680.888826819
Request 05: Crime Drama Horror—Reinforcement Learning
0.7895211270.8769577850.9587838060.999761905
With Average Values 
With Average Values 
MetricFirstIT-1IT-2IT-3
Q0.75600.79570.86850.9210
σ0.04070.06060.07960.0739
CR 95%0.03570.05320.06970.0648
I-5.26%9.14%6.05%
σ20.00170.00370.00630.0055
Table 3. Recommender Evaluation—Trip Advisor Car—Gradient Descent.
FirstIT-1IT-2IT-3
Request 01: Fuel Comfort Fun—Gradient Descent
0.9358680.9414820.9400700.939997
Request 02: Fuel Performance Reliability—Gradient Descent
0.9289260.9360830.9336170.934075
Request 03: Exterior Build Performance—Gradient Descent
0.9381930.9322030.9340750.934075
Request 04: Fuel Performance Comfort Reliability—Gradient Descent
0.9378420.9414820.9400700.939717
Request 05: Interior Exterior—Gradient Descent
0.9387480.9298640.9340750.934075
With Average Values 
With Average Values 
MetricFirstIT-1IT-2IT-3
Q0.93590.93620.93640.9364
σ0.00410.00530.00340.0032
CR 95%0.00360.00460.00300.0028
I-0.0328%0.0170%0.0007%
σ21.6 × 1052.8 × 1051.1 × 1051.0 × 105
Table 4. Recommender Evaluation—Trip Advisor Car—Reinforcement Learning.
FirstIT-1IT-2IT-3
Request 01: Fuel Comfort Fun—Reinforcement Learning
0.9387330.9454580.9455070.945544
Request 02: Fuel Performance Reliability—Reinforcement Learning
0.9314250.9446360.9446210.945395
Request 03: Exterior Build Performance—Reinforcement Learning
0.9393490.9454690.9454690.945425
Request 04: Fuel Performance Comfort Reliability—Reinforcement Learning
0.9396170.9455180.9455100.945507
Request 05: Interior Exterior—Reinforcement Learning
0.9396210.9451000.9452510.945269
With Average Values 
With Average Values 
MetricFirstIT-1IT-2IT-3
Q0.93770.94520.94530.9454
σ0.00360.00040.00040.0001
CR 95%0.00310.00030.00030.0001
I-0.7984%0.0038%0.0165%
σ21.3 × 1051.4 × 1071.4 × 1071.2 × 108
Table 5. Recommender Evaluation—Trip Advisor Hotel—Gradient Descent.
FirstIT-1IT-2IT-3
Request 01: London Cleanliness Room Service—Gradient Descent
0.9579770.9592780.9592780.959278
Request 02: Beijing Cleanliness Room Service—Gradient Descent
0.9421780.9497310.9497310.949731
Request 03: Chicago Location Value—Gradient Descent
0.9250140.9342800.9342800.934280
Request 04: SanFrancisco Room Location—Gradient Descent
0.9212120.9269480.9240850.922225
Request 05: NewYork Cleanliness Room Service Location – Gradient Descent
0.9444690.9459970.9459970.945997
With Average Values 
With Average Values 
MetricFirstIT-1IT-2IT-3
Q0.93820.94320.94270.9423
σ0.01510.01280.01370.0144
CR 95%0.01320.01120.01200.0126
I-0.5411%−0.0607%−0.0395%
σ22.3 × 1041.6 × 1041.9 × 1042.1 × 104
Table 6. Recommender Evaluation—Trip Advisor Hotel—Reinforcement Learning.
FirstIT-1IT-2IT-3
Request 01: London Cleanliness Room Service—Reinforcement Learning
0.9595380.9619270.9983670.998531
Request 02: Beijing Cleanliness Room Service—Reinforcement Learning
0.9408710.9542230.9765500.983406
Request 03: Chicago Location Value—Reinforcement Learning
0.9272930.9365770.9876760.987581
Request 04: SanFrancisco Room Location—Reinforcement Learning
0.9221210.9294530.9879070.987907
Request 05: NewYork Cleanliness Room Service Location—Reinforcement Learning
0.9446970.9464950.9984420.998442
With Average Values 
With Average Values 
MetricFirstIT-1IT-2IT-3
Q0.93890.94570.98980.9912
σ0.01480.01310.00910.0069
CR 95%0.01300.01150.00800.0061
I-0.7276%4.6581%0.1399%
σ22.2 × 1041.7 × 1048.3 × 1054.8 × 105
Table 7. Recommender Evaluation—Amazon—Gradient Descent.
FirstIT-1IT-2IT-3
Request 01: New York City—Gradient Descent
0.1500680.2691690.2737650.273765
Request 02: space exploration research—Gradient Descent
0.1619050.1398100.1397140.139714
Request 03: London—Gradient Descent
0.0897140.1057140.1057140.105714
Request 04: Silicon valley—Gradient Descent
0.1712310.2363740.3175160.244231
Request 05: great depression– Gradient Descent
0.1522620.2198810.2156670.215667
With Average Values 
With Average Values 
MetricFirstIT-1IT-2IT-3
Q0.14500.19420.21050.1958
σ0.03200.06860.08870.0709
CR 95%0.02810.06020.07770.0621
I-33.89%8.39%−6.96%
σ21.0 × 1034.7 × 1037.9 × 1035.0 × 103
Table 8. Recommender Evaluation—Amazon—Reinforcement Learning.
FirstIT-1IT-2IT-3
Request 01: New York City—Reinforcement Learning
0.1500680.2483330.3717340.372634
Request 02: space exploration research—Reinforcement Learning
0.1619050.1761900.1761900.176667
Request 03: London—Reinforcement Learning
0.0897140.1331430.1331430.133143
Request 04: Silicon valley—Reinforcement Learning
0.1712310.1712310.1712310.171231
Request 05: great depression—Reinforcement Learning
0.1522620.2164760.2164760.220476
With Average Values 
With Average Values 
MetricFirstIT-1IT-2IT-3
Q0.14500.18910.21380.2148
σ0.03200.04440.09310.0935
CR 95%0.02810.03890.08160.0819
I-30.36%13.05%0.50%
σ21.0 × 1032.0 × 1038.7 × 1038.7 × 103

