1. Introduction
The impact of the COVID-19 outbreak [
1] severely affected many nations’ economies and societies [
2,
3]. To control the spread of pandemic, all countries followed precautionary measures such as lockdowns, wearing face masks, and social distancing, and provided quick solutions to contain the disease [
4].
During the pandemic, users shared their opinions, news, and their experiences in facing this virus on a daily basis through social media [
5] which is considered a big data centre. Social networking sites (SNSs) such as Twitter have been considered as valuable sources of different event detection and tracking, such as disease outbreaks. This online platform prompted researchers to analyse, in real time, the tweets that contain peoples’ feelings [
6] and reactions in many subjects, such as election voting, the stock market, crime, and hate speech [
7].
Furthermore, the objective of artificial intelligence (AI) in this current crisis has clearly contributed to studies of the change of human reactions and concerns in correlation with COVID-19 patients and deaths during and after the pandemic. Thus, many COVID-19 surveillance models search for an effective approach of text processing and extracting knowledge from COVID-19-related posts, generating reports earlier, which can be decisive for outbreak prevention. This process is namely sentiment analysis (SA) [
8], or emotions mining [
9], which classifies the opinions of different sentences as negative, neutral, or positive. This sentences are preprocessed with natural language processing (NLP) and classified with machine learning (ML) [
10,
11,
12,
13]. These sentiments are very useful for building faster disease surveillance systems. Many studies contributed to analyse English-language tweets but they did not take into consideration the relationship between syntactic and semantic information and ML methods based on feature types. Thus, in this research, we studied Twitter sentiment analysis on a dataset in relation to COVID-19 to predict and monitor the disease outbreak by the application of supervised machine learning methods. We employed TF-IDF N-gram and word-level for the syntactic analysis, whereas for the semantic analysis, we used Word2vec, FastText, and Glove. Accordingly, the main areas of the research were the following subjects:
- 1.
We present five different extant feature extraction methods: TF-IDF N-gram, TF-IDF uni-gram, Word2vec, Glove, and FastText. We also present two novel methods: hybrid TF-IDF with Glove, and hybrid TF-IDF-based FastText.
- 2.
We compare machine learning methods performance with different features extraction for English-language tweets classification.
- 3.
We choose the best methods combination and fusion to enhance the previously compared performances of machine learning classifiers.
In order to study these two areas, we collected a geo-tagged tweet dataset from IEEE port. It included the tweet IDs and users’ sentiment scores, since Twitter’s policy does not provide access to streaming complete tweets to be published to third parties. After the hydration of the tweet ID to obtain the meaningful text, the tweets were cleaned using preprocessing techniques. Then, we calculated the sentiment scores using the TextBlob toolkit which classified the tweets as negative, neutral, or positive [
14]. We proposed the use of feature extraction methods, such as TF-IDF, Word2vec, FastText, and GloVe, for improving accuracy. The novelty of the present study is in gaining the benefits of these techniques, combined together, in the same ensemble. We combined two methods, first TF-IDF with FastText features and second TF-IDF with Glove, in order to enhance classification accuracy. Therefore, seven machine learning methods, decision tree (DT), random forest (RF), logistic regression (LR), XGBoost classifier, AdaBoost, naïve Bayes, and support vector machine (SVM) were applied, then we compared their performances in the testing phase. Furthermore, we applied one deep learning model, a convolution neural network (CNN), with different word embedding, in comparison with the other models. We evaluated the performance with the following metrics: accuracy, AUCC score, precision, recall, and F1-score. The article is organised as follows. A literature review is presented in
Section 2. Materials and methods are presented in
Section 3. In
Section 4, we discuss performance evaluation. The discussion is presented in
Section 5. Lastly, in
Section 6, we conclude the paper.
2. Literature Review
Analysing Twitter data is catching the attention of data science researchers, because the data are rich with information on COVID-19 and peoples’ attitudes towards the virus. Sentiment analysis, also called emotional extraction or opinion mining, was studied by researchers to understand disease behaviour and its relation with official cases or deaths [
15,
16].
Researchers, such as Rajput et al. [
17], have applied an approach to analyse tweets about the COVID-19 outbreak, based on words frequency and sentiment analysis. Their approach is based on word-level, bi-gram, and tri-gram frequencies to represent word rates by power law distribution. Three tweets classes were obtained accordingly: negative, positive, and neutral.
Samuel et al. [
11] proposed machine learning models: naïve Bayes and logistic regression to categorise sentiment tweets into two classes—positive and negative. In their paper, they test the performance of these models on two categories of data with different lengths of characters, less than 77 characters for the first category and 120 characters per tweet in the second category. Naïve Bayes outperformed logistic regression in both categories, the shorter tweets achieved 91.43% accuracy by NB, while this was 74.29% for LR, and the longer tweets achieved 57.14% accuracy by NB, while LR assessed an accuracy of 52%.
Muthausami et al. [
18] have introduced a research based on analysing and visualising the worldwide influence of COVID-19. They classified the tweets into three classes based on machine learning methodology. The classes are positive, neutral, and negative. They utilised different classifiers, such as SVM, naïve Bayes, random forest, decision tree, LogitBoost and MaxEntropy. The proposed method showed that the LogitBoost ensemble classifier achieved better results than the other algorithms.
A study conducted by Jelodar et al. [
19] implemented an approach to classify sentiments based on deep learning models, such as LSTM recurrent neural networks (LSTM RNN). The classifier was implemented using NLP for COVID-19 topic modelling expressed on social media.
Aljameel et al. [
20] analysed a large Arabic COVID-19-related tweets dataset. The authors built a machine learning model to predict and classify Saudi Arabian citizens’ responsiveness toward government measures and pandemic control. They applied uni-gram and bi-gram TF-IDF with SVM, naïve Bayes and KNN classifiers to enhance accuracy. The output results showed that SVM outperformed KNN and naïve Bayes with 85% accuracy.
Al-sukkar et al. [
21] introduced a sentiment analysis approach to analyse Arabic tweets as negative or positive with two machine learning classifiers: SVM and naïve Bayes. To enhance the accuracy of classifiers, they applied N-gram TF-IDF with 10-fold cross-validation. Experimental results proved that, using uni-gram, SVM showed the highest accuracy of 83.16%, whereas naïve Bayes achieved an accuracy of 81.93% using bi-gram and tri-gram.
Imran et al. [
22] have used a deep learning algorithm LSTM to perform classification of sentiments related to COVID-19 tweets. The application of LSTM on the sentiment 140 dataset was improved with pre-trained Glove Twitter embedding. The main objective of this method was to compute sentiment polarity and users’ emotions from tweets. Accordingly, the authors proved that there is a high correlation of sentiment polarity between neighbouring countries.
Alam et al. [
23] employed SVM, FastText, and BERT on 218 Arabic tweets and 504 English tweets. The FastText model provided the best result for Arabic text.
In the approach presented by Alqurashi et al. [
24], different machine learning classifiers were applied on Arabic Tweets to identify misinformation related to COVID-19 and they employed TF-IDF, Word2Vec, and FastText feature embedding techniques to enhance accuracy of classifiers. The results show that FastText produced high accuracy of 86.8% with traditional classifier, XGBoost, whereas Word2Vec obtained better accuracy with deep learning classifiers, achieving 85.7% with CNN.
Naseem et al. [
25] correspondingly proposed the use of various pre-trained embedding representations—FastText, GloVe, Word2Vec, and BERT—to extract features from a Twitter dataset. Furthermore, for the classification, they applied deep learning methods Bi-LSTM and several classical machine learning classifiers, such as SVM and naïve Bayes. The TF-IDF model and FastText outperformed other feature extraction methods with traditional classifiers SVM and RF.
Furthermore, Basiri et al. [
26] presented a model that combine five models such as naïve Bayes support vector machines (NBSVM), FastText, DistilBERT, CNN, and bidirectional gated recurrent unit (BiGRU) on COVID-19 tweets in eight highly affected countries. Their approach, that is improved by a meta learning method, achieved a high accuracy of 85.80% in classifying sentiments.
The authors in [
27] proposed a COVID-19 tweets classification approach based on several traditional machine learning algorithms: decision tree, XGBoost, extra tree classifier (ETC), random forest, and LSTM. To better represent the text, they used bag-of-words (BOW) and TF-IDF methods. The experimental results showed that ETC achieved higher accuracy with 93%.
Moreover, Nemes and Kiss [
28] implemented a model to classify tweets into positive and negative with an RNN model and the TextBlob method [
29]. Their proposed work outperformed TextBlob.
For sentiment tweet classification related to COVID-19, Kau et al. [
30] proposed a hybrid heterogeneous SVM method (HH-SVM). The results show that the proposed approach outperformed RNN.
As well, Li et al. [
31] presented an approach to classify microblog reviews sentiments that included emojis with an emoji-text-incorporating bi-LSTM (ET-BiLSTM) model. The emojis, represented in vectors, were passed to the proposed model. The results show that ET-BiLSTM enhances the performance of sentiment classification.
The work proposed by Umair and Masciari [
31] is to classify COVID-19 tweets related to vaccine. They implemented the BERT model for sentiment classification. Then, they investigated the distribution of sentiments towards the vaccine across the world by analysing the hot-spot regions and the application of kernel density estimation. The proposed approach achieved 55%, 69%, and 58% for precision, recall, and F-score for the positive sentiments, respectively, while negative sentiments achieved 54%, 85%, and 64% for precision, recall, and F-score, respectively.
Another study during COVID-19 was proposed by Balli et al. [
32] to classify public datasets and SentimentSet data, manually labelled for positive and negative Turkish tweets. Two different libraries were used to preprocess the dataset: Zemberek [
33] library and SnowBall library. Furthermore, the data were tokenized by TF-IDF to be passed to ML algorithms, such as LR, RF, Bayesian, and stochastic gradient descent (SGD), while for LSTM, the data were presented by the tokenizer class. It was observed that the models applied on SentimentSet have better performances and the negatively weighted data accuracy was higher than the positively weighted data accuracy.
In another study, Sitaula and Shahi [
34] designed a hybrid feature to represent Nepali tweets. They used the fusion of two-word representations such as the bag-of-words (BOW) with FastText-based and domain-specific methods. The combined representations were passed to a multi-channel convolutional neural network (MCNN). The results showed that feature combination outperformed individual features with 69.7% accuracy, and the MCNN model achieved 71.3% accuracy compared with classical algorithms.
Singh et al. [
35] conducted a study to classify sentiment Twitter data related to COVID-19 using enhanced feature weighting with the attention mechanisms of LSTM-RNN. TF-IDF were applied to extract tweets features. The experimental results showed that the method proposed outperformed the rest of classical ML algorithms, such as: RF, SVM, NB, and LR, with an accuracy of 84.56%.
In a study by Parimala et al. [
36], the researchers used LSTM with feature extraction method to classify tweets related to catastrophe events. They proposed to use risk assessment sentiment analysis (RASA) algorithm. The results show that RASA achieved high accuracy compared with XGBoost and binary classifiers [
36].
In all previous studies, sentiment analysis is a very valuable source of information, and researchers seek a method which will enhance accuracy. In this present study, we present a comparative analysis between machine learning algorithms using TF-IDF, Word2vec, FastText, and Glove word embedding models. Accordingly, to achieve high accuracy, we present a hybrid method that combines TF-IDF and two effective word representations, Glove and FastText embedding.
3. Materials and Methods
After conducting the literature review, we can observe that different researchers have developed different models using machine learning methods towards COVID-19 detection and pattern analysis. The proposed framework, as shown in
Figure 1, is divided into five stages: data collection, preprocessing phase, sentiment analysis, features extraction, and classifiers application. First, we start by collecting tweets dataset freely available on IEEE data port [
37]. The second stage is prepossessing data by removing punctuation, symbols, hashtags, and stop-words, using a natural language processing toolkit (NLTK) [
38]; this stage also includes stemming and tokenizing steps. After that, the following stage is performed in two parts. The first part includes calculation of sentiment scores and the second part includes categorisation of sentiment type. Next, in the features extraction stage, we applied different widely used word representation tools, such as TF-IDF, word2Vec, Glove, FastText, and a combination of word embedding models. The result of this stage is transferred to several classifiers for evaluation. Accordingly, each stage is explained in-depth in the following sections.
3.1. Data Collection
Since Twitter API does not allow access to stream old data for more than one week, our study is based on a Twitter dataset [
39] freely available on IEEE’s website [
37] from 20 March 2020. The extracted dataset mostly contained geo-tagged tweets with only the tweet IDs of the users and filtered based on keywords related to COVID-19, since Twitter’s policy does not allow third parties to publish tweets or access streaming of complete tweets. To capture complete tweet information, such as tweet ID, tweet text, location, time created, and more, we need to hydrate the IDs using the DocNow [
40] hydrator tool, which is a desktop application that allows hydration of tweets in JSON as well as CSV format. The hydrated tweets from 20 March 2020 to 26 May 2021 were downloaded into a CSV file. Furthermore, the extracted tweets are only presented in English language in this current study.
3.2. Data Preprocessing
The preprocessing phase is very important in this stage for text classification. We needed to clean the tweets by removing the special characters, emoticons, hashtags, punctuation, URLs, numbers, mention, and symbols from the text which were not necessary for analysis purposes using the NLP toolkit (NLTK) [
35,
38]. Then, the tweets were converted into lower text. We then proceed to tokenizing the tweets [
41], which is essentially splitting the text into a list of words using methods available in the NLP library [
42]. Finally, and after removing English stop-words, we used the stemming process to reduce words to their roots with the Porter stemming algorithm [
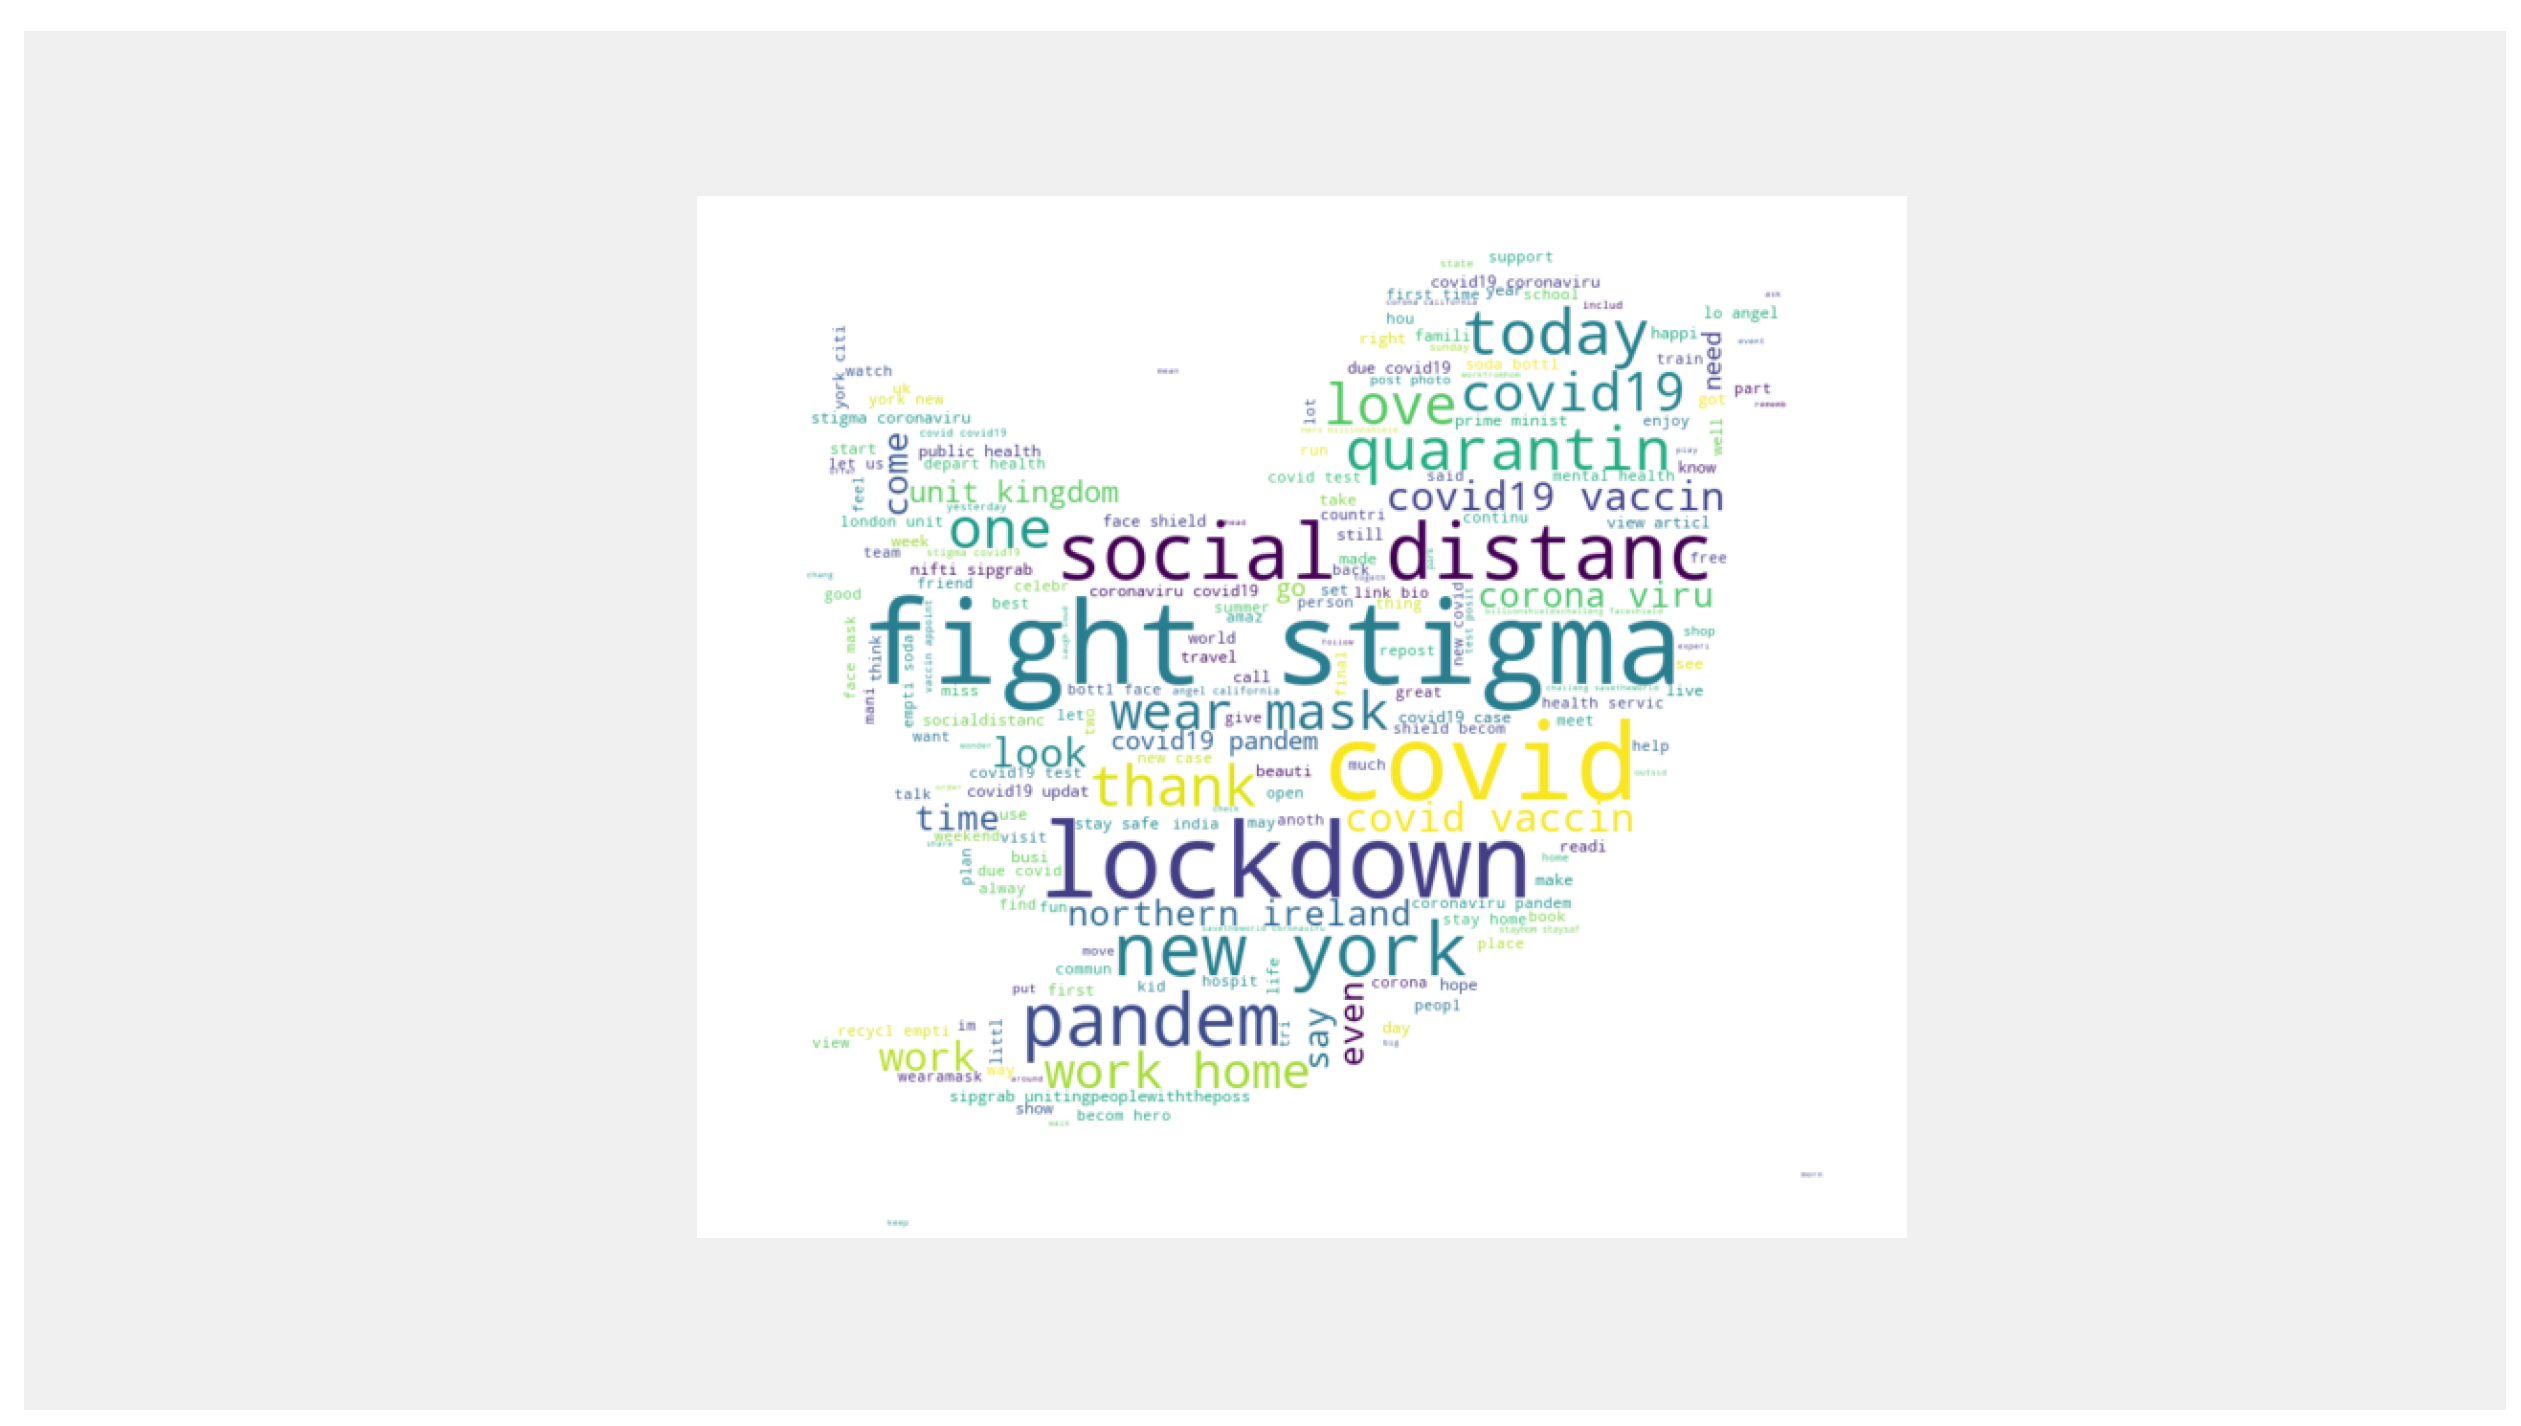
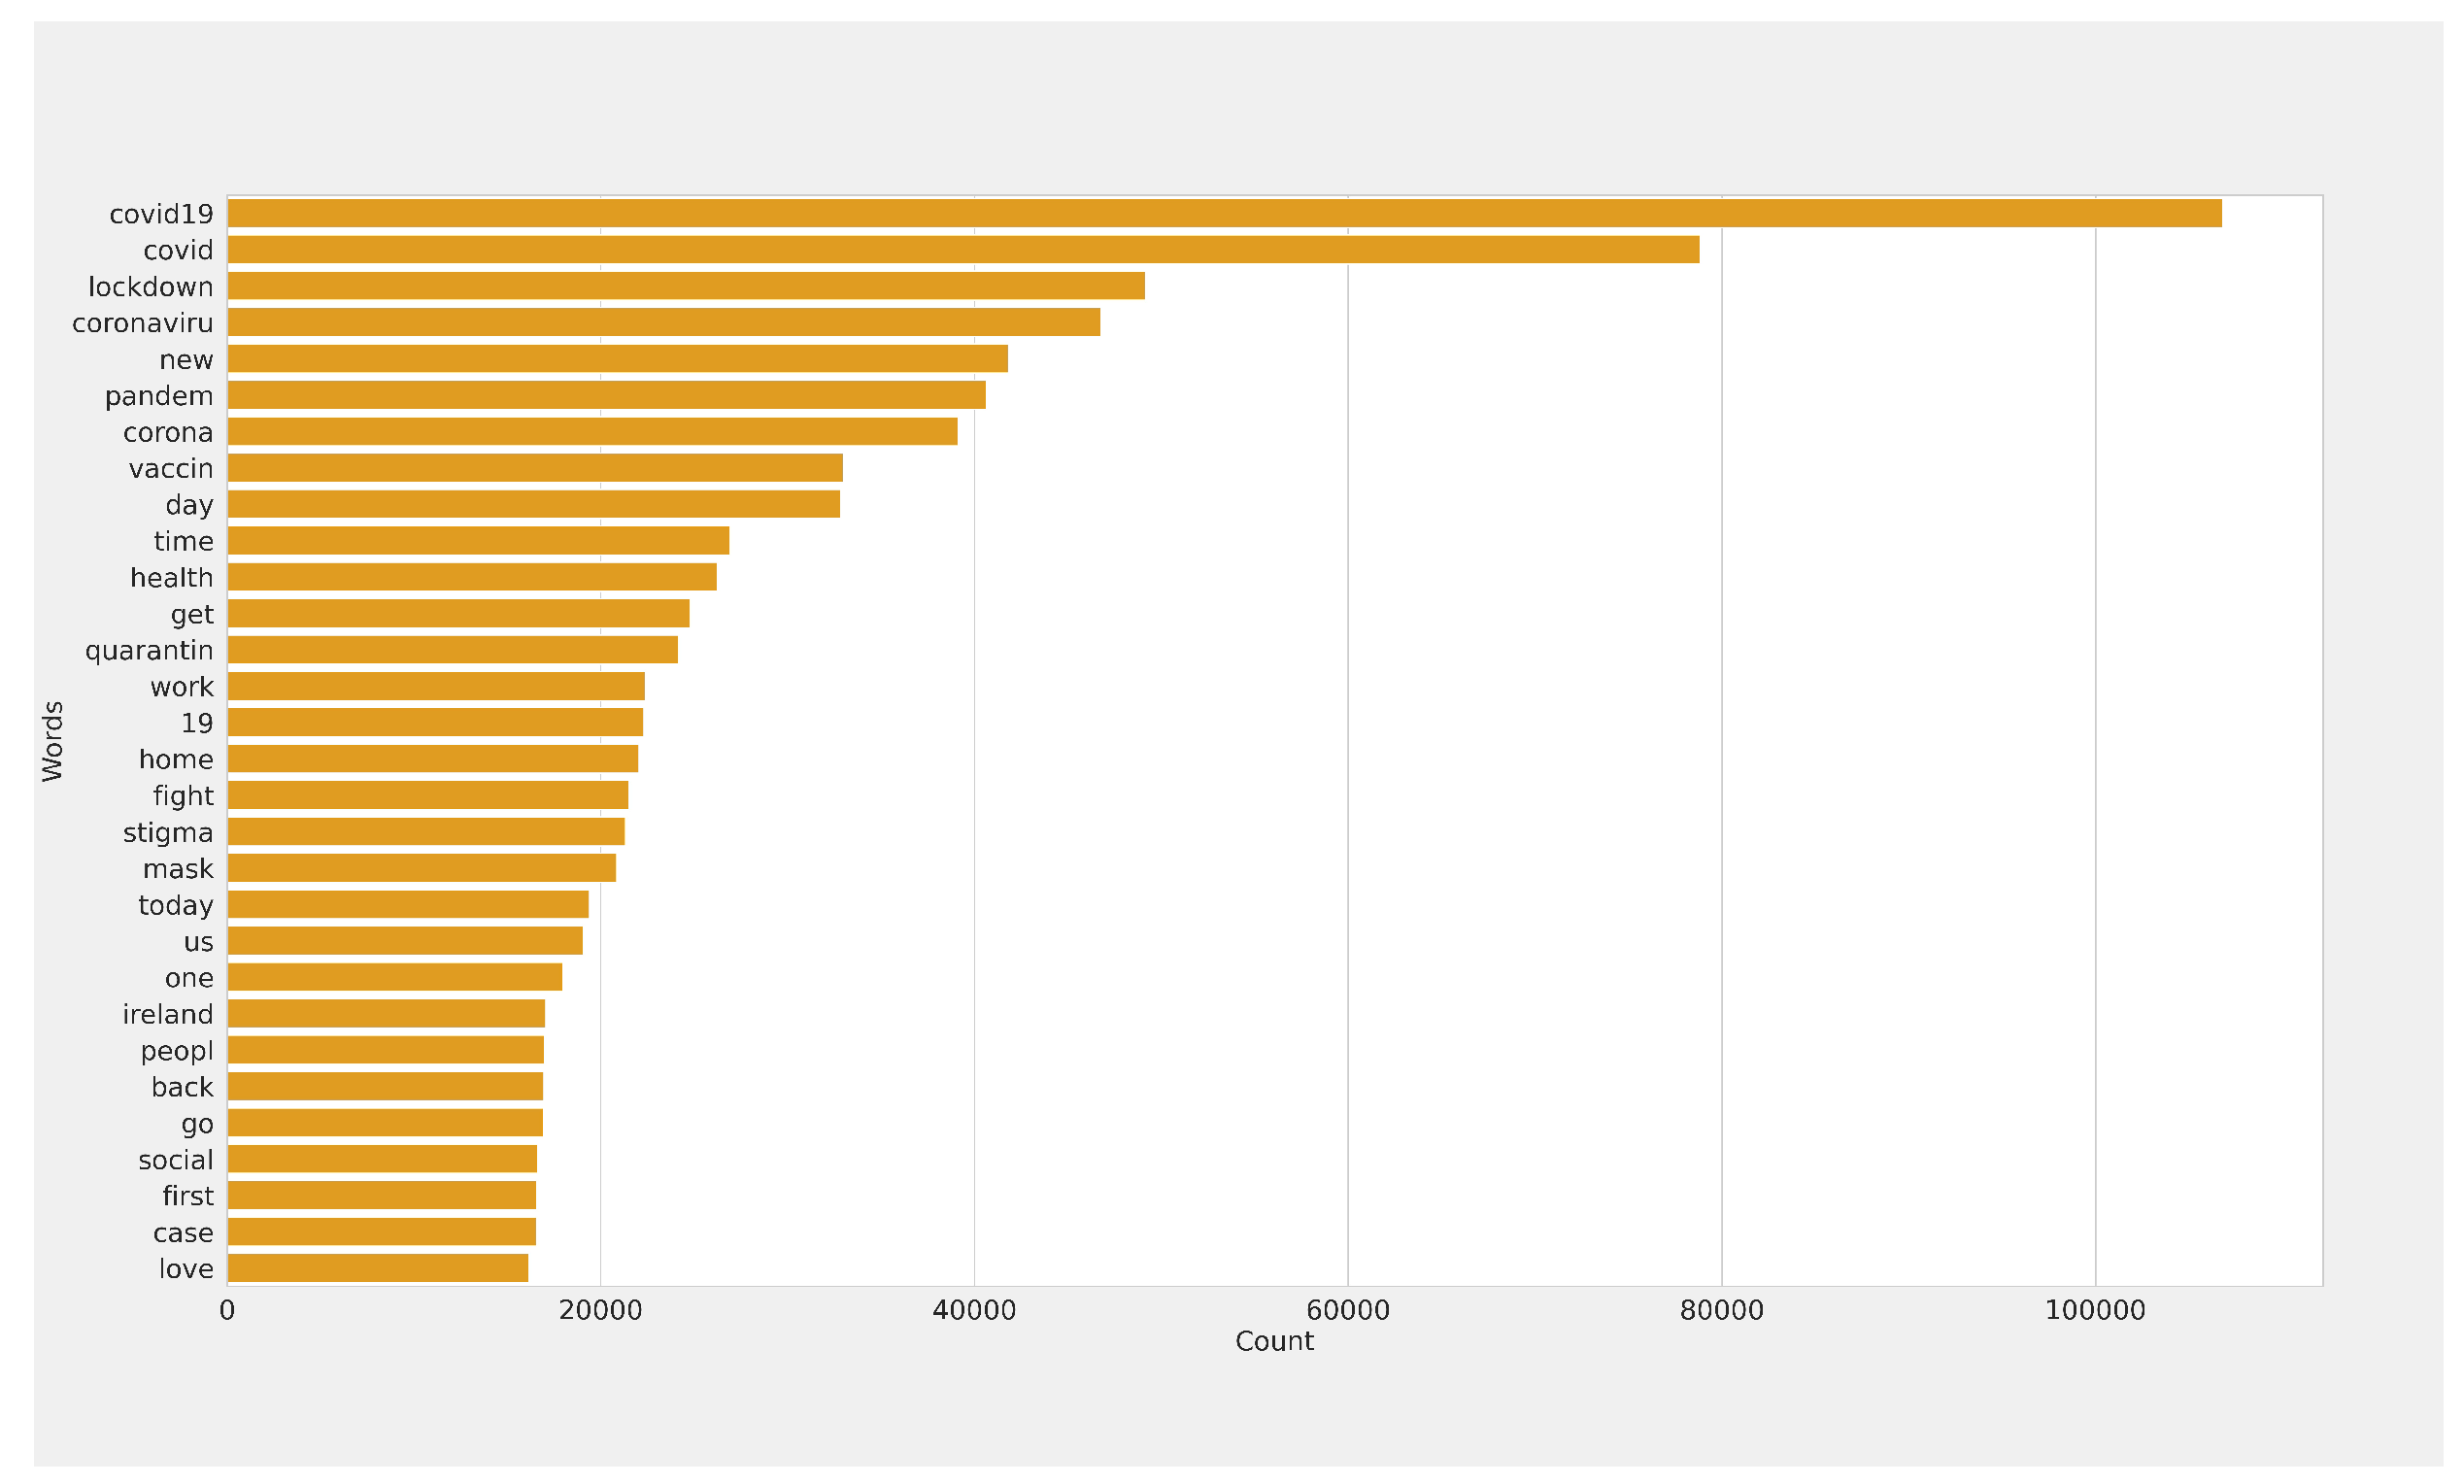
43]. It is one of the most well known stemming algorithms. After the cleaning process, we visualised the most significant words in the tweet text by using Word cloud
Figure 2, which is a well-known data visualisation technique. Furthermore,
Figure 3 shows the most frequent words.
After cleaning the tweets, we applied NLTK and TextBlob libraries [
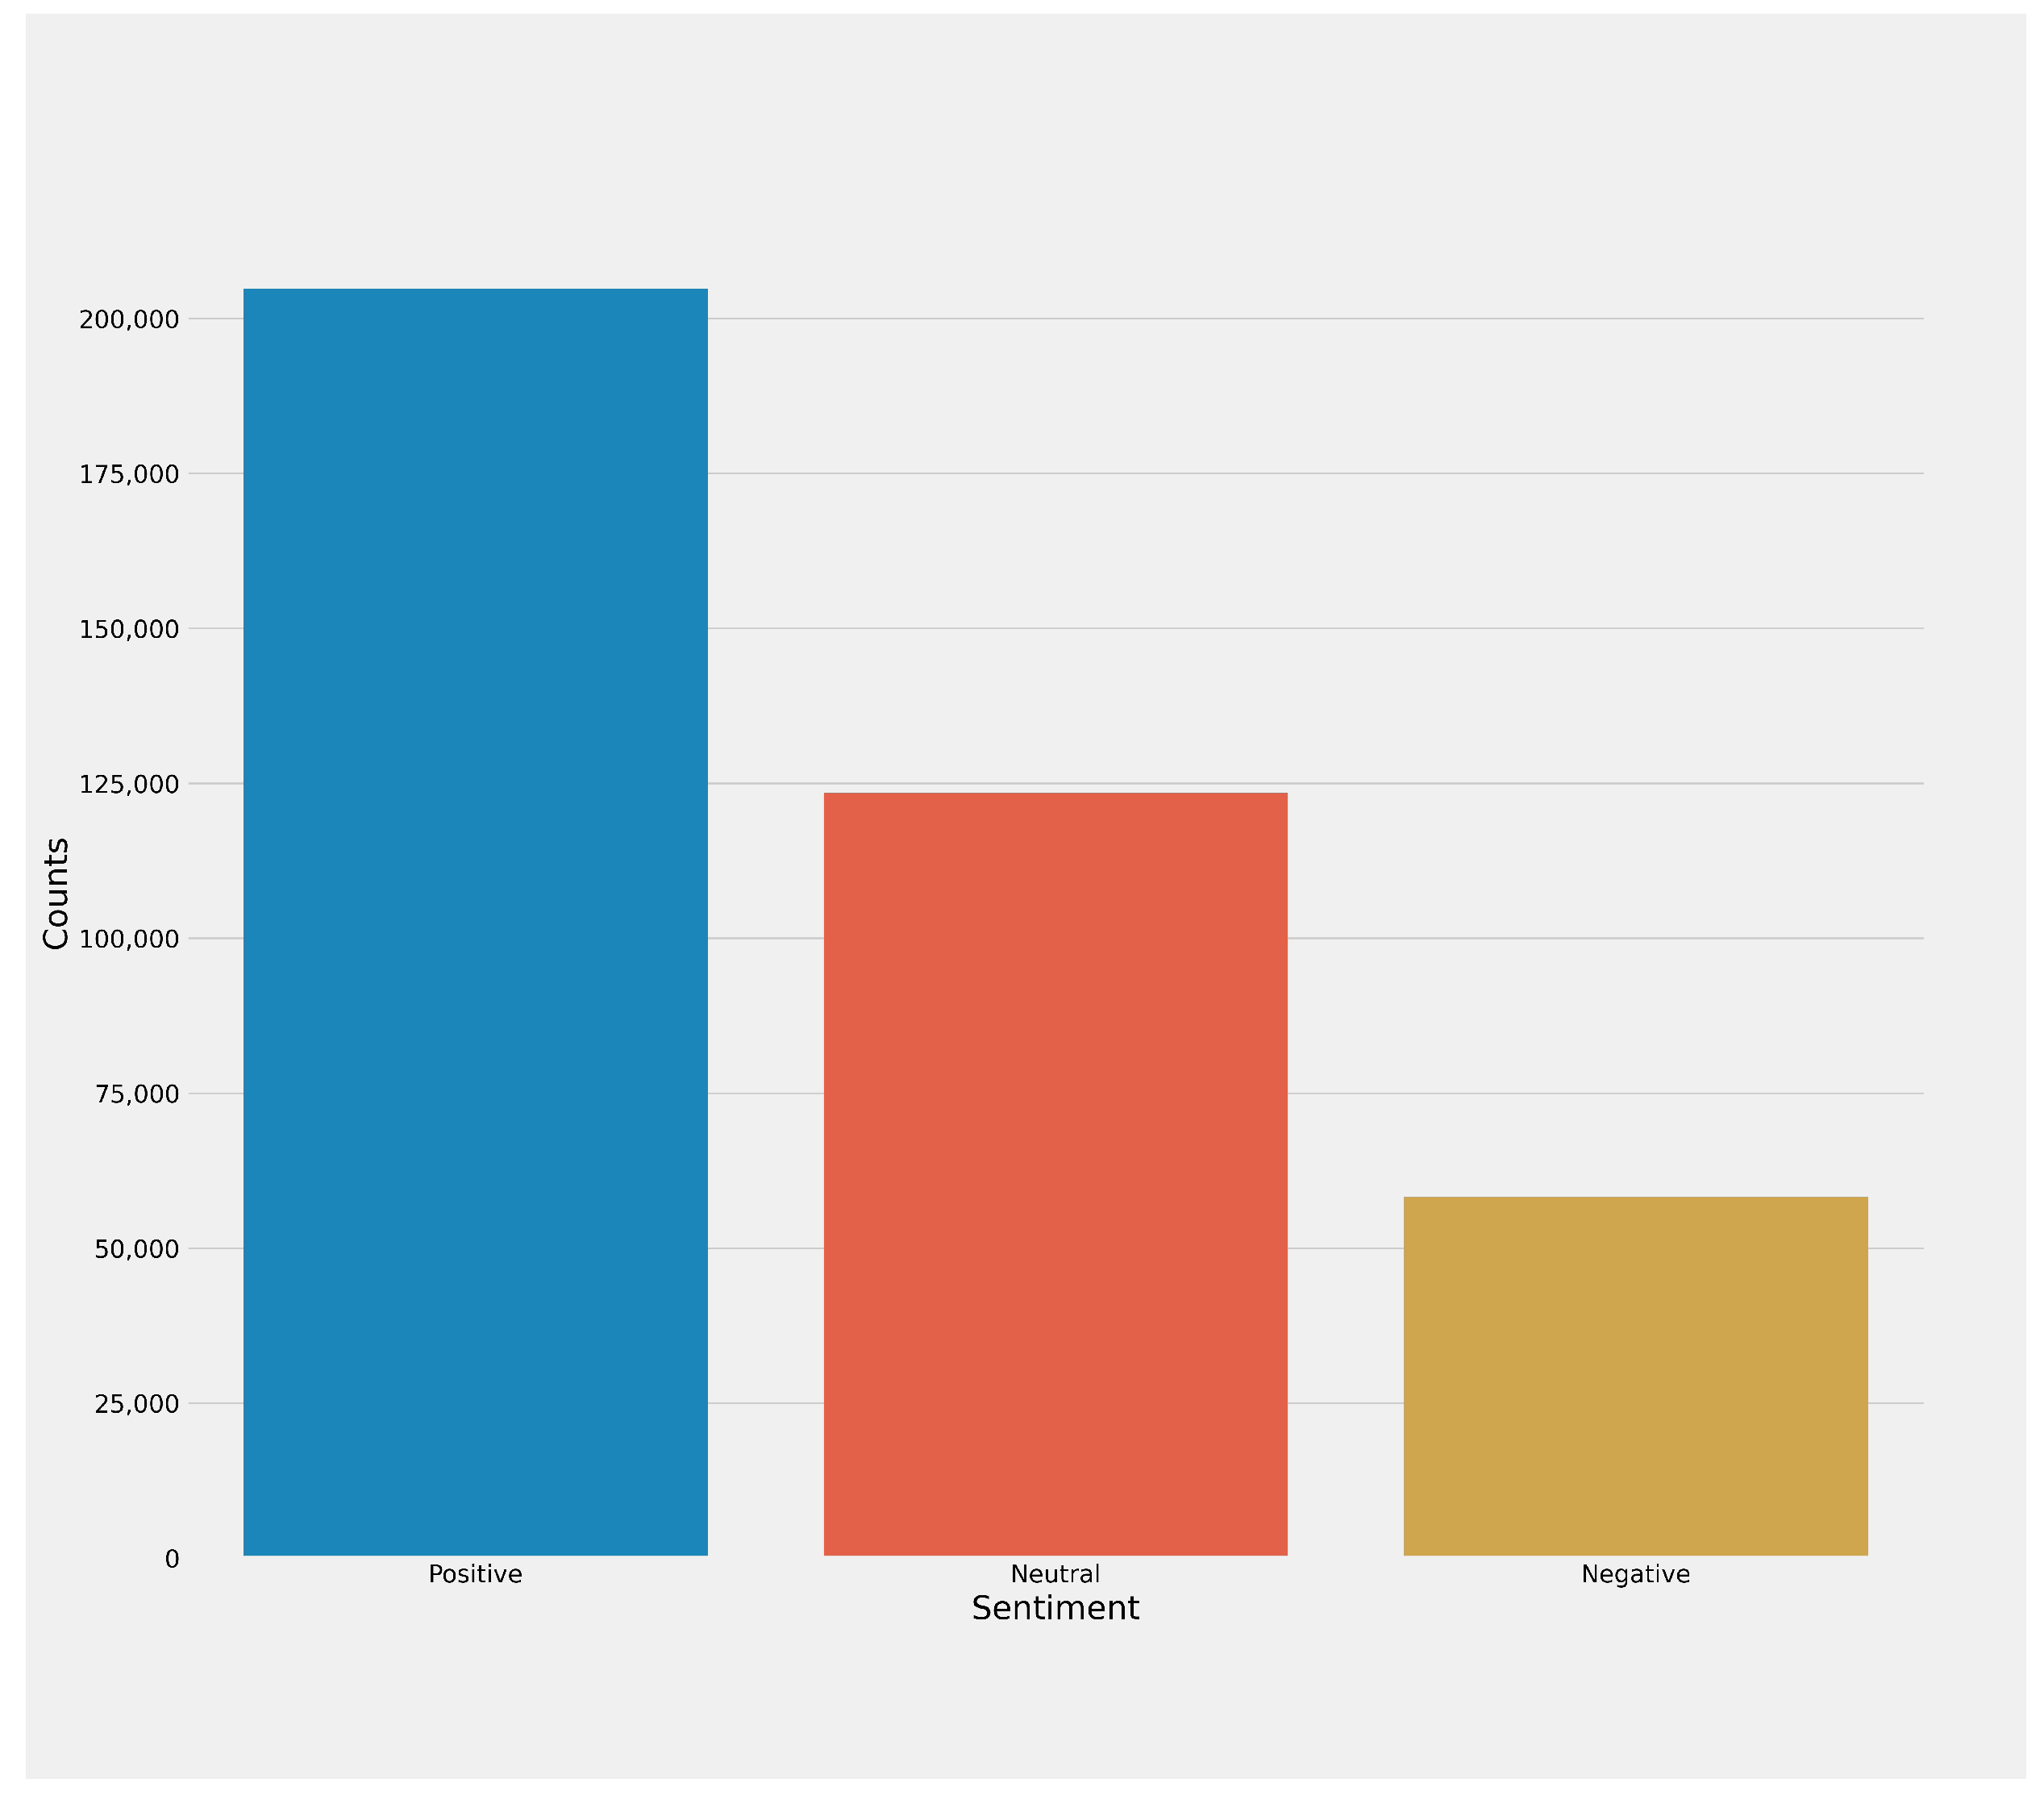
29] to detect the sentiment polarity and subjectivity of each tweet. Subjectivity refers to personal opinion and polarity identifies sentiment orientation, these processes determine the attitude or the feeling of the writer. The value of polarity is between −1 and 1. Depending on polarity scores generated, the tweets were identified into three categories accordingly: negative, when the score is less than 0; neutral, when the score is equal to 0; or positive.
In
Figure 4, the distribution of negative, positive, and neutral sentiments is presented. Furthermore, in
Figure 5, the Word cloud representation of each categories are shown.
3.3. Feature Extraction
The following phase is feature extraction which is crucial in any classification problem. Two different categories are used to filter out the irrelevant word: vectorization techniques and feature embedding. We have used TF-IDF for vectorization and correspondingly, we have used pre-trained Word2Vec, FastText, and GloVe embedding trained on Common Crawl and Wikipedia with 300-D vectors, for word embedding.
3.3.1. Term Frequency-Inverse Document Frequency (TF-IDF)
TF-IDF is a fundamental step used for transforming the tweet text data into numbers before applying any classification model [
27]. It is performed in two statistical methods: first, TF, which is the total word number appearance in a document; the second method is IDF, that refers to the total terms occurrences in the document. The weight is based on the product of TF and IDF to measure the relevance and how the term is important in a given document. Equations (
1)–(
3) present the formula to calculate TF, IDF, and their product. Where
t refers to the term with frequency
n,
d represents the document, and
N refers to documents’ frequency,
d, containing the term,
t.
We constructed TF-IDF vectors twice: the first with word level and the other one with N-grams.
3.3.2. Word2Vec
Word2Vec [
44] is the most widely used technique to learn word embedding utilising neural network. The trained model applied mathematical operation on the text corpus to place similar words in the same vector. There are two main methods for Word2Vec, one called the skip-gram-based method, where the main idea is predicting the context based on a word, and the second is continuous bag of words (CBOW), in which the predicted term depends on the context. The algorithm built in this study is CBOW, trained on the corpus with window sizes W = 5, minimum word frequency = 5, and dimension D = 100.
3.3.3. FastText
FastText [
45], provided by the Facebook team, is an approach of word embedding using the skip-gram-based model, where each word is transformed to N-grams character. The words in the training corpus are associated with vector representation sum of each character N-gram, even misspelled or rare words, not presented in the dictionary, will have an embedding. We applied pre-trained FastText embedding methods to produce one vector for each word of a specific tweet. The model used in this study was 1 million word vectors trained on Wikipedia 2017 with 1 billion tokens. FastText is an extension to Word2Vec and has been shown more accuracy compared with Word2Vec [
46].
3.3.4. Glove
The global vector for word representation [
47] is mostly used for feature extraction. The Glove technique generates feature matrix based on feature-feature co-occurrence. In this study, we used pre-trained word vectors freely available on corpora, which is the combination of Gigaword5 and Wikipedia2014, with 6 billion tokens from Common Crawl.
3.3.5. Hybrid Word Embedding Techniques with TF-IDF
Despite the use of various embedding techniques and tools, we look to enhance machine learning algorithms performance and to deal with challenges to optimise classification process. Consequently, we provide a hybrid approach that combined TF-IDF [
27] features with FastText [
45] on the one hand and TF-IDF features with GloVe [
47] on the other hand. In the experimental results, TF-IDF, FastText, and Glove proved their capability of extracting features from the tweets and increasing the performance of classification.
First, we applied TF-IDF on the dataset to represent tweets syntactically. This technique generates a scores vector from each word in each tweet. Then, to capture the semantic feature, we multiplied the word embedding Glove or FastText with word TF-IDF-scores for all the words in the sentence to acquire the vector used for the classification phase. Equation (
4) for matrices multiplication output is shown as follows:
We note that the number of tokens is P. a and b represent the TF-IDF matrix and semantic matrix, respectively. F represents the final multiplication matrix. The combined techniques syntactic and semantic are complementary to each other and the fusion is helpful for models aiming to improve their accuracies and to benefit from the power of two techniques in same model.
3.4. Classification
In the phase of classification, we applied several machine learning classifiers. Those classifiers are XGBoost, random forest, AdaBoost, decision tree, logistic regression, naïve Bayes, and SVM. Deep learning models such as convolutional neural network (CNN) were used in addition to traditional ML. We chose several algorithms since they are widely applied in sentiment analysis for their high accuracy. We compared the performance of each classifier to obtain the best model.
3.4.1. Decision Tree
Decision tree is a machine learning model frequently applied in classification [
48]. To find the outcomes, DT recursively splits the independent variables into groups. It is structured as a tree, where the features of the dataset are represented by the internal nodes, the outcomes are associated with each leaf node, and the decision rules are denoted in the branches.
3.4.2. Random Forest
The random forest [
49] classifier is a bagging technique that belongs to the ensemble techniques. It contains a number of decision trees instead of one decision tree, which are considered as the base learners. The predictive accuracy from each tree is improved by the average of the dataset. Thus, the trees are trained independently. The ensemble concepts of different decision trees in RF classifier lead to higher accuracy and prevent the problem from over fitting.
3.4.3. XGBoost
XGBoost is the abbreviation of the extreme gradient boosting algorithm which belongs to the ensemble method that is based on boosting trees. This successful machine learning method proposed by Tianqi Chen [
50] is based on a gradient boosting algorithm. The principal idea of XGBoost is to learn from the previous error performed by the model which improves the next performances.
3.4.4. AdaBoost
Adaptive boosting, known as AdaBoost [
51], is an important ensemble boosting classifier. AdaBoost trains a weak learning algorithm with equal weights set to the instance of dataset producing poorly performing classifiers. After choosing the coefficient,
, depending on the weak learning classifier performance, misclassified points may be produced and their weights had to be increased, while the weights of accurately classified points had to be reduced before running the weak learning algorithms again. As a result, the new weighted data is obtained for the weak classifiers. To obtain correctly classified data points, this process is repeated until the maximum level is reached. The AdaBoost classifier is developed when arriving at the final step.
3.4.5. Naïve Bayes
Naïve Bayes is very popular model and it has been used widely for text classification since 1960 [
52]. This simple algorithm is effective and based on the Bayes theorem. Aiming to predict the class, NB uses maximum posteriori estimation that has high conditional probability. The NB formula is shown in (
5):
where
c is the estimated class among all the classes
C,
is the posterior probabilities, and
is considered as the word index in the document.
3.4.6. Logistic Regression
David Cox developed logistic regression in 1958 [
53] and it is considered as one of the popular methods of machine learning. Using probabilities to describe the outcomes, LR is suitable for predicting categorical classification. Here we applied multinomial logistic regression for multi-class classification that adapted multinomial probability distribution. The rule of LR is to predict the class with the highest posterior probability. The decision rule is shown in (
6):
where
is the posterior probabilities,
is the predicted label,
k is the total labels, and
x is the input text.
3.4.7. SVM
SVM is a method based on supervised techniques which can be used for the classification [
54]. The input features are represented as vectors and projected onto larger dimension space. SVM is applicable with different type of function such as Gaussian/radial or kernel (linear, polynomial) type. Accordingly, in this research, we applied kernel function [
55].
3.4.8. Convolutional Neural Network
CNN is a very popular deep learning algorithm in the domain of image classification. It can capture the patterns with very high accuracy in computer vision. Recently, Kim [
56] demonstrated the efficient use of CNN for natural language processing and text analysis on various benchmark tasks. Therefore, CNNs are able to capture patterns in text.
4. Experimental Results
In this phase, we analyse the experimental approach performance with the five performance metrics, accuracy score, precision score, recall score, F1-score, and AUCC score. These metrics definitions are briefly outlined as follows:
Accuracy indicates the weighted harmonic mean of both precision and recall. The accuracy equation is as follows:
Precision score represents the percentage of positively classified tweets that actually correct. The precision is mathematically expressed as follows:
Recall score indicates the ability of the classifiers to classify all positive instances correctly. The recall is mathematically expressed as follows:
F1-score indicates the weighted harmonic mean of both precision and recall. The F1-score is mathematically expressed as follows:
AUCC score indicates the classifiers’ ability to distinguish between classes through the probability curve (ROC). The AUCC is defined as follows:
where
refers to true positives: the correct prediction number of positive class.
is true negatives: the correct predictions number of negative class.
refers to false positives: the incorrect positive predictions number of a class. Furthermore,
refers to false negatives: the incorrect negative predictions number of a class.
The Tweet dataset collected from the open source comprised about 396,452 tweets, which were shuffled for the classification process. We split the data into 80% for training phase and 20% for the testing phase, as an input for the machine learning algorithms. Many researchers have followed this partition of datasets, such as Ben Jabeur et al. [
57] and Antunes et al. [
58]. Another method proposed by Gholamy et al. [
59] proves that we obtain better results when the data is split in 20–30% for testing, and 70–80% of the remaining data for training.
Before applying any algorithms, we observed that our dataset was imbalanced, thus we applied the synthetic minority oversample technique (SMOTE) algorithm proposed by Farquad and Bose [
60] to generate the synthetic samples for the class with minor number. This method overcomes the overfitting problem due to random oversampling.
4.1. Machine Learning Algorithms with Simple Feature Extraction Methods
We trained the traditional classifiers and deep learning algorithm using uni-gram and N-gram TF-IDF feature representations. We also report the results based on Word2Vec, FastText, and Glove embedding methods.
Table 1 shows the accuracy, AUCC score, precision, recall, and F1-score results of the traditional classifiers for word-level and N-gram TF-IDF feature representations. The SVM classifier with uni-gram feature representations outperformed the other algorithms with the best accuracy of 85.44%, AUCC score of 96.04%, and F-score of 0.85. SVM also outperformed all algorithms when the TF-IDF was based on N-gram, the highest performance reached 85.2% accuracy, 95.7% AUCC score, and 0.85 for F-score. RF also achieved high performance after SVM, with 81.32% accuracy and 93.38% AUCC score, while NB achieved the lowest accuracy in both word embedding methods, with 54.3% accuracy in uni-gram TF-IDF and 53.12% with N-gram level.
All the classifiers achieved slightly high performance when using TF-IDF uni-gram compared with the N-gram technique, except for XGBoost, while the best performance was achieved with the N-gram method with 80.11% accuracy and 92.98% AUCC score.
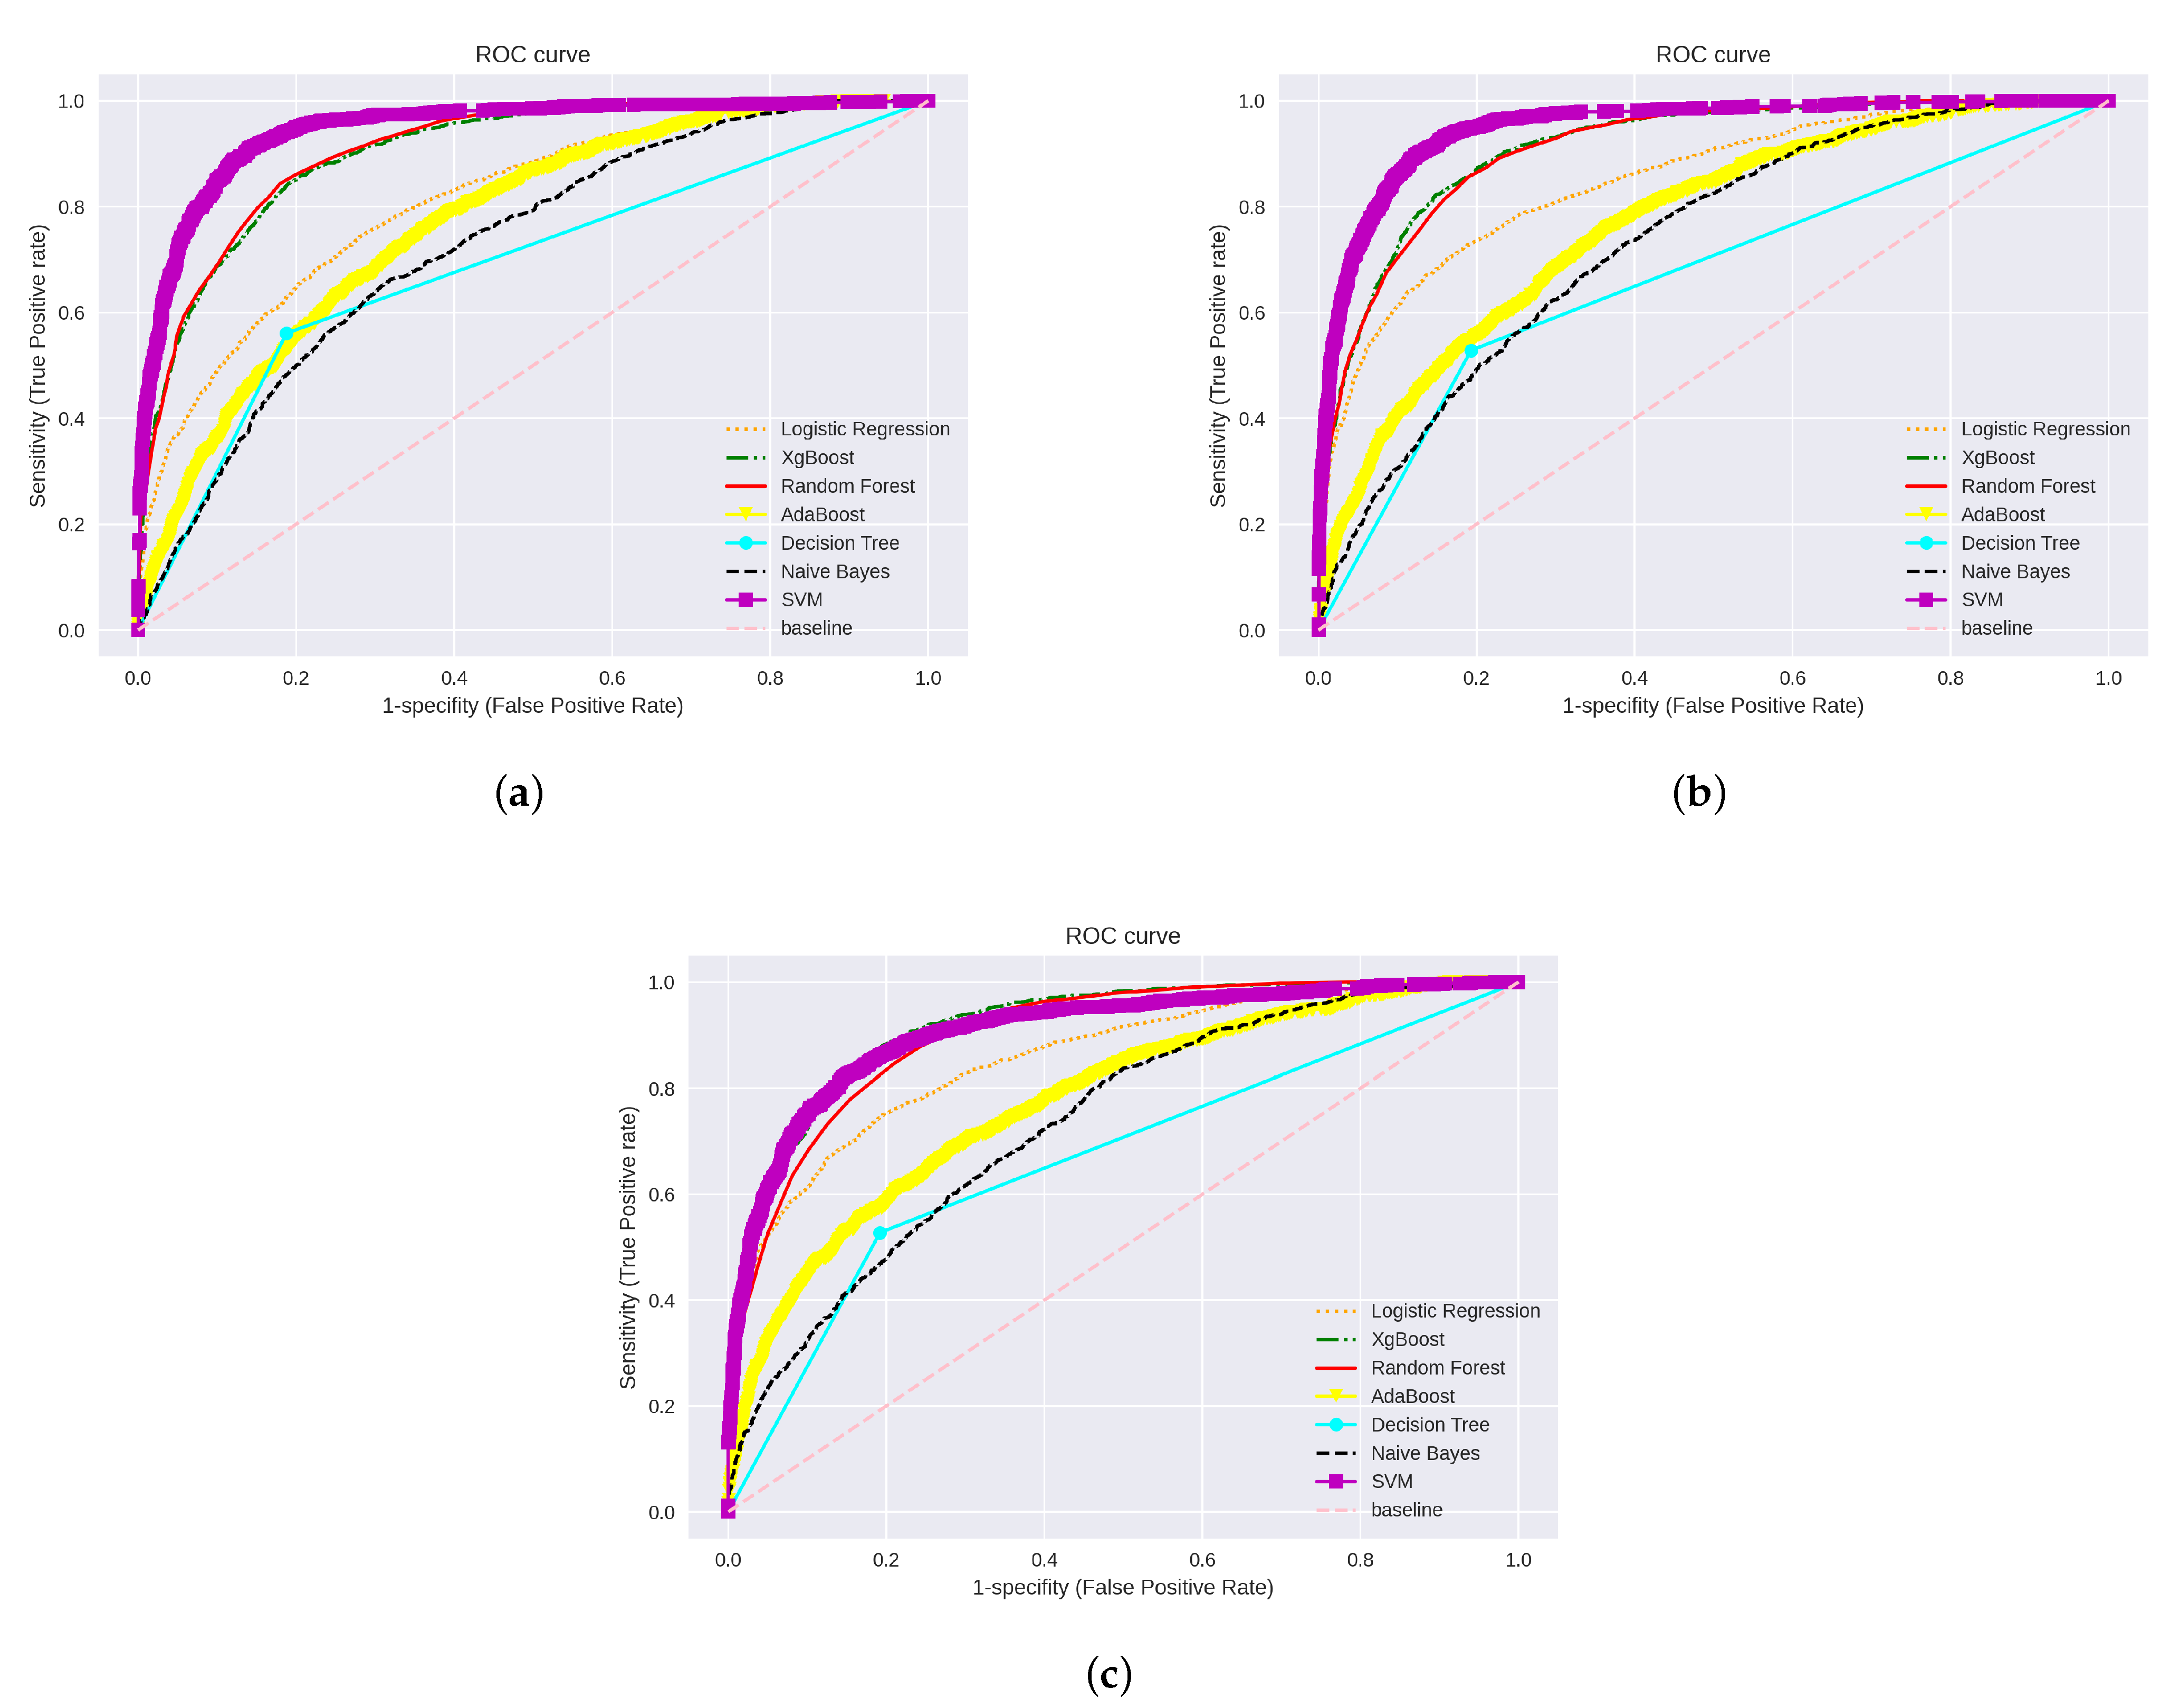
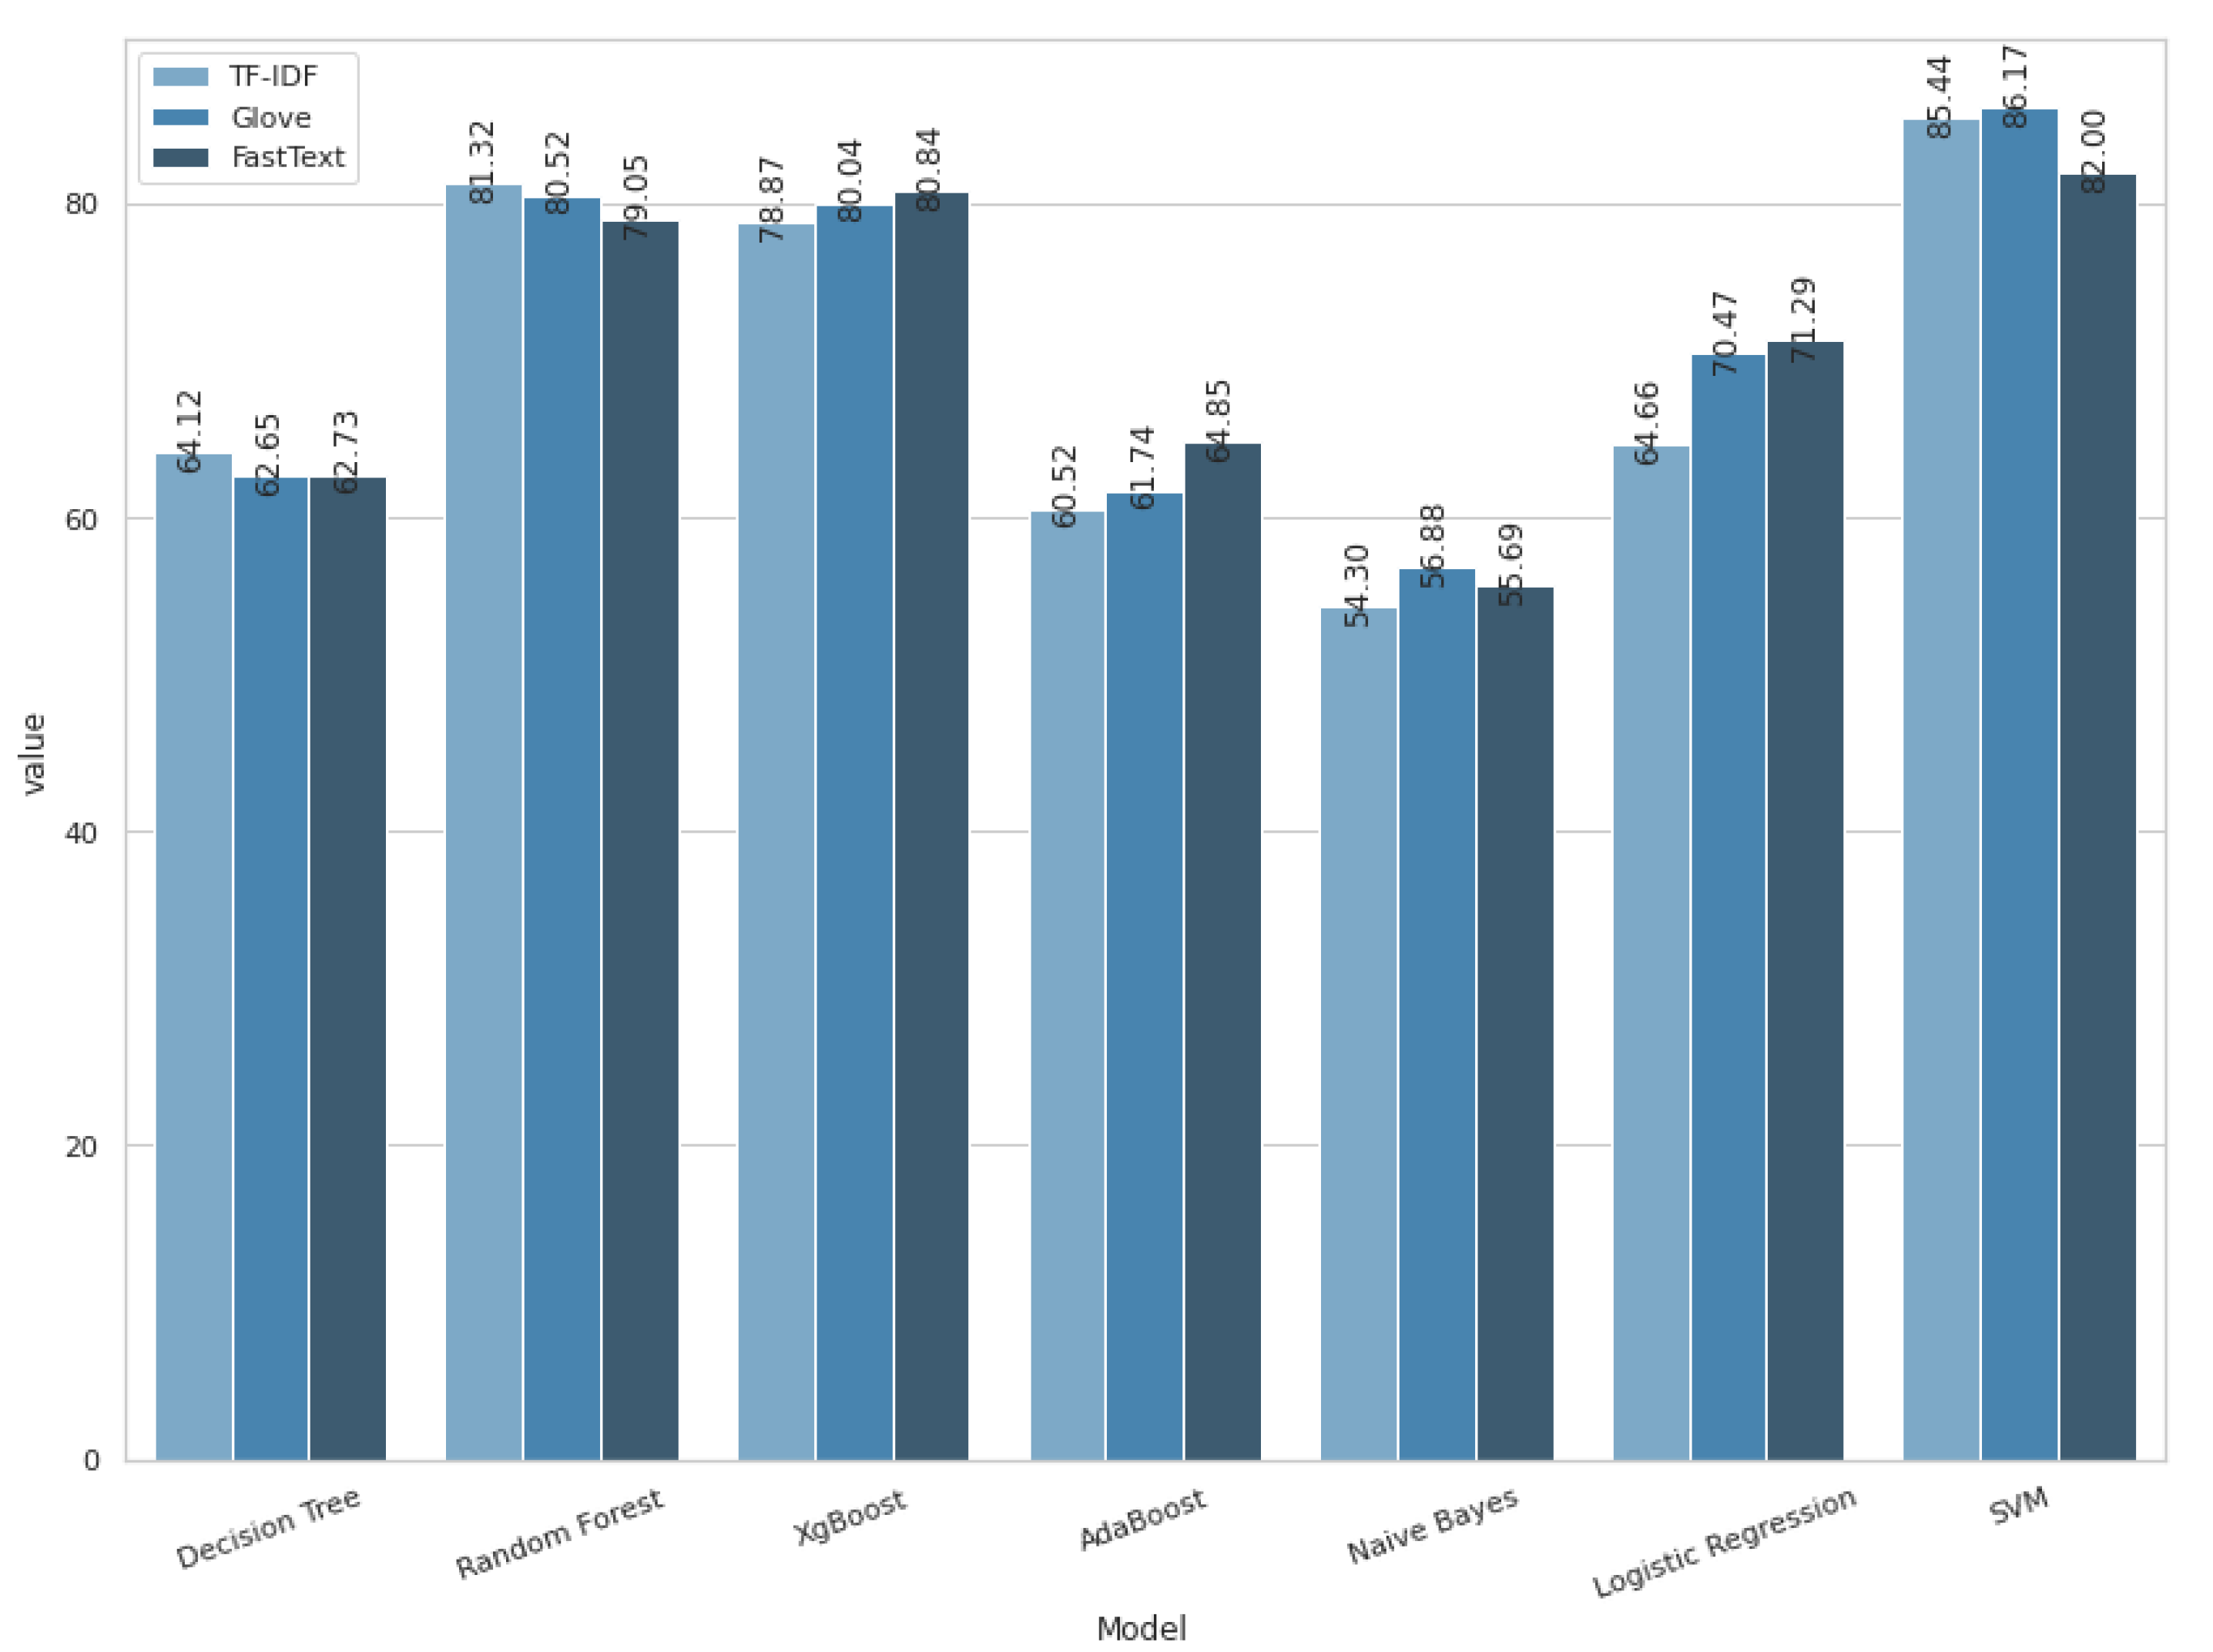
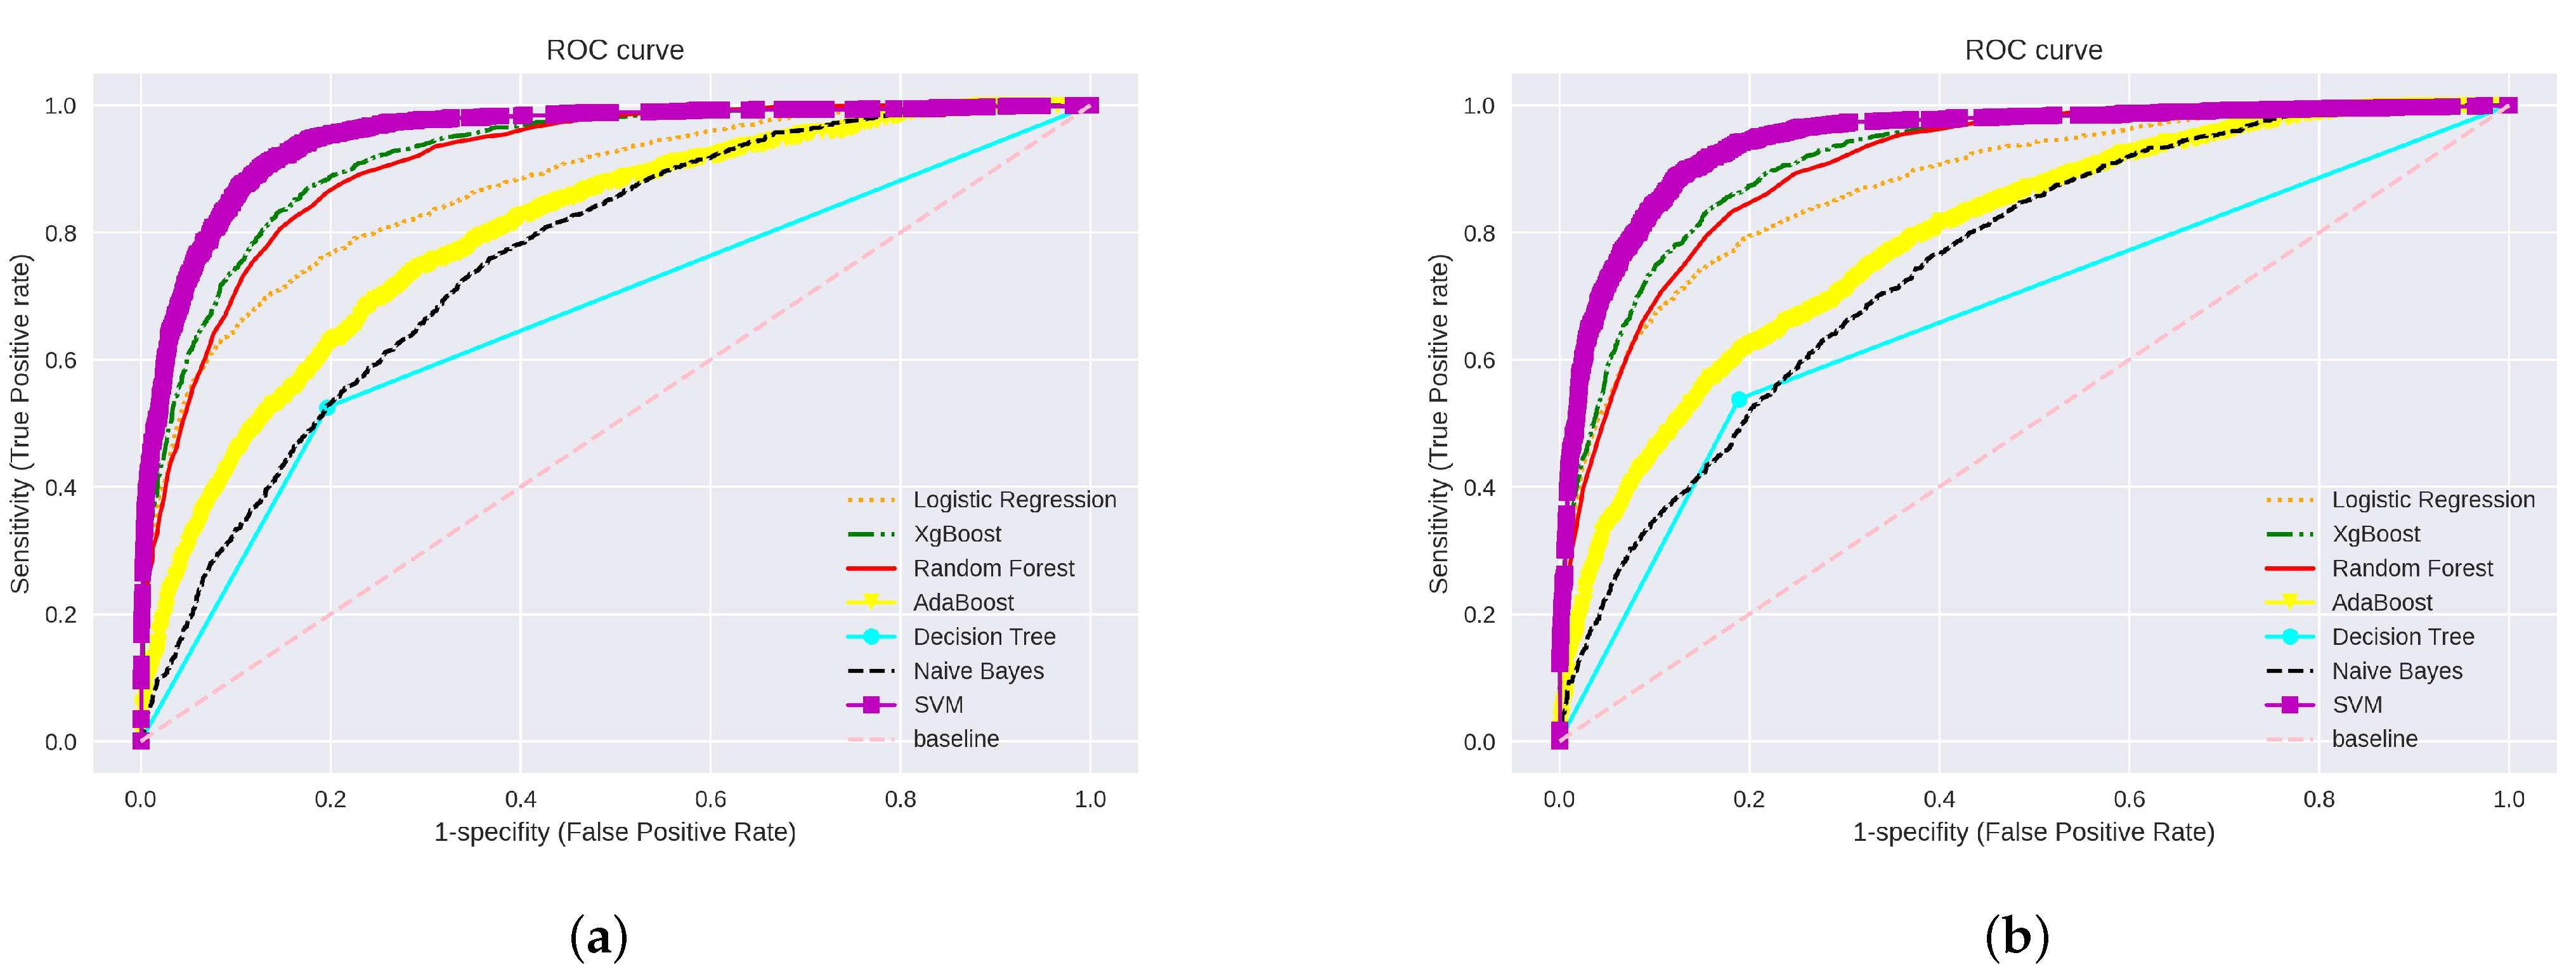
Figure 6 illustrates the ROC curve and the accuracy of word-level TF-IDF, Glove, and FastText.
Table 2 shows the evaluation results of the traditional classifiers for Word2Vec, Glove, and FastText feature embedding. The experimental results show that the AUCC and F1-score slightly increase for NB, AdaBoost, and LR with Word2Vec compared with TF-IDF, while it decreases with FastText, when compared with Word2Vec.
With Word2Vec, the best accuracy achieved was by LR, compared with the rest of the classifiers, with 74.09% accuracy and 0.72 F-score, while NB performed with the lowest accuracy of 58%. FastText and Glove performances were better with classification except for NB, LR, and Adaboost, which performed worse than the other classifiers. SVM achieved a higher performance in both techniques, FastText and Glove, in which it achieved 86.17% and 82% with Glove and FastText, respectively. However, NB achieved the lowest accuracy with 56.88% and 55.69% accuracy for Glove and FastText methods, respectively. With Glove, the second-best classifier was RF with 80.52%, while the third-best classifier was XGBoost, with 80.04%. However, the XGBoost classifier outperformed RF with FastText, where it achieved 80.84%, while RF performance was 79.05%. We can deduce that the model that achieved the highest performance with the TF-IDF, Glove, and FastText was SVM.
Figure 6 shows the ROC curve generated by the traditional classifiers using TF-IDF, Glove, and FastText. A visualisation of the accuracy for each ML methods using TF-IDF, Glove, and FastText is shown in
Figure 7.
We trained the deep learning classifier CNN using the Adam optimiser to learn the model parameters. We reported the results with the four pre-trained word embedding methods.
Table 3 shows the accuracy, AUCC, F1 measure, recall, and precision with the pre-trained word embedding. CNN achieved the highest accuracy with Glove, reaching a 79.83% score, while the lowest score was with FastText, with 73.59%. However, the highest AUCC score was achieved by TF-IDF uni-gram with 86.52% followed by Glove, with a close AUCC score of 82.18%. With the pre-trained TF-IDF uni-gram, Word2Vec, Glove, and FastText embedding, the performance increased. The CNN with Glove had the best improvement as it outperformed all other traditional classifiers with the best accuracy, F1-score, recall, and precision. The performance shows an improvement over the existing results.
4.2. Machine Learning Algorithms with Hybrid Feature Extraction Techniques
Through a final analysis, the highest performing techniques were chosen to optimise the classification phase, which was the objective of our proposed method. Where the word-level TF-IDF, Glove, and FastText have the best improvement with the classifiers, the TF-IDF N-gram showed the lowest performance, followed by Word2Vec. We choose to follow two experiments, first combining TF-IDF and Glove features and second combining TF-IDF and FastText with different classifiers aiming to obtain high performance from the machine learning methods. Almost all algorithms’ performances were improved with the hybrid methods.
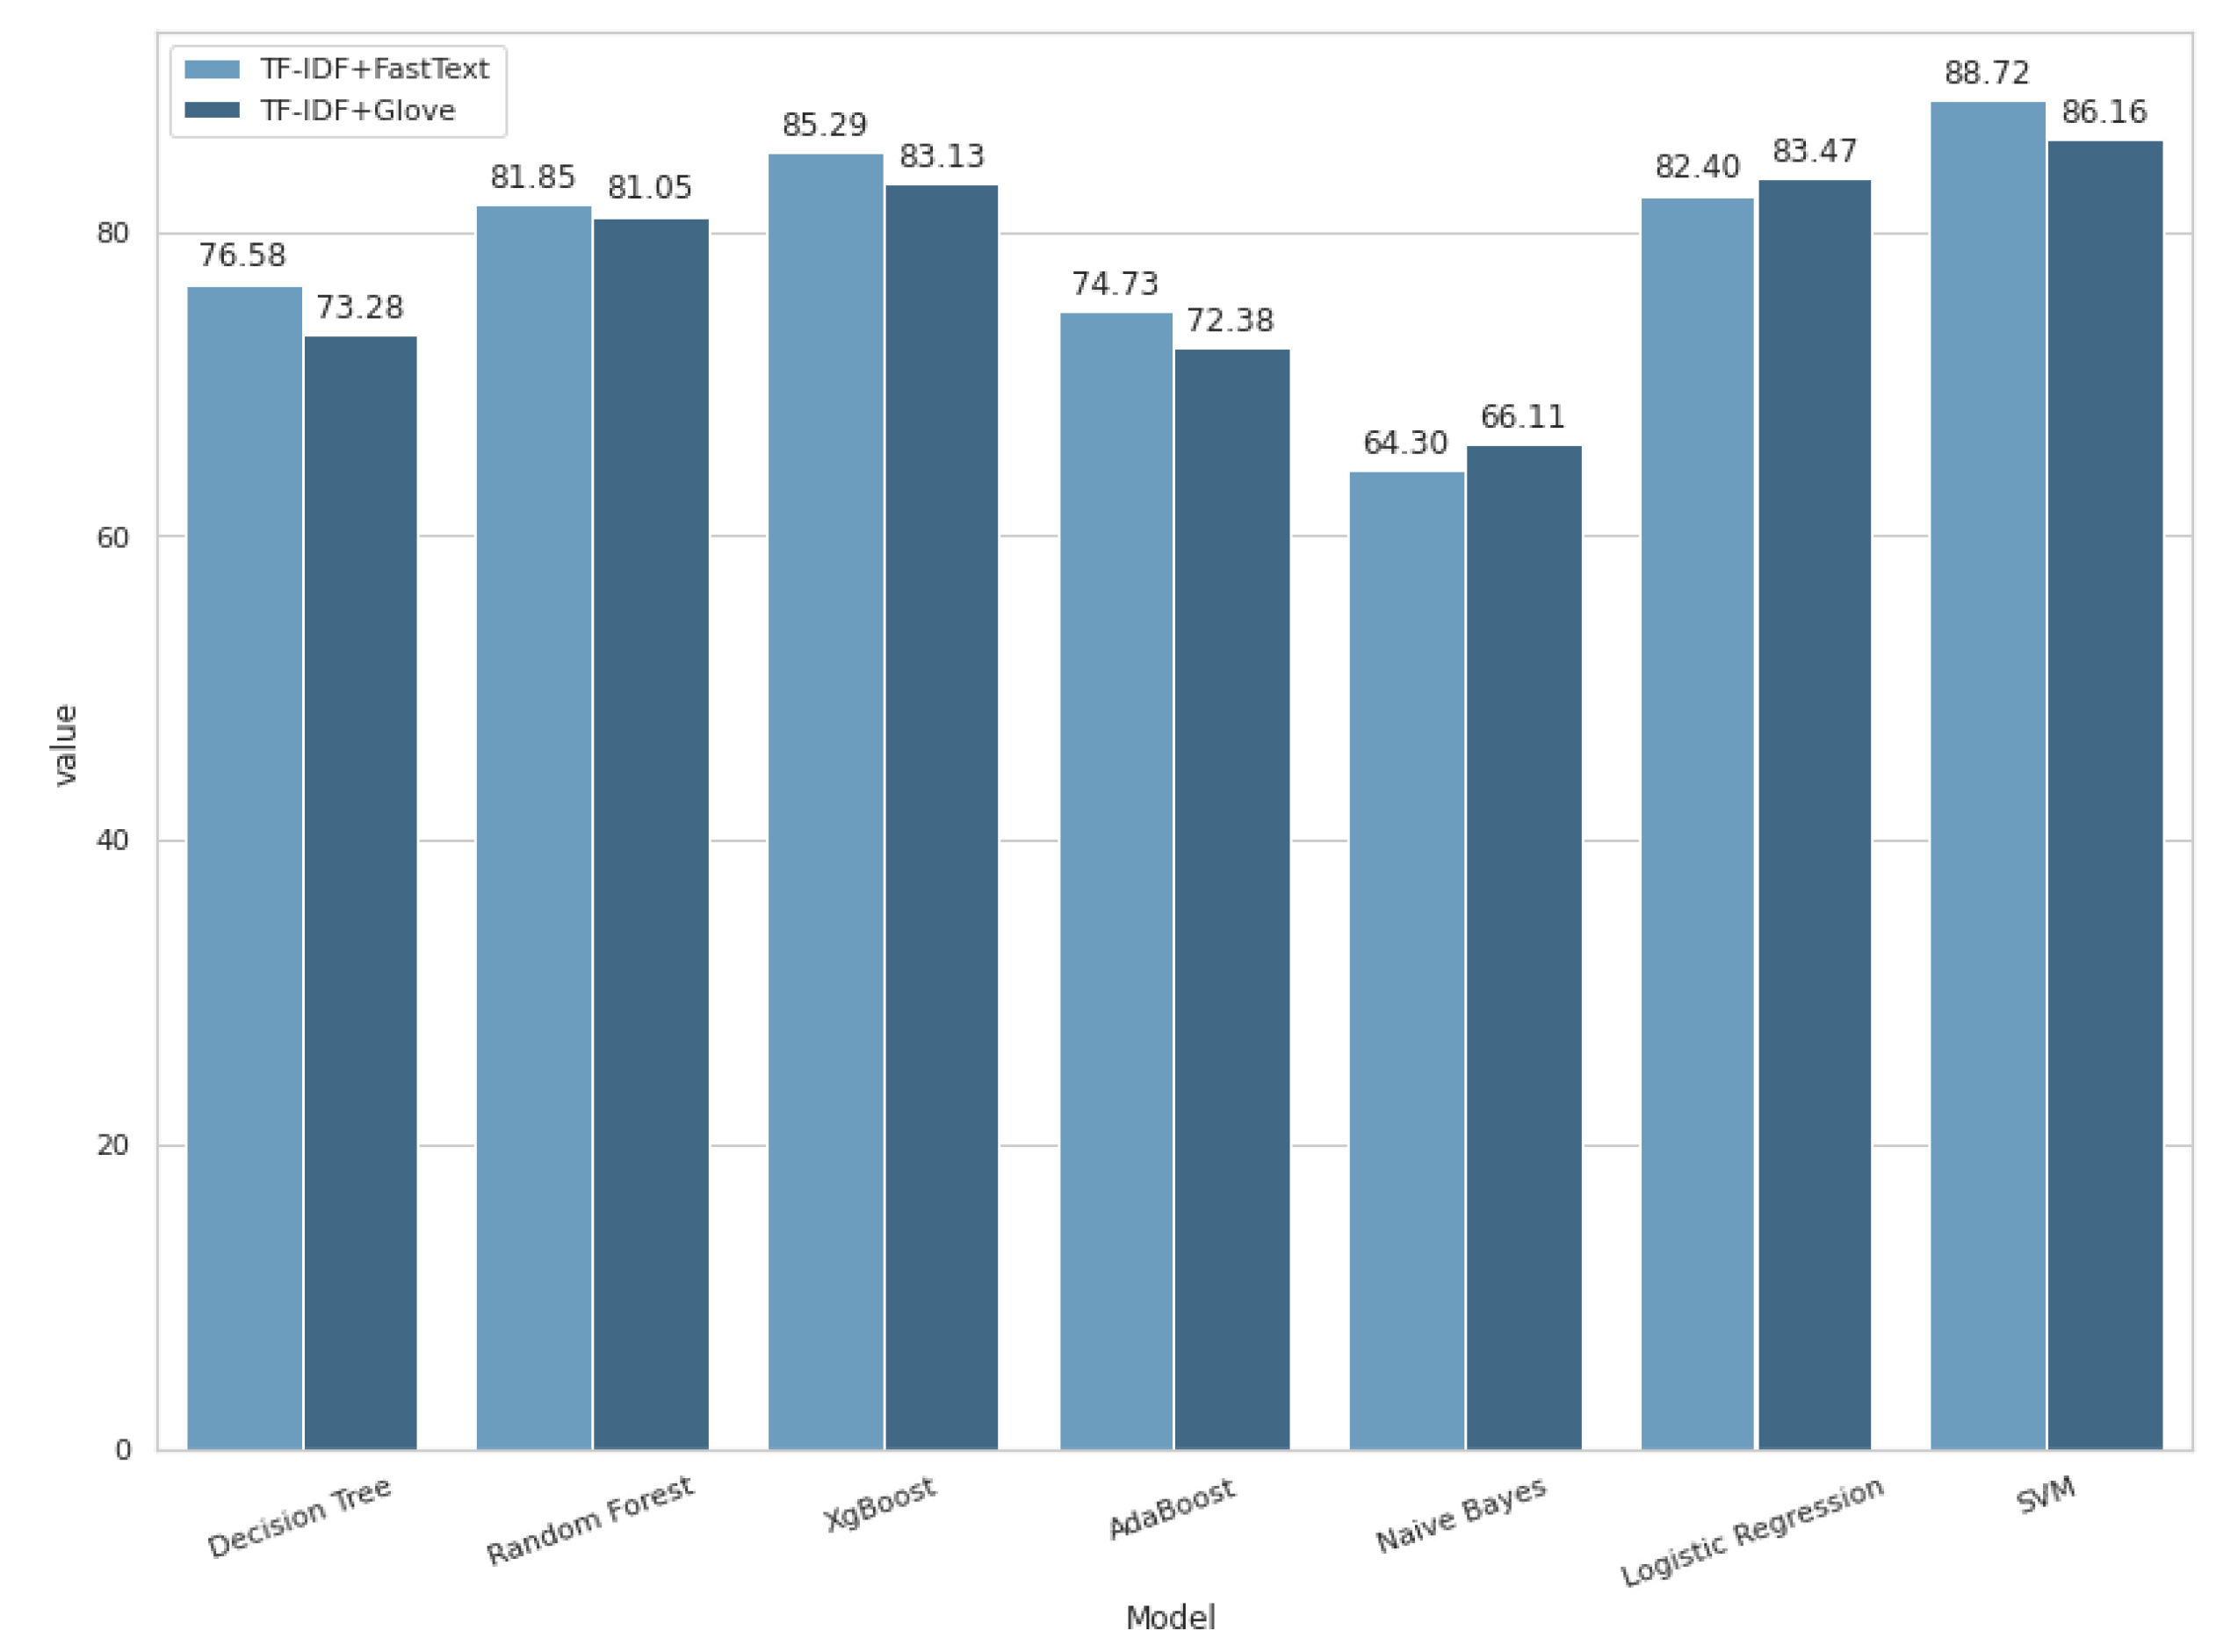
As shown in
Figure 8 and
Figure 9 and
Table 4, SVM accuracy increased to 88.72%, as well as for XGBoost, with 85.29% accuracy score, LR with 81.85%, and RF with 81.85%, when the input to the classifier was TF-IDF with FastText features. All the other classifiers also outperformed their previous results. Using the hybrid TF-IDF with Glove, the accuracy reached 86.16%, 83.47%, 83.13%, and 81.05% accuracy scores for SVM, LR, XGBoost, and RF, respectively. The results were enhanced because the feature set size increased with the hybrid features, so the model learnt from the newly established features and improved its accuracy. The predicted accuracy, AUCC, F1-score, precision, and recall metrics of each model can be observed in
Table 4. In a comparison between AUCC scores, we observed that the models showed better performances for hybrid TF-IDF and FastText (95.88%, 89.63% 87.74%, and 87.03%, on SVM, XGBoost, RF, and LR, respectively) compared with hybrid TF-IDF and Glove, with 96.42%, 88.72%, 88.58%, and 87.66% on SVM, LR, XGBoost, and RF, respectively. This was thanks to their capability to represent words vocabulary effectively, in comparison with other tested methods. Consequently, we can observe that the performance of both experiments is slightly close.
In
Table 5, the results of hybrid features with previous methods are illustrated and a comparison is presented, to show the significance of this study. We observe that our hybrid method provides an AUCC score higher than other state-of-the-art methods based on traditional and DL methods, with over 10%, and accuracy over 2%. Our proposal has achieved better classification evaluation results compared with other learning models.
5. Discussion
To build a classification model with better accuracy and efficiency, features extraction and supervised machine learning methods were evaluated. In this research, we performed sentiment analysis on the ongoing COVID-19 pandemic. Accordingly, different textual analytic visualisation plots were employed to better understand the data. Sentiment analysis mostly helps to analyse people’s feelings in a specific event. First, analysis was conducted to categorise the dataset into three different categories (neutral, positive, and negative) using the library python NLTK. It was observed that the dataset was imbalanced and the performance of the methods was biased towards the majority class (positive), thus we used the SMOTE algorithm to generate the synthetic samples for the minority class. This algorithm helps to overcome the overfitting problem posed by random oversampling. The second analysis phase was based on feature extraction and word embedding; therefore, this step was crucial to enhance classification accuracy. Word embedding is the representation and transformation of the words semantically and syntactically within a document as real-valued vectors before feeding them to the model. TF-IDF, Word2Vec, Glove, and FastText were applied. In order to enhance the classification models, we obtained the best of both worlds: using TF-IDF as a first method to weigh how much each token contributes to the sentence embedding, and Glove word presentation using matrix factorisation techniques; as a second method, we used TF-IDF with FastText to represent each word as an n-gram of characters. Both features are considered to complement each other in representing the tweets. The extensive experiments with different methods evaluation measures suggests that SVM model has performed significantly better compared with other supervised and neural models with different word embedding techniques. Moreover, the proposed method to combine the two-word embedding helped in increasing the accuracy and AUCC score for most of machine learning algorithms. In these the best performance was achieved by TF-IDF, weighted with FastText, fed into the SVM, with 88.72% accuracy, against the lowest accuracy which was achieved by NB when the feature embedding was the TF-IDF N-gram model (where the accuracy was 53.12%). The key difference between Word2Vec and FastText was that, during the learning phase, FastText presented each word as a group of n-grams characters, while Word2Vec considered words as the smallest unit. As shown by the results, all classifiers performed better with the help of pre-trained embedding. Overall, the available machine learning methods can deliver a high performance compared with deep learning. Accordingly, traditional classifiers have better performances, with higher AUCC values.


