Review

Classification and Recognition of Lung Sounds Using Artificial Intelligence and Machine Learning: A Literature Review

iCONS Lab, Department of Electrical Engineering, University of South Florida, 4202 E. Fowler Avenue, Tampa, FL 33620, USA
*
Author to whom correspondence should be addressed.
Big Data Cogn. Comput. 2024, 8(10), 127; https://doi.org/10.3390/bdcc8100127
Submission received: 5 July 2024 / Revised: 21 August 2024 / Accepted: 13 September 2024 / Published: 1 October 2024

Abstract

:
This review explores the latest advances in artificial intelligence (AI) and machine learning (ML) for the identification and classification of lung sounds. The article provides a historical overview from the invention of the electronic stethoscope to the auscultation of lung sounds, emphasizing the importance of the rapid diagnosis of lung diseases in the post-COVID-19 era. The review classifies lung sounds, including wheezes and stridors, and explores their pathological relevance. In addition, the article deeply explores feature extraction strategies, measurement methods, and multiple advanced machine learning models for classification, such as deep residual networks (ResNets), convolutional neural networks combined with long short-term memory networks (CNN–LSTM), and transformer models (transformer). The article discusses the problems of insufficient data and replicating human expert experience and proposes future research directions, including improved data utilization, enhanced feature extraction, and classification using spectrograms. Finally, the article emphasizes the expanding role of AI and ML in lung sound diagnosis and their potential for further development in this field.

1. Introduction

Lung sounds are produced by changes in airflow movement caused by the anatomy of the human respiratory system while breathing, which forms vortices or turbulent flows and generates sound waves. The sound waves propagate through the lung tissue and chest wall in the form of solid vibrations to the surface of the chest wall and are collected by the doctor performing auscultation, which is known as lung sound [1]. However, the lung sounds themselves vary greatly. Lung sounds alterations occur as a result of factors such as airflow, body position, and the presence or absence of secretions. Although lung sounds are very complex and include weak signals that interfere with heart and digestive tract sounds, they contain a wealth of physiological and pathological information that has long been used by clinicians to assess a patient’s state [2].
The detection methods of lung sound signals have been regularly updated in recent years as acoustics and computer technologies have evolved, particularly with the widespread usage of artificial intelligence (AI) and machine learning (ML) [3]. After collecting lung sound samples, they are amplified and filtered to remove interference generated by factors such as airflow, volume, residual volume, body posture, secretions, heart sounds, and muscle contraction noises. The samples are then captured at a specific frequency and the audio sound signal in the time domain and frequency domain are analyzed to acquire reasonable objective decision results.
The origin of lung sound auscultation can be traced back to around 1500 BC, when lung noises, also known as breath sounds, were first observed as a natural physiological phenomenon. However, it was not until the 19th century, when modern medicine began to develop, that lung sound auscultation gained popularity as an important approach for identifying respiratory disorders. In 1761, German doctor Leopold Auenbrugger listened to a patient’s breathing sounds and determined the diseased state of the patient’s lungs [4]. It was not until 1816, when French doctor René-Théophile-Hyacinthe Laennec devised the wooden stethoscope, that lung sound auscultation began to be adopted professionally on a wider scale [4].
As environmental issues including frequent cloudy weather, smog, and air pollution have gotten worse, the frequency of respiratory ailments has increased recently. Rapid diagnostic methods are in greater demand due to the COVID-19 pandemic-related shortage of medical workers, as well as the requirement for the accurate and timely identification of lung illnesses. The advantages and possibilities of employing machine learning and signal processing for a quick and easy diagnostic method to identify and categorize lung diseases are driving more and more research and development efforts in this area.
Lung sounds are the noises made by the respiratory system when air moves through it, as seen in Figure 1. In healthy individuals, doctors can distinguish between three different types of lung sounds, namely bronchial, bronchoalveolar, and alveolar breath sounds. These typical breath sounds offer a standard by which anomalous sounds can be distinguished. The most common categories of abnormal lung sounds are rhonchus, wheeze, coarse crackle, and thin crackle [5]. Patients who suffer from bronchitis or chronic obstructive lung disease [6] (COPD) frequently experience rhonchus, a low-pitched sonorous sound [7]. Mucus or secretions in the airways vibrate and produce it. Patients with asthma or bronchoconstriction frequently wheeze, which is a high-pitched whistling sound [5,6]. Increased airflow resistance and constricted airways are the causes of this. A low-pitched popping or crackling sound known as a coarse crackle is frequently heard in bronchiectasis or pneumonia patients [8]. The lungs’ opening and closing of air passages is the cause of this. Those suffering from atelectasis or interstitial lung disease may experience a high-pitched delicate or mild cracking sound known as “thin crackle”. It is brought on by fluid moving through the lungs’ air passages. These four lung sounds can give doctors vital diagnostic information, as they are suggestive of various illnesses. The classification of these four common abnormal lung sounds is shown in Table 1.
Examples of typical signal waveforms for normal and various abnormal lung sounds mentioned in Table 1 are shown in Figure 2. These waveforms illustrate the temporal variations in breath sounds associated with different lung conditions. The subfigures, arranged from left to right and top to bottom, depict lung sounds for the following conditions: healthy (normal), asthma, upper respiratory tract infection (URTI), pneumonia, chronic obstructive pulmonary disease (COPD), and bronchiectasis.
Figure 2a shows the waveform representing a normal lung sound. It is relatively stable with small amplitude fluctuations, indicating uniform breath sounds without noticeable abnormalities. The amplitude ranges between −0.1 and 0.1. Figure 2b represents the lung sound for pneumonia. Smaller amplitudes characterize the waveform but it features distinct peaks at certain intervals, indicating abnormal breath sounds. The amplitude ranges between −0.2 and 0.2, with peaks up to 0.2. Figure 2c represents the lung sound for asthma. This waveform exhibits significantly larger amplitudes with pronounced peaks at certain points, suggesting the presence of wheezing. The amplitude varies between −1 and 1, with peaks approaching 1. Figure 2d represents the lung sound for chronic obstructive pulmonary disease (COPD). This waveform has large amplitudes with significant peaks, reflecting a high variability in breathing. The amplitude fluctuates between −0.5 and 0.5, with peaks exceeding 0.5. Figure 2e represents the lung sound for upper respiratory tract infection (URTI). Although the amplitude is larger, the waveform is relatively uniform and without prominent peaks. The amplitude fluctuates between −0.2 and 0.4. Figure 2f represents the lung sound for bronchiectasis. The waveform is characterized by small uniform amplitudes with subtle fluctuations, suggesting minor abnormalities in breath sounds. The amplitude ranges between −0.025 and 0.05.
These audio signals were recorded at a sampling rate of 22 kHz over 20 s, resulting in 441,000 data points per signal. Each data point represents the audio amplitude at a specific moment. These waveform graphs visually highlight the differences in breath sounds across various lung diseases and healthy conditions, providing a critical basis for disease classification and diagnosis.
Lung sounds are generally monitored by clinicians using stethoscopes, which can be grouped into three basic types, namely acoustic, magnetic, and electronic. Now, the method of collecting lung sounds is mostly reliant on an electronic stethoscope, such as the Electronic Stethoscope Model 3200 developed by 3M Littmann, Inc., St. Paul, MN, USA. An electronic stethoscope converts an acoustic sound wave obtained through the chest piece into an electrical signal, which is then amplified and processed for optimal hearing. It is based on the same basic principle as an acoustic stethoscope. Electronic stethoscopes with computer-aided auscultation applications are also available for analyzing recorded cardiac sounds for pathogenic or harmless heart murmurs. In practice, it is challenging to meet the increased demand for the quick diagnosis of lung disorders using just manual auscultation with an auscultator. It is possible to make this process more quantitative and automated. With the continual development of machine learning algorithms and a plethora of applications in practice, the concept of machine learning, which has been demonstrated to be a successful technology, is constantly expanding into new domains. Many researchers have become interested in computerized lung sound analysis in recent years. Computerized lung sound signal processing based on connected neural network (CNN) machine learning technology, as demonstrated by Hershey et al. [9], is unquestionably more advanced in lung sound research.
The first section of the article briefly introduces the research significance and background of the classification and identification of different diseases based on lung sounds, as well as the development context; the second section provides a brief analysis of the current database; the third section extracts and analyzes the features of lung sounds and summarizes the machine learning method; and finally, the research and development of lung sound diagnosis technology are summarized.

2. Methodology Overview

So, what are lung sound recognition and lung sound classification processes? Lung sound recognition is the process of using algorithms to automatically detect and identify specific lung sound patterns from recorded breathing sounds, such as abnormal sounds like wheezing and stridor. This includes sound detection, feature extraction, and pattern recognition. Lung sound classification classifies the identified lung sounds by type (normal, abnormal, or specific disease-related sounds) using machine learning [10,11,12,13,14,15,16,17,18,19,20,21,22,23,24,25,26,27,28,29,30,31,32,33,34,35,36,37,38,39,40,41,42,43,44,45] algorithms to provide an accurate diagnosis and to help doctors understand the patient’s respiratory status.
The main difference between the two is as follows. Recognition is the detection of the presence of lung sounds and classification further subdivides the categories of these sounds. Recognition is a pre-step to classification. Recognition focuses on detecting sound features and classification focuses on diagnostic category attribution. Lung sound recognition and classification are usually continuous processes, with recognition as the basis and classification used for further analysis and application.
Usually, we preprocess the sound data collected from the lungs, extract features, and put them into the model of our choice. Afterward, classification results are obtained; typically, the output comprises different types of lung sound disease. The process is shown in Figure 3.
This study summarizes the various lung sound measurement methods and lung sound classification methods used or proposed by researchers in the past five years and combines a variety of feature extraction methods and models to study the most accurate and effective lung sound classification methods. To ensure the quality and breadth of the review articles, we adopted a rigorous literature screening process. First, we defined the time range of the literature search (for example, 2020 to 2024) and selected the following databases for the literature search: Google Scholar, IEEE Xplore, SpringerLink, ScienceDirect, etc. We used Boolean logic and keywords related to the research topic for retrieval, such as (“machine learning” or “artificial intelligence” or “deep learning” or “data science”) and (“lung sound” or lung* or sound*) and (classification or recognition or diagnosis).
After the initial search, we conducted a first round of screening of the retrieved articles and excluded the literature that were not related to the topic. Subsequently, we conducted further screening according to the following criteria:
  • The article must be published in a highly cited and recognized academic journal or conference, such as IEEE, Springer, ScienceDirect, etc.
  • The article must have a clear methodology, experimental results, and conclusions.
  • Priority is given to articles published within the past five years to ensure the timeliness of the review.
In addition, we also considered the number of citations of the literature and gave priority to articles with higher citations for analysis and discussion. Through this series of screening processes, we ensured the quality of the literature and the depth of the research, providing solid academic support for the argumentation and analysis of this article. In addition, the lung sound types, datasets, feature extraction methods, and machine classification models in each paper are summarized, as shown in Table 2, Table 3 and Table 4.

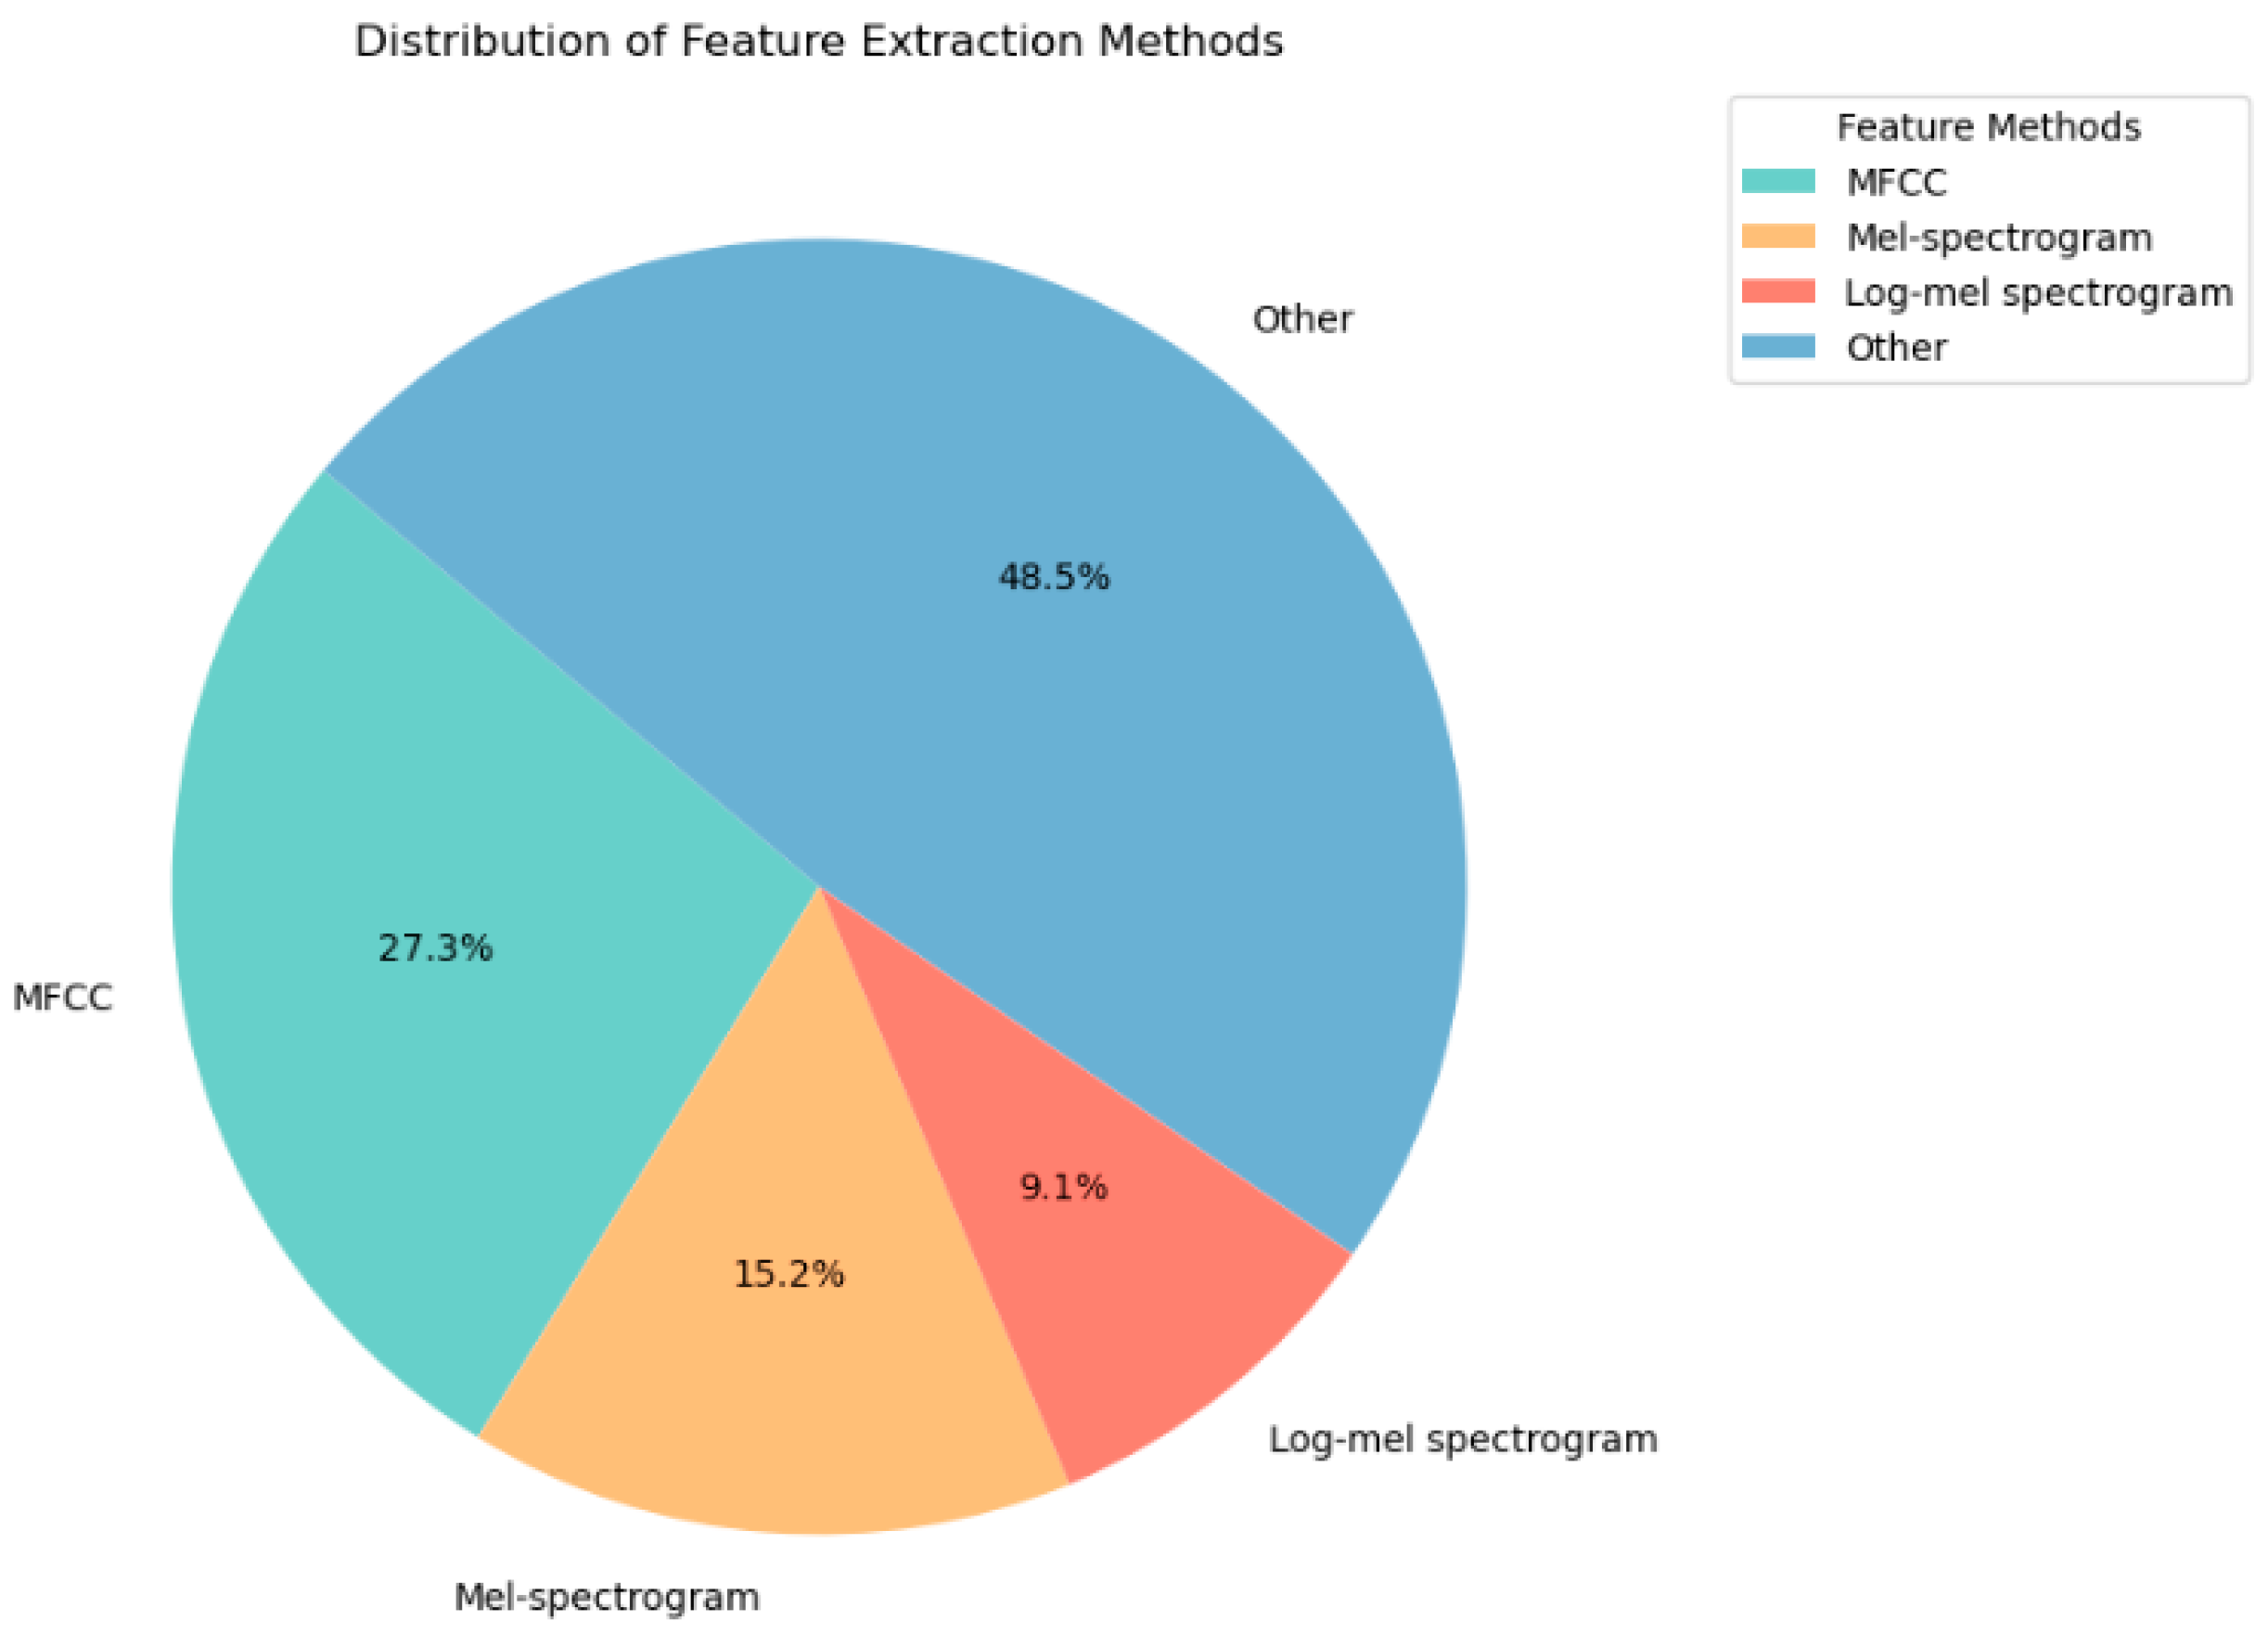
2.1. Feature Extraction Methods for Lung Sounds

Feature extraction plays a pivotal role in lung sound analysis by capturing distinct frequency spectrum variations in different diseases, facilitating disease identification and diagnosis. By simplifying and quantifying complex audio signals, feature extraction enhances the accuracy of machine learning models in processing and classifying data. Additionally, it significantly reduces the dimensionality of large and complex original audio signal data, thereby decreasing computational complexity and improving processing efficiency. Furthermore, feature extraction helps pinpoint critical parts of the audio signal for classification tasks, thus enhancing the model’s interpretability.
To gain a more intuitive understanding of the feature extraction of lung sounds, 6 different lung sounds were selected from the most commonly used ICBHI 2017 dataset [41] for demonstration. The Figure 4 spectrogram shows the energy distribution of audio signals in different lung conditions in the time and frequency domains. Each graph has a duration of 20 s, ranging from healthy to various abnormal conditions (pneumonia, asthma, COPD, URTI, bronchiectasis). The time–frequency spectrogram plot provides a better characterization of the lung sounds in different diseases than temporal waveforms. Here are the details of each spectrogram. From Figure 4a (healthy), the frequency distribution is relatively uniform, the energy at low frequencies (below 128 Hz) is higher, and the energy at mid- and high-frequency parts gradually weakens. Healthy lung sounds are generally relatively smooth, with no obvious high-energy concentration areas, reflecting normal breathing sounds. Figure 4b (pneumonia) shows that the energy in the low-frequency band (64–256 Hz) is higher and the energy decreases as the frequency gradually increases. Some abnormal low-frequency features may appear in the respiratory frequency spectrum of patients with pneumonia, which may be caused by lung inflammation. Figure 4c represents the lung sound for asthma. The low-frequency band and mid-frequency band (128–512 Hz) have a higher energy and the energy weakens rapidly as the frequency increases. The respiratory frequency spectrum of patients with asthma may contain wheezing sounds and other abnormal features, reflecting airway obstruction. As shown in Figure 4d (COPD), there are obvious corrugated high-energy areas in the spectrum, with higher energy in the low-frequency and mid-frequency bands. Obvious abnormal ripples appear in the respiratory frequency spectrum of COPD patients, which may be caused by airway obstruction and alveolar rupture. Figure 4e depicts URTI’s spectrograms, where the energy in the low-frequency and mid-frequency bands is higher and the energy decreases as the frequency increases. The respiratory frequency spectrum of patients with upper respiratory tract infection may contain some low-frequency features, reflecting the impact of infection on the respiratory tract. The last figure, Figure 4f, represents bronchiectasis. There are clear high-energy regions in the spectrum, especially in the low- and mid-frequency bands. The respiratory frequency spectrum of patients with bronchiectasis has obvious abnormal high-energy areas, reflecting the dilation of the bronchi and the accumulation of secretions.
Nowadays, researchers choose different ways to obtain features from lung sounds depending on the research method they use. There are many feature extraction methods currently used. Choosing the correct method based on the characteristics of various diseases can help the model to identify and classify better. To characterize lung sounds, the sound waveform is converted into a parametric representation at relatively low data rates for future processing and analysis. Consequently, the acceptable classification is formed from the high−grade qualities of sound. Mel-frequency cepstral coefficients (MFCCs) [12,15,18,19,21,23,30,39,43,45], short-time Fourier transform (STFT) [26,28], and wavelet transform (WT) [12,31,35] are prevalent feature extraction methods. Also, some researchers use discrete wavelet transform [36,40] as a method to extract features. These approaches have been tried in a wide variety of applications, making them extremely trustworthy and accepted. The researchers modified the procedures to make them more noise-resistant, durable, and time-efficient. In conclusion, neither way is superior to the other, and the application’s scope will determine which method is selected. Other techniques include power spectral density (PSD) [14], the Mel frequency coefficient [16,22], and the logarithmic Mel frequency coefficient [10,25,37].
As shown in Figure 5, the wavelet method has been widely used. The MFCC has gradually become the method with the most significant increase in usage over time, represented by the large green area. This approach shows a significant spike in usage starting around the end of 2019, peaking in 2020, remaining somewhat stable in 2021, then growing significantly again in 2022 before declining slightly in 2023. As research increases, more different feature extraction methods are tried, making the methods more diverse. The pie chart in Figure 6 shows the overall distribution of feature extraction methods in the dataset. The “Other” category represented 46.9% of the total, with less frequently used methods compared to MFCCs (28.1%), Mel spectra (15.6%), and log-Mel spectra (9.4%). This suggests that less commonly used methods with high diversity can improve the final accuracy for specific tasks, while a few methods such as MFCCs and Mel spectroscopy are more commonly used, suggesting that they may be more standard or efficient for the task at hand.
Pham et al. [38] state that the process begins by converting respiratory cycles or full audio recordings into spectrogram visuals. These spectrograms are then segmented into uniform image sections, and a technique known as mix-up data augmentation is utilized during the training phase. Four distinct types of spectrograms are analyzed, the log-Mel spectrogram [47], the Gammatone filter bank (Gamma) spectrogram [48], the stacked Mel-frequency cepstral coefficients (MFCCs), and the rectangular constant Q transform (CQT) spectrogram [47]. Among these, the Gamma spectrogram performs better in classifying anomalies in respiratory cycles, while the log-Mel spectrogram shows exceptional effectiveness in identifying respiratory diseases.
Empirical mode decomposition (EMD) [12] analysis is suitable for nonlinear and non-stationary signals. Unlike traditional signal analysis methods, it does not need to assume that the signal is linear or short-term stationary and does not use a fixed basis function to decompose the signal. Instead, it uses a specific signal method to decompose the signal to obtain the essential components of the signal. The application of EMD methods to breathe sound signals is a relatively new approach, which shows that EMD has broad application prospects in the field of medical signal processing.
There are some recently proposed feature analysis techniques, such as 3D–SODP (third order difference plot) [27], optimized S-transform (OST) [29], δ-cepstral coefficients in lower subspace (SDC-L) [31], and the Hilbert–Huang transform (HHT) [33]. However, there are still relatively few articles on the topic, and additional research and theoretical support are required before any of these can become the primary method for feature extraction in the future.

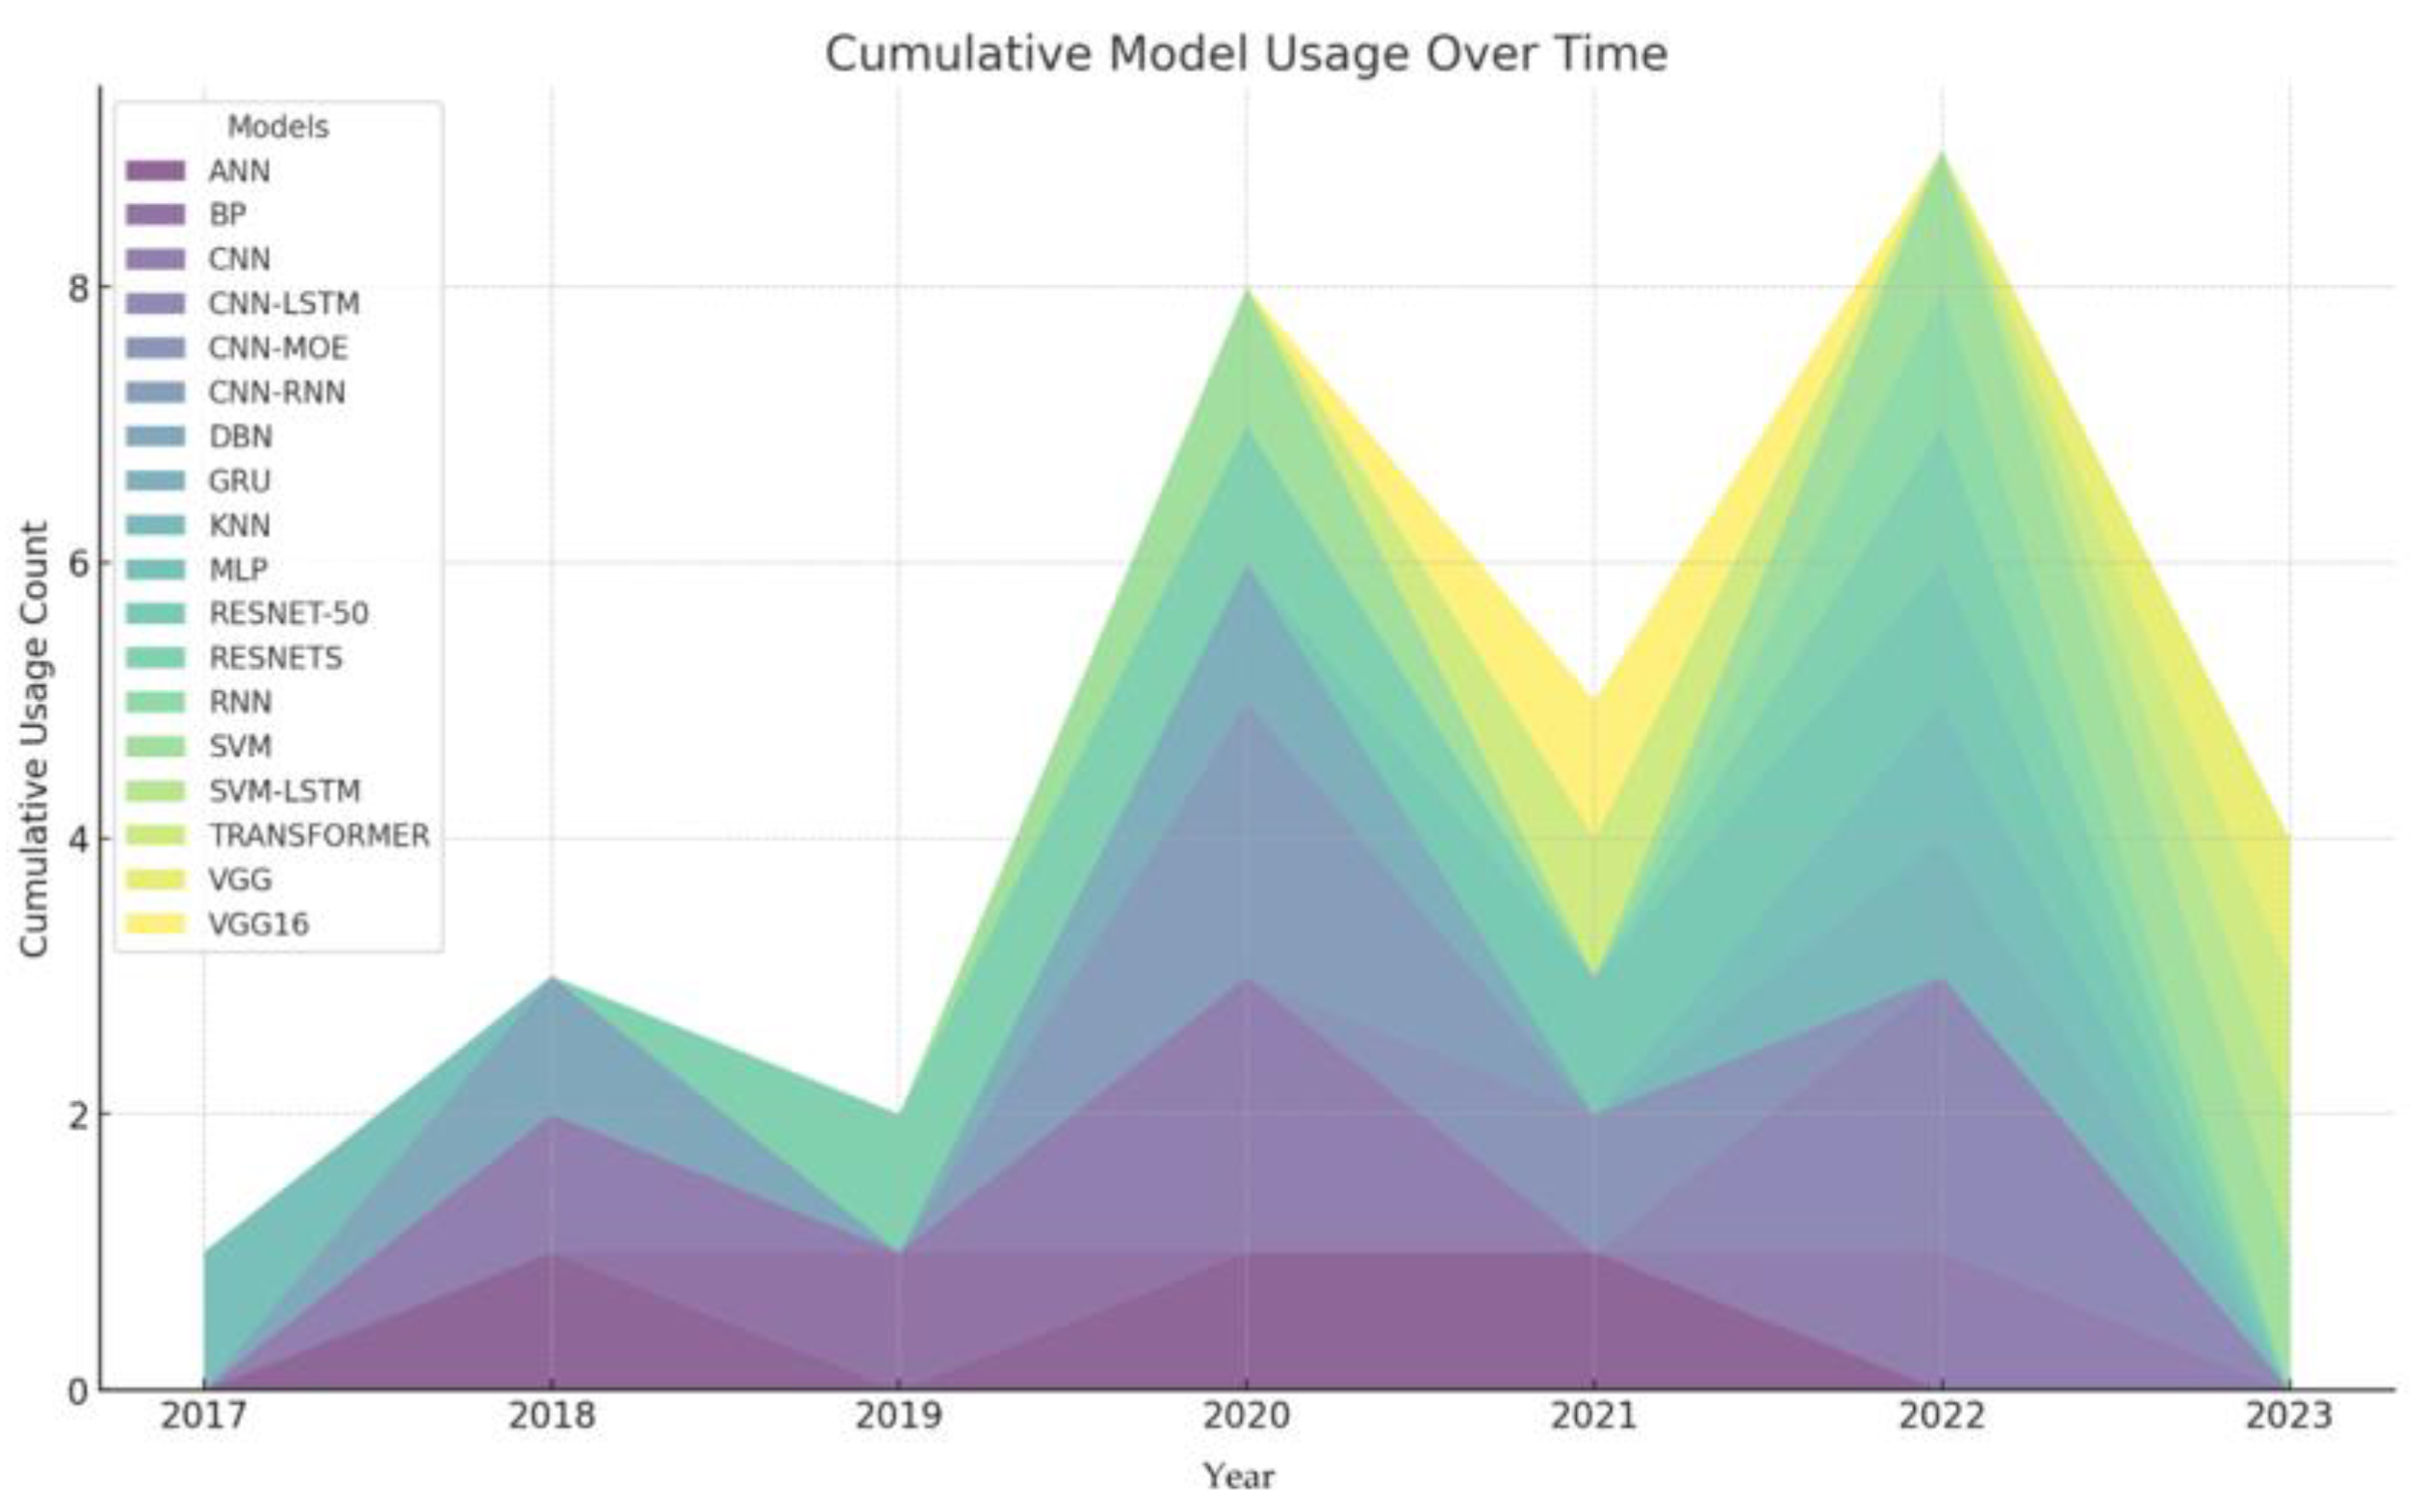
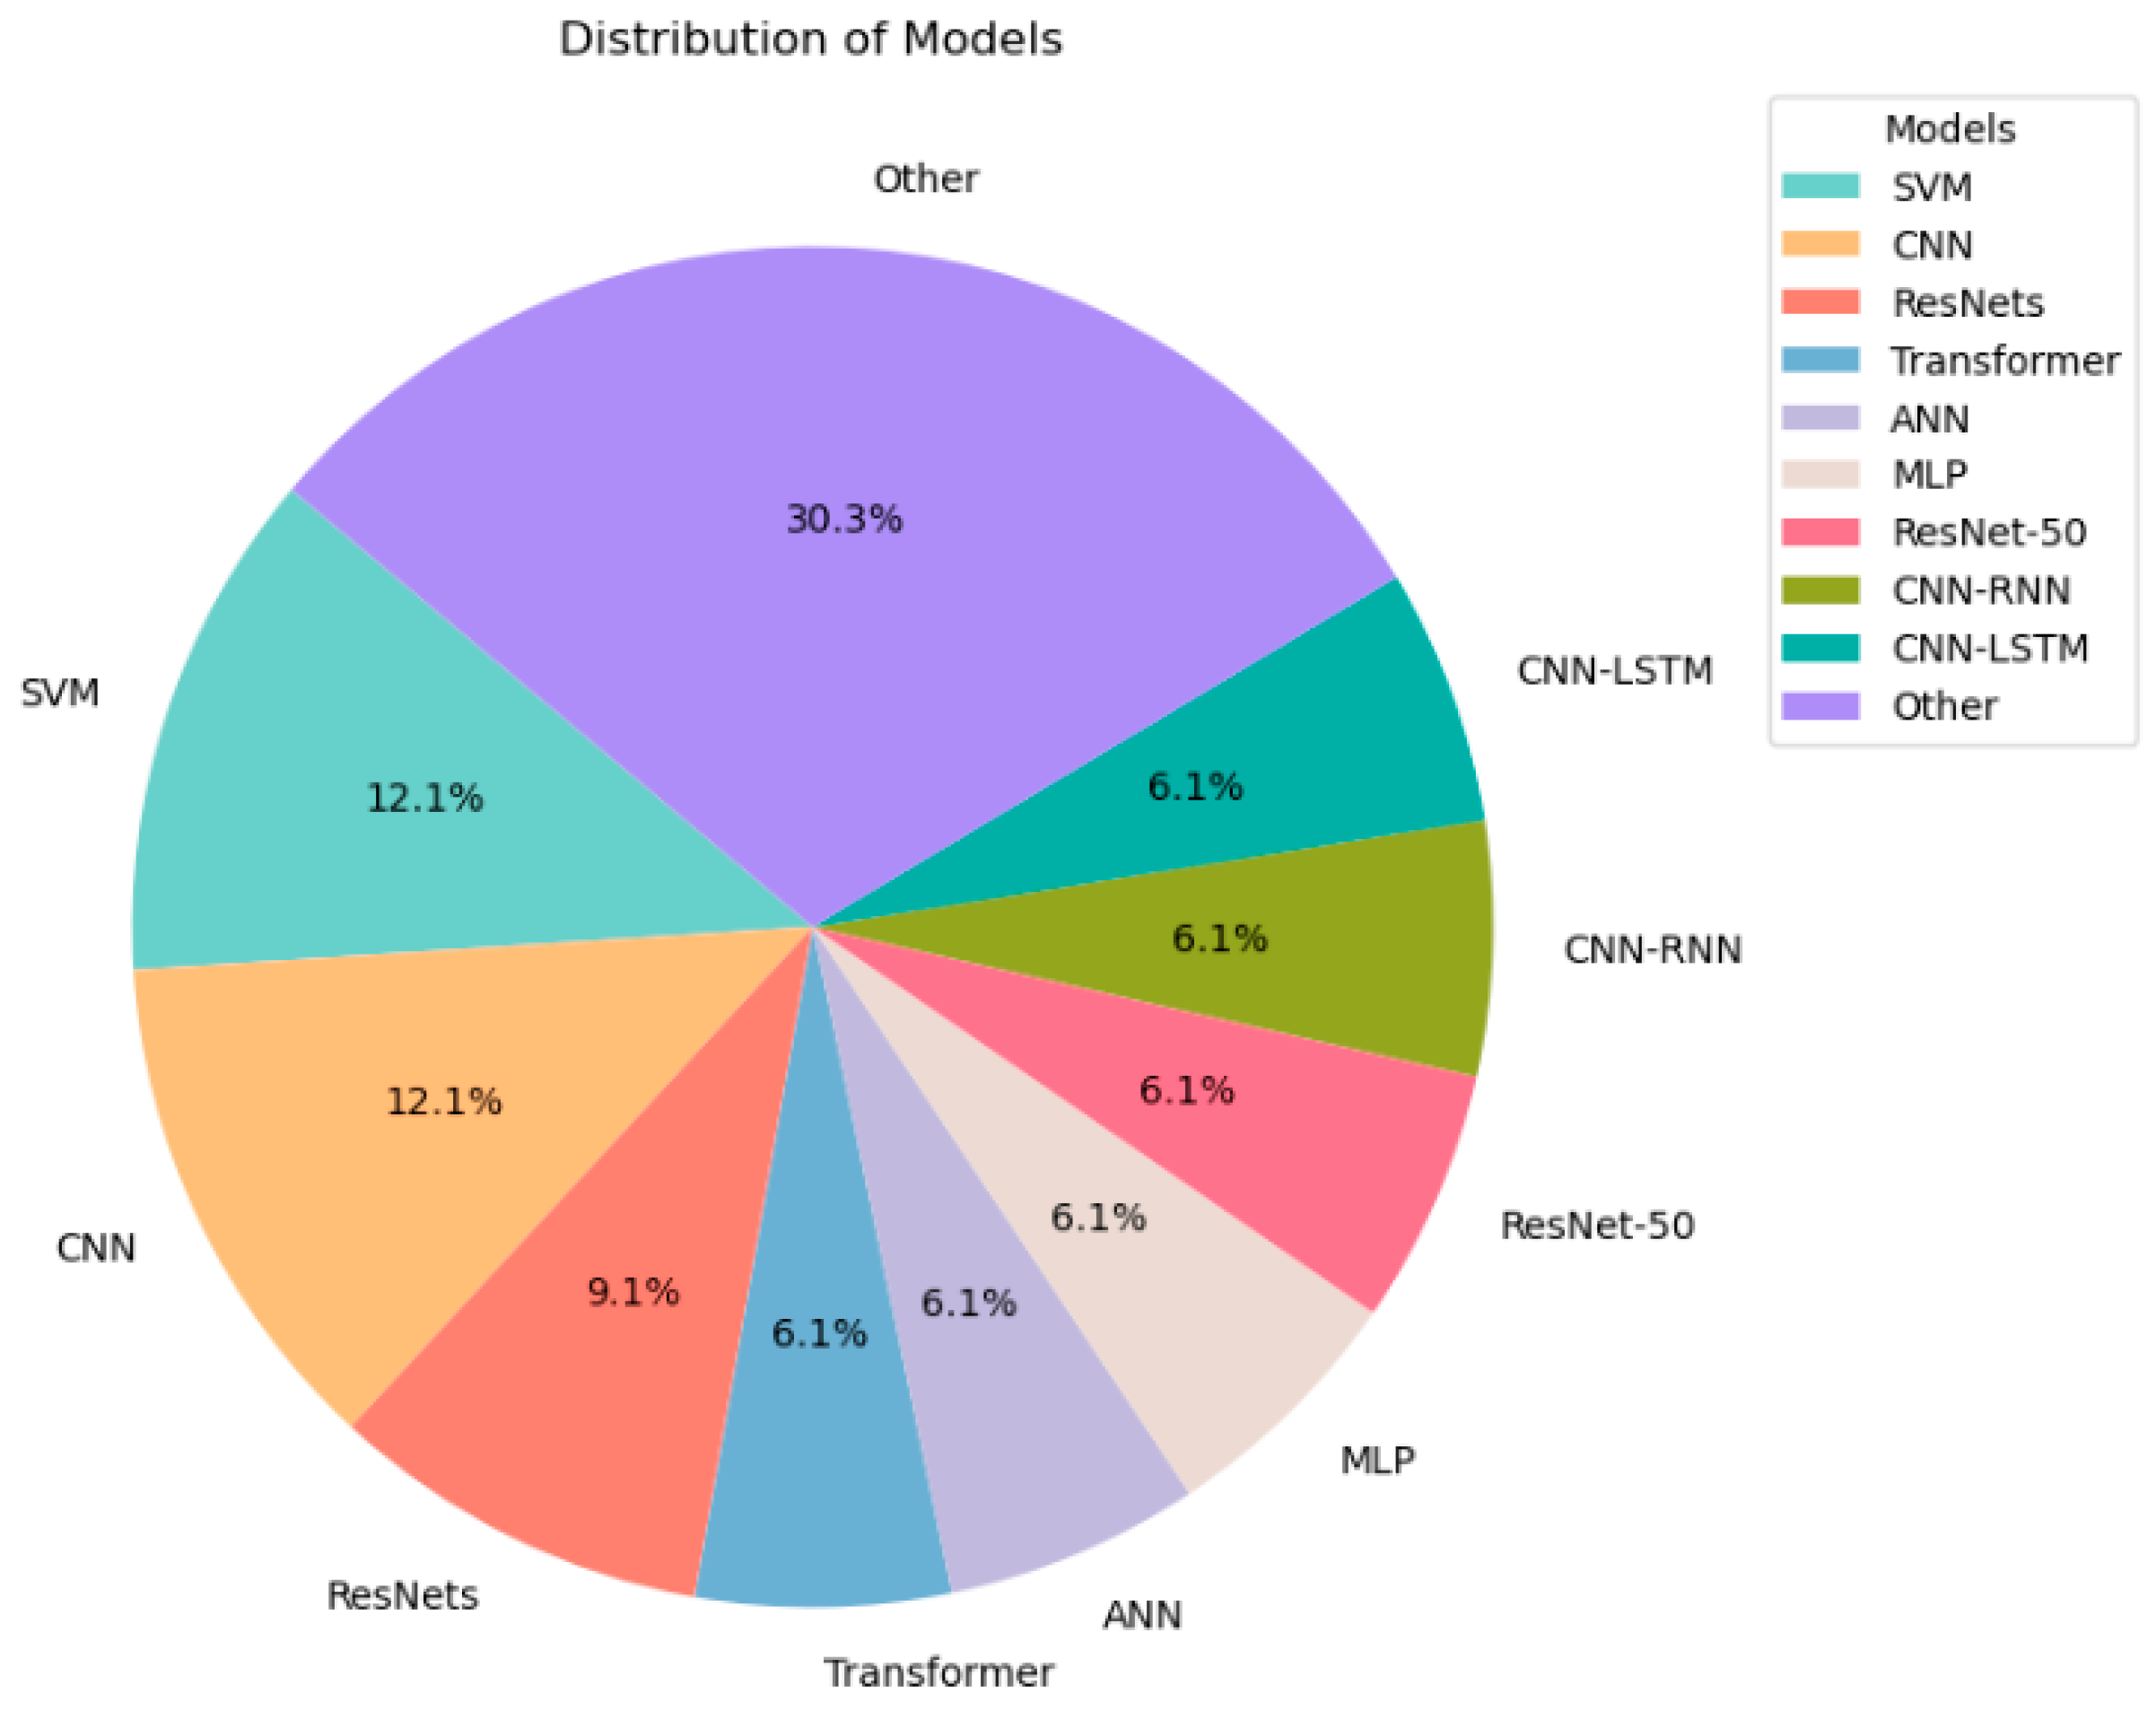
2.2. Machine Learning Methods for Lung Sounds

From Figure 7, we can see that the traditional classification model still provides a strong performance in lung sound classification problems. This is a stacked area chart showing cumulative usage trends over time for various models. The major spikes in 2020 and 2022 represent a significant surge in the use of convolutional neural networks and models related to convolutional neural networks. Methods showing the most significant growth, particularly in 2020 and 2022, are represented by bright yellow areas. This reflects the lung sound recognition and classification tasks for which these models were particularly appropriate or popular at the time.
The pie chart shown in Figure 8 illustrates the proportion of use of each model in the dataset. The category labeled “Other” represents 31.2% of the total and includes less frequently used models, suggesting that while a few models are very popular, the use of other models is increasingly diversifying. The most popular model is the CNN (traditional neural network) with 12.5% of the total, followed by the SVM (support vector machine) and the ResNet (residual network), with 9.4% each. Figure 6 highlights the advantages of specific models such as CNNs, which are known for their effectiveness in various applications such as image and video recognition tasks. The significant fraction represented by “other” models also demonstrates healthy diversity, suggesting that less common models are preferred in experiments by other investigators.
In the early stages of research, as shown in Table 2, k-nearest neighbors (KNN) [12,17] was a widely used method for analyzing lung sounds. However, it has limitations in terms of classification accuracy, making it difficult to meet current requirements. The support vector machine (SVM) [11,12,17,20,36,39,40], on the other hand, is a supervised learning model that has evolved over time to accommodate multi-class classification, having originally been designed for two-class classification. The artificial neural network (ANN) [11,12,14,17,18], which processes data through a structure similar to brain synapses, offers advantages such as adaptability and real-time learning in lung sound analysis, but it has disadvantages such as a long training time and high hardware requirements. Despite these limitations, these models still provide valuable validation and support for ongoing research, serving as a benchmark for comparison with other models and verifying experimental results. They play an important role in the development of less mature models. The multilayer perceptron (MPL) [33,43] is not a common training model because it requires a huge amount of data and is sensitive to noise, but Liu et al. [33] tried a new feature extraction method based on this model.
In Table 3, the convolutional neural network (CNN) has become a commonly used model in recent years, particularly in the field of vision, where it has shown exceptional results in classification and recognition. Similarly, it also demonstrates remarkable performance in sound classification. When used as a standalone model [15,19], CNNs perform exceptionally well and can easily be enhanced by adding additional model components [16,23,28,32,38]. Furthermore, by constructing deep convolutional neural networks, such as VGGs [21,37] and ResNets [10,25,29], its performance can be further improved. Overall, CNNs have a wide range of applications and are highly efficient, making them incredibly valuable in the current research landscape.
Support vector machines (SVMs), artificial neural networks (ANNs), convolutional neural networks (CNNs), and ResNets are the most prevalent categorization models. Numerous investigations have established the dependability and resiliency of these models. Increasing the number of model layers and fine-tuning the model’s hyperparameters can further increase the model’s accuracy. Early models such as KNN, random forest, and AdaBoost can still provide validation and support for ongoing research.
There are also a lot of researchers trying different models or trying to design and build new ones, as shown in Table 4. LungRN+NL [26] is a neural network model for diagnosing lung sound abnormalities that incorporates a non-local block to compute relationships between STFT spectra at different positions in time and frequency domains. The model is based on the ResNet architecture, utilizing ResNet-I and ResNet-II layers, a non-local layer, and a classification layer to extract features of lung sounds in both time and frequency domains for classification. The DBN (deep belief network) [27] is a type of generative artificial neural network that consists of multiple stacked restricted Boltzmann machines (RBMs) with undirected connections between the hidden and visible layers. The goal of DBNs is to learn an underlying probabilistic model of the data distribution layer, followed by fine-tuning with labeled data using supervised learning algorithms like backpropagation. The transformer–CP [21] (CP stands for circular positional encoding) model is based on the transformer [45] architecture, which is a type of deep neural network used in natural language processing (NLP) tasks. The main idea behind the transformer–CP model is to incorporate position information into the representation of input sequences. This is achieved by using a circular position encoding technique, which assigns a unique representation to each position in the sequence, considering the cyclic nature of the sequence. Ma et al. [21] tried to use this model in lung sound processing.
Additionally, there are hybrid variants such as CNN–RNN [16] and CNN–LSTM [28,32]. Combining the benefits and drawbacks of the models might also yield positive outcomes.

2.3. Other Methods

The study by Nguyen et al. [25] presents the introduction of two techniques, co-tuning and stochastic normalization [49], aimed at improving classification performance. Co-tuning is designed to enhance the transfer of knowledge from a pre-trained model more effectively. On the other hand, stochastic normalization is a method that tackles problems associated with shifts in data distribution between the training and test datasets.

3. Shortcomings of Current Research

The use of machine learning models for lung disease diagnosis is a rapidly developing field, with new approaches and models being developed and tested regularly. According to surveys [50], healthcare professionals emphasize the need for larger, high-quality datasets to train these models effectively, highlighting cases where limited data have led to less reliable diagnoses. Innovations like ensemble learning, which integrates multiple model predictions, have been shown to improve significantly both the accuracy and robustness of diagnostic outputs. However, the transition from data-driven models to clinical applications still faces hurdles such as ethical data collection and inherent biases, which must be carefully managed to ensure the models’ clinical viability. Thus, one of the main challenges faced in this area is the lack of availability of large-scale, high-quality datasets, which are essential for developing accurate and robust machine learning models [50]. However, obtaining such data is a difficult and time-consuming task, especially when dealing with medical data that require ethical and privacy considerations.
Early studies in this field used simpler machine learning models such as KNN, ANNs, SVMs, and MLPs. However, as the complexity of the problem increased, these models were replaced by more advanced models such as CNNs, ResNets, and transformers. These models can capture more complex patterns and features in the data, resulting in more accurate and reliable diagnoses.
Currently, many studies still focus on using a single machine learning model to diagnose lung diseases. However, recent research has shown that combining multiple models can improve the accuracy and robustness of disease diagnosis. For example, ensemble learning techniques, such as bagging and boosting, can be used to combine the predictions of multiple models and generate a more accurate and reliable diagnosis. Despite the promising results of machine learning models in lung disease diagnosis, they still have limitations. One major limitation is the inability to fully simulate human expertise. Medical professionals rely on a wealth of knowledge and experience to make accurate diagnoses, and it can be challenging to replicate this expertise using machine learning models. Additionally, machine learning models can be affected by potential data imbalance, bias, and label inaccuracies. These factors can significantly impact the reliability and accuracy of the diagnosis, and careful consideration must be given to address these issues. Previous research has indicated that semi-supervised and unsupervised models can effectively address the inherent complexity and individual variability in lung sound signals, which are often challenging to analyze and classify. By efficiently leveraging unlabeled data through semi-supervised learning techniques, these models can significantly reduce the reliance on manually annotated data. This approach has demonstrated substantial improvements in classification accuracy, particularly in scenarios involving datasets with a limited number of labeled examples.
The semi-supervised learning method not only improves the accuracy and generalization ability of the model but also provides a promising approach for lung disease sound detection while reducing data requirements. This research makes a significant contribution to the field by providing a more efficient and less invasive diagnostic method than traditional techniques such as CT scans and X-rays.
Overall, the use of machine learning models for lung disease diagnosis has made significant strides in recent years, and the continued development of these models is promising. However, it is essential to address the challenges and limitations of these models to ensure their reliability and accuracy in clinical practice.

4. Future Research Direction

According to the article’s summary and analysis presented above, there is still a great deal of work to be performed. For instance, the application and selection of data should be refined. Instead of using the total lung sound, the lung sound in a specific area can be picked based on the disease’s characteristics, allowing it to be identified and discriminated more successfully. Another direction is to continue enhancing the extraction of sound characteristics, extracting more precise and relevant information and differentiating them. The use of spectrograms for lung sound classification is a common approach in the field of medical diagnosis. A spectrogram is a visual representation of the frequency spectrum of a sound signal, which can provide information about the characteristic patterns of lung sounds. By training machine learning models on spectrogram data, researchers aim to develop automatic diagnostic systems for lung diseases. However, the accuracy and reliability of these systems depend on the quality of the data and the performance of the models. It is also important to consider factors such as data bias and label accuracy to ensure the validity of the results. Despite these challenges, the use of spectrograms for lung sound classification remains a promising area of research with the potential for significant impact in the field of medical diagnosis.
In addition, it is feasible to convert the information of a one-dimensional signal, such as sound, into a two-dimensional image and to apply more robust and image-specific models. Additionally, there are changes depending on current models, such as adding additional classifiers before the fully linked CNN layer. Some individuals have begun to categorize using the sound spectrum, but there is still potential for development. Popular pre-trained CNN models, such as VGG16 and AlexNet, produce generally decent results in image recognition and some sound classification applications; nevertheless, sound features are not well understood because these CNN models were not trained on sound datasets or completely considered. Therefore, the proposed CNN model is trained using spectrogram images derived from lung sounds. In addition, a parallel pooling structure is implemented in the proposed CNN architecture to boost classification performance. Then, from the first fully linked layer of the proposed CNN, deep characteristics are recovered. In addition, under the assumption that the accuracy rate is ensured, memory consumption is decreased to enable the use of wearable devices.

5. Conclusions

The emergence of COVID-19 has significantly increased the demand for the efficient and accurate diagnosis of lung diseases, prompting machine learning to become increasingly important in lung sound recognition and classification research. This article reviews various studies that use different sound datasets to classify lung sounds and respiratory conditions. The sound features used include Mel spectrograms, MFCCs, STFT, wavelet, log Mel spectra, PSD, RSEs, and 3D–SODP. A variety of machine learning algorithms have been applied to sound classification, including the ANN, SVM, KNN, CNN, CNN–RNN, DBN, transformer–cp, ResNet-50, and LungRN+NL, most of which show high accuracy, ranging from 68.51% to 98.88%. Some studies have used techniques such as undersampling, random masking, and patient-specific retraining to improve performance. The ResNet-50 model performs the best on the ICBHI respiratory sound database with an accuracy of 98.88%. Despite significant progress, current research is still limited by insufficient data diversity, limited model generalization ability, and difficulty in practical application. Future research needs to develop more complex and accurate algorithms to improve the adaptability and generalization of the model and at the same time strengthen the comprehensiveness and systematisms of data collection to better meet clinical needs. This article emphasizes that lung sound classification technology has great potential for application in disease diagnosis and is expected to be further developed and promoted.

Author Contributions

Conceptualization, X.X.; methodology, X.X.; investigation, X.X.; resources, X.X.; data curation, X.X.; writing—original draft preparation, X.X.; analysis and writing—review and editing, R.S. All authors have read and agreed to the published version of the manuscript.

Funding

This research received no external funding.

Data Availability Statement

No new data were created or analyzed in this study. Data sharing is not applicable to this article.

Acknowledgments

I am grateful to my supervisor, Ravi Sankar, for his guidance and support throughout my research. His commitment to academic excellence has been a great inspiration. Additionally, I extend my thanks to all the researchers and contributors to the public datasets that were instrumental in this research. Their dedication to advancing scientific knowledge has enriched my work and broadened the scope of my study.

Conflicts of Interest

The authors declare no conflicts of interest.

References

  1. Lehrer, S. Understanding Lung Sounds; W.B. Saunders Company: Philadelphia, PA, USA, 2018. [Google Scholar]
  2. Gurung, A.; Scrafford, C.G.; Tielsch, J.M.; Levine, O.S.; Checkley, W. Computerized lung sound analysis as diagnostic aid for the detection of abnormal lung sounds: A systematic review and meta-analysis. Respir. Med. 2011, 105, 1396–1403. [Google Scholar] [CrossRef] [PubMed]
  3. Palaniappan, R.; Sundaraj, K.; Ahamed, N.U. Machine learning in lung sound analysis: A systematic review. Biocybern. Biomed. Eng. 2013, 33, 129–135. [Google Scholar] [CrossRef]
  4. Pasterkamp, H.; Brand, P.L.; Everard, M.; Garcia-Marcos, L.; Melbye, H.; Priftis, K.N. Towards the standardisation of lung sound nomenclature. Eur. Respir. J. 2016, 47, 724–732. [Google Scholar] [CrossRef] [PubMed]
  5. Walker, H.K.; Hall, W.D.; Hurst, J.W. (Eds.) Clinical Methods: The History, Physical, and Laboratory Examinations, 3rd ed.; Butterworths: London, UK, 1990. [Google Scholar]
  6. Gern, J.E. The ABCs of rhinoviruses, wheezing, and asthma. J. Virol. 2010, 84, 7418–7426. [Google Scholar] [CrossRef]
  7. Yang, I.A.; Brown, J.L.; George, J.; Jenkins, S.; McDonald, C.F.; McDonald, V.M.; Phillips, K.; Smith, B.J.; Zwar, N.A.; Dabscheck, E. COPD-X Australian and New Zealand guidelines for the diagnosis and management of chronic obstructive pulmonary disease: 2017 update. Med. J. Aust. 2017, 207, 436–442. [Google Scholar] [CrossRef]
  8. Cottin, V.; Cordier, J.-F. Velcro crackles: The key for early diagnosis of idiopathic pulmonary fibrosis? Eur. Respir. J. 2012, 40, 519–521. [Google Scholar] [CrossRef]
  9. Hershey, S.; Chaudhuri, S.; Ellis, D.P.W.; Gemmeke, J.F.; Jansen, A.; Moore, R.C.; Plakal, M.; Platt, D.; Saurous, R.A.; Seybold, B.; et al. CNN architectures for large-scale audio classification. In Proceedings of the 2017 IEEE International Conference on Acoustics, Speech and Signal Processing (ICASSP), New Orleans, LA, USA, 5–9 March 2017; IEEE: Piscataway, NJ, USA, 2017. [Google Scholar] [CrossRef]
  10. Banerjee, A.; Nilhani, A. A residual network based deep learning model for detection of COVID-19 from cough sounds. arXiv 2021, arXiv:2106.02348. [Google Scholar]
  11. Islam, M.A.; Bandyopadhyaya, I.; Bhattacharyya, P.; Saha, G. Multichannel lung sound analysis for asthma detection. Comput. Methods Programs Biomed. 2018, 159, 111–123. [Google Scholar] [CrossRef] [PubMed]
  12. Demirci, B.A.; Koçyiğit, Y.; Kızılırmak, D.; Havlucu, Y. Adventitious and Normal Respiratory Sound Analysis with Machine Learning Methods. Celal Bayar Univ. J. Sci. 2021, 18, 169–180. [Google Scholar] [CrossRef]
  13. Demir, F.; Ismael, A.M.; Sengur, A. Classification of lung sounds with CNN model using parallel pooling structure. IEEE Access 2020, 8, 105376–105383. [Google Scholar] [CrossRef]
  14. Islam, M.A.; Bandyopadhyaya, I.; Bhattacharyya, P.; Saha, G. Classification of normal, Asthma and COPD subjects using multichannel lung sound signals. In Proceedings of the 2018 International Conference on Communication and Signal Processing (ICCSP), Chennai, India, 3–5 April 2018; IEEE: Piscataway, NJ, USA, 2018. [Google Scholar]
  15. Perna, D. Convolutional neural networks learning from respiratory data. In Proceedings of the 2018 IEEE International Conference on Bioinformatics and Biomedicine (BIBM), Madrid, Spain, 3–6 December 2018; IEEE: Piscataway, NJ, USA, 2018. [Google Scholar]
  16. Acharya, J.; Basu, A. Deep neural network for respiratory sound classification in wearable devices enabled by patient specific model tuning. IEEE Trans. Biomed. Circuits Syst. 2020, 14, 535–544. [Google Scholar] [CrossRef] [PubMed]
  17. Meng, F.; Shi, Y.; Wang, N.; Cai, M.; Luo, Z. Detection of respiratory sounds based on wavelet coefficients and machine learning. IEEE Access 2020, 8, 155710–155720. [Google Scholar] [CrossRef]
  18. Rani, S.; Chaurasia, A.; Dutta, M.K.; Myska, V.; Burget, R. Machine learning approach for automatic lungs sound diagnosis from pulmonary signals. In Proceedings of the 2021 44th International Conference on Telecommunications and Signal Processing (TSP), Virtual, 26–28 July 2021; IEEE: Piscataway, NJ, USA, 2021. [Google Scholar]
  19. Paraschiv, E.-A.; Rotaru, C.-M. Machine learning approaches based on wearable devices for respiratory diseases diagnosis. In Proceedings of the 2020 International Conference on e-Health and Bioengineering (EHB), Iasi, Romania, 29–30 October 2020; IEEE: Piscataway, NJ, USA, 2020. [Google Scholar]
  20. Abdullah, S.; Demosthenous, A.; Yasin, I. Comparison of Auditory-Inspired Models Using Machine-Learning for Noise Classification. Int. J. Simul.—Syst. Sci. Technol. 2020, 21. [Google Scholar] [CrossRef]
  21. Xue, H.; Salim, F.D. Exploring self-supervised representation ensembles for COVID-19 cough classification. In Proceedings of the 27th ACM SIGKDD Conference on Knowledge Discovery & Data Mining, Singapore, 14–18 August 2021. [Google Scholar]
  22. Kim, Y.; Hyon, Y.; Jung, S.S.; Lee, S.; Yoo, G.; Chung, C.; Ha, T. Respiratory sound classification for crackles, wheezes, and rhonchi in the clinical field using deep learning. Sci. Rep. 2021, 11, 1–11. [Google Scholar] [CrossRef]
  23. Zhang, Y.; Huang, Q.; Sun, W.; Chen, F.; Lin, D.; Chen, F. Research on lung sound classification model based on dual-channel CNN-LSTM algorithm. Biomed. Signal Process. Control. 2024, 94, 106257. [Google Scholar] [CrossRef]
  24. Zhu, H.; Lai, J.; Liu, B.; Wen, Z.; Xiong, Y.; Li, H.; Zhou, Y.; Fu, Q.; Yu, G.; Yan, X.; et al. Automatic pulmonary auscultation grading diagnosis of Coronavirus Disease 2019 in China with artificial intelligence algorithms: A cohort study. Comput. Methods Programs Biomed. 2021, 213, 106500. [Google Scholar] [CrossRef] [PubMed]
  25. Nguyen, T.; Pernkopf, F. Lung Sound Classification Using Co-tuning and Stochastic Normalization. IEEE Trans. Biomed. Eng. 2022, 69, 2872–2882. [Google Scholar] [CrossRef]
  26. Ma, Y.; Xu, X.; Li, Y. LungRN+ NL: An Improved Adventitious Lung Sound Classification Using Non-Local Block ResNet Neural Network with Mixup Data Augmentation. In Proceedings of the Interspeech 2020, Shanghai, China, 25–29 October 2020. [Google Scholar]
  27. Altan, G.; Kutlu, Y.; Pekmezci, A.; Nural, S. Deep learning with 3D-second order difference plot on respiratory sounds. Biomed. Signal Process. Control. 2018, 45, 58–69. [Google Scholar] [CrossRef]
  28. Petmezas, G.; Cheimariotis, G.-A.; Stefanopoulos, L.; Rocha, B.; Paiva, R.P.; Katsaggelos, A.K.; Maglaveras, N. Automated Lung Sound Classification Using a Hybrid CNN-LSTM Network and Focal Loss Function. Sensors 2022, 22, 1232. [Google Scholar] [CrossRef]
  29. Chen, H.; Yuan, X.; Pei, Z.; Li, M.; Li, J. Triple-classification of respiratory sounds using optimized s-transform and deep residual networks. IEEE Access 2019, 7, 32845–32852. [Google Scholar] [CrossRef]
  30. Basu, V.; Rana, S. Respiratory diseases recognition through respiratory sound with the help of deep neural network. In Proceedings of the 2020 4th International Conference on Computational Intelligence and Networks (CINE), Kolkata, India, 27–29 February 2020; IEEE: Piscataway, NJ, USA, 2020. [Google Scholar]
  31. Shi, Y.; Li, Y.; Cai, M.; Zhang, X.D. A lung sound category recognition method based on wavelet decomposition and BP neural network. Int. J. Biol. Sci. 2019, 15, 195–207. [Google Scholar] [CrossRef] [PubMed]
  32. Kwon, A.M.; Kang, K. A temporal dependency feature in lower dimension for lung sound signal classification. Sci. Rep. 2022, 12, 7889. [Google Scholar] [CrossRef] [PubMed]
  33. Liu, Y.X.; Yang, Y.; Chen, Y.H. Lung sound classification based on Hilbert-Huang transform features and multilayer perceptron network. In Proceedings of the 2017 Asia-Pacific Signal and Information Processing Association Annual Summit and Conference (APSIPA ASC), Kuala Lumpur, Malaysia, 12–15 December 2017; IEEE: Piscataway, NJ, USA, 2017. [Google Scholar]
  34. Tay, Y.; Dehghani, M.; Bahri, D.; Metzler, D. Efficient transformers: A survey. ACM Comput. Surv. (CSUR) 2020, 55, 1–28. [Google Scholar] [CrossRef]
  35. Dubey, R.; Bodade, R.M.; Dubey, D. Efficient classification of the adventitious sounds of the lung through a combination of SVM-LSTM-Bayesian optimization algorithm with features based on wavelet bi-phase and bi-spectrum. Res. Biomed. Eng. 2023, 39, 349–363. [Google Scholar] [CrossRef]
  36. Abera Tessema, B.; Nemomssa, H.D.; Lamesgin Simegn, G. Acquisition and classification of lung sounds for improving the efficacy of auscultation diagnosis of pulmonary diseases. Med. Devices Evid. Res. 2022, 15, 89–102. [Google Scholar] [CrossRef] [PubMed]
  37. Lal, K.N. A lung sound recognition model to diagnoses the respiratory diseases by using transfer learning. Multimed. Tools Appl. 2023, 82, 36615–36631. [Google Scholar] [CrossRef]
  38. Pham, L.; Phan, H.; Palaniappan, R.; Mertins, A.; McLoughlin, I. CNN-MoE based framework for classification of respiratory anomalies and lung disease detection. IEEE J. Biomed. Health Inform. 2021, 25, 2938–2947. [Google Scholar] [CrossRef]
  39. Amose, J.; Manimegalai, P. Classification of Adventitious Lung Sounds: Wheeze, Crackle using Machine Learning Techniques. Int. J. Intell. Syst. Appl. Eng. 2023, 11, 1143–1152. [Google Scholar]
  40. Levy, J.; Naitsat, A.; Zeevi, Y.Y. Classification of audio signals using spectrogram surfaces and extrinsic distortion measures. EURASIP J. Adv. Signal Process. 2022, 2022, 100. [Google Scholar] [CrossRef]
  41. Rocha, B.M.; Filos, D.; Mendes, L.; Vogiatzis, I.; Perantoni, E.; Kaimakamis, E.; Natsiavas, P.; Oliveira, A.; Jácome, C.; Marques, A.; et al. A respiratory sound database for the development of automated classification. In Precision Medicine Powered by pHealth and Connected Health: ICBHI 2017, Thessaloniki, Greece, 18–21 November 2017; Springer: Singapore, 2018. [Google Scholar]
  42. Zhao, G.; Sonsaat, S.; Silpachai, A.; Lucic, I.; Chukharev-Hudilainen, E.; Levis, J.; Gutierrez-Osuna, R. L2-ARCTIC: A non-native English speech corpus. In Proceedings of the Interspeech 2018, Hyderabad, India, 2–6 September 2018. [Google Scholar]
  43. Kapoor, T.; Pandhi, T.; Gupta, B. Cough Audio Analysis for COVID-19 Diagnosis. SN Comput. Sci. 2022, 4, 125. [Google Scholar] [CrossRef]
  44. Khanzada, A.; Wilson, T. Virufy COVID-19 Open Cough Dataset, Github (2020). 2021. Available online: https://github.com/virufy/virufy-data (accessed on 12 September 2024).
  45. Siebert, J.N.; Hartley, M.-A.; Courvoisier, D.S.; Salamin, M.; Robotham, L.; Doenz, J.; Barazzone-Argiroffo, C.; Gervaix, A.; Bridevaux, P.-O. Deep learning diagnostic and severity-stratification for interstitial lung diseases and chronic obstructive pulmonary disease in digital lung auscultations and ultrasonography: Clinical protocol for an observational case–control study. BMC Pulm. Med. 2023, 23, 191. [Google Scholar] [CrossRef] [PubMed]
  46. Hu, Y.; Loizou, P.C. Subjective comparison and evaluation of speech enhancement algorithms. Speech Commun. 2006, 49, 588–601. [Google Scholar] [CrossRef] [PubMed]
  47. McFee, B.; Raffel, C.; Liang, D.; Ellis, D.P.; McVicar, M.; Battenberg, E.; Nieto, O. librosa: Audio and music signal analysis in python. In Proceedings of the 14th Python in Science Conference, Austin, TX, USA, 6–12 July 2015; Volume 8. [Google Scholar]
  48. Ellis, D.P.W. Gammatone-like Spectrograms. 2009. Available online: https://www.ee.columbia.edu/~dpwe/resources/matlab/gammatonegram/ (accessed on 12 September 2024).
  49. Kou, Z.; You, K.; Long, M.; Wang, J. Stochastic normalization. Adv. Neural Inf. Process. Syst. 2020, 33, 16304–16314. [Google Scholar]
  50. Jiang, Y.; Li, X.; Luo, H.; Yin, S.; Kaynak, O. Quo vadis artificial intelligence? Discov. Artif. Intell. 2022, 2, 4. [Google Scholar] [CrossRef]
Figure 1. Respiratory system.
Bdcc 08 00127 g001
Figure 2. Sound signals of different lung diseases.
Bdcc 08 00127 g002
Figure 3. Schematic diagram of the model.
Bdcc 08 00127 g003
Figure 4. Spectrograms for different lung diseases.
Bdcc 08 00127 g004aBdcc 08 00127 g004b
Figure 5. This is a stacked area plot of the cumulative usage trend of feature extraction methods over time. The chart shows the frequency of use of various methods from the earliest to the latest year, helping to examine the popularity changes of different feature extraction methods briefly.
Bdcc 08 00127 g005
Figure 6. The chart displays the proportion of each feature extraction method.
Bdcc 08 00127 g006
Figure 7. The chart clearly shows how each model’s usage stacks up over time and how they compare to other models.
Bdcc 08 00127 g007
Figure 8. The chart shows the proportion of each model.
Bdcc 08 00127 g008
Table 1. Classification of common abnormal lung sounds.
Abnormal Lung SoundsSound CharacteristicsCommon Diseases
RhonchusLow-pitched sonorous soundChronic obstructive pulmonary disease (COPD)
WheezeHigh-pitched whistling soundAsthma or bronchoconstriction
Coarse crackleLow-pitched popping or crackling soundBronchiectasis or pneumonia
Thin crackleHigh-pitched fine or soft crackling soundInterstitial lung disease or atelectasis
Table 2. Traditional lung sound classification methods.
RefSoundsDatasetFeature
Extraction
MethodOutcome
[11]Asthma4 channels to collect 60 peopleSpectral sub-bandANN, SVMThe SVM yields better classification performance. The best classification accuracies of 2-channel and 3-channel combinations in ANN and SVM classifiers reach 89.2% and 93.3%, respectively. The proposed multi-channel asthma detection method outperforms commonly used lung sound classification methods.
[12]Rhonchus wheeze25 healthy and 25 patients EMD, MFCC, WT ANN, SVM,
KNN
The best accuracy is 98.8% by using Mel-frequency cepstral coefficients with the k-nearest neighbor method.
[14]Asthma, COPD4 channels collect 60 peoplePSDANNWhen information from all four channels is used together, the proposed multi-channel-based multi-class classification system achieves reasonable classification accuracy, well above theoretical and empirical chance levels.
[17]Crackle rhonchi 130 patientsRWE, WESVM, ANN, KNNThe feature vector in this article was the combination of wavelet signal similarity, relative wavelet energy, and wavelet entropy. The SVM, ANN, and KNN all have average classification accuracies of 69.50, 85.43, and 68.51%, respectively.
[18]Bronchial, crepitation, wheeze233 recordsMFCCANNBecause lung sounds mainly lie between 100 Hz and 500 Hz, we use amplitude normalization and frequency filtering, where frequencies above 500 Hz in the signal are removed. Using data augmentation techniques such as white noise addition and sound shifting improves the model’s robustness to sound recognition in noisy environments. These techniques help the model better adapt to various noise conditions that may be encountered in practical applications. The 5-fold ANN accuracy rate is 95.6%.
[20] SpeechNOIZEUS [46] AIM, MRCG SVMThe MRCG method processes sound to create time–frequency representations at multiple resolutions, capturing both the local and broader spectral–temporal context. The AIM simulates peripheral and central auditory processing to capture the fine temporal structure of sounds through the process of converting neural activity patterns into stable auditory images. AIM generally performs worse than MRCG. Using the MRCG model combined with the SVM, the classification accuracy was higher than 80% in most test environments, with an average accuracy of 89.8%.
[33] Lung sound 51 pieces HHTMLPThrough the Hilbert–Huang transform, the sound signal is decomposed into different intrinsic mode functions (intrinsic mode functions, IMFs). These IMFs can better express the essential characteristics of the original signal.
Feature extraction involves extracting relevant features from individual IMFs that reflect specific properties of lung sounds. Together with the multilayer perceptron, it achieved an accuracy of 95.84%.
[36] Lung sound Jimma University Medical Center (JUMC) and ICBHI 2017 [41]DWTSVMThis study attempts to classify lung disease sounds using several different features. Different features can help classify different lung diseases. Lung sounds were analyzed using wavelet multiresolution analysis. To select the most relevant features, one-way ANOVA was used for feature selection. Using the optimized Fine Gaussian SVM classifier, the test classification accuracy for seven lung diseases was 99%, the specificity was 99.2%, and the sensitivity was 99.04%.
[39] Crackle, wheeze From the Kaggle website, comprising 920 annotated sounds from 126 individuals MFCCSVMThe article discusses the use of machine learning techniques to classify wheezes and rales during lung auscultation. Specifically, the study used two classifiers, the support vector machine (SVM) and decision tree (DT) classifiers. Experimentally, the SVM classifier showed higher accuracy than the decision tree; therefore, the SVM is a more efficient choice for such audio signal classification. The accuracy of the SVM is 80%; for the decision tree, it is 65%.
[40] Lung sound,
speech sound
ICBHI 2017 [41],
The L2-Arctic database [42]
Overlap discrete wavelet transform (MODWT) and a Mel spectrogramRNNIn the article, the specific method of feature extraction is by representing the one-dimensional audio signal as a two-dimensional manifold surface embedded in a three-dimensional space. Geometric properties of these surfaces, such as surface curvature and distance measures, are used to extract features from the signal. The specific method is called geometric feature extraction.
The benchmark model used in this article is RNN. This model uses the adaptive block coordinate descent (ABCD) algorithm to optimize mapping, with a specific accuracy rate of up to 88%.
[43] COVID-19 COVID-19 cough dataset [44]MFCCMLPThe study employed a MLP, a CNN, an RNN, and an SVM to classify cough audio samples for COVID-19 diagnosis, utilizing MFCC feature extraction methods and a multilayer perceptron model for effective classification. The model’s performance was evaluated based on accuracy (96%), precision, and recall, demonstrating its potential in aiding COVID-19 diagnosis.
Table 3. Classification methods based on neural networks.
RefSoundsDatasetFeature
Extraction
MethodOutcome
[10]COVID-19 coughs DiCOVA Challenge log–Mel spectrogram ResNet-50 A 98.88% average validation was found for the AUC. In addition, the model was applied to the blind test set released by the DiCOVA Challenge, and the test AUC reached 75.91%, the test specificity reached 62.50%, and the test sensitivity reached 80.49%.
[15]Lung soundICBHI 2017 [41]MFCCCNNUsing undersampling techniques means limiting the number of instances of underrepresented classes to just a few samples. The accuracy rate of two classifications is 0.83, and the accuracy rate of three classifications is 0.82.
[16]Wheeze, crackleICBHI 2017 [41] Mel spectrograms CNN–RNNWith 10-fold cross-validation, the average score obtained is 66.43. The newly introduced technique for weight quantization effectively reduces the total memory usage by approximately fourfold without compromising performance. This approach of retraining with a focus on individual patient data proves highly beneficial for the development of dependable, long-term automated monitoring systems, particularly in wearable health technologies.
[19]Lung soundICBHI 2017 [41]MFCCCNNThis paper uses a combination of Mel-frequency cepstral coefficients and convolutional neural networks to classify lung sounds with an accuracy of 90.21%.
[22] Lung soundICBHI 2017 [41]Mel spectrogramVGG16The lung sound signal is converted into a Mel spectrogram as input data and then trained using the VGG16 model. The accuracy rate is 92%.
[24] Crackle, wheeze, phlegm sound 172 COVID-19 records CNNThe lightweight neural network module has an accuracy rate of more than 95%; the four-category deep neural network model based on the residual structure has an accuracy rate of more than 95%; it can diagnose and identify abnormalities such as rales, wheezing, and sputum sounds in the lungs. When it comes to lung sounds, a high accuracy rate of more than 95% is obtained.
[25] Lung sound ICBHI 2017 [41]log–Mel spectrogram ResNet-50 Knowledge from pre-trained models, derived from various ResNet architectures, is harnessed using standard fine-tuning through innovative methods such as co-tuning and stochastic normalization, both individually and in combination. Additionally, to enhance the system’s robustness, techniques like spectral correction and flipped data augmentation have been implemented. Performance evaluations for the classification of Class 3 and Class 2 respiratory diseases yielded average accuracies of 92.72 ± 1.30% and 93.77 ± 1.41%, respectively.
[23]Lung sound ICBHI 2017 [41]MFCCCNN–LSTMA method is proposed to extract the spatial features of data by using CNN, while LSTM captures the features of the time dimension. The data is processed through data enhancement and sampling techniques, and finally 5054 data are obtained.
[28] Lung sound ICBHI 2017 [41]STFTCNN–LSTMThe model achieved an accuracy of 76.39% using interpatient 10-fold cross-validation. Additionally, using leave-one-out cross-validation, it reached a sensitivity of 60.29% and an accuracy of 74.57%.
[29] Lung sound ICBHI 2017 [41]OSTResNetsThe study utilizes an optimized S-transform (OST) alongside deep residual networks (ResNets) to distinguish between wheezes, crackles, and normal respiratory sounds. The experimental findings indicate outstanding multi-classification performance of these respiratory sounds, demonstrating an accuracy of 98.79%, a sensitivity of 96.27%, and a specificity of 100%.
[32] Lung sound ICBHI 2017 [41]SDC-LCNN–LSTMδ-cepstral coefficients in lower subspace (SDC-L) are used as a novel feature for lung sound classification. The accuracy is 0.94.
[37] Lung sound ICBHI 2017 [41]Mel spectrogramVGGThe proposed solution involves a lung sound recognition algorithm that integrates the VGGish network with a stacked bidirectional gated recurrent unit (BiGRU) neural network. This approach merges the capabilities of VGGish for feature extraction with the sequential data processing strengths of the stacked BiGRU.
Table 4. Other classification methods.
RefSoundsDatasetFeature ExtractionMethodOutcome
[13]Lung soundICBHI2017 [41] CNN LDA–RSEA novel CNN model is introduced to extract deep features, incorporating both average and max pooling layers in parallel within the CNN architecture to enhance classification effectiveness. These deep features are then utilized as inputs for a linear discriminant analysis (LDA) classifier, employing the stochastic subspace ensemble (RSE) method. The highest performance achieved with this setup is 71.15%.
[21]RespirationCoswara [45]MFCC random maskingTransformer–CPTransformer-based feature encoders are pre-trained to process unlabeled data in a self-supervised manner. Furthermore, the random masking mechanism works together with the Transformer feature encoder. Experimental results show that a random masking rate of 50% achieves the best performance.
[26] Lung sound ICBHI2017 [41]STFT, waveletLungRN+NLThe model LungRN+NL neural network inserts a non-local layer between the ResNet-II layers to break the local time and frequency constraints of the convolutional neural network, which means that the non-local layer calculates the time domain and frequency domain of a position and other positions. Finally, after the signal is propagated through ResNet-II, four different classes are obtained.
[27] COPD 120 lung sounds 3D-SODPDBNThe combined use of 3D–SODP (third order difference plot) quantitative features with DBN (deep belief networks) separated lung sounds from different levels of COPD with classification performances of 95.84%, 93.34%, and 93.65% for accuracy, sensitivity, and specificity, respectively.
[30] Lung sound ICBHI2017 [41]MFCCGRUGRU (gated recurrent unit) layers are used to solve the vanishing gradient problem in standard recurrent neural networks. Accuracy: 95.67 ± 0.77%.
[31] Lung sound From hospital Wavelet+LDABP neural networkWavelet de-noised and reduced the dimension of linear discriminant analysis. Accuracy: 92.5%.
[35] Lung sound RALE database WaveletSVM–LSTMResearch suggests that external sounds have non-linear characteristics. Therefore, the two feature sets of wavelets, bi-spectrum and bi-phasic, are analyzed through the SVM–LSTM Bayesian optimization algorithm model. The results show the SVM accuracy is 94.086%, the SVM–LSTM accuracy is 94.684%, the LSTM Bayesian optimization accuracy of WBS is 95.699%, and the LSTM accuracy is 95.161% and WBP, respectively.
[38] Lung sound ICBHI2017 [41]SpectrogramsCNN–MoEInitially, respiratory cycles or complete audio recordings are converted into spectrogram representations, which are then segmented into equal-sized image patches for training, incorporating mix-up data augmentation. Four types of spectrograms—log–Mel, Gammatone filter bank (Gamma), stacked Mel-frequency cepstral coefficients (MFCCs), and rectangular constant Q transform (CQT)—are analyzed. The Gamma spectrogram is found to be the most effective for classifying anomaly cycles, while the log–Mel spectrogram is superior for respiratory disease detection. The deep learning framework is augmented by a mixture-of-experts (MoEs) strategy, leading to the development of the CNN–MoE architecture. This architecture leverages the first six convolutional blocks to convert image patch inputs into high-level features, which a dense block then processes, consisting of a fully connected layer and a Softmax function. Additionally, the MoE block architecture incorporates multiple experts linked to a gating network that dictates the contribution of each expert based on the specific characteristics of the input.
[45] Idiopathic pulmonary fibrosis (IPF), non-specific interstitial pneumonia (NSIP), and chronic obstructive pulmonary disease (COPD) The study plans to enroll patients with ILD, COPD, and control subjects, each providing ten 30 s audio recordings. MFCCCNN, LSTM,
Transformer
Each patient provided 10 recordings from various anatomical sites. These recordings were pre-processed by applying a band-pass filter, transforming them into Mel frequency cepstral coefficients (MFCCs) and employing data augmentation techniques like amplitude scaling and pitch shift. The processed data were then analyzed using deep learning models, including CNNs, LSTMs, and transformer architectures, to perform binary classification for diagnostic purposes. Additionally, clinical data were integrated into the analysis to enhance predictive accuracy.
Disclaimer/Publisher’s Note: The statements, opinions and data contained in all publications are solely those of the individual author(s) and contributor(s) and not of MDPI and/or the editor(s). MDPI and/or the editor(s) disclaim responsibility for any injury to people or property resulting from any ideas, methods, instructions or products referred to in the content.

