
Exploiting Content Characteristics for Explainable Detection of Fake News


Abstract
1. Introduction
- RQ1: How do content characteristics differentiate between fake and legitimate news? While previous studies have explored various features for fake news detection, a comprehensive analysis of how diverse content characteristics differ between fake and legitimate news is still lacking. This question aims to fill this gap by thoroughly examining linguistic, moral, affective, perceptual, social, and cognitive features. Understanding these differences is crucial for developing more nuanced and accurate detection methods.
- RQ2: To what extent can traditional classifiers achieve competitive performance in fake news detection compared to advanced transformer-based models? Recent research has focused on complex deep-learning models, particularly transformer-based architectures. However, these models often require significant computational resources and lack interpretability. By comparing traditional classifiers to state-of-the-art models, we address the critical need for efficient and transparent solutions that can be readily deployed in real-world applications.
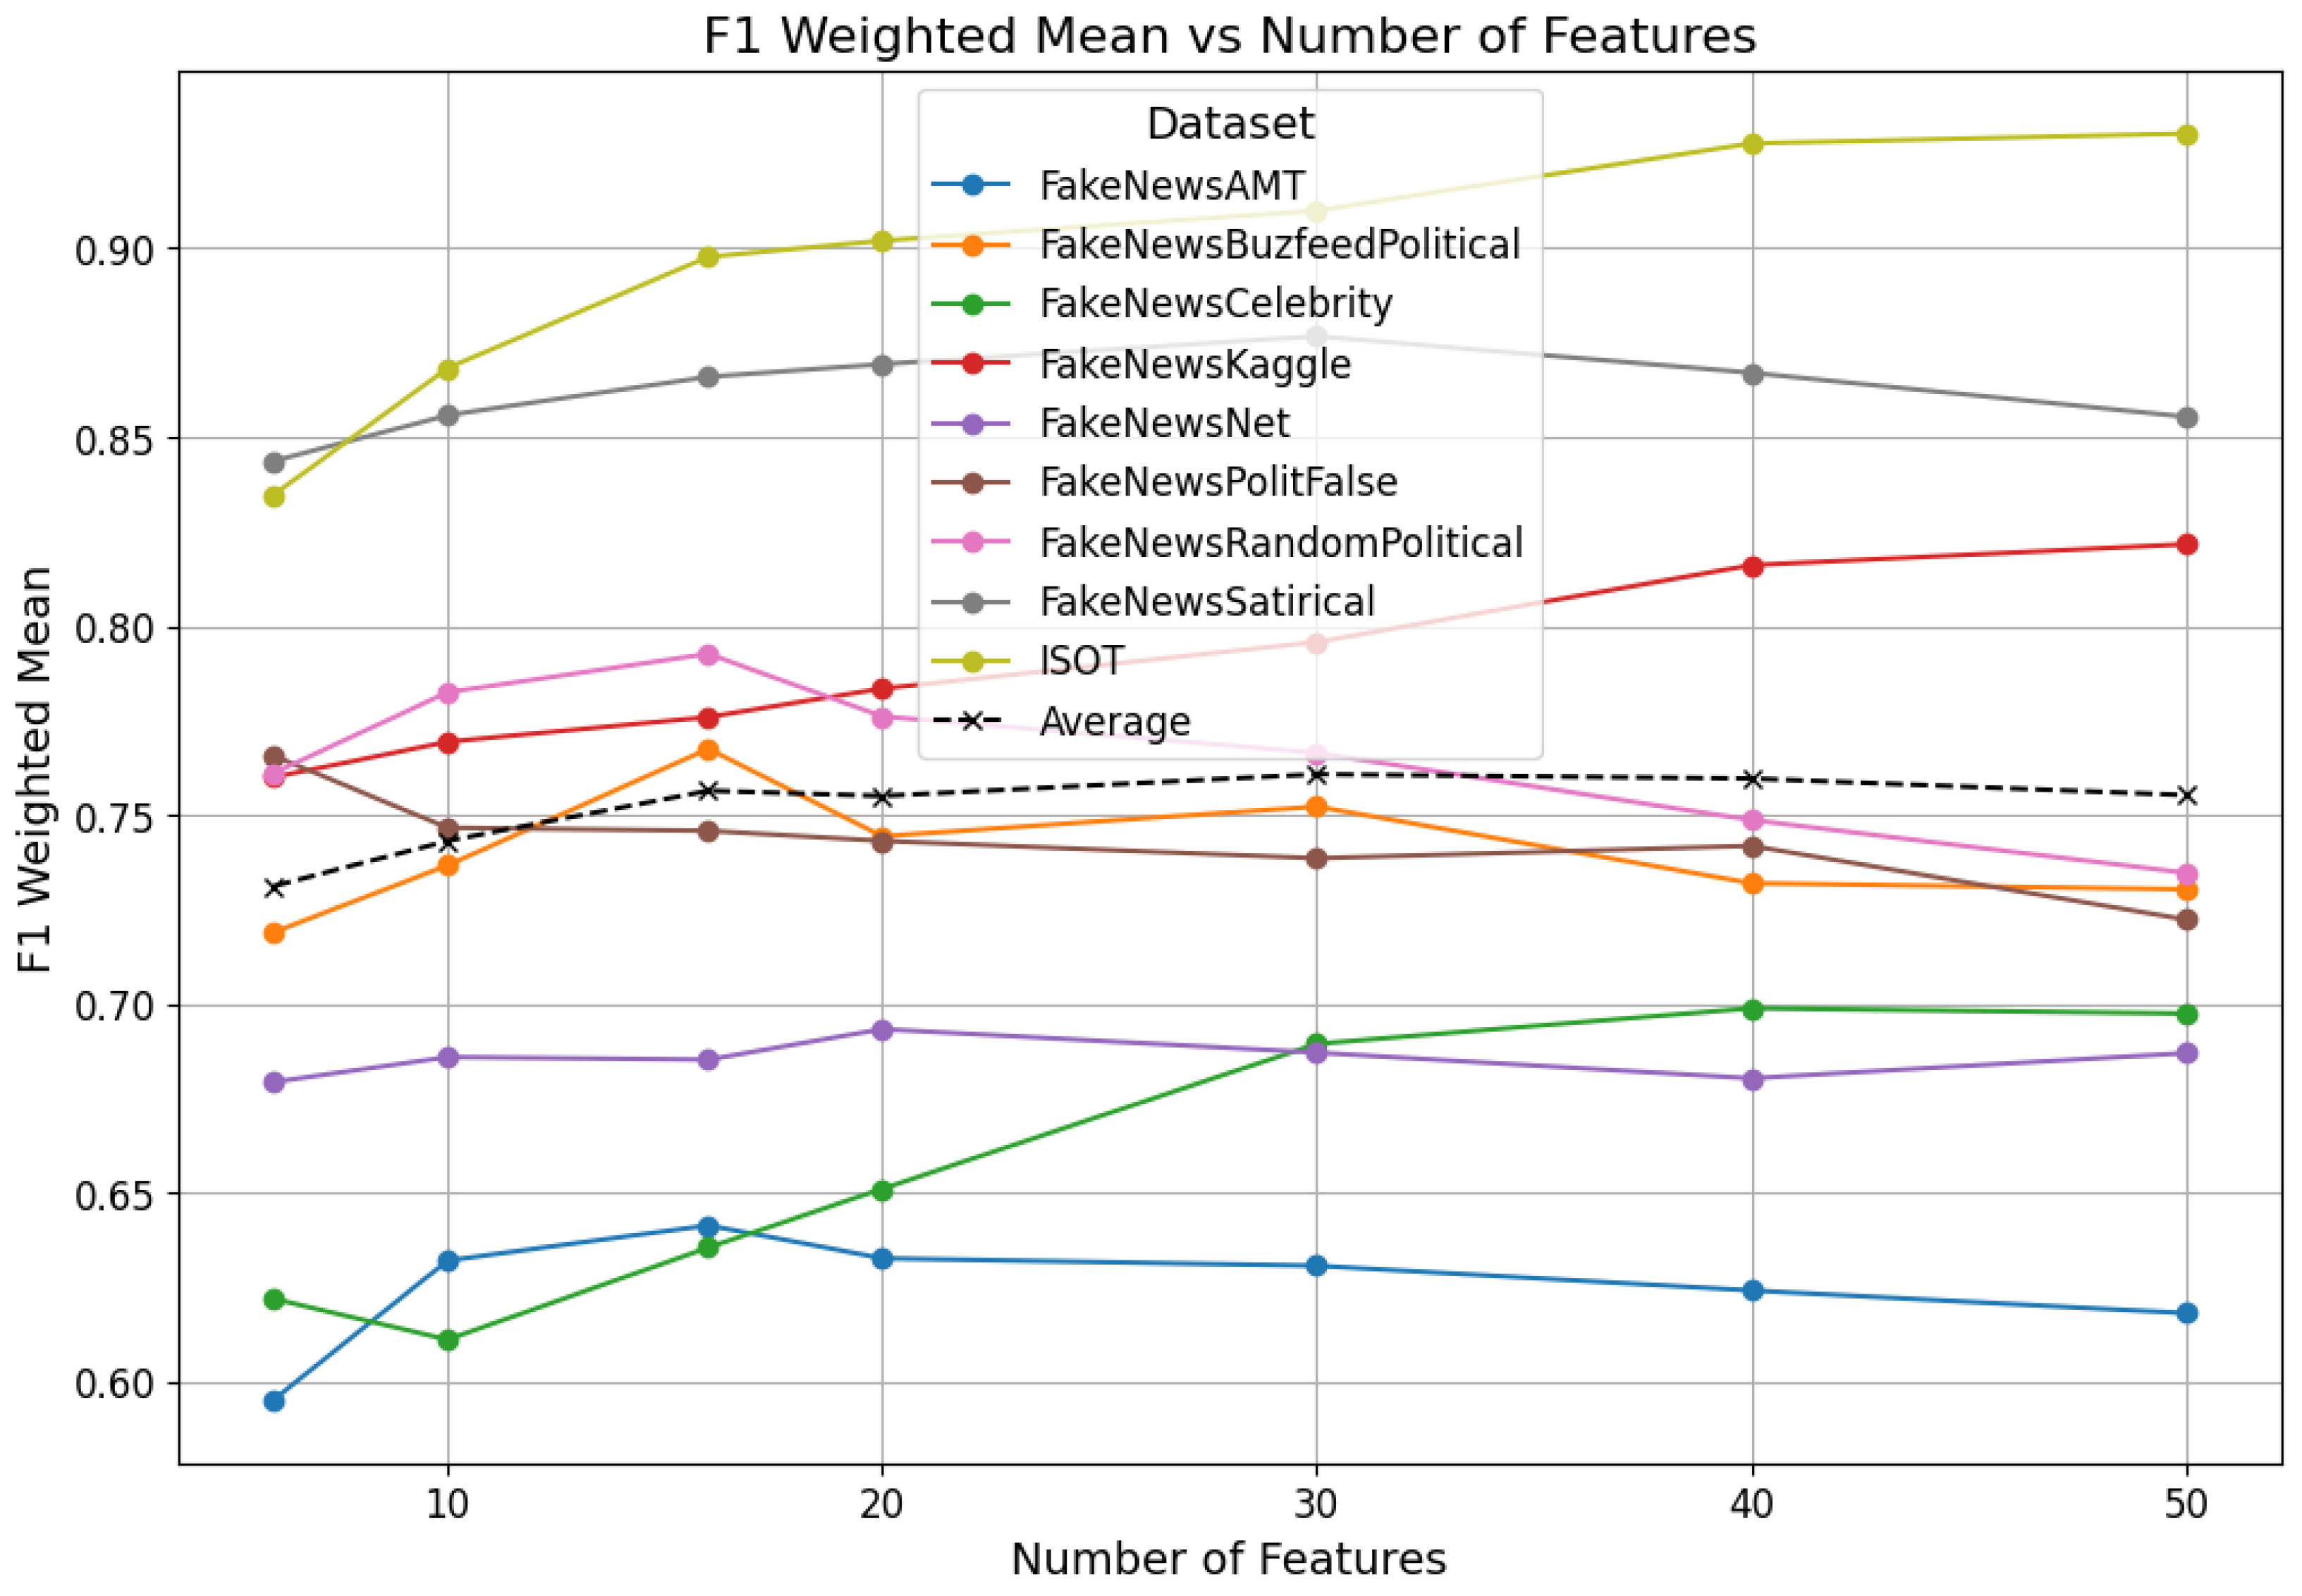
- RQ3: What is the impact of feature reduction on the effectiveness and efficiency of fake news detection systems? The trade-off between model complexity and performance is a persistent challenge in machine learning. This question addresses the gap in understanding how feature reduction affects the performance of fake news detection systems. By exploring this relationship, we aim to contribute to more practical and scalable solutions for real-world deployment.
2. Related Work
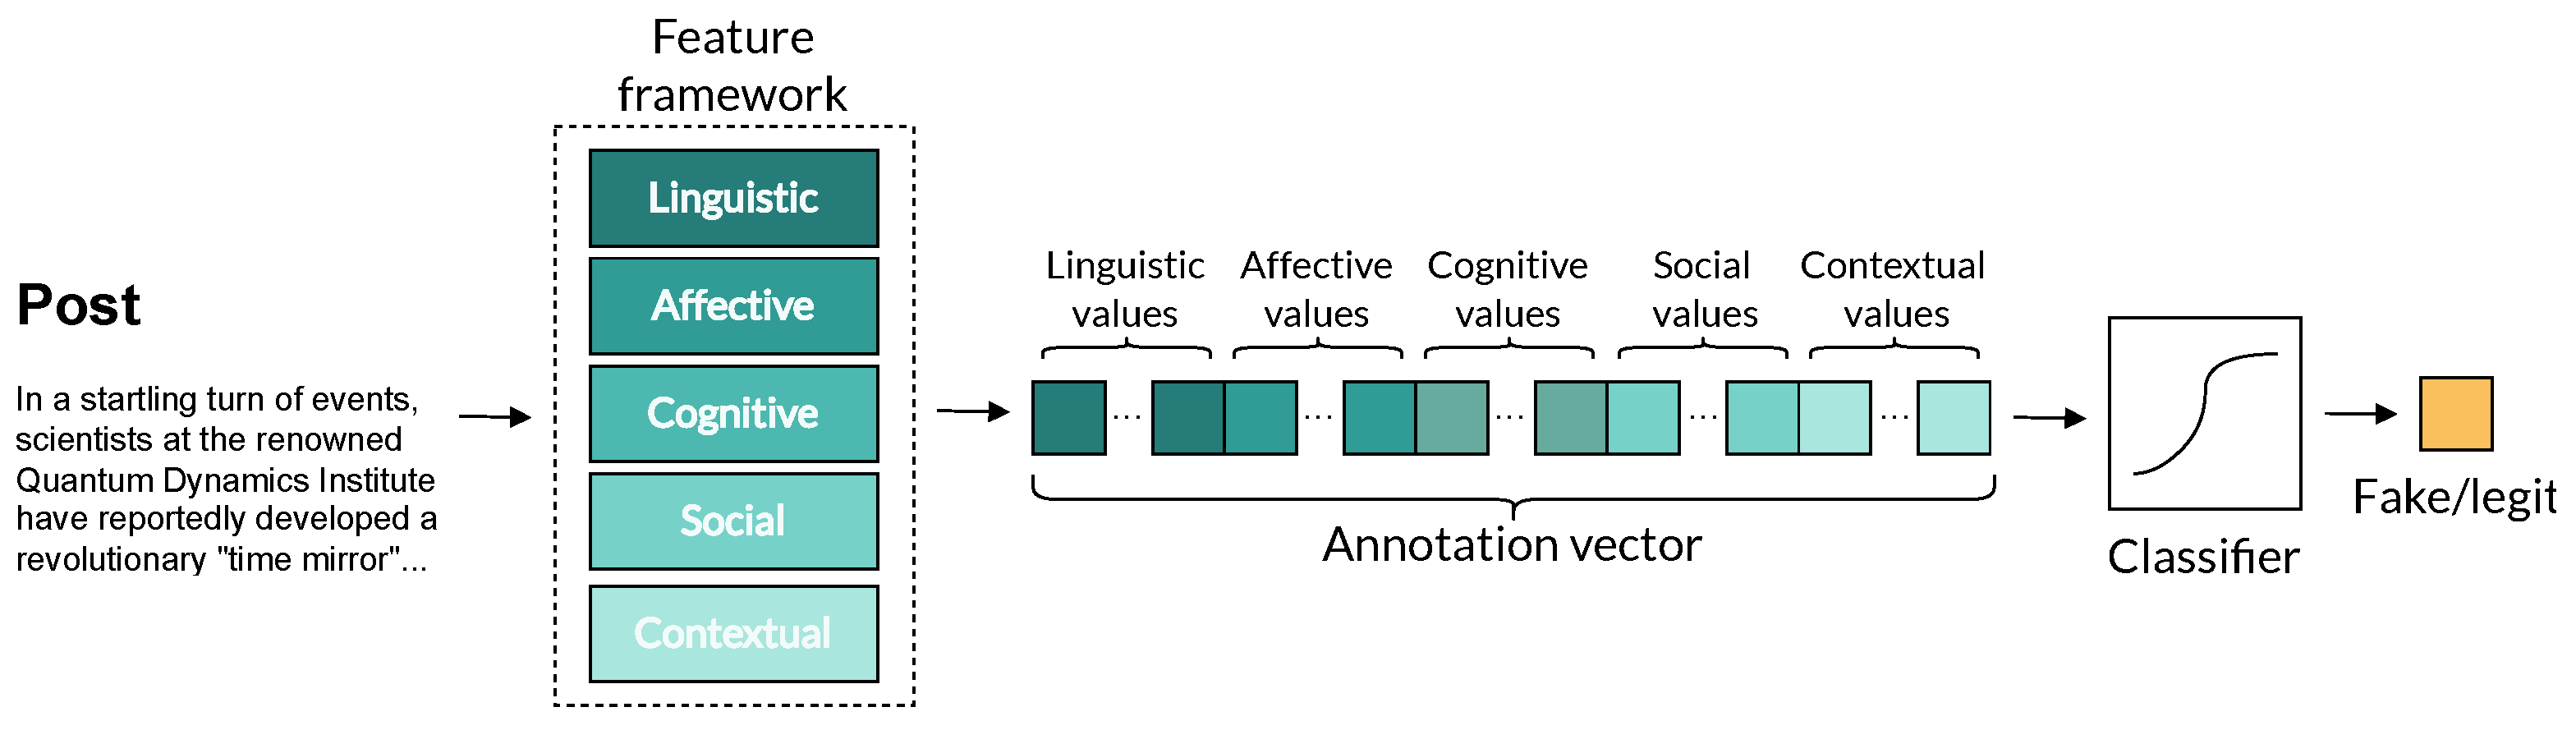
3. Methodology
| Algorithm 1 Construction of Feature Vector |
|
4. Evaluation
4.1. Datasets
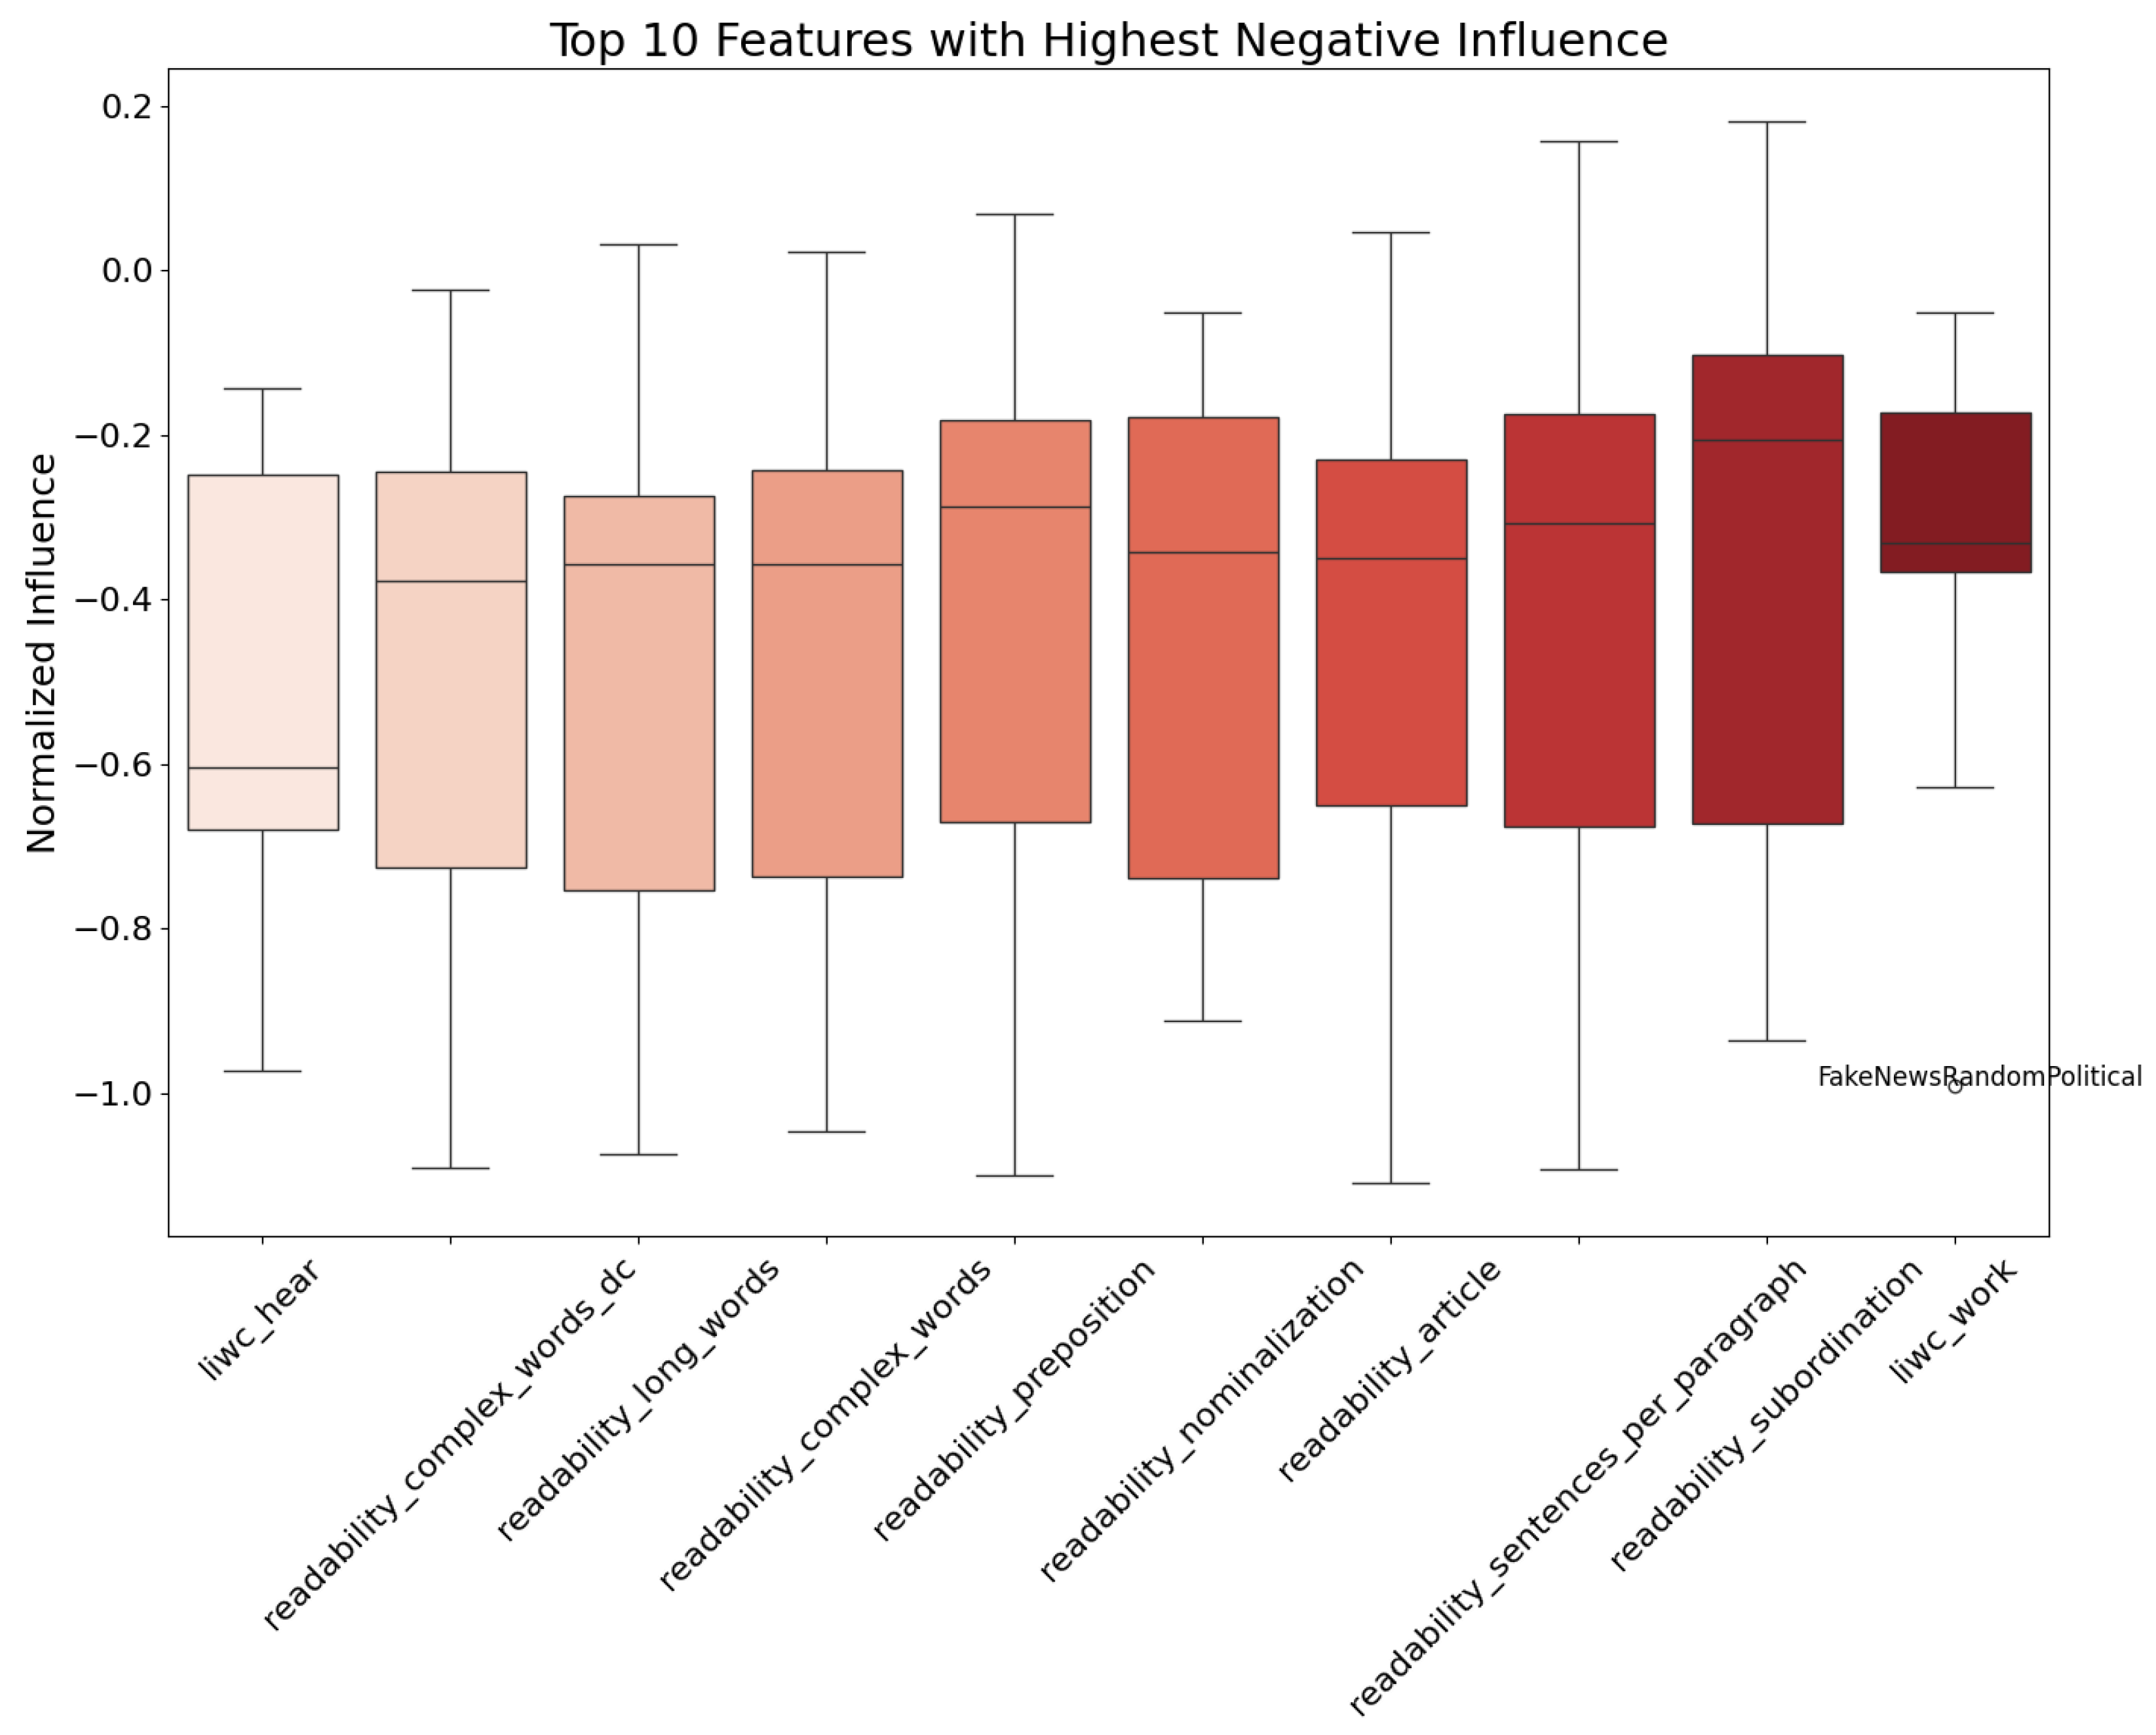
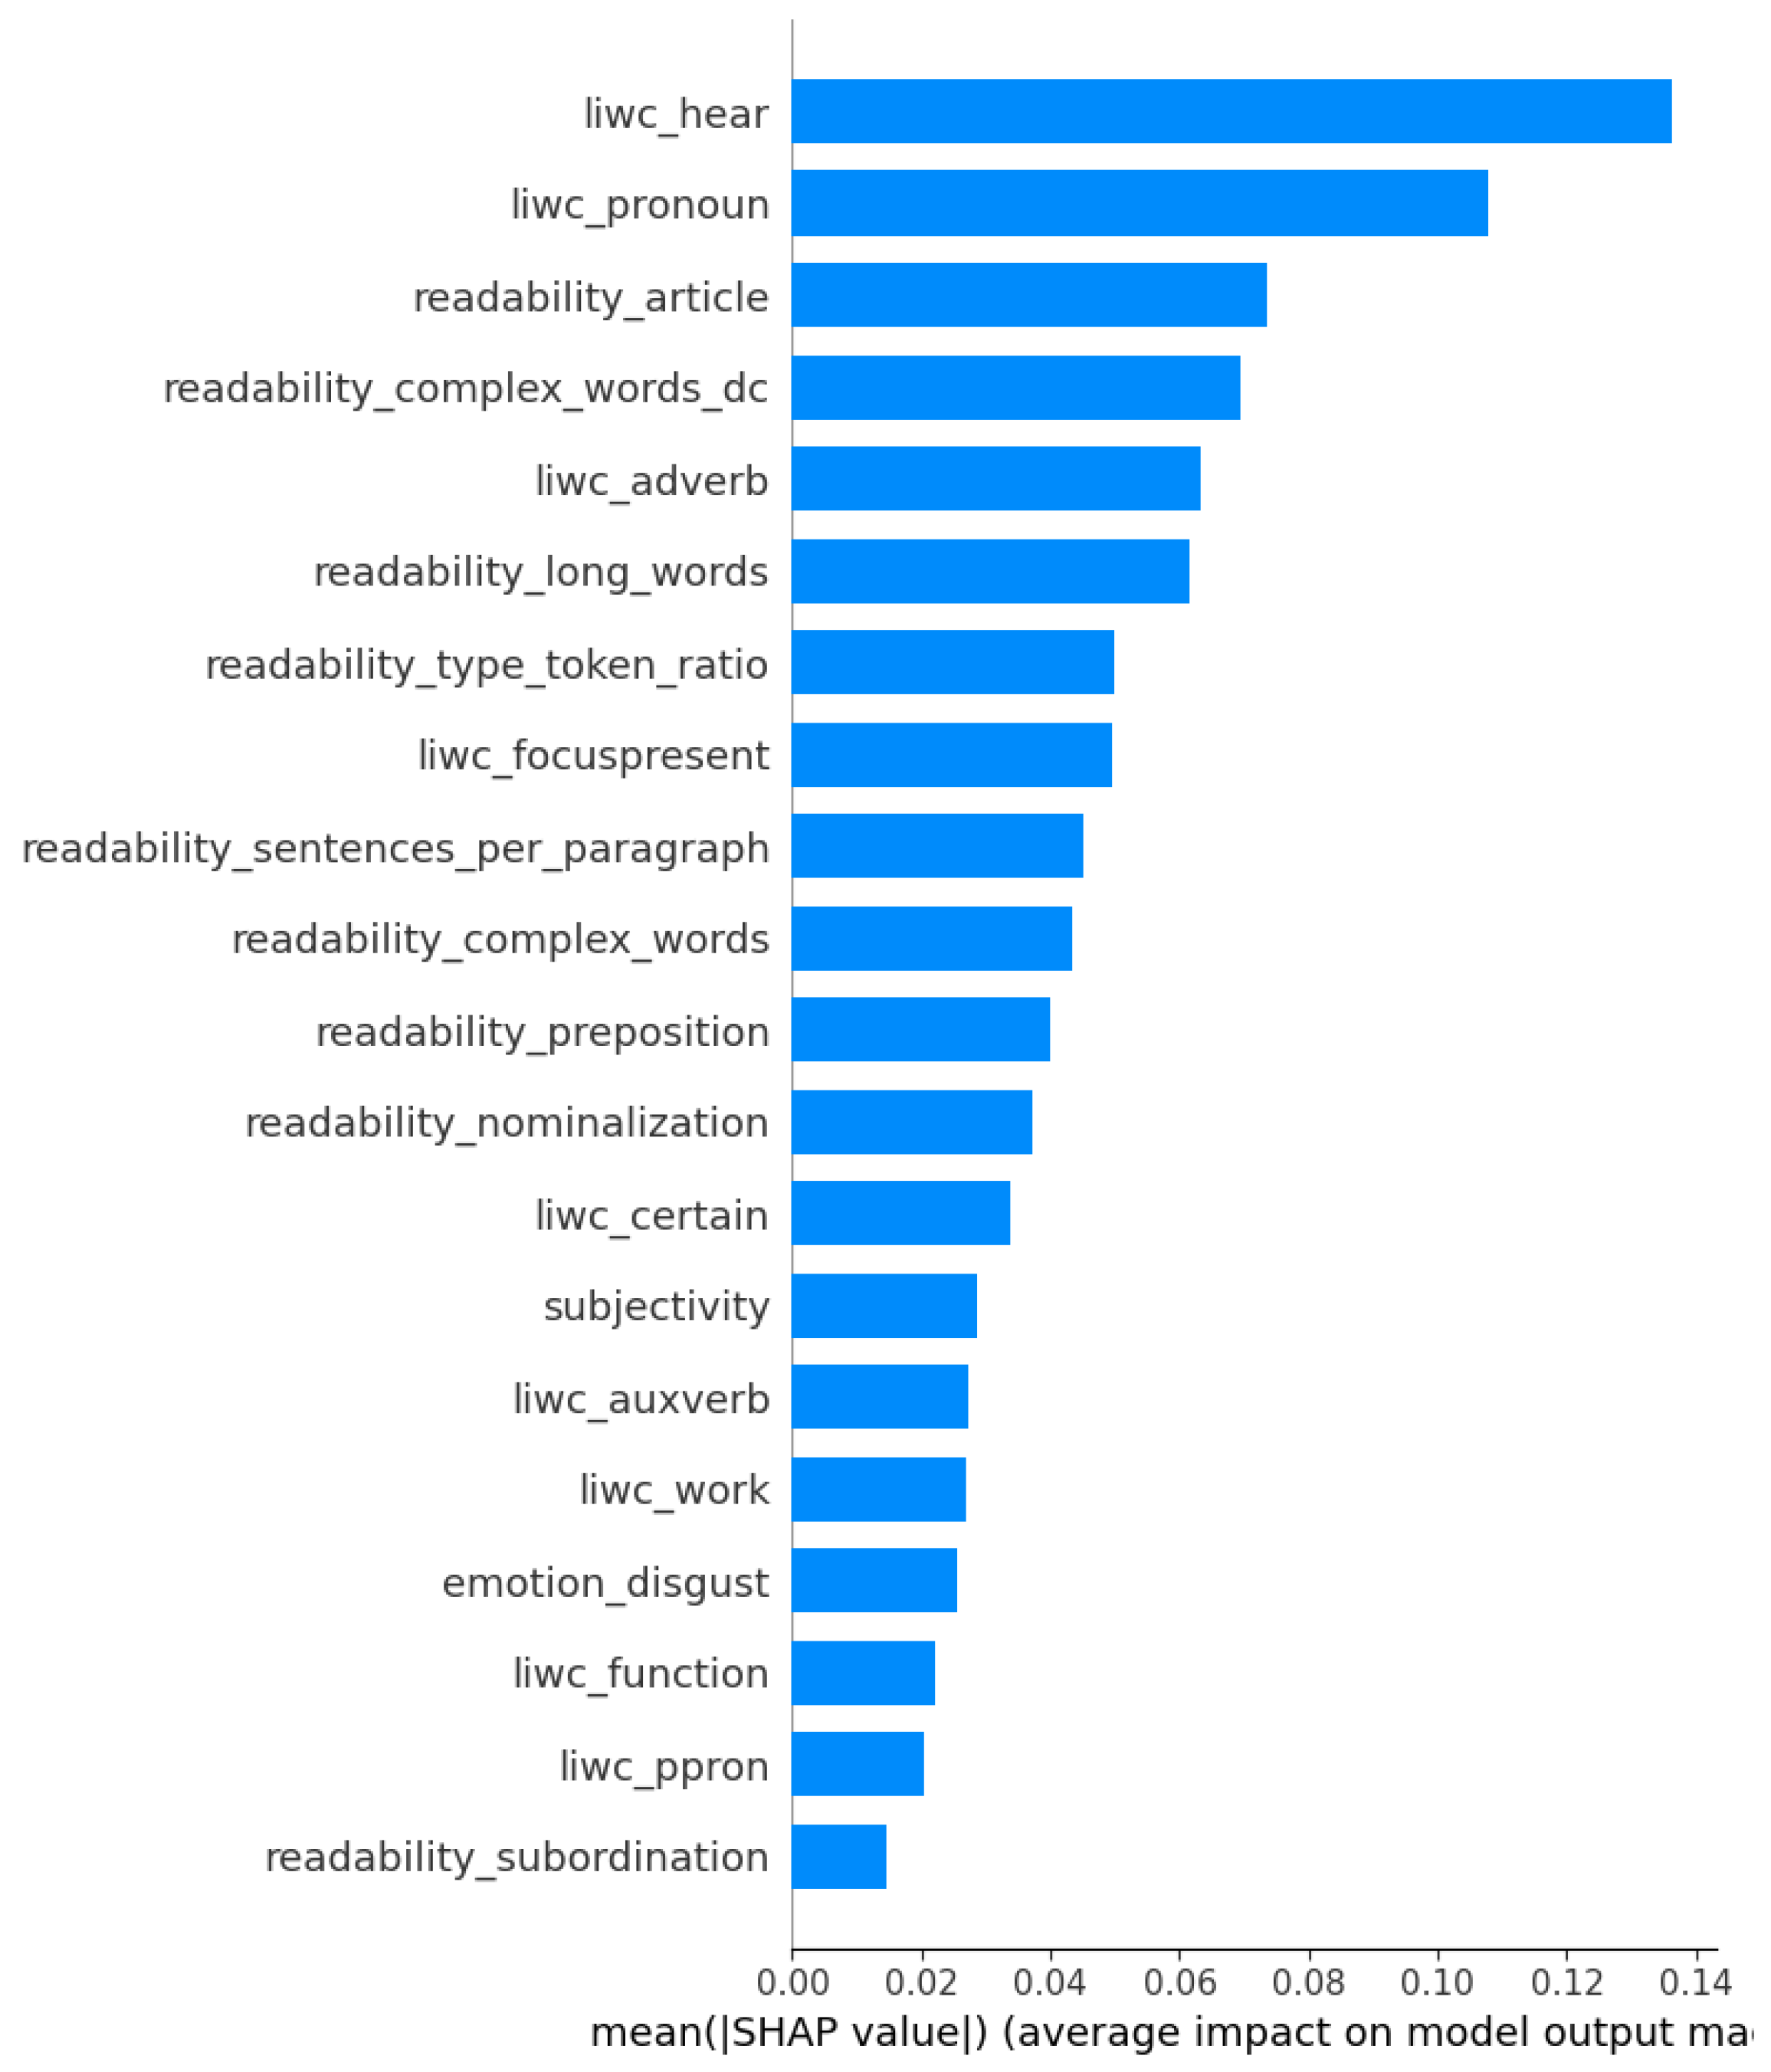
4.2. Preliminary Analysis
4.3. Classification Performance
5. Discussion
Author Contributions
Funding
Institutional Review Board Statement
Informed Consent Statement
Data Availability Statement
Acknowledgments
Conflicts of Interest
Abbreviations
| LIWC | Linguistic inquiry and word count |
| RQ | Research question |
| SHAP | Shapley additive explanations |
| VADER | Valence-Aware Dictionary and sEntiment Reasoner) |
References
- Parikh, S.B.; Patil, V.; Atrey, P.K. On the origin, proliferation and tone of fake news. In Proceedings of the 2019 IEEE Conference on Multimedia Information Processing and Retrieval (MIPR), San Jose, CA, USA, 28–30 March 2019; pp. 135–140. [Google Scholar]
- Sumpter, M.; Ciampaglia, G.L. Preserving the Integrity and Credibility of the Online Information Ecosystem. IEEE Data Eng. Bull. 2021, 44, 4–11. [Google Scholar]
- Molina, M.D.; Sundar, S.S.; Le, T.; Lee, D. “Fake news” is not simply false information: A concept explication and taxonomy of online content. Am. Behav. Sci. 2021, 65, 180–212. [Google Scholar] [CrossRef]
- Baptista, J.P.; Gradim, A. A working definition of fake news. Encyclopedia 2022, 2, 632–645. [Google Scholar] [CrossRef]
- Tsfati, Y.; Boomgaarden, H.G.; Strömbäck, J.; Vliegenthart, R.; Damstra, A.; Lindgren, E. Causes and consequences of mainstream media dissemination of fake news: Literature review and synthesis. Ann. Int. Commun. Assoc. 2020, 44, 157–173. [Google Scholar] [CrossRef]
- Mwangi, M. Technology and Fake News: Shaping Social, Political, and Economic Perspectives. Biomed. Sci. Clin. Res. 2023, 2, 221–236. [Google Scholar] [CrossRef]
- Karppi, T.; Crawford, K. Social media, financial algorithms and the hack crash. Theory Cult. Soc. 2016, 33, 73–92. [Google Scholar] [CrossRef]
- Rocha, Y.M.; De Moura, G.A.; Desidério, G.A.; De Oliveira, C.H.; Lourenço, F.D.; de Figueiredo Nicolete, L.D. The impact of fake news on social media and its influence on health during the COVID-19 pandemic: A systematic review. J. Public Health 2021, 31, 1007–1016. [Google Scholar] [CrossRef] [PubMed]
- Allcott, H.; Gentzkow, M. Social media and fake news in the 2016 election. J. Econ. Perspect. 2017, 31, 211–236. [Google Scholar] [CrossRef]
- Calvillo, D.P.; Rutchick, A.M.; Garcia, R.J. Individual differences in belief in fake news about election fraud after the 2020 US election. Behav. Sci. 2021, 11, 175. [Google Scholar] [CrossRef] [PubMed]
- Barrera, O.; Guriev, S.; Henry, E.; Zhuravskaya, E. Facts, alternative facts, and fact checking in times of post-truth politics. J. Public Econ. 2020, 182, 104123. [Google Scholar] [CrossRef]
- Mutahi, P. Fake news and the 2017 Kenyan elections. Commun. S. Afr. J. Commun. Theory Res. 2020, 46, 31–49. [Google Scholar] [CrossRef]
- Airlangga, G. Comparative Analysis of Machine Learning Algorithms for Detecting Fake News: Efficacy and Accuracy in the Modern Information Ecosystem. J. Comput. Netw. Archit. High Perform. Comput. 2024, 6, 354–363. [Google Scholar] [CrossRef]
- Al-Asadi, M.A.; Tasdemir, S. Using artificial intelligence against the phenomenon of fake news: A systematic literature review. Combat. Fake News Comput. Intell. Tech. 2022, 1001, 39–54. [Google Scholar]
- Kapusta, J.; Benko, L.; Munk, M. Fake news identification based on sentiment and frequency analysis. In Proceedings of the Innovation in Information Systems and Technologies to Support Learning Research; Proceedings of EMENA-ISTL 2019. Springer: Cham, Switzerland, 2020; pp. 400–409. [Google Scholar]
- Choudhary, A.; Arora, A. Linguistic feature based learning model for fake news detection and classification. Expert Syst. Appl. 2021, 169, 114171. [Google Scholar] [CrossRef]
- Verma, P.K.; Agrawal, P.; Amorim, I.; Prodan, R. WELFake: Word embedding over linguistic features for fake news detection. IEEE Trans. Comput. Soc. Syst. 2021, 8, 881–893. [Google Scholar] [CrossRef]
- Mridha, M.F.; Keya, A.J.; Hamid, M.A.; Monowar, M.M.; Rahman, M.S. A comprehensive review on fake news detection with deep learning. IEEE Access 2021, 9, 156151–156170. [Google Scholar] [CrossRef]
- Fields, J.; Chovanec, K.; Madiraju, P. A survey of text classification with transformers: How wide? How large? How long? How accurate? How expensive? How safe? IEEE Access 2024, 12, 6518–6531. [Google Scholar] [CrossRef]
- Azizah, S.F.N.; Cahyono, H.D.; Sihwi, S.W.; Widiarto, W. Performance Analysis of Transformer Based Models (BERT, ALBERT, and RoBERTa) in Fake News Detection. In Proceedings of the 2023 6th International Conference on Information and Communications Technology (ICOIACT), Yogyakarta, Indonesia, 10 November 2023; pp. 425–430. [Google Scholar]
- Naseer, M.; Windiatmaja, J.H.; Asvial, M.; Sari, R.F. RoBERTaEns: Deep Bidirectional Encoder Ensemble Model for Fact Verification. Big Data Cogn. Comput. 2022, 6, 33. [Google Scholar] [CrossRef]
- Patwardhan, N.; Marrone, S.; Sansone, C. Transformers in the real world: A survey on NLP applications. Information 2023, 14, 242. [Google Scholar] [CrossRef]
- Bakir, V.; McStay, A. Fake news and the economy of emotions: Problems, causes, solutions. Digit. J. 2018, 6, 154–175. [Google Scholar] [CrossRef]
- Hu, L.; Wei, S.; Zhao, Z.; Wu, B. Deep learning for fake news detection: A comprehensive survey. AI Open 2022, 3, 133–155. [Google Scholar] [CrossRef]
- Shu, K.; Sliva, A.; Wang, S.; Tang, J.; Liu, H. Fake news detection on social media: A data mining perspective. ACM SIGKDD Explor. Newsl. 2017, 19, 22–36. [Google Scholar] [CrossRef]
- Drif, A.; Hamida, Z.F.; Giordano, S. Fake news detection method based on text-features. Fr. Int. Acad. Res. Ind. Assoc. (IARIA) 2019, 27–32. [Google Scholar]
- Przybyla, P. Capturing the style of fake news. In Proceedings of the AAAI Conference on Artificial Intelligence, New York, NY, USA, 7–12 February 2020; Volume 34, pp. 490–497. [Google Scholar]
- Cao, J.; Qi, P.; Sheng, Q.; Yang, T.; Guo, J.; Li, J. Exploring the role of visual content in fake news detection. In Disinformation, Misinformation, and Fake News in Social Media: Emerging Research Challenges and Opportunities; Springer: Berlin/Heidelberg, Germany, 2020; pp. 141–161. [Google Scholar]
- Shu, K.; Wang, S.; Liu, H. Beyond news contents: The role of social context for fake news detection. In Proceedings of the Twelfth ACM International Conference on Web Search and Data Mining, New York, NY, USA, 11–15 February 2019; pp. 312–320. [Google Scholar]
- Reis, J.C.; Correia, A.; Murai, F.; Veloso, A.; Benevenuto, F. Supervised learning for fake news detection. IEEE Intell. Syst. 2019, 34, 76–81. [Google Scholar] [CrossRef]
- Hauschild, J.; Eskridge, K. Word embedding and classification methods and their effects on fake news detection. Mach. Learn. Appl. 2024, 17, 100566. [Google Scholar] [CrossRef]
- Muñoz, S.; Iglesias, C.A. A text classification approach to detect psychological stress combining a lexicon-based feature framework with distributional representations. Inf. Process. Manag. 2022, 59, 103011. [Google Scholar] [CrossRef]
- Muñoz, S.; Iglesias, C.Á. Detection of the Severity Level of Depression Signs in Text Combining a Feature-Based Framework with Distributional Representations. Appl. Sci. 2023, 13, 11695. [Google Scholar] [CrossRef]
- Ge, X.; Hao, S.; Li, Y.; Wei, B.; Zhang, M. Hierarchical co-attention selection network for interpretable fake news detection. Big Data Cogn. Comput. 2022, 6, 93. [Google Scholar] [CrossRef]
- Sastrawan, I.K.; Bayupati, I.P.A.; Arsa, D.M.S. Detection of fake news using deep learning CNN–RNN based methods. ICT Express 2022, 8, 396–408. [Google Scholar] [CrossRef]
- Goonathilake, M.P.; Kumara, P.V. CNN, RNN-LSTM based hybrid approach to detect state-of-the-art stance-based fake news on social media. In Proceedings of the 2020 20th International Conference on Advances in ICT for Emerging Regions (ICTer), Colombo, Sri Lanka, 4–7 November 2020; pp. 23–28. [Google Scholar]
- Comito, C.; Caroprese, L.; Zumpano, E. Multimodal fake news detection on social media: A survey of deep learning techniques. Soc. Netw. Anal. Min. 2023, 13, 101. [Google Scholar] [CrossRef]
- Ma, Z.; Luo, M.; Guo, H.; Zeng, Z.; Hao, Y.; Zhao, X. Event-Radar: Event-driven Multi-View Learning for Multimodal Fake News Detection. In Proceedings of the 62nd Annual Meeting of the Association for Computational Linguistics, (Volume 1: Long Papers), Bangkok, Thailand, 11–16 August 2024; pp. 5809–5821. [Google Scholar]
- Vaswani, A.; Shazeer, N.; Parmar, N.; Uszkoreit, J.; Jones, L.; Gomez, A.N.; Kaiser, Ł.; Polosukhin, I. Attention is all you need. Adv. Neural Inf. Process. Syst. 2017, 30, 6000–6010. [Google Scholar]
- Kaliyar, R.K.; Goswami, A.; Narang, P. FakeBERT: Fake news detection in social media with a BERT-based deep learning approach. Multimed. Tools Appl. 2021, 80, 11765–11788. [Google Scholar] [CrossRef] [PubMed]
- Almaliki, M.; Almars, A.M.; Gad, I.; Atlam, E.S. Abmm: Arabic bert-mini model for hate-speech detection on social media. Electronics 2023, 12, 1048. [Google Scholar] [CrossRef]
- Farhangian, F.; Cruz, R.M.; Cavalcanti, G.D. Fake news detection: Taxonomy and comparative study. Inf. Fusion 2024, 103, 102140. [Google Scholar] [CrossRef]
- Vilone, G.; Longo, L. Notions of explainability and evaluation approaches for explainable artificial intelligence. Inf. Fusion 2021, 76, 89–106. [Google Scholar] [CrossRef]
- Ribeiro, M.T.; Singh, S.; Guestrin, C. “Why Should I Trust You?”: Explaining the Predictions of Any Classifier. In Proceedings of the 22nd ACM SIGKDD International Conference on Knowledge Discovery and Data Mining, San Francisco, CA, USA, 13–17 August 2016; pp. 1135–1144. [Google Scholar]
- Reis, J.C.; Correia, A.; Murai, F.; Veloso, A.; Benevenuto, F. Explainable machine learning for fake news detection. In Proceedings of the 10th ACM Conference on Web Science, New York, NY, USA, 30 June 2019–3 July 2019; pp. 17–26. [Google Scholar]
- Liu, H.; Wang, W.; Li, H. Interpretable Multimodal Misinformation Detection with Logic Reasoning. arXiv 2023, arXiv:2305.05964. [Google Scholar]
- Han, L.; Zhang, X.; Zhou, Z.; Liu, Y. A Multifaceted Reasoning Network for Explainable Fake News Detection. Inf. Process. Manag. 2024, 61, 103822. [Google Scholar] [CrossRef]
- Garg, S.; Sharma, D.K. Linguistic features based framework for automatic fake news detection. Comput. Ind. Eng. 2022, 172, 108432. [Google Scholar] [CrossRef]
- Kondamudi, M.R.; Sahoo, S.R.; Chouhan, L.; Yadav, N. A comprehensive survey of fake news in social networks: Attributes, features, and detection approaches. J. King Saud-Univ.-Comput. Inf. Sci. 2023, 35, 101571. [Google Scholar] [CrossRef]
- Hu, B.; Mao, Z.; Zhang, Y. An Overview of Fake News Detection: From A New Perspective. Fundam. Res. 2024; in press. [Google Scholar]
- Shrestha, A.; Spezzano, F. Textual characteristics of news title and body to detect fake news: A reproducibility study. In Proceedings of the Advances in Information Retrieval: 43rd European Conference on IR Research, ECIR 2021, Virtual Event, 28 March–1 April 2021; Proceedings, Part II 43. Springer: Berlin/Heidelberg, Germany, 2021; pp. 120–133. [Google Scholar]
- Carrasco-Farré, C. The fingerprints of misinformation: How deceptive content differs from reliable sources in terms of cognitive effort and appeal to emotions. Humanit. Soc. Sci. Commun. 2022, 9, 162. [Google Scholar] [CrossRef]
- Pennebaker, J.W.; Francis, M.E.; Booth, R.J. Linguistic inquiry and word count: LIWC 2001. Mahway Lawrence Erlbaum Assoc. 2001, 71, 2001. [Google Scholar]
- Araque, O.; Gatti, L.; Kalimeri, K. MoralStrength: Exploiting a moral lexicon and embedding similarity for moral foundations prediction. Knowl.-Based Syst. 2020, 191, 105184. [Google Scholar] [CrossRef]
- Ahmed, H.; Traore, I.; Saad, S. Detecting opinion spams and fake news using text classification. Secur. Priv. 2018, 1, e9. [Google Scholar] [CrossRef]
- Shu, K.; Mahudeswaran, D.; Wang, S.; Lee, D.; Liu, H. FakeNewsNet: A Data Repository with News Content, Social Context and Dynamic Information for Studying Fake News on Social Media. arXiv 2018, arXiv:1809.01286. [Google Scholar] [CrossRef] [PubMed]
- Lifferth, W. Fake News. 2018. Available online: https://www.kaggle.com/competitions/fake-news/overview (accessed on 12 June 2024).
- Pérez-Rosas, V.; Kleinberg, B.; Lefevre, A.; Mihalcea, R. Automatic Detection of Fake News. In Proceedings of the 27th International Conference on Computational Linguistics, Santa Fe, NM, USA, 20–26 August 2018; pp. 3391–3401. [Google Scholar]
- Horne, B.; Adali, S. This just in: Fake news packs a lot in title, uses simpler, repetitive content in text body, more similar to satire than real news. In Proceedings of the International AAAI Conference on Web and Social Media, Montreal, QC, Canada, 15–18 May 2017; Volume 11, pp. 759–766. [Google Scholar]
- Asubiaro, T.V.; Rubin, V.L. Comparing features of fabricated and legitimate political news in digital environments (2016–2017). Proc. Assoc. Inf. Sci. Technol. 2018, 55, 747–750. [Google Scholar] [CrossRef]
- Rubin, V.L.; Conroy, N.; Chen, Y.; Cornwell, S. Fake news or truth? Using satirical cues to detect potentially misleading news. In Proceedings of the Second Workshop on Computational Approaches to Deception Detection, San Diego, CA, USA, 17 June 2016; pp. 7–17. [Google Scholar]
- Pedregosa, F.; Varoquaux, G.; Gramfort, A.; Michel, V.; Thirion, B.; Grisel, O.; Blondel, M.; Prettenhofer, P.; Weiss, R.; Dubourg, V.; et al. Scikit-learn: Machine Learning in Python. J. Mach. Learn. Res. 2011, 12, 2825–2830. [Google Scholar]
- Khan, J.Y.; Khondaker, M.T.I.; Afroz, S.; Uddin, G.; Iqbal, A. A benchmark study of machine learning models for online fake news detection. Mach. Learn. Appl. 2021, 4, 100032. [Google Scholar] [CrossRef]
- Lundberg, S.M.; Lee, S.I. A unified approach to interpreting model predictions. Adv. Neural Inf. Process. Syst. 2017, 30, 4765–4774. [Google Scholar]
- Nadeem, M.I.; Mohsan, S.A.H.; Ahmed, K.; Li, D.; Zheng, Z.; Shafiq, M.; Karim, F.K.; Mostafa, S.M. HyproBert: A fake news detection model based on deep hypercontext. Symmetry 2023, 15, 296. [Google Scholar] [CrossRef]
- Parmar, S.; Rahul. Fake news detection via graph-based Markov chains. Int. J. Inf. Technol. 2024, 16, 1333–1345. [Google Scholar] [CrossRef]


| Dataset | No. Posts (Fake/Legitimate) | Avg. Word Count | Avg. Char Count |
|---|---|---|---|
| FakeNewsNet | 372 (171/201) | 549 | 3087 |
| ISOT | 43,729 (21,416/22,313) | 415 | 2514 |
| FakeNewsKaggle | 17,759 (7401/10,358) | 524 | 4865 |
| FakeNewsAMT | 480 (240/240) | 123 | 735 |
| FakeNewsRandomPolitical | 150 (75/75) | 587 | 3611 |
| FakeNewsCelebrity | 500 (250/250) | 432 | 2443 |
| FakeNewsBuzfeedPolitical | 101 (48/53) | 936 | 5572 |
| FakeNewsPolitFalse | 274 (137/137) | 579 | 3506 |
| FakeNewsSatirical | 360 (180/180) | 543 | 3235 |
| Algorithm | Train Time (s) | Accuracy | Precision | Recall | F1 Score |
|---|---|---|---|---|---|
| CatBoost | 41.683 | 0.8146 ± 0.04 | 0.8184 ± 0.04 | 0.8129 ± 0.04 | 0.8122 ± 0.04 |
| DecisionTree | 0.846 | 0.7247 ± 0.04 | 0.7292 ± 0.04 | 0.7239 ± 0.03 | 0.7231 ± 0.03 |
| LinearSVC | 0.733 | 0.7539 ± 0.04 | 0.7575 ± 0.04 | 0.7541 ± 0.04 | 0.7533 ± 0.04 |
| LogReg | 0.172 | 0.7711 ± 0.04 | 0.7759 ± 0.04 | 0.7711 ± 0.04 | 0.7703 ± 0.04 |
| RF | 3.820 | 0.7895 ± 0.04 | 0.7949 ± 0.04 | 0.7890 ± 0.04 | 0.7875 ± 0.04 |
| XGBoost | 1.112 | 0.7933 ± 0.04 | 0.7991 ± 0.05 | 0.7931 ± 0.05 | 0.7919 ± 0.05 |
| BERT | 878.153 * | 0.8136 ± 0.13 | 0.8512 ± 0.04 | 0.8287 ± 0.04 | 0.8247 ± 0.05 |
| Dataset | Method | Precision | Recall | F1 Score |
|---|---|---|---|---|
| FakeNewsNet | XGBoost | 0.711648 | 0.709694 | 0.709650 |
| CatBoost | 0.742586 | 0.739279 | 0.738630 | |
| LogReg | 0.660303 | 0.655892 | 0.654180 | |
| BERT | 0.732913 | 0.728505 | 0.723411 | |
| SOTA [56] | 0.671 | 0.738 | 0.703 | |
| ISOT | XGBoost | 0.979265 | 0.979236 | 0.979234 |
| CatBoost | 0.979627 | 0.979602 | 0.979600 | |
| LogReg | 0.964471 | 0.964463 | 0.964463 | |
| BERT | 0.998788 | 0.998788 | 0.998788 | |
| SOTA [65] | 0.9912 | 0.9914 | 0.9920 | |
| FakeNewsKaggle | XGBoost | 0.880271 | 0.880455 | 0.880238 |
| CatBoost | 0.881027 | 0.881187 | 0.880855 | |
| LogReg | 0.844767 | 0.842896 | 0.843373 | |
| BERT | 0.997077 | 0.997072 | 0.997071 | |
| SOTA [66] | 0.946 | 0.918 | 0.932 | |
| FakeNewsAMT | XGBoost | 0.623906 | 0.622917 | 0.621729 |
| CatBoost | 0.654660 | 0.652083 | 0.651102 | |
| LogReg | 0.640252 | 0.639583 | 0.639195 | |
| BERT | 0.714853 | 0.712500 | 0.710773 | |
| SOTA [58] | 0.75 | 0.74 | 0.74 | |
| FakeNewsRandomPolitical | XGBoost | 0.810246 | 0.800000 | 0.798637 |
| CatBoost | 0.805006 | 0.800000 | 0.799210 | |
| LogReg | 0.788832 | 0.786667 | 0.786087 | |
| BERT | 0.804778 | 0.780000 | 0.778705 | |
| SOTA [48] | 0.96 | 0.92 | 0.94 | |
| FakeNewsCelebrity | XGBoost | 0.756078 | 0.754000 | 0.753462 |
| CatBoost | 0.772602 | 0.768000 | 0.767128 | |
| LogReg | 0.685015 | 0.682000 | 0.680640 | |
| BERT | 0.806663 | 0.796000 | 0.793851 | |
| SOTA [58] | 0.73 | 0.73 | 0.73 | |
| FakeNewsBuzfeedPolitical | XGBoost | 0.790064 | 0.762381 | 0.757566 |
| CatBoost | 0.874191 | 0.851429 | 0.849208 | |
| LogReg | 0.829941 | 0.801905 | 0.798560 | |
| BERT | 0.607238 | 0.603333 | 0.560449 | |
| SOTA [48] | 1.00 | 0.83 | 0.90 | |
| FakeNewsPolitFalse | XGBoost | 0.755926 | 0.748215 | 0.746870 |
| CatBoost | 0.778025 | 0.773805 | 0.773279 | |
| LogReg | 0.699198 | 0.696970 | 0.696204 | |
| BERT | 0.808530 | 0.795758 | 0.790898 | |
| SOTA * | - | - | - | |
| FakeNewsSatirical | XGBoost | 0.884115 | 0.880556 | 0.880124 |
| CatBoost | 0.886940 | 0.886111 | 0.886028 | |
| LogReg | 0.870373 | 0.869444 | 0.869386 | |
| BERT | 0.913607 | 0.911111 | 0.910793 | |
| SOTA [61] | 0.88 | 0.82 | 0.87 |
| Algorithm | Original Training Time (s) | New Training Time (s) | Reduction (%) |
|---|---|---|---|
| CatBoost | 41.683 | 12.912 | 69.03% |
| DecisionTree | 0.846 | 0.229 | 72.94% |
| LinearSVC | 0.733 | 0.078 | 89.36% |
| LogisticRegression | 0.172 | 0.026 | 84.77% |
| RandomForest | 3.820 | 1.968 | 48.52% |
| XGBoost | 1.112 | 0.308 | 72.29% |
Disclaimer/Publisher’s Note: The statements, opinions and data contained in all publications are solely those of the individual author(s) and contributor(s) and not of MDPI and/or the editor(s). MDPI and/or the editor(s) disclaim responsibility for any injury to people or property resulting from any ideas, methods, instructions or products referred to in the content. |
© 2024 by the authors. Licensee MDPI, Basel, Switzerland. This article is an open access article distributed under the terms and conditions of the Creative Commons Attribution (CC BY) license (https://creativecommons.org/licenses/by/4.0/).
Share and Cite
Muñoz, S.; Iglesias, C.Á. Exploiting Content Characteristics for Explainable Detection of Fake News. Big Data Cogn. Comput. 2024, 8, 129. https://doi.org/10.3390/bdcc8100129
Muñoz S, Iglesias CÁ. Exploiting Content Characteristics for Explainable Detection of Fake News. Big Data and Cognitive Computing. 2024; 8(10):129. https://doi.org/10.3390/bdcc8100129
Chicago/Turabian StyleMuñoz, Sergio, and Carlos Á. Iglesias. 2024. "Exploiting Content Characteristics for Explainable Detection of Fake News" Big Data and Cognitive Computing 8, no. 10: 129. https://doi.org/10.3390/bdcc8100129
APA StyleMuñoz, S., & Iglesias, C. Á. (2024). Exploiting Content Characteristics for Explainable Detection of Fake News. Big Data and Cognitive Computing, 8(10), 129. https://doi.org/10.3390/bdcc8100129