
Quantifying Variations in Controversial Discussions within Kuwaiti Social Networks


Abstract
1. Introduction
- Social Network Graph-Based Stance Semi-Supervised Classification: The implementation of a GCN and FP classification algorithm based on [15,16], inspired by the success of the approach in the political domain [4], to detect user stances with high accuracy (96%) in the presence of incomplete features.
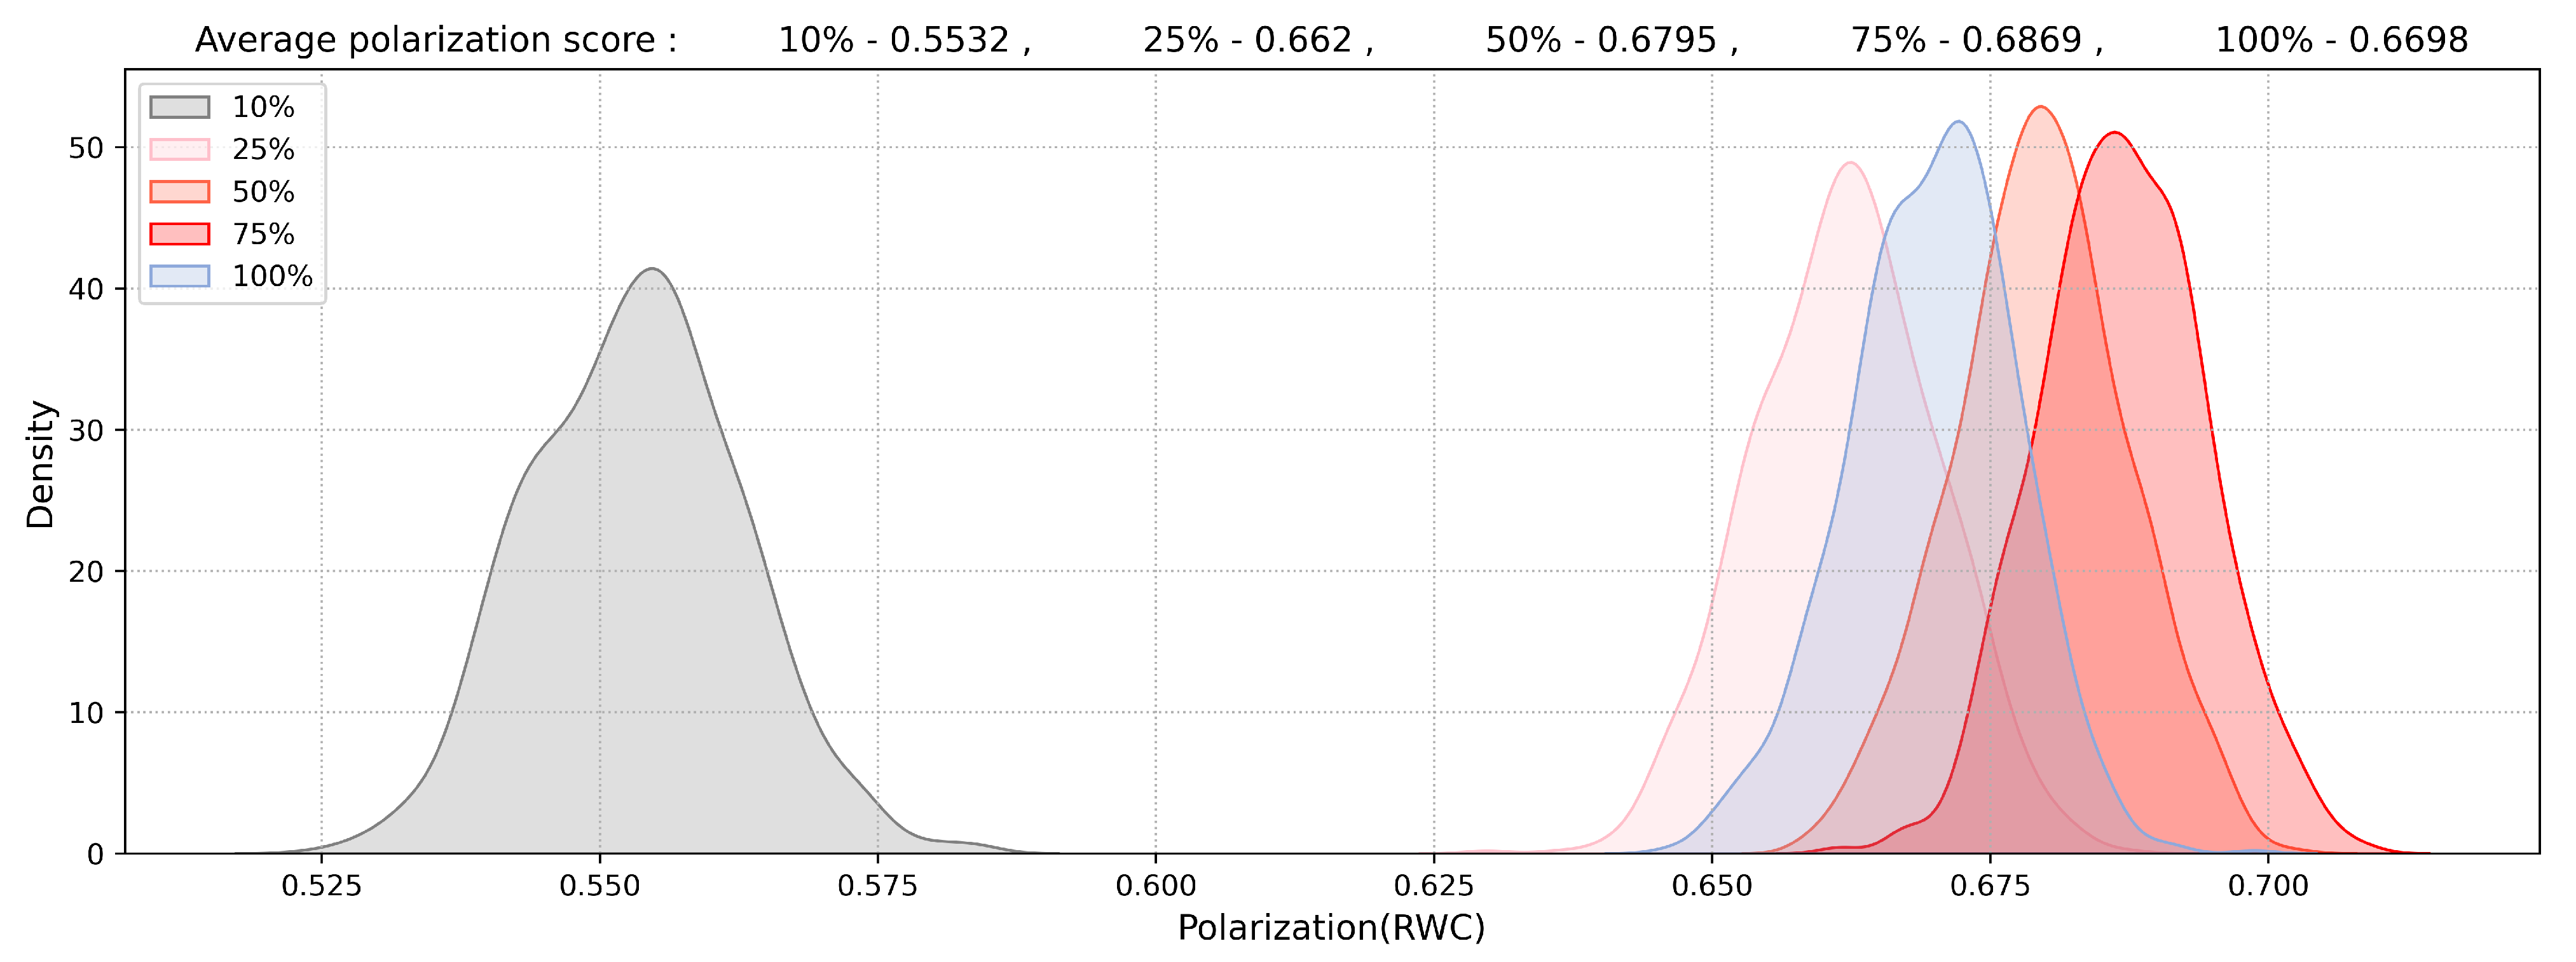
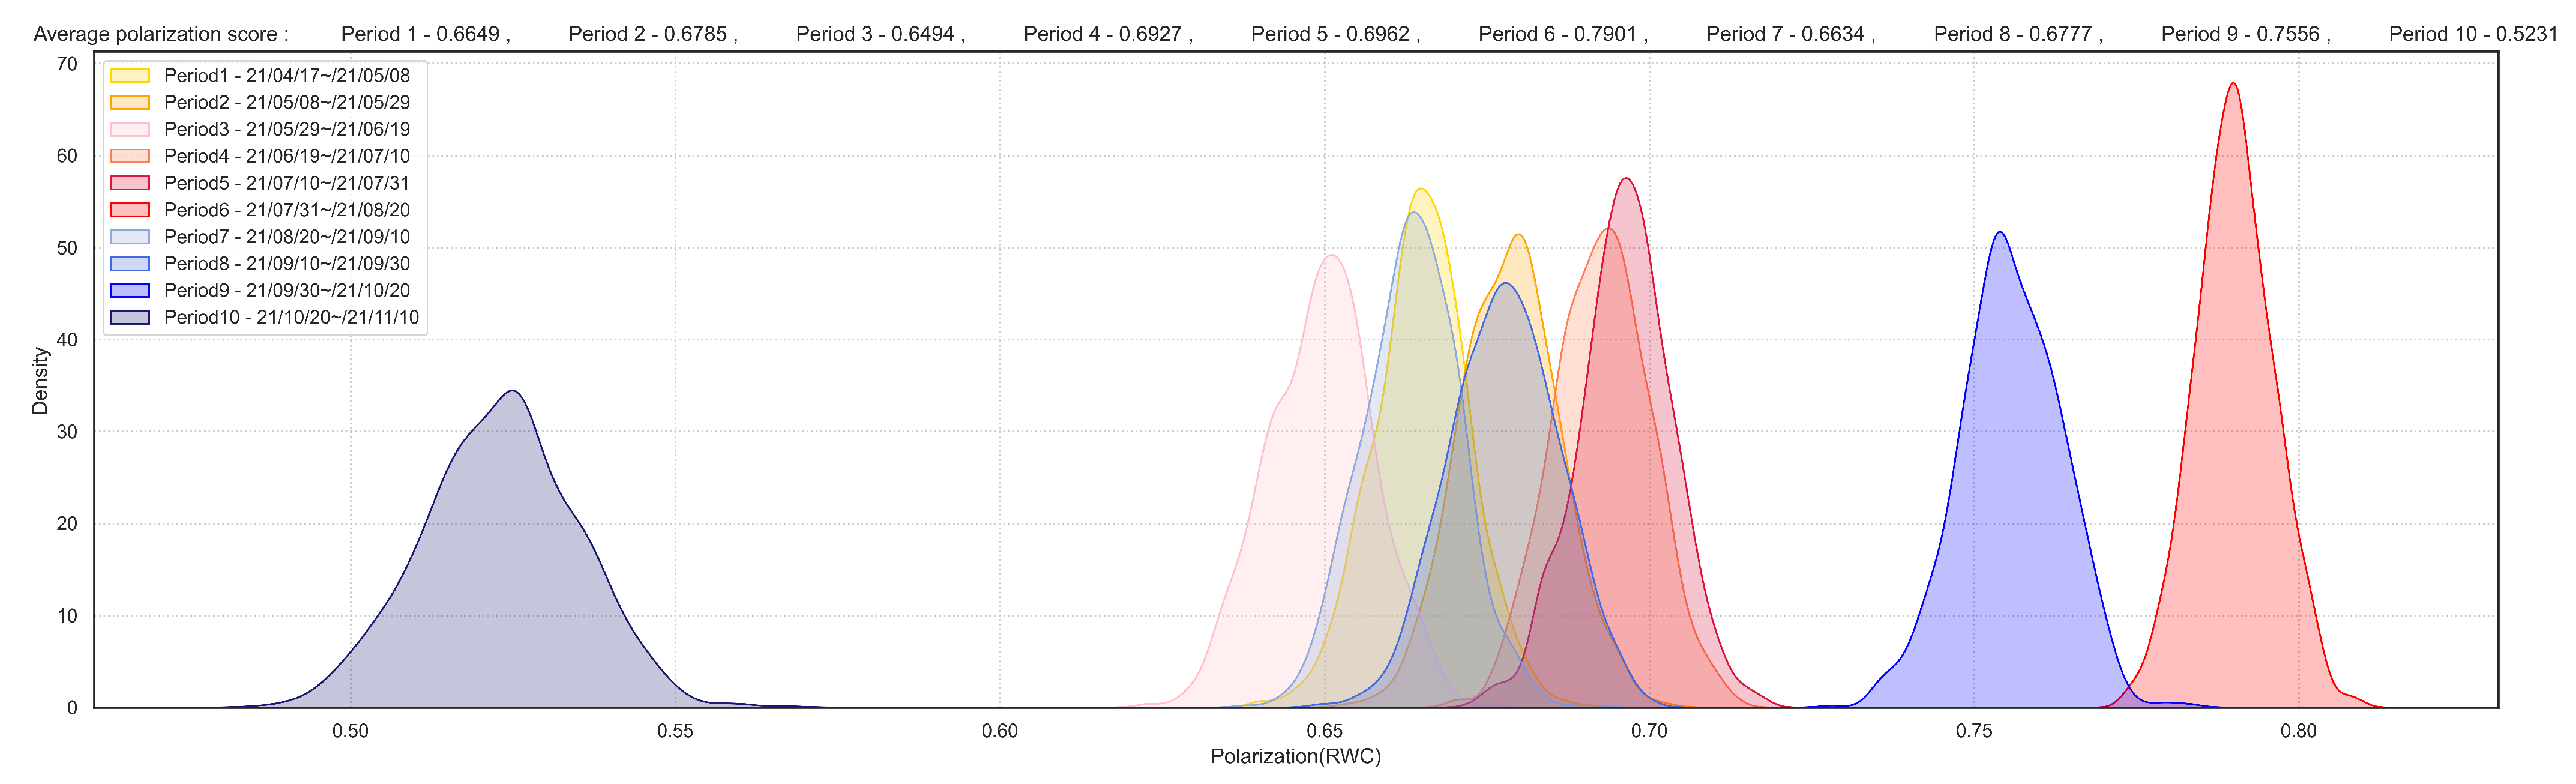
- Measurement of Effects: The application of the RWC score [17] to measure the polarization effects and detect points of controversy between social network users regarding their stance on vaccines.
- Detecting Factors of Polarization: The detection of divergent social network points and an investigation of the factors driving debates and arguments between users during polarization periods.
2. Related Work
2.1. Graph-Based Semi-Supervised Node Classification
2.2. Measuring Polarized Network
2.3. Vaccine Stance Detection Using Graph Network Algorithms
2.4. Studies of COVID-19 Vaccination in Kuwait
3. Methodology
3.1. Dataset Collection
3.2. Dataset Preparation
- User who retweeted: the user who retweeted a post originally posted by another user;
- Retweeted user: the username of the person who posted the original tweet;
- Tweet id: the unique identifier of the original post;
- Tweet text: the text content of the original post;
- Tweet clean text: the text content of the original post after it had been cleaned and prepared for analysis;
- Tweet stance: the label indicating the post’s vaccine stance;
- Extracted URLs: the list of URLs extracted from the post’s text;
- Extracted hashtags: the list of hashtags extracted.
3.3. User Stance and Network Polarization Detection System Architecture
3.4. Stance Detection Using Graph Convolutional Network and Feature Propagation
- is the feature matrix at layer i, is initialized to the feature matrix X, and at each layer, the feature matrix will be replaced with the previous layer’s output ;
- represents the activation function;
- is and is the graph’s adjacency matrix with added self-connections, where (A) is the social network graph adjacency matrix that contains the encoding of the network graph structure, and I is the identity matrix;
- W is the layer weights and feature vectors for each node propagating in each iteration. After a certain number of iterations, the feature vectors aggregate and transform their neighboring nodes’ representation vectors ().
3.5. Measuring Network Polarization
- Building a conversation graph about a topic;
- Partitioning the conversation graph to identify the potential sides of the controversy;
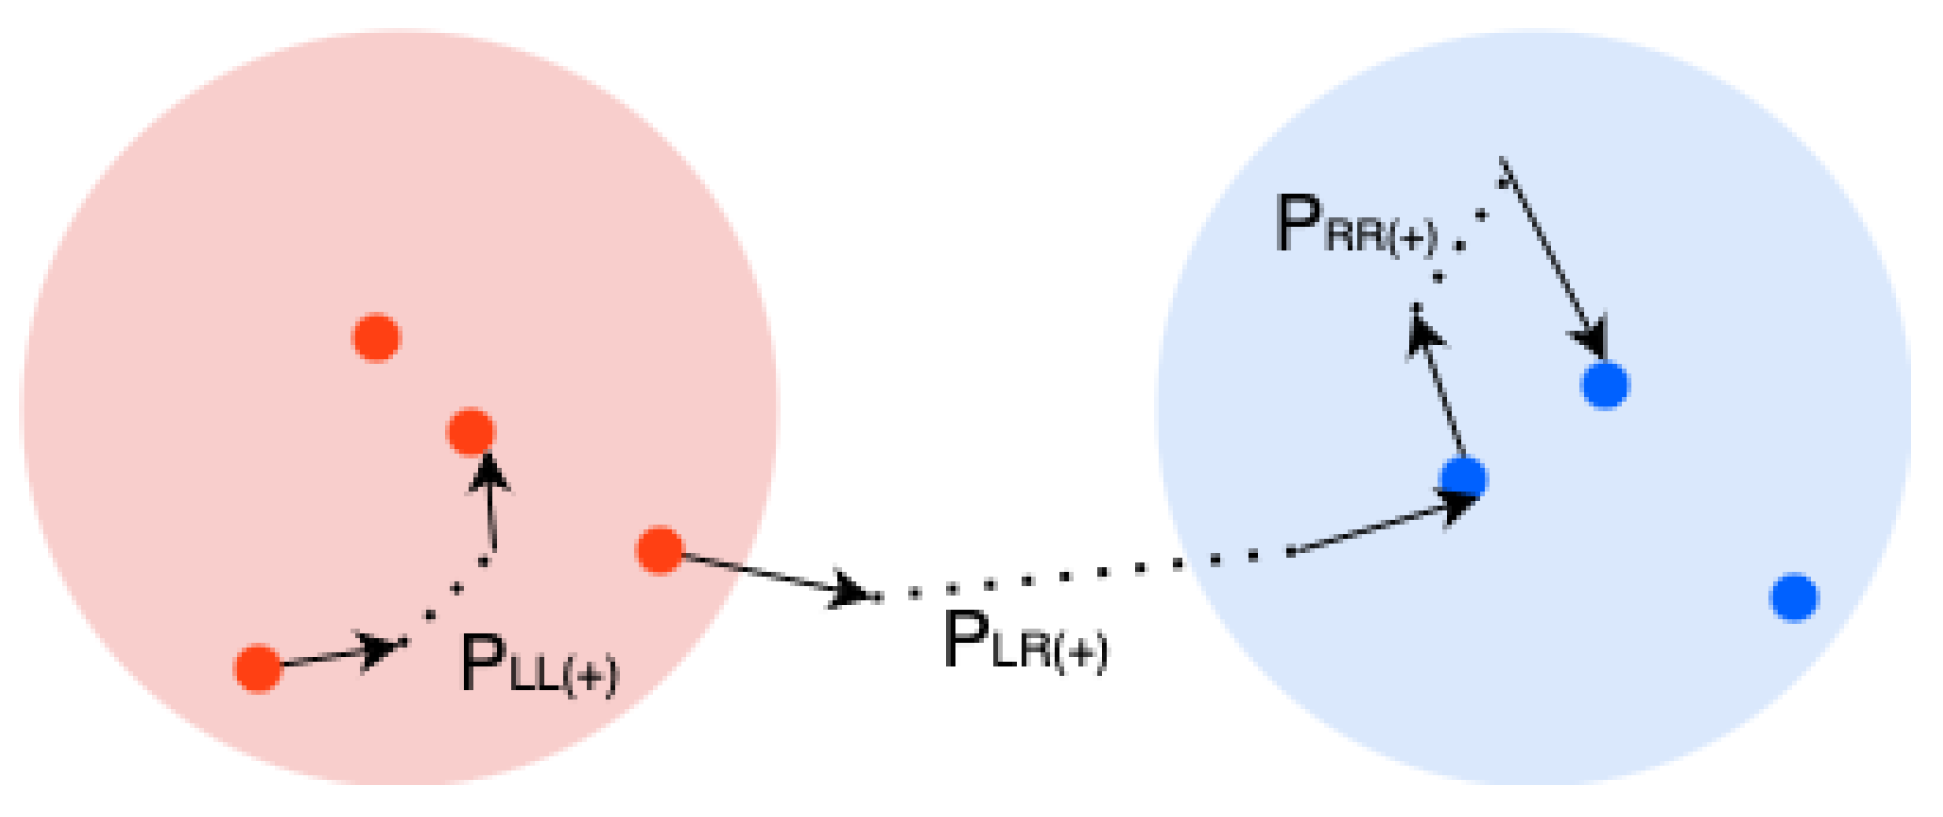
- Measuring the amount of controversy from graph characteristics using the RWC score.
- represents the probability of a random walk starting at a random left node and finishing at a central left node ;
- is the probability of starting on any right node and ending on a central right node ;
- and measure the probability of a walk crossing sides;
- C denotes the number of walks that fall into one of the previously identified classes.
4. Experiment Results
4.1. Dataset Collection and Preparation
4.2. Stance Detection Using Graph Convolutional Network and Feature Propagation
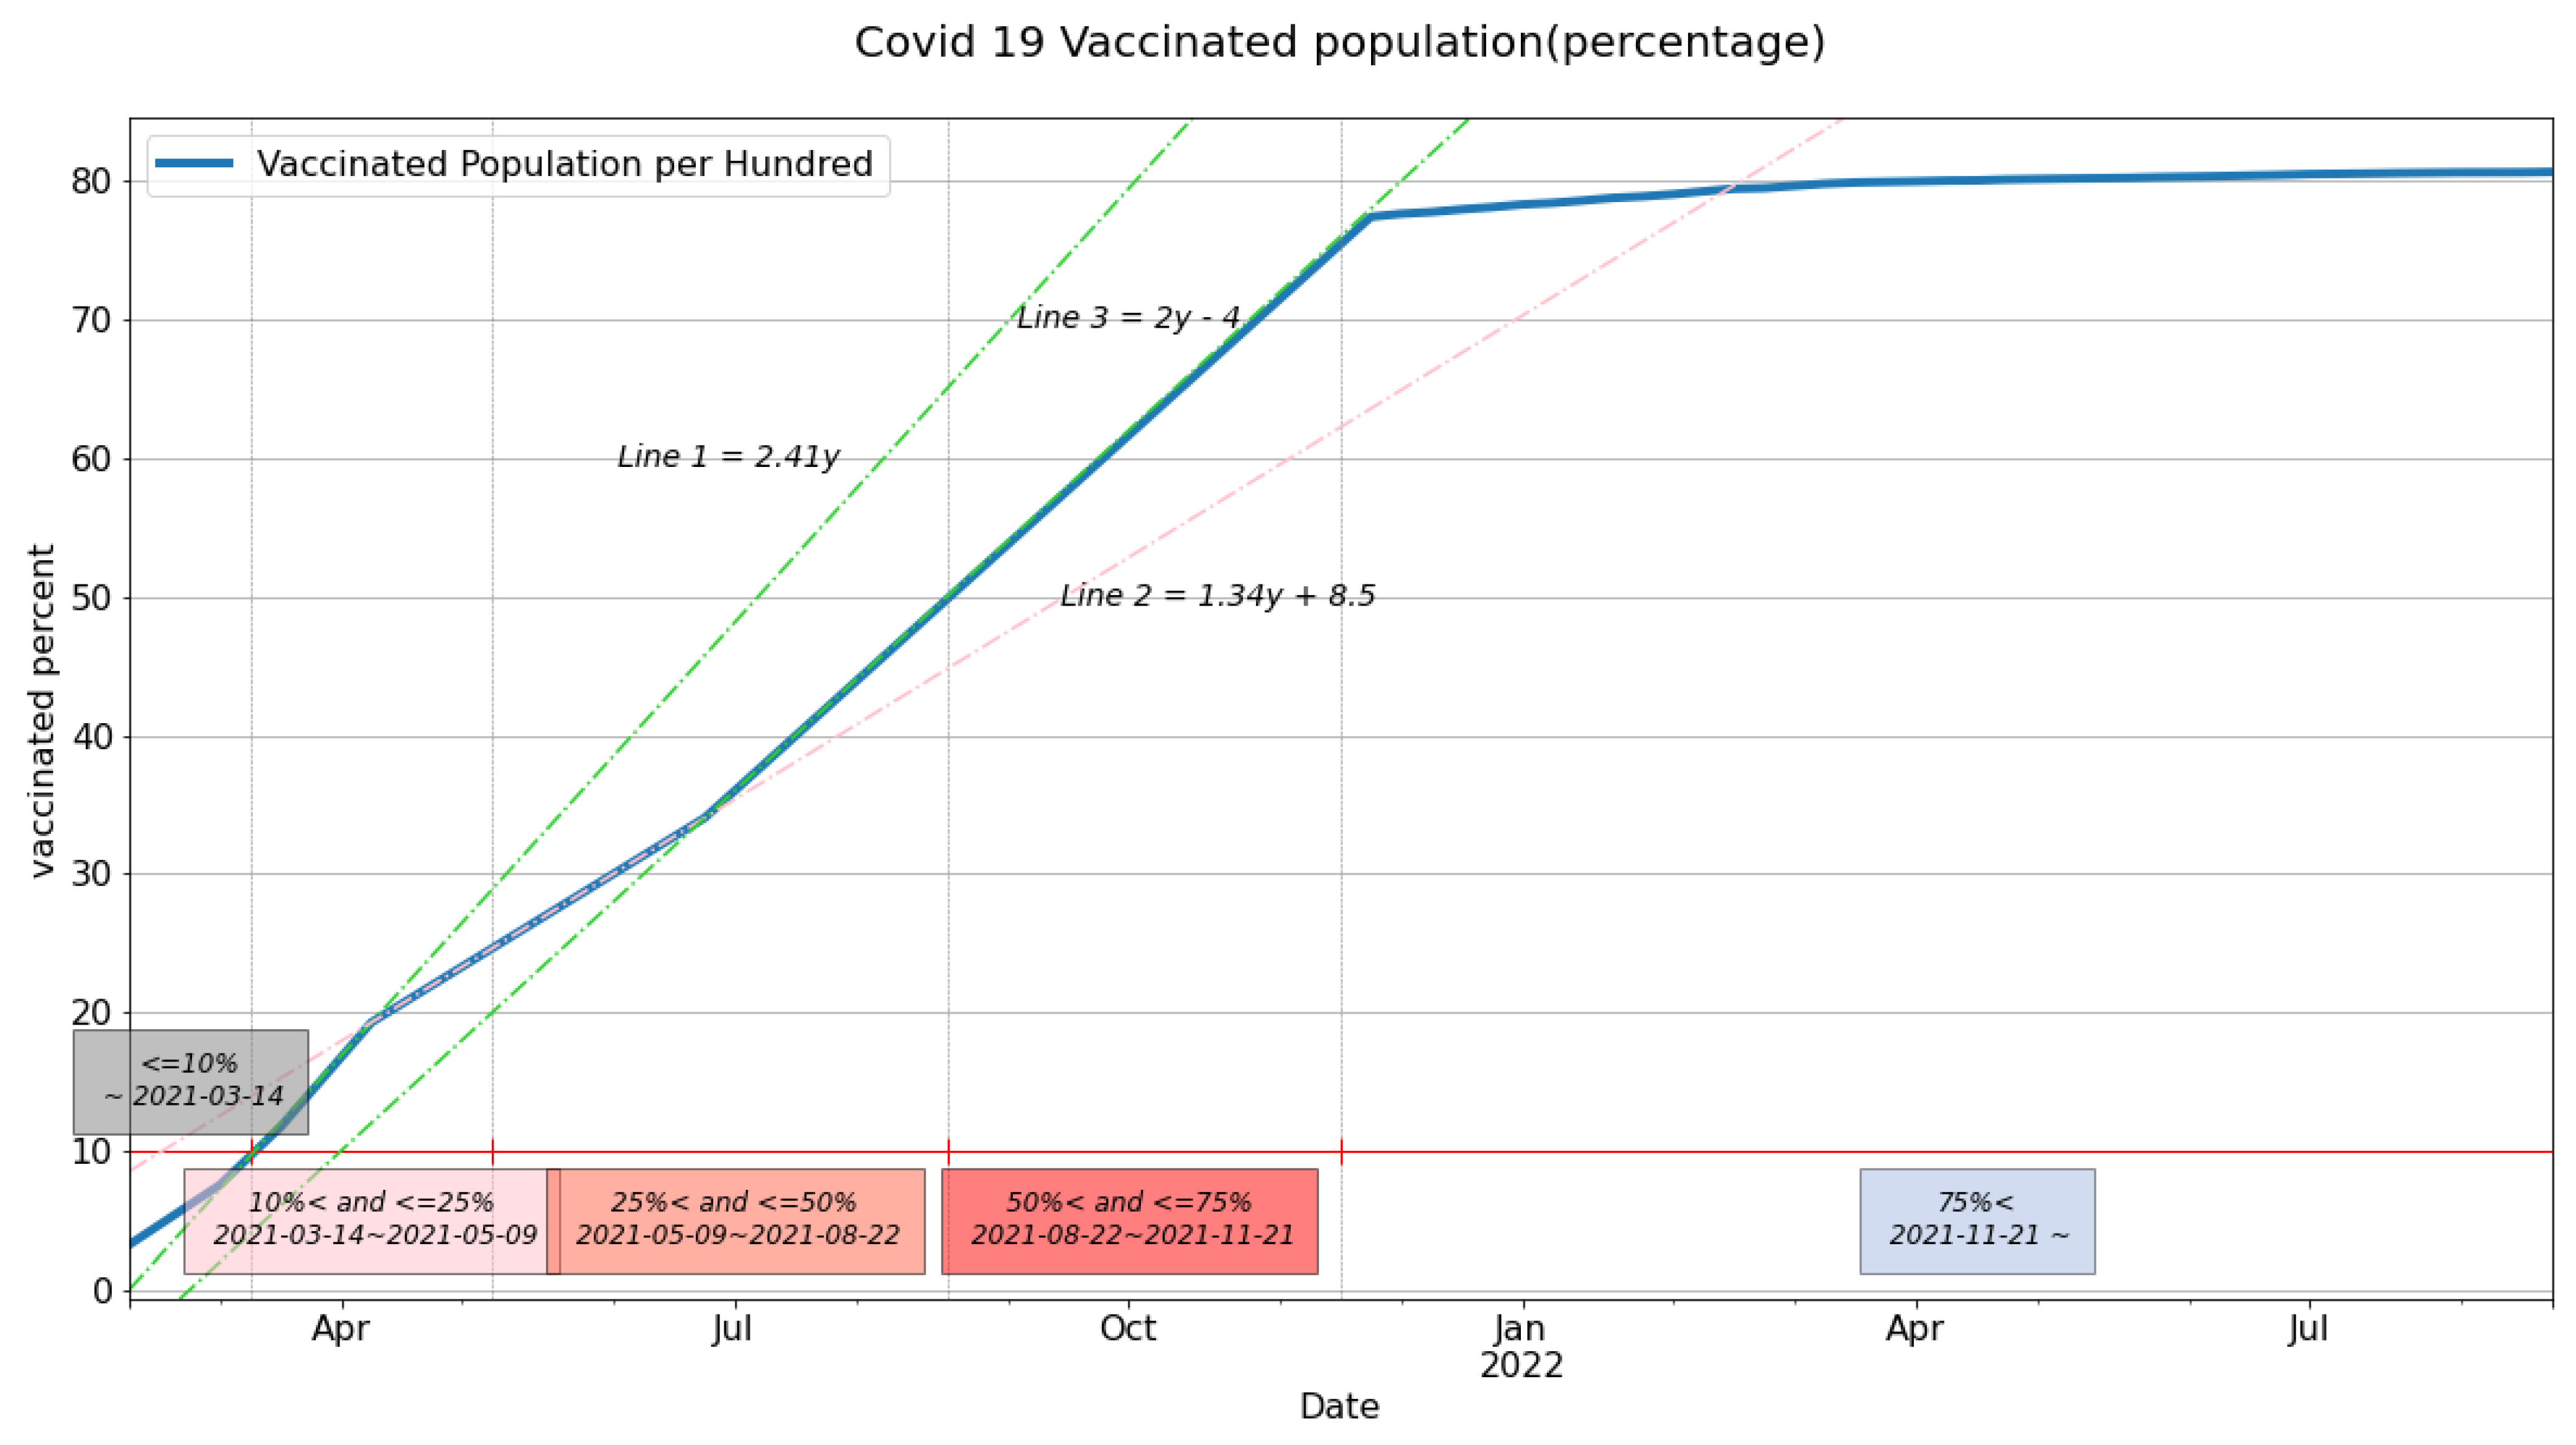
4.3. Network Polarization Based on the Vaccinated Population in Kuwait
5. Discussion
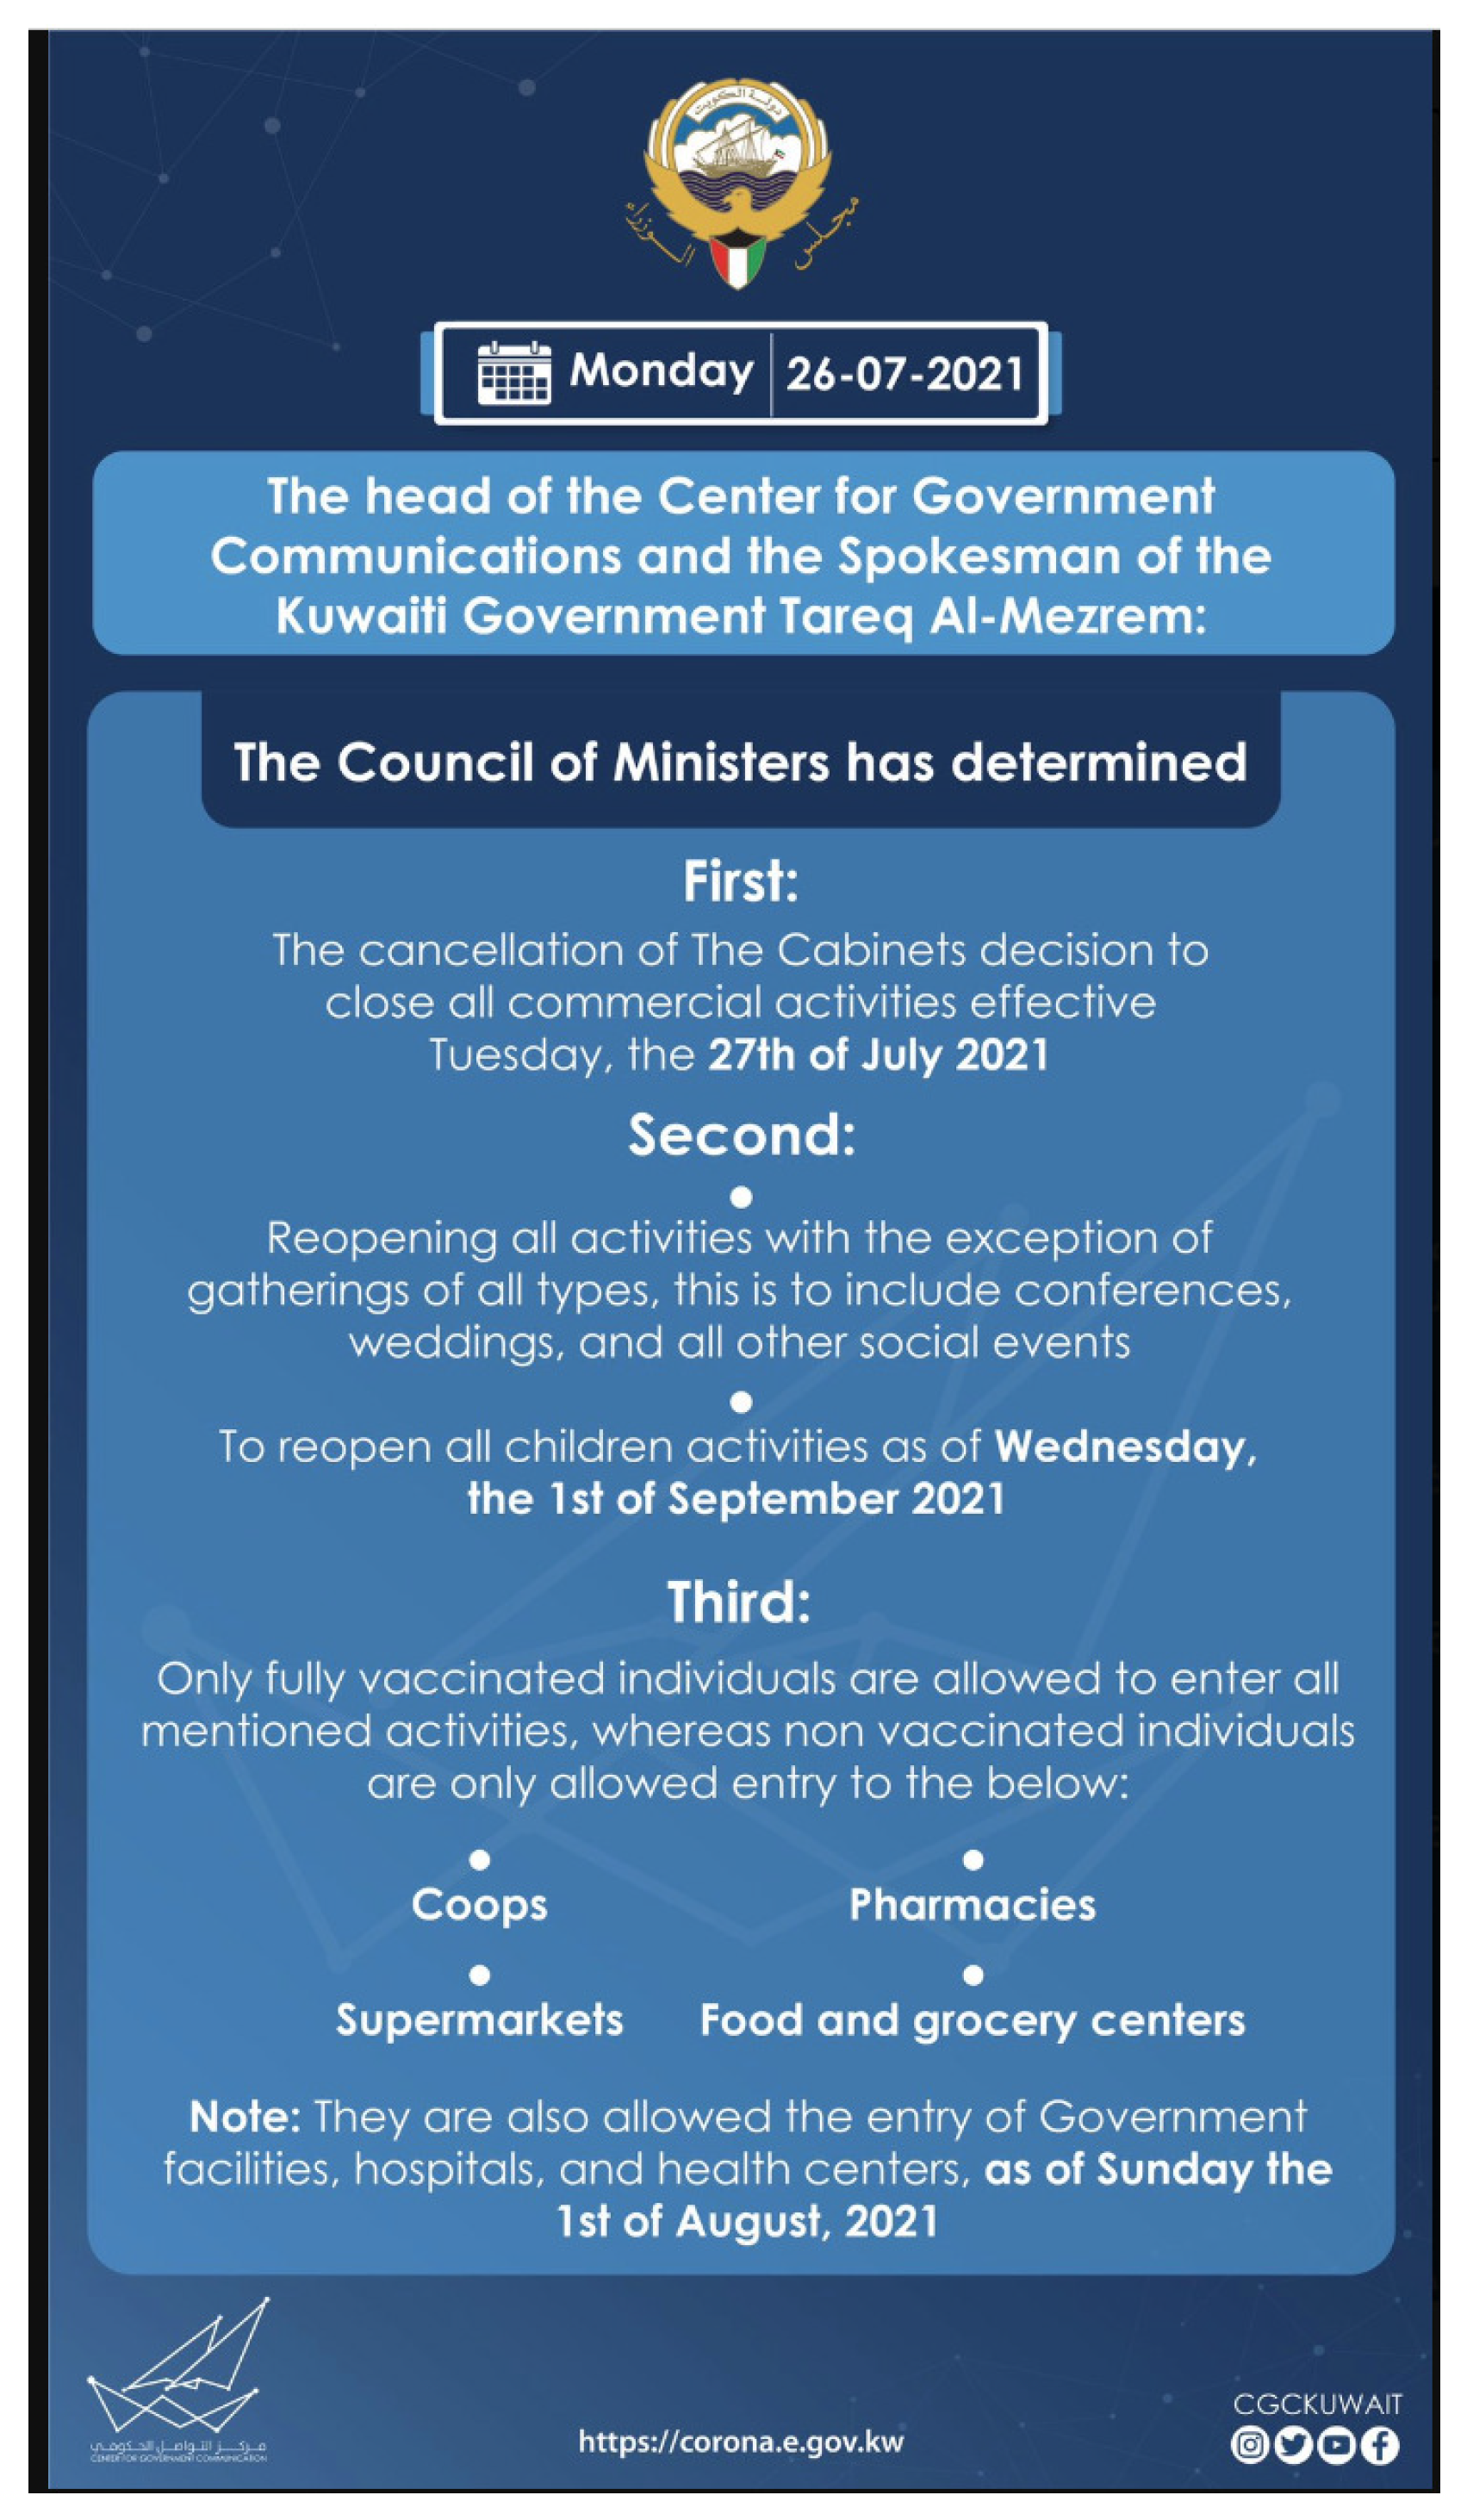
- On 26 July, the government announced that all activities were open for vaccinated people. Non-vaccinated individuals could only visit supermarkets, food and grocery stores, hospitals, pharmacies, and government agencies. A screenshot of this post is shown in Figure 7.
- On 27 July, the government announced new travel procedures for departures from and special measures for arrivals to Kuwait. The government maintained their ban on international travel for citizens who were not vaccinated against COVID-19. Additionally, specific vaccination requirements applied for arrivals.
- On 11 August, the government announced that public schools would open on September 29th.
- On 18 August, the government announced the initiation of direct commercial flights to India, Egypt, Bangladesh, Pakistan, Sri Lanka, and Nepal.
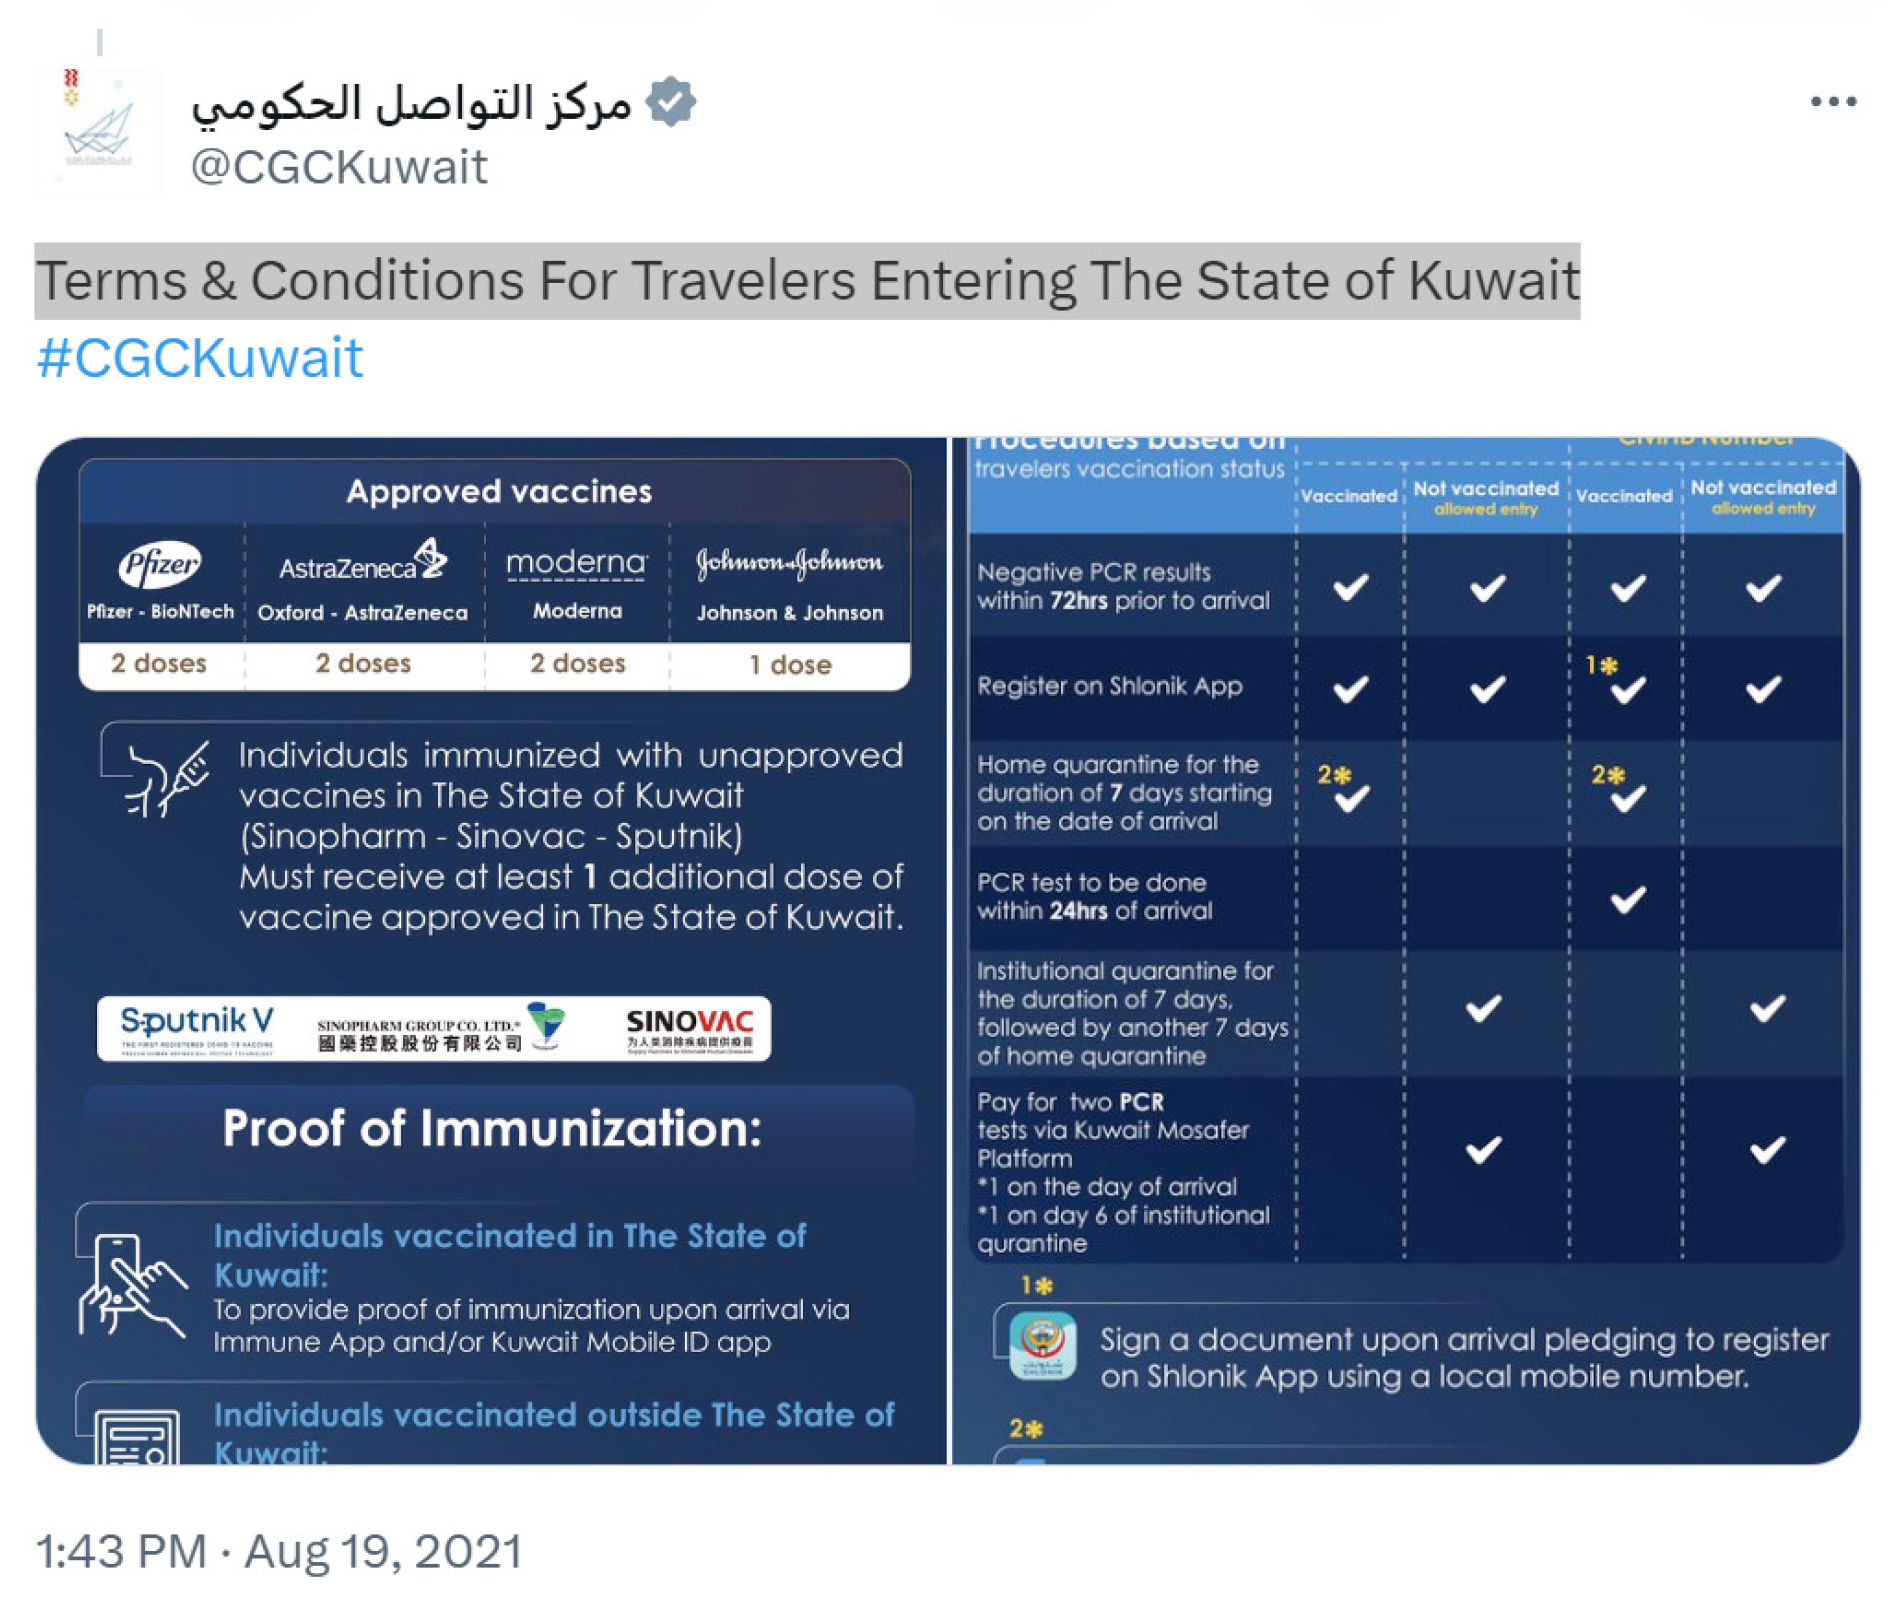
- On 19 August, the government announced new terms and conditions for travelers entering Kuwait; a screenshot of this post is shown in Figure 8.
- On 7 June 2021, the government announced the reopening of museums and cultural centers for vaccinated individuals and the continuation of direct flights to and from the United Kingdom.
- On 8 June 2021, the government introduced regulations for 12th-grade high school final exams, requiring students to take written exams on school premises.
- On 17 June 2021, the government announced that individuals who had received two doses of the COVID-19 vaccine could travel internationally. Additionally, fully vaccinated expats could enter the country after undergoing a PCR test.
- On 24 June 2021, the government allowed vaccinated individuals, whose status appeared in green and orange on the Kuwait Mobile ID and Immune applications, to enter malls, restaurants, cafes, theaters, cinemas, cultural centers, gyms, and beauty salons.
6. Conclusions
7. Limitations
Author Contributions
Funding
Data Availability Statement
Conflicts of Interest
References
- Küçük, D.; Can, F. Stance Detection: Concepts, Approaches, Resources, and Outstanding Issues. In Proceedings of the 44th International ACM SIGIR Conference on Research and Development in Information Retrieval (SIGIR’21), Virtual, 11–15 July 2021; Association for Computing Machinery: New York, NY, USA, 2021; pp. 2673–2676. [Google Scholar] [CrossRef]
- ALDayel, A.; Magdy, W. Stance detection on social media: State of the art and trends. Inf. Process. Manag. 2021, 58, 102597. [Google Scholar] [CrossRef]
- Lai, M.; Cignarella, A.; Farías, D.; Bosco, C.; Patti, V.; Rosso, P. Multilingual stance detection in social media political debates. Comput. Speech Lang. 2020, 63, 101075. [Google Scholar] [CrossRef]
- Lee, Y.; Ozer, M.; Corman, S.R.; Davulcu, H. Detecting and Measuring the Polarization Effects of Adversarial Botnets on Twitter. In Proceedings of the 38th ACM/SIGAPP Symposium on Applied Computing, Tallinn, Estonia, 27–31 March 2023; pp. 1641–1649. [Google Scholar]
- Putra, C.B.P.; Purwitasari, D.; Raharjo, A.B. Stance detection on tweets with multi-task aspect-based sentiment: A case study of COVID-19 vaccination. Int. J. Intell. Eng. Syst. 2022, 15, 515–526. [Google Scholar] [CrossRef]
- Hardalov, M.; Arora, A.; Nakov, P.; Augenstein, I. A Survey on Stance Detection for Mis- and Disinformation Identification. In Proceedings of the Findings of the Association for Computational Linguistics: NAACL 2022, Seattle, WA, USA, 10–15 July 2022; Carpuat, M., de Marneffe, M.C., Meza Ruiz, I.V., Eds.; Association for Computational Linguistics: Seattle, WA, USA, 2022; pp. 1259–1277. [Google Scholar] [CrossRef]
- Li, Y.; He, H.; Wang, S.; Lau, F.C.M.; Song, Y. Improved Target-Specific Stance Detection on Social Media Platforms by Delving Into Conversation Threads. IEEE Trans. Comput. Soc. Syst. 2023, 10, 3031–3042. [Google Scholar] [CrossRef]
- Huang, W.; Wang, Y.; Yang, J.; Xu, Y. Stance detection based on user feature fusion. Comput. Intell. Neurosci. 2022, 2022, 5738404. [Google Scholar] [CrossRef]
- Liu, H.; Li, S.; Zhou, G. Two-target stance detection with target-related zone modeling. In Proceedings of the Information Retrieval: 24th China Conference, CCIR 2018, Guilin, China, 27–29 September 2018; Proceedings 24; pp. 170–182. [Google Scholar]
- Wei, P.; Lin, J.; Mao, W. Multi-target stance detection via a dynamic memory-augmented network. In Proceedings of the the 41st International ACM SIGIR Conference on Research & Development in Information Retrieval, Ann Arbor, MI, USA, 8–12 July 2018; pp. 1229–1232. [Google Scholar]
- Lai, M.; Tambuscio, M.; Patti, V.; Ruffo, G.; Rosso, P. Extracting graph topological information and users’ opinion. In Proceedings of the 8th International Conference of the CLEF Association, Dublin, Ireland, 11–14 September 2017; pp. 112–118. [Google Scholar] [CrossRef]
- Ghosh, S.; Singhania, P.; Singh, S.; Rudra, K.; Ghosh, S. Stance detection in web and social media: A comparative study. In Proceedings of the 10th International Conference of the CLEF Association, Lugano, Switzerland, 9–12 September 2019; pp. 75–87. [Google Scholar] [CrossRef]
- Hardalov, M.; Arora, A.; Nakov, P.; Augenstein, I. Few-shot cross-lingual stance detection with sentiment-based pre-training. In Proceedings of the AAAI Conference on Artificial Intelligence, Virtual, 22 February–1 March 2022; Volume 36, pp. 10729–10737. [Google Scholar]
- Chakraborty, R.; Bhavsar, M.; Dandapat, S.; Chandra, J. Detecting stance in tweets: A signed network based approach. arXiv 2022, arXiv:2201.07472. [Google Scholar] [CrossRef]
- Kipf, T.N.; Welling, M. Semi-supervised classification with graph convolutional networks. arXiv 2016, arXiv:1609.02907. [Google Scholar]
- Rossi, E.; Kenlay, H.; Gorinova, M.I.; Chamberlain, B.P.; Dong, X.; Bronstein, M.M. On the unreasonable effectiveness of feature propagation in learning on graphs with missing node features. In Proceedings of the Learning on Graphs Conference, Virtual, 9–12 December 2022; pp. 11:1–11:16. [Google Scholar]
- Garimella, K.; Morales, G.D.F.; Gionis, A.; Mathioudakis, M. Quantifying controversy on social media. ACM Trans. Soc. Comput. 2018, 1, 1–27. [Google Scholar] [CrossRef]
- Liao, J.; Tao, Q.; Yan, J. Density-aware hyper-graph neural networks for graph-based semi-supervised node classification. arXiv 2022, arXiv:2201.11511. [Google Scholar] [CrossRef]
- Wang, B.; Jia, J.; Gong, N. Semi-supervised node classification on graphs: Markov random fields vs. graph neural networks. Proc. Aaai Conf. Artif. Intell. 2021, 35, 10093–10101. [Google Scholar] [CrossRef]
- Wang, B.; Li, A.; Li, H.; Chen, Y. Graphfl: A federated learning framework for semi-supervised node classification on graphs. In Proceedings of the 22nd IEEE International Conference on Data Mining, Orlando, FL, USA, 28 November–1 December 2022. [Google Scholar] [CrossRef]
- Yao, H.; Zhang, C.; Wei, Y.; Jiang, M.; Wang, S.; Huang, J.; Chawla, N.; Li, Z. Graph few-shot learning via knowledge transfer. Proc. Aaai Conf. Artif. Intell. 2020, 34, 6656–6663. [Google Scholar] [CrossRef]
- Jasser, J.; Garibay, I.; Scheinert, S.; Mantzaris, A. Controversial information spreads faster and further than non-controversial information in reddit. J. Comput. Soc. Sci. 2021, 5, 111–122. [Google Scholar] [CrossRef]
- Zhang, J.; Xuan, Q.; Qiu, X.; Min, Y. A novel method detecting controversial interaction in the multiplex social comment network. Front. Phys. 2023, 10, 1107338. [Google Scholar] [CrossRef]
- Morales, A.; Borondo, J.; Losada, J.; Benito, R. Measuring political polarization: Twitter shows the two sides of venezuela. Chaos Interdiscip. J. Nonlinear Sci. 2015, 25, 033114. [Google Scholar] [CrossRef]
- Sepehri-Rad, H.; Barbosa, D. Identifying controversial wikipedia articles using editor collaboration networks. Acm Trans. Intell. Syst. Technol. 2015, 6, 1–24. [Google Scholar] [CrossRef]
- Poddar, S.; Mondal, M.; Misra, J.; Ganguly, N.; Ghosh, S. Winds of change: Impact of COVID-19 on vaccine-related opinions of twitter users. Proc. Int. Aaai Conf. Web Soc. Media 2022, 16, 782–793. [Google Scholar] [CrossRef]
- Blane, J.; Bellutta, D.; Carley, K. Social-cyber maneuvers during the COVID-19 vaccine initial rollout: Content analysis of tweets. J. Med. Internet Res. 2022, 24, e34040. [Google Scholar] [CrossRef] [PubMed]
- Fortunato, S. Community detection in graphs. Phys. Rep. 2010, 486, 75–174. [Google Scholar] [CrossRef]
- D’Andrea, E.; Ducange, P.; Bechini, A.; Renda, A.; Marcelloni, F. Monitoring the public opinion about the vaccination topic from tweets analysis. Expert Syst. Appl. 2019, 116, 209–226. [Google Scholar] [CrossRef]
- Tomaszewski, T.; Morales, A.; Lourentzou, I.; Caskey, R.; Liu, B.; Schwartz, A.; Chin, J. Identifying false human papillomavirus (hpv) vaccine information and corresponding risk perceptions from twitter: Advanced predictive models. J. Med. Internet Res. 2021, 23, e30451. [Google Scholar] [CrossRef]
- Lindelöf, G.; Aledavood, T.; Keller, B. Dynamics of the negative discourse toward COVID-19 vaccines: Topic modeling study and an annotated data set of twitter posts. J. Med. Internet Res. 2023, 25, e41319. [Google Scholar] [CrossRef] [PubMed]
- Lindelöf, G.; Aledavood, T.; Keller, B. Vaccine discourse on twitter during the COVID-19 pandemic. arXiv 2022, arXiv:2207.11521. [Google Scholar] [CrossRef]
- Alexander, C.; Wang, L.; Shah, V. Vaccine hesitancy, vaccine acceptance, and recommendations about the COVID-19 vaccines. Res. Rev. 2021, 4, 1599–1609. [Google Scholar] [CrossRef]
- Zaidi, Z.; Ye, M.; Samon, F.; Jama, A.; Gopalakrishnan, B.; Gu, C.; Karunasekera, S.; Evans, J.; Kashima, Y. Topics in antivax and provax discourse: Yearlong synoptic study of COVID-19 vaccine tweets. J. Med. Internet Res. 2022, 25, e45069. [Google Scholar] [CrossRef]
- Al-Ayyadhi, N.; Ramadan, M.; Al-Tayar, E.; Al-Mathkouri, R.; Al-Awadhi, S. Determinants of Hesitancy Towards COVID-19 Vaccines in State of Kuwait: An Exploratory Internet-Based Survey. Risk Manag. Healthc. Policy 2021, 14, 4967–4981. [Google Scholar] [CrossRef] [PubMed]
- Alsanafi, M.; Sallam, M. Psychological Determinants of COVID-19 Vaccine Acceptance Among Healthcare Workers in Kuwait: A Cross-Sectional Study Using the 5C and Vaccine Conspiracy Beliefs Scales. Vaccines 2021, 9, 701. [Google Scholar] [CrossRef]
- Alibrahim, J.; Awad, A. COVID-19 Vaccine Hesitancy Among the Public in Kuwait: A Cross-Sectional Survey. Int. J. Environ. Res. Public Health 2021, 18, 8836. [Google Scholar] [CrossRef] [PubMed]
- Burhamah, W.; Alkhayyat, A.; Oroszlányová, M.; AlKenane, A.; Jafar, H.; Behbehani, M.; Almansouri, A. The SARS-CoV-2 Vaccine Hesitancy Among the General Population: A Large Cross-Sectional Study From Kuwait. Cureus 2021, 13, e16261. [Google Scholar] [CrossRef] [PubMed]
- AlAwadhi, E.; Zein, D.; Mallallah, F.; Bin Haider, N.; Hossain, A. Monitoring COVID-19 vaccine acceptance in Kuwait during the pandemic: Results from a national serial study. Risk Manag. Healthc. Policy 2021, 14, 1413–1429. [Google Scholar] [CrossRef]
- Gruzd, A.; Mai, P. Communalytic: A Research Tool For Studying Online Communities and Online Discourse. Available online: https://Communalytic.org (accessed on 24 March 2024).
- Alostad, H.; Dawiek, S.; Davulcu, H. Q8VaxStance: Dataset Labeling System for Stance Detection towards Vaccines in Kuwaiti Dialect. Big Data Cogn. Comput. 2023, 7, 151. [Google Scholar] [CrossRef]
- Yang, Y.; Eisenstein, J. Overcoming language variation in sentiment analysis with social attention. Trans. Assoc. Comput. Linguist. 2017, 5, 295–307. [Google Scholar] [CrossRef]
- Boyd, D.; Golder, S.; Lotan, G. Tweet, tweet, retweet: Conversational aspects of retweeting on twitter. In Proceedings of the 2010 43rd Hawaii International Conference on System Sciences, Honolulu, HI, USA, 5–8 January 2010; pp. 1–10. [Google Scholar]
- Wong, F.M.F.; Tan, C.W.; Sen, S.; Chiang, M. Quantifying political leaning from tweets, retweets, and retweeters. IEEE Trans. Knowl. Data Eng. 2016, 28, 2158–2172. [Google Scholar] [CrossRef]
- Salloum, A.; Chen, T.H.Y.; Kivelä, M. Separating Polarization from Noise: Comparison and Normalization of Structural Polarization Measures. Proc. ACM Hum.-Comput. Interact. 2022, 6, 1–33. [Google Scholar] [CrossRef]
- Mathieu, E.; Ritchie, H.; Rodés-Guirao, L.; Appel, C.; Giattino, C.; Hasell, J.; Macdonald, B.; Dattani, S.; Beltekian, D.; Ortiz-Ospina, E.; et al. Coronavirus Pandemic (COVID-19). 2020. Available online: https://github.com/owid/covid-19-data/tree/master/public/data (accessed on 24 March 2024).


| (User × Features) | … | ||||
|---|---|---|---|---|---|
| 1 | 1 | … | 1 | 0 | |
| 0 | 1 | … | 0 | 0 | |
| 1 | 1 | … | 1 | 0 | |
| … | −1 | −1 | … | −1 | −1 |
| 1 | 1 | … | 0 | 1 |
| Epochs | Acc Mean | Acc Std | F1 Mean | F1 Std | AUC Mean | AUC Std |
|---|---|---|---|---|---|---|
| 50 | 0.9561 | 0.0083 | 0.956 | 0.0084 | 0.9554 | 0.0086 |
| 100 | 0.9624 | 0.0055 | 0.9624 | 0.0056 | 0.9622 | 0.0057 |
| 200 * | 0.9653 | 0.0042 | 0.9652 | 0.0042 | 0.9651 | 0.0042 |
| 300 | 0.9653 | 0.0048 | 0.9652 | 0.0048 | 0.9651 | 0.0047 |
| Algorithm | Features | Acc Mean | Acc Std | F1 Mean | F1 Std | AUC Mean | AUC Std |
|---|---|---|---|---|---|---|---|
| LP | − | 0.9448 | 0.0087 | 0.9455 | 0.0075 | 0.9457 | 0.0082 |
| Tweet text | 0.9574 | 0.0066 | 0.9573 | 0.0066 | 0.9572 | 0.0067 | |
| Hashtags | 0.9587 | 0.0060 | 0.9587 | 0.0060 | 0.9582 | 0.0064 | |
| FP | Bigrams * | 0.9653 | 0.0042 | 0.9652 | 0.0042 | 0.9651 | 0.0042 |
| Trigrams | 0.9611 | 0.0051 | 0.9610 | 0.0051 | 0.9608 | 0.0054 | |
| Domains | 0.9513 | 0.0061 | 0.9512 | 0.0061 | 0.9510 | 0.0060 |
| Bigram Arabic | English Translation | Trigram Arabic | English Translation |
|---|---|---|---|
| كويت مسافر | Kuwait Mosahir App | منع السفر لغير | Travel ban for others |
| الطيران المدني | Civil aviation | السفر لغير المطعيین | Traveling for non-vaccinated people |
| منع السفر | Travel ban | لربط السفر بالتطعيم | To link travel to vaccination |
| دخول المجمعات | Entering the malls | ليس حقکم تحويل | You do not have the right to transfer |
| منعهم الدخول | Prevent them from entering | تحويل البلد سجن | Turning the country into a prison |
| Bigram Arabic | English Translation | Trigram Arabic | English Translation |
|---|---|---|---|
| مسار الحرية | Path of Freedom | نرفض اللقاح الإجباري | We reject compulsory vaccination |
| نرفض المسحه | We reject PCR | الجرعتين تطعيم الکورونا | Two doses of Corona vaccination |
| للتطعيم الاجباری | For compulsory vaccination | انا اخذت الجرعتين | I took both doses |
| ضد التطعيم | Against vaccination | الغير مطعمين انا | I am the unvaccinated |
| ضد الاجبار | Against coercion | أمرا للتطعيم الاجباري | An order for compulsory vaccination |
| Bigram Arabic | English Translation | Trigram Arabic | English Translation |
|---|---|---|---|
| اعتصام طلاب | Student protest | أطفالنا خط أحمر | Our children are a red line |
| وزارة الترية | Ministry of Education | اعتصام طلاب في | Students protest in |
| الاختبارات الورقيه | Paper tests | تقييد حریة الناس | Restricting people’s freedom |
| قرار منعهم | The decision to ban them | ارتياد الأماکن العامة | Going to public places |
| منعهم الدخول | Prevent them from entering | قرار منعهم الدخول | The decision to prevent them from entering |
Disclaimer/Publisher’s Note: The statements, opinions and data contained in all publications are solely those of the individual author(s) and contributor(s) and not of MDPI and/or the editor(s). MDPI and/or the editor(s) disclaim responsibility for any injury to people or property resulting from any ideas, methods, instructions or products referred to in the content. |
© 2024 by the authors. Licensee MDPI, Basel, Switzerland. This article is an open access article distributed under the terms and conditions of the Creative Commons Attribution (CC BY) license (https://creativecommons.org/licenses/by/4.0/).
Share and Cite
Lee, Y.; Alostad, H.; Davulcu, H. Quantifying Variations in Controversial Discussions within Kuwaiti Social Networks. Big Data Cogn. Comput. 2024, 8, 60. https://doi.org/10.3390/bdcc8060060
Lee Y, Alostad H, Davulcu H. Quantifying Variations in Controversial Discussions within Kuwaiti Social Networks. Big Data and Cognitive Computing. 2024; 8(6):60. https://doi.org/10.3390/bdcc8060060
Chicago/Turabian StyleLee, Yeonjung, Hana Alostad, and Hasan Davulcu. 2024. "Quantifying Variations in Controversial Discussions within Kuwaiti Social Networks" Big Data and Cognitive Computing 8, no. 6: 60. https://doi.org/10.3390/bdcc8060060
APA StyleLee, Y., Alostad, H., & Davulcu, H. (2024). Quantifying Variations in Controversial Discussions within Kuwaiti Social Networks. Big Data and Cognitive Computing, 8(6), 60. https://doi.org/10.3390/bdcc8060060