Article

Quantifying Variations in Controversial Discussions within Kuwaiti Social Networks

1
Computer Science Department, School of Computing and Augmented Intelligence, Arizona State University, Tempe, AZ 85281, USA
2
Systems and Software Development Department, Kuwait Institute for Scientific Research, P.O. Box 24885, Safat 13109, Kuwait
*
Authors to whom correspondence should be addressed.
The author conducted Initial experiments while affiliated with the Gulf University for Science and Technology, P.O. Box 7207, Hawally 32093, Kuwait.
Big Data Cogn. Comput. 2024, 8(6), 60; https://doi.org/10.3390/bdcc8060060
Submission received: 14 April 2024 / Revised: 17 May 2024 / Accepted: 27 May 2024 / Published: 4 June 2024

Abstract

:
During the COVID-19 pandemic, pro-vaccine and anti-vaccine groups emerged, influencing others to vaccinate or abstain and leading to polarized debates. Due to incomplete user data and the complexity of social network interactions, understanding the dynamics of these discussions is challenging. This study aims to discover and quantify the factors driving the controversy related to vaccine stances across Kuwaiti social networks. To tackle these challenges, a graph convolutional network (GCN) and feature propagation (FP) were utilized to accurately detect users’ stances despite incomplete features, achieving an accuracy of 96%. Additionally, the random walk controversy (RWC) score was employed to quantify polarization points within the social networks. Experiments were conducted using a dataset of vaccine-related retweets and discussions from X (formerly Twitter) during the Kuwait COVID-19 vaccine rollout period. The analysis revealed high polarization periods correlating with specific vaccination rates and governmental announcements. This research provides a novel approach to accurately detecting user stances in low-resource languages like the Kuwaiti dialect without the need for costly annotations, offering valuable insights to help policymakers understand public opinion and address misinformation effectively.

1. Introduction

Stance detection is a task used to determine an individual’s attitude or viewpoint regarding a particular target, concept, or event based on the content they produce [1]. This task has gained significant attention in recent years due to its diverse applications in analyzing social and political issues across various social media platforms [2]. Unlike sentiment analysis, which detects the general polarity of a text, stance detection is a finer-grained task that focuses on identifying whether the author is in favor of, against, or neutral regarding a specific target [3].
Researchers from various domains, including healthcare, politics, and sociology, have studied stance detection. For example, some have studied it in political debates [3,4], in COVID-19 vaccination discussions [5], and in identifying misinformation [6]. Moreover, research has been conducted on conversational stance detection, which aims to infer stances regarding a given target within conversation threads [7].
Various approaches have been proposed to classify the stance of social network nodes, such as text-based semantic mining using convolutional neural networks [8], multitarget stance detection [9,10], and the use of graph topological information and user opinions [4,8,11,12]. Researchers have also proposed approaches such as sentiment-based pre-training for few-shot cross-lingual stance detection [13] and a signed network-based approach for detecting stances from tweets [14].
Although many studies have examined general stances on social media, few have specifically looked at the polarization of opinions on vaccines in the context of Kuwait. This study aims to fill this gap by analyzing the polarization of vaccine attitudes on social media, focusing on a retweet network analysis of users in Kuwait.
This study proposes an approach to classifying user stances into pro-vaccine or anti-vaccine by incorporating a social network retweet graph and textual features of nodes with graph conventional network (GCN) and feature propagation (FP) algorithms to overcome challenges; the first of these challenges is handling low-resource language datasets, such as social networks containing Arabic dialect text. Furthermore, the proposed approach eliminates the need for costly and time-consuming annotations, as it relies on a small annotated dataset and achieves high performance through graph convolutional network learning. Additionally, it addresses the issue of missing or incomplete features within nodes, which can often affect node classification accuracy, by implementing feature propagation on the dataset. It proposes a new, cost-effective, and time-efficient approach to analyzing controversial social issues to understand polarization instances on social media utilizing the random walk controversy (RWC) score as a social network polarization measure for examining the retweet network between pro- and anti-vaccine individuals in Kuwait. Unlike traditional studies that rely on conducting surveys, which can be costly and time-consuming, the proposed system offers a faster and more affordable alternative. Finally, by understanding and quantifying social network polarization, researchers and policymakers will gain insight into public opinions, and will thus be able to develop strategies to mitigate the negative effects.
The main contributions of this paper are the following:
  • Social Network Graph-Based Stance Semi-Supervised Classification: The implementation of a GCN and FP classification algorithm based on [15,16], inspired by the success of the approach in the political domain [4], to detect user stances with high accuracy (96%) in the presence of incomplete features.
  • Measurement of Effects: The application of the RWC score [17] to measure the polarization effects and detect points of controversy between social network users regarding their stance on vaccines.
  • Detecting Factors of Polarization: The detection of divergent social network points and an investigation of the factors driving debates and arguments between users during polarization periods.
This paper is organized as follows: Section 2 covers the related literature. Section 3 presents the methodology and details of the proposed system’s architecture. Section 4 introduces the experimental results, followed by a discussion of the findings in Section 5. We provide the conclusion and future research in Section 6. Finally, the last section presents the limitation.

2. Related Work

This section, serving as the basis of our study, contains background information on significant related works.

2.1. Graph-Based Semi-Supervised Node Classification

Node classification is a task that involves classifying the unlabeled nodes in a graph; the graph convolutional network model leverages the connectivity between labeled and unlabeled nodes to improve classification performance [18]. The task involves classifying the remaining unlabeled nodes in a graph, given the small set of labeled nodes and feature vectors for each node [19]. Various graph-based neural network models have been proposed for the fast and scalable semi-supervised classification of nodes in a graph [15]. These models have broad applications, ranging from security and networking to data mining and machine learning [20]. They have achieved state-of-the-art results and demonstrated a promising performance in this context [21]. In contrast, while NLP can be useful for analyzing textual data within social networks, it may be less effective in capturing the complex relationships and interactions between nodes.

2.2. Measuring Polarized Network

Quantifying controversy in social networks involves measuring the level of disagreement, conflict, and polarization within these networks. This can be crucial for understanding the dynamics of information spread, community formation, and opinion polarization. Several studies have proposed various approaches to quantifying controversy in social networks. For instance, [17] conducted a systematic study on controversy detection in social media by analyzing content and network structures. They took a general approach to studying controversial topics across different domains. The research in [17] also developed a graph-based pipeline to quantify controversy by building conversation graphs and identifying potential sides.
Moreover, [22] found that controversial information spreads faster and farther than non-controversial Reddit content, highlighting the impact of controversy on information dissemination. Additionally, [23] introduced a novel method for detecting controversial interactions in multiplex social comment networks, emphasizing the importance of controversy detection in understanding spaces of public discourse.
In a different domain, [24] focused on measuring political polarization using data from Twitter, showcasing how influential individuals can propagate opinions through social networks and contribute to polarization. Additionally, in [4], the random walk controversy metric was used to measure polarity in Ukrainian and Russian tweet activities. Furthermore, [25] identified controversial Wikipedia articles by analyzing editor collaboration networks, demonstrating the utility of network metrics in detecting controversy.
By leveraging network structures, content analysis, and user interactions, researchers can gain insights into the nature of controversy, its impact on information dissemination, and strategies to mitigate polarization and conflict within social networks.

2.3. Vaccine Stance Detection Using Graph Network Algorithms

Due to its implications for public health and in understanding public opinions, significant attention has been drawn towards stance detection in the context of vaccine-related discussions, specifically on social media platforms such as X (formerly Twitter). Various studies have explored graph network algorithms and machine learning techniques to classify social media posts based on their stance on vaccines [26]. Traditional community detection algorithms have also been employed to identify groups with distinct stances [27].
Detecting communities and clusters within graphs is a critical task in fields such as computer science, biology, and sociology, where graphs are frequently used to represent systems [28]. By applying natural language processing techniques, researchers have been able to automatically infer trends in public opinion regarding vaccination stances, enabling significant shifts in opinions to be detected [29].
Moreover, distinguishing between vaccine hesitancy identification and vaccination behavior detection is essential, where the former focuses on attitudes or stances, and the latter is concerned with detecting actions related to getting vaccinated [30]. Stance detection algorithms have been utilized to study hesitancy and attitudes regarding vaccination during critical periods, such as the initial vaccine rollout phases [31,32].
Studies have highlighted the importance of sentiment analysis and stance detection in addressing vaccine hesitancy and enhancing public acceptance of vaccines, especially in the context of COVID-19 [5,33]. By employing advanced predictive models and natural language processing techniques, researchers have been able to classify tweets as ‘anti-vaccine’ or ‘pro-vaccine’ and identify key topics in vaccine-related discourse [34].
In conclusion, the application of machine learning models, graph network algorithms, and natural language processing techniques has significantly advanced the field of vaccine stance detection on social media platforms. These approaches not only help in understanding public perceptions and attitudes towards vaccination but also play a crucial role in public health decision-making processes.

2.4. Studies of COVID-19 Vaccination in Kuwait

Many researchers of COVID-19 vaccine acceptance and hesitancy in Kuwait [35] have conducted online, exploratory, cross-sectional studies using structured questionnaires to collect data. The authors of [36] focused on healthcare workers in Kuwait and employed a cross-sectional study to assess COVID-19 vaccine acceptance. In [37], other researchers conducted a public cross-sectional survey in Kuwait to explore COVID-19 vaccine hesitancy. The authors of [38] conducted a large cross-sectional study to identify the prevalence of and factors associated with vaccine hesitancy in Kuwait. For [39], the authors obtained data from the COVID-19 Snapshot Monitoring (COSMO Kuwait) study that was implemented using the WHO tool for behavioral insights into COVID-19. The data analysis methodology in these studies involved statistical analysis to interpret the collected data. The authors of [35] analyzed survey responses to determine factors influencing vaccine hesitancy. Additionally, ref. [36] used 5C and vaccine conspiracy belief scales to analyze the psychological determinants of vaccine acceptance among healthcare workers. The authors of [37] likely conducted statistical analysis to identify predictors of vaccine hesitancy among the public. Similarly, ref. [38] employed statistical methods to examine the factors associated with vaccine hesitancy in the general population of Kuwait, and ref. [39] conducted the same type of analysis to detect vaccine acceptance in the country during the pandemic. All of the above studies were survey-based and depended on statistical analysis; as a result of this, there are some limitations in the dataset’s volume and resources. On the other hand, in this paper, the proposed system is based on the retweet social network dataset, which has a higher volume and coverage. It also implements advanced methods like graph neural networks, feature propagation, and random walk controversy. Thus, one of the contributions of this study is that it is the first to use the Kuwaiti Twitter dataset related to vaccine stance, as well as the first to visualize social opinion change from diverse points of view.

3. Methodology

This section details the approach used in the research, outlining the procedures employed to gather and process the dataset, as well as the proposed system architecture and experimental setup for classifying the retweet network and identifying network polarization.

3.1. Dataset Collection

To collect the dataset containing posts (tweets) related to the COVID-19 pandemic in Kuwait, an online tool, Communalytic [40], along with the X (formerly known as Twitter) academic API (the data collection was before the cancellation of the Twitter academic API), was used to extract retweets and their original posts. The keywords and hashtags from [41] were used to search for historical posts. The dataset collection time frame was from the start of the vaccination campaign in Kuwait to the end of all precautions against COVID-19 (December 2020 to July 2022).

3.2. Dataset Preparation

To ensure that the dataset only contained posts from Kuwait, posts that did not have one of the following keywords in the user_location field were filtered out: Koweït, Q8, kw, kwt, kuwait, Ku, وطن النهار (Homeland of the day), كويتيه (Kuwaiti), كويتي (Kuwaiti), and الكويت (Kuwait). Additionally, unrelated posts were programmatically removed by excluding all posts not written in Arabic or containing keywords related to Arabic spam posts. Next, the text was cleaned by removing digits, special characters, URLs, emojis, mentions, tashkīl (diacritics), and punctuation. The URLs and hashtags were extracted from the text and included in separate columns to be used later as features. The posts were labeled for their stance on vaccines using a labeling system called Q8VaxStance [41]. This system utilized weak supervised learning and zero-shot learning by implementing labeling functions using stance keyword detection in conjunction with three multilingual zero-shot models with the input prompt “the attitude towards COVID-19 vaccination is {}” [41].
Finally, from this dataset, the retweet relationship dataset was created, which contains the following information:
  • User who retweeted: the user who retweeted a post originally posted by another user;
  • Retweeted user: the username of the person who posted the original tweet;
  • Tweet id: the unique identifier of the original post;
  • Tweet text: the text content of the original post;
  • Tweet clean text: the text content of the original post after it had been cleaned and prepared for analysis;
  • Tweet stance: the label indicating the post’s vaccine stance;
  • Extracted URLs: the list of URLs extracted from the post’s text;
  • Extracted hashtags: the list of hashtags extracted.
Furthermore, to test and validate the GCN and FP model, a ground truth dataset was needed. The posts’ vaccine stance labels were used to distinguish anti- from pro-vaccine users; based on [41], the posts were labeled as 1 if the text was anti-vaccine and 0 if the text was pro-vaccine. Next, the following conditions were applied to label each user:
User Stance = pro-vaccine if Mean ( stance ) 0.2 anti-vaccine if Mean ( stance ) 0.8 Undecided otherwise
where stance is calculated by counting the number of pro- and anti-vaccine posts for each user.

3.3. User Stance and Network Polarization Detection System Architecture

Figure 1 illustrates the proposed system architecture. In step (1), the retweet network graph was created using the Kuwaiti retweet dataset from the previous section; then, in step (2), various feature matrices were built. These feature matrices were formed using diverse features from each user’s retweet data. Next, the retweet network graph and the feature matrices were used in (M1) the GCN and FP to classify user stances on the COVID-19 vaccine into pro- or anti-vaccine. Then, based on (4) the vaccination rate in Kuwait, the dataset was divided into five periods to detect where vaccine hesitancy occurred (5). Next, using (M2) the RWC algorithm, the network polarization for each period was measured (6). Furthermore, after detecting the periods where vaccine hesitancy started, the retweet network graph was divided into ten smaller periods, and the network polarization was measured for each. Finally, the network polarization periods were compared with the events’ timeline, as well as with the top bi- and trigrams, to gain further insight into what drives conversations during polarized periods. The details of each step are explained in the next sections.

3.4. Stance Detection Using Graph Convolutional Network and Feature Propagation

The researchers decided to utilize GCNs to classify the users based on their vaccine stance using a user-to-user retweet network graph. In a social network, users share similar ideologies with their neighboring users [42], and retweet activity expresses content endorsement [43,44]. GCNs utilize social network information and represent an excellent choice for classifying user vaccine stances using the retweet network graph dataset.
Since users in social networks share similar ideologies and similar tweet content [42], it can be assumed that neighborhood tweet content would have some common features. Thus, feature matrices were created with each user’s tweet text, hashtags, bigrams, trigrams, and URLs.
One of the critical requirements/assumptions in a GCN is that all the entries in the feature matrix are available and observed. However, not all users have complete feature matrices for various features. Therefore, the missing value issue needs to be handled. The researchers in [16] suggested using the FP approach to handle this issue. The GCN with the FP method proved to have high accuracy in political field social network classification [4]. The FP approach was used to reconstruct the missing values by propagating the known features from the neighboring nodes. Once a full feature matrix was obtained, the reconstructed features were used for the GCN in the required node classification task.
In FP, missing features are handled in two steps. In the first step, some of the unknown features are initialized with values. Next, the features are propagated by applying the normalized adjacency matrix, where A ^ = D 1 2 A D 1 2 is the normalized adjacency matrix and D = diag ( j a 1 j , , a n j ) is the diagonal degree matrix. Using filtering, only the missing values are modified, keeping the known values intact. The FP algorithm repeats these two operations until the feature vectors converge.
The formula for the GCN proposed by Kipf and Welling [15] is as follows:
H i + 1 = σ ( A ^ H i W i )
where
  • H i is the feature matrix at layer i, H 0 is initialized to the feature matrix X, and at each layer, the feature matrix will be replaced with the previous layer’s output H i 1 ;
  • σ ( · ) represents the activation function;
  • A ^ is A + I and is the graph’s adjacency matrix with added self-connections, where (A) is the social network graph adjacency matrix that contains the encoding of the network graph structure, and I is the identity matrix;
  • W is the layer weights and feature vectors for each node propagating in each iteration. After a certain number of iterations, the feature vectors aggregate and transform their neighboring nodes’ representation vectors ( W i ).

3.5. Measuring Network Polarization

Social network polarization refers to the extent to which individuals within a social network are divided into distinct and often opposing groups based on their beliefs, opinions, or ideologies [45]; it provides insights into the level of division and conflict within a society, which can have significant implications for decision making and the spread of misinformation. By understanding and quantifying social network polarization, policymakers can develop strategies to mitigate the negative effects and promote more inclusive communities [45]. To quantify the polarization in the vaccine stance retweet social network, the RWC score from [17] was adopted; the RWC approach implements a three-stage pipeline, which involves the following:
  • Building a conversation graph about a topic;
  • Partitioning the conversation graph to identify the potential sides of the controversy;
  • Measuring the amount of controversy from graph characteristics using the RWC score.
Stages 1 and 2 of the above pipeline are covered in the previous sections. Using the retweet network graph, the users’ conversations were labeled and partitioned based on their vaccine stance and their side of the controversy.
To implement stage 3 and detect diverging points based on polarization, retweet network graph polarization was observed according to the vaccination population data for Kuwait [46]. The RWC score was used to observe the change in polarization over several periods in order to identify the highest polarization moment from the timeline. To calculate the RWC score, the following equations were applied [17]:
R W C = P L L + P R R + P L R + P R L +
P L L ( + ) = C L L ( + ) C L L ( + ) + C L R ( + )
P R R ( + ) = C R R ( + ) C R R ( + ) + C R L ( + )
P L R ( + ) = C L R ( + ) C L R ( + ) + C L L ( + )
P R L ( + ) = C R L ( + ) C R L ( + ) + C R R ( + )
where
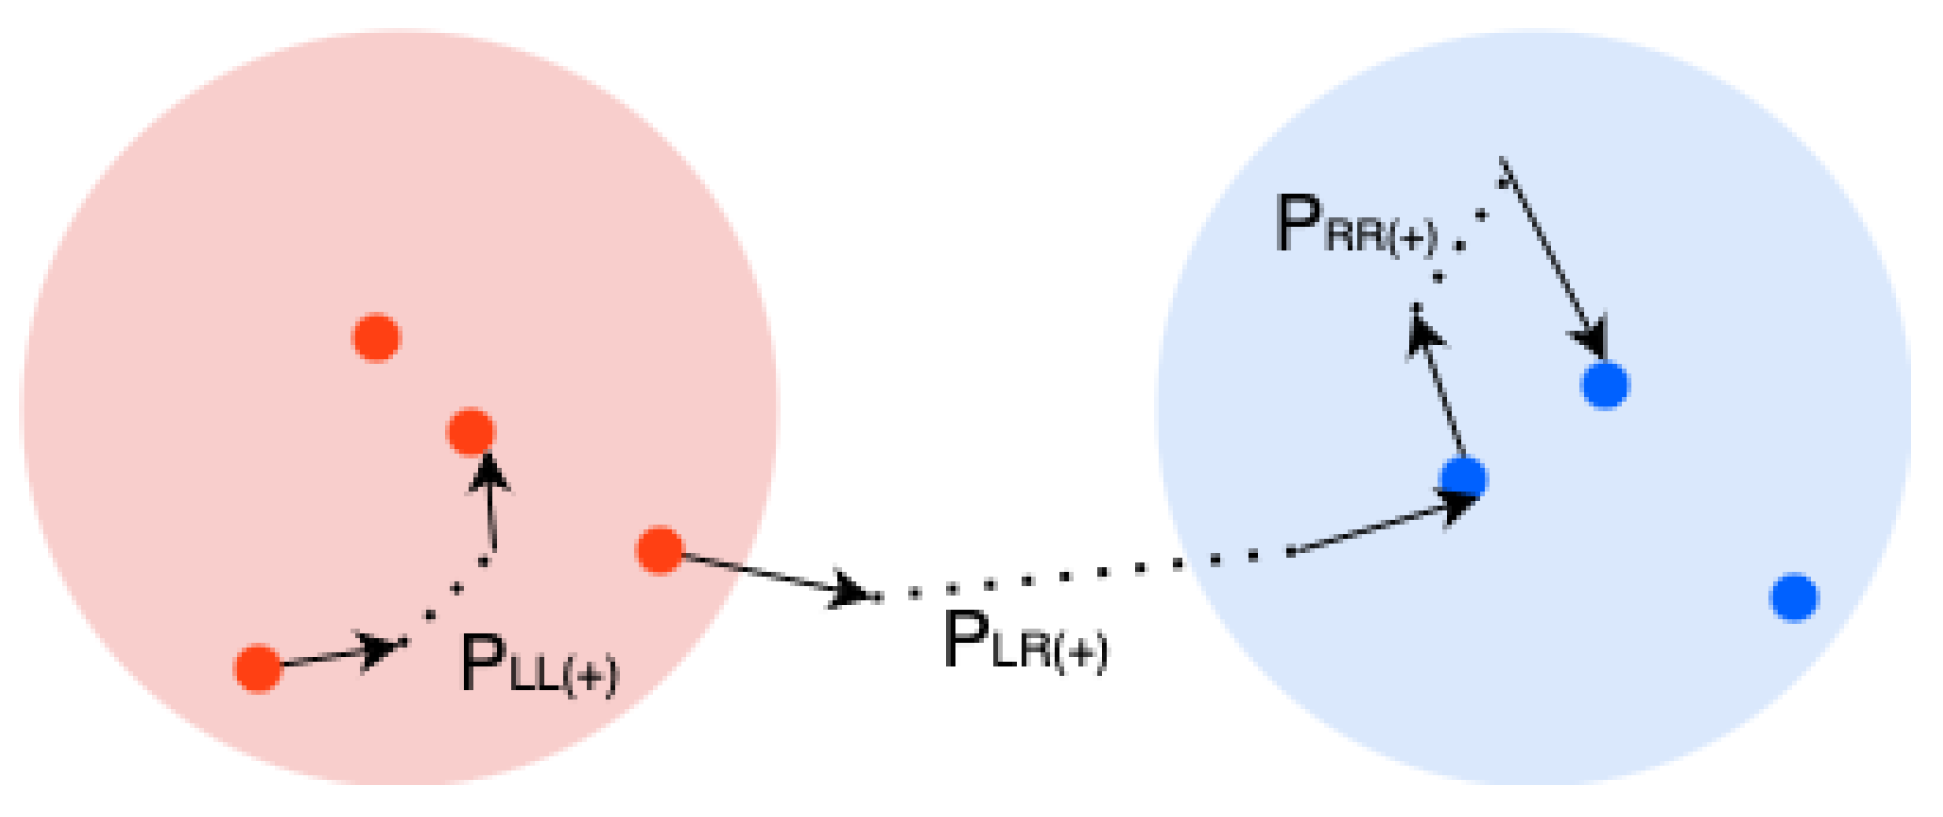
  • P L L + represents the probability of a random walk starting at a random left node ( L ) and finishing at a central left node ( L + ) ;
  • P R R + is the probability of starting on any right node ( R ) and ending on a central right node ( R + ) ;
  • P L R + and P R L + measure the probability of a walk crossing sides;
  • C denotes the number of walks that fall into one of the previously identified classes.
Figure 2 illustrates the RWC approach. In this paper, the left side is assumed to refer to the anti-vaccine group, while the right side refers to the pro-vaccine group.
The RWC polarization score returns values ranging from 1 (perfect polarization) to −1 (no polarization). These values were evaluated over different periods, and then a deeper analysis was conducted into sub-periods, showing high polarization and explaining the factors or issues that led to the divergence.

4. Experiment Results

In this section, the results obtained from implementing the proposed system outlined in the Methodology Section will be discussed. This includes the data collection process and preparation, the experimental outcomes of applying a GCN and FP to classify user stances within the retweet network, and the identification of network polarization in Kuwait using RWC.

4.1. Dataset Collection and Preparation

The steps in Section 3.1 and Section 3.2 were implemented to collect the social network dataset containing posts (tweets) related to vaccine stances during the COVID-19 pandemic in Kuwait. The final collected retweet social network dataset (dataset available upon request by email from the corresponding author) contains 141,823 retweets, and their original tweets, from December 2020 to July 2022; the retweets were between 15,246 unique users.
In addition to the main dataset of retweets related to vaccine stance, all the official announcements made by the Kuwaiti government regarding the COVID-19 pandemic from December 2020 to July 2022 were gathered. The primary source for these data was the Twitter account of the Center for Government Communication, Kuwait (@CGCKuwait). This account was used as the official resource for publishing all government regulations and precautions related to the COVID-19 pandemic. These extra posts were needed for later use in analyzing the polarization points and identifying the announcements that led to the spike in debates between the two camps.

4.2. Stance Detection Using Graph Convolutional Network and Feature Propagation

The steps explained in Section 3.3 and Section 3.4 were applied to construct a vaccine stance retweet network adjacency matrix. Then, the GCN and FP algorithms were implemented.
Since some user nodes’ vaccine stances were not recognizable because they retweeted both anti- and pro-vaccine tweets in equal quantities, 10% of users (1525) with a stable stance on the COVID-19 vaccine were selected as the ground truth dataset to start the graph convolutional network. These 1525 users were divided into 784 pro- and 741 anti-vaccine.
Next, several Boolean feature matrices X were constructed, including the post-text feature matrix, hashtag feature matrix, bigram feature matrix, trigram feature matrix, and URL domain feature matrix. Each feature matrix was built such that if u s e r i retweet text had that feature, then the cell was filled with ‘1’; otherwise, the cell was filled with ‘0’. Furthermore, in cases where the user post did not contain common features in their retweet text, entries were filled with ‘−1’. To fill the missing (undecidable) features, the FP algorithm was run; Table 1 shows the initialization process of the feature matrix X.
After preparing the dataset, it was split into training and test datasets; of the labeled dataset, 70% was randomly selected as a training set and 30% as a test set. Then, the training set was used to train a two-layer GCN model. The model was built with a 0.05 learning rate and 64 hidden dimensions. As shown in Table 2, different epoch values were tested, and the best performance was achieved when the number of epochs was 200. For better validation, we tested 10 runs with randomly selected training and test datasets. Then, we considered the mean and standard deviation values. The experiments showed that the best-performing GCN model is that where bigrams are used as the feature matrix; this setup achieves 96.53% accuracy and 96.51% AUC. Next, the training and test datasets were combined to train the final GCN model. Using this model, all 15,246 users in the retweet social network graph were labeled as either pro- or anti-vaccine, giving 9364 pro- and 5882 anti-vaccine users. Figure 3 illustrates the labeled vaccine stance retweet social network graph.
To validate the performance of a GCN with FP models, we compared the result of the our model with the label propagation (LP) as a baseline model. For this, we used the same dataset used to train a GCN with the FP algorithm in order to classify the nodes. The GCN with the LP algorithm achieved mean accuracy and F1 scores of 94.48% and 94.55%, respectively. On the other hand, the GCN with the FP model, with different types of features, was able to outperform the base model in all performance measures. The best-performing GCN with FP is that which uses bigrams as features and achieved 96.53% and 96.52% in mean accuracy and F1 scores, respectively. Table 3 shows the detailed results of the experiments.

4.3. Network Polarization Based on the Vaccinated Population in Kuwait

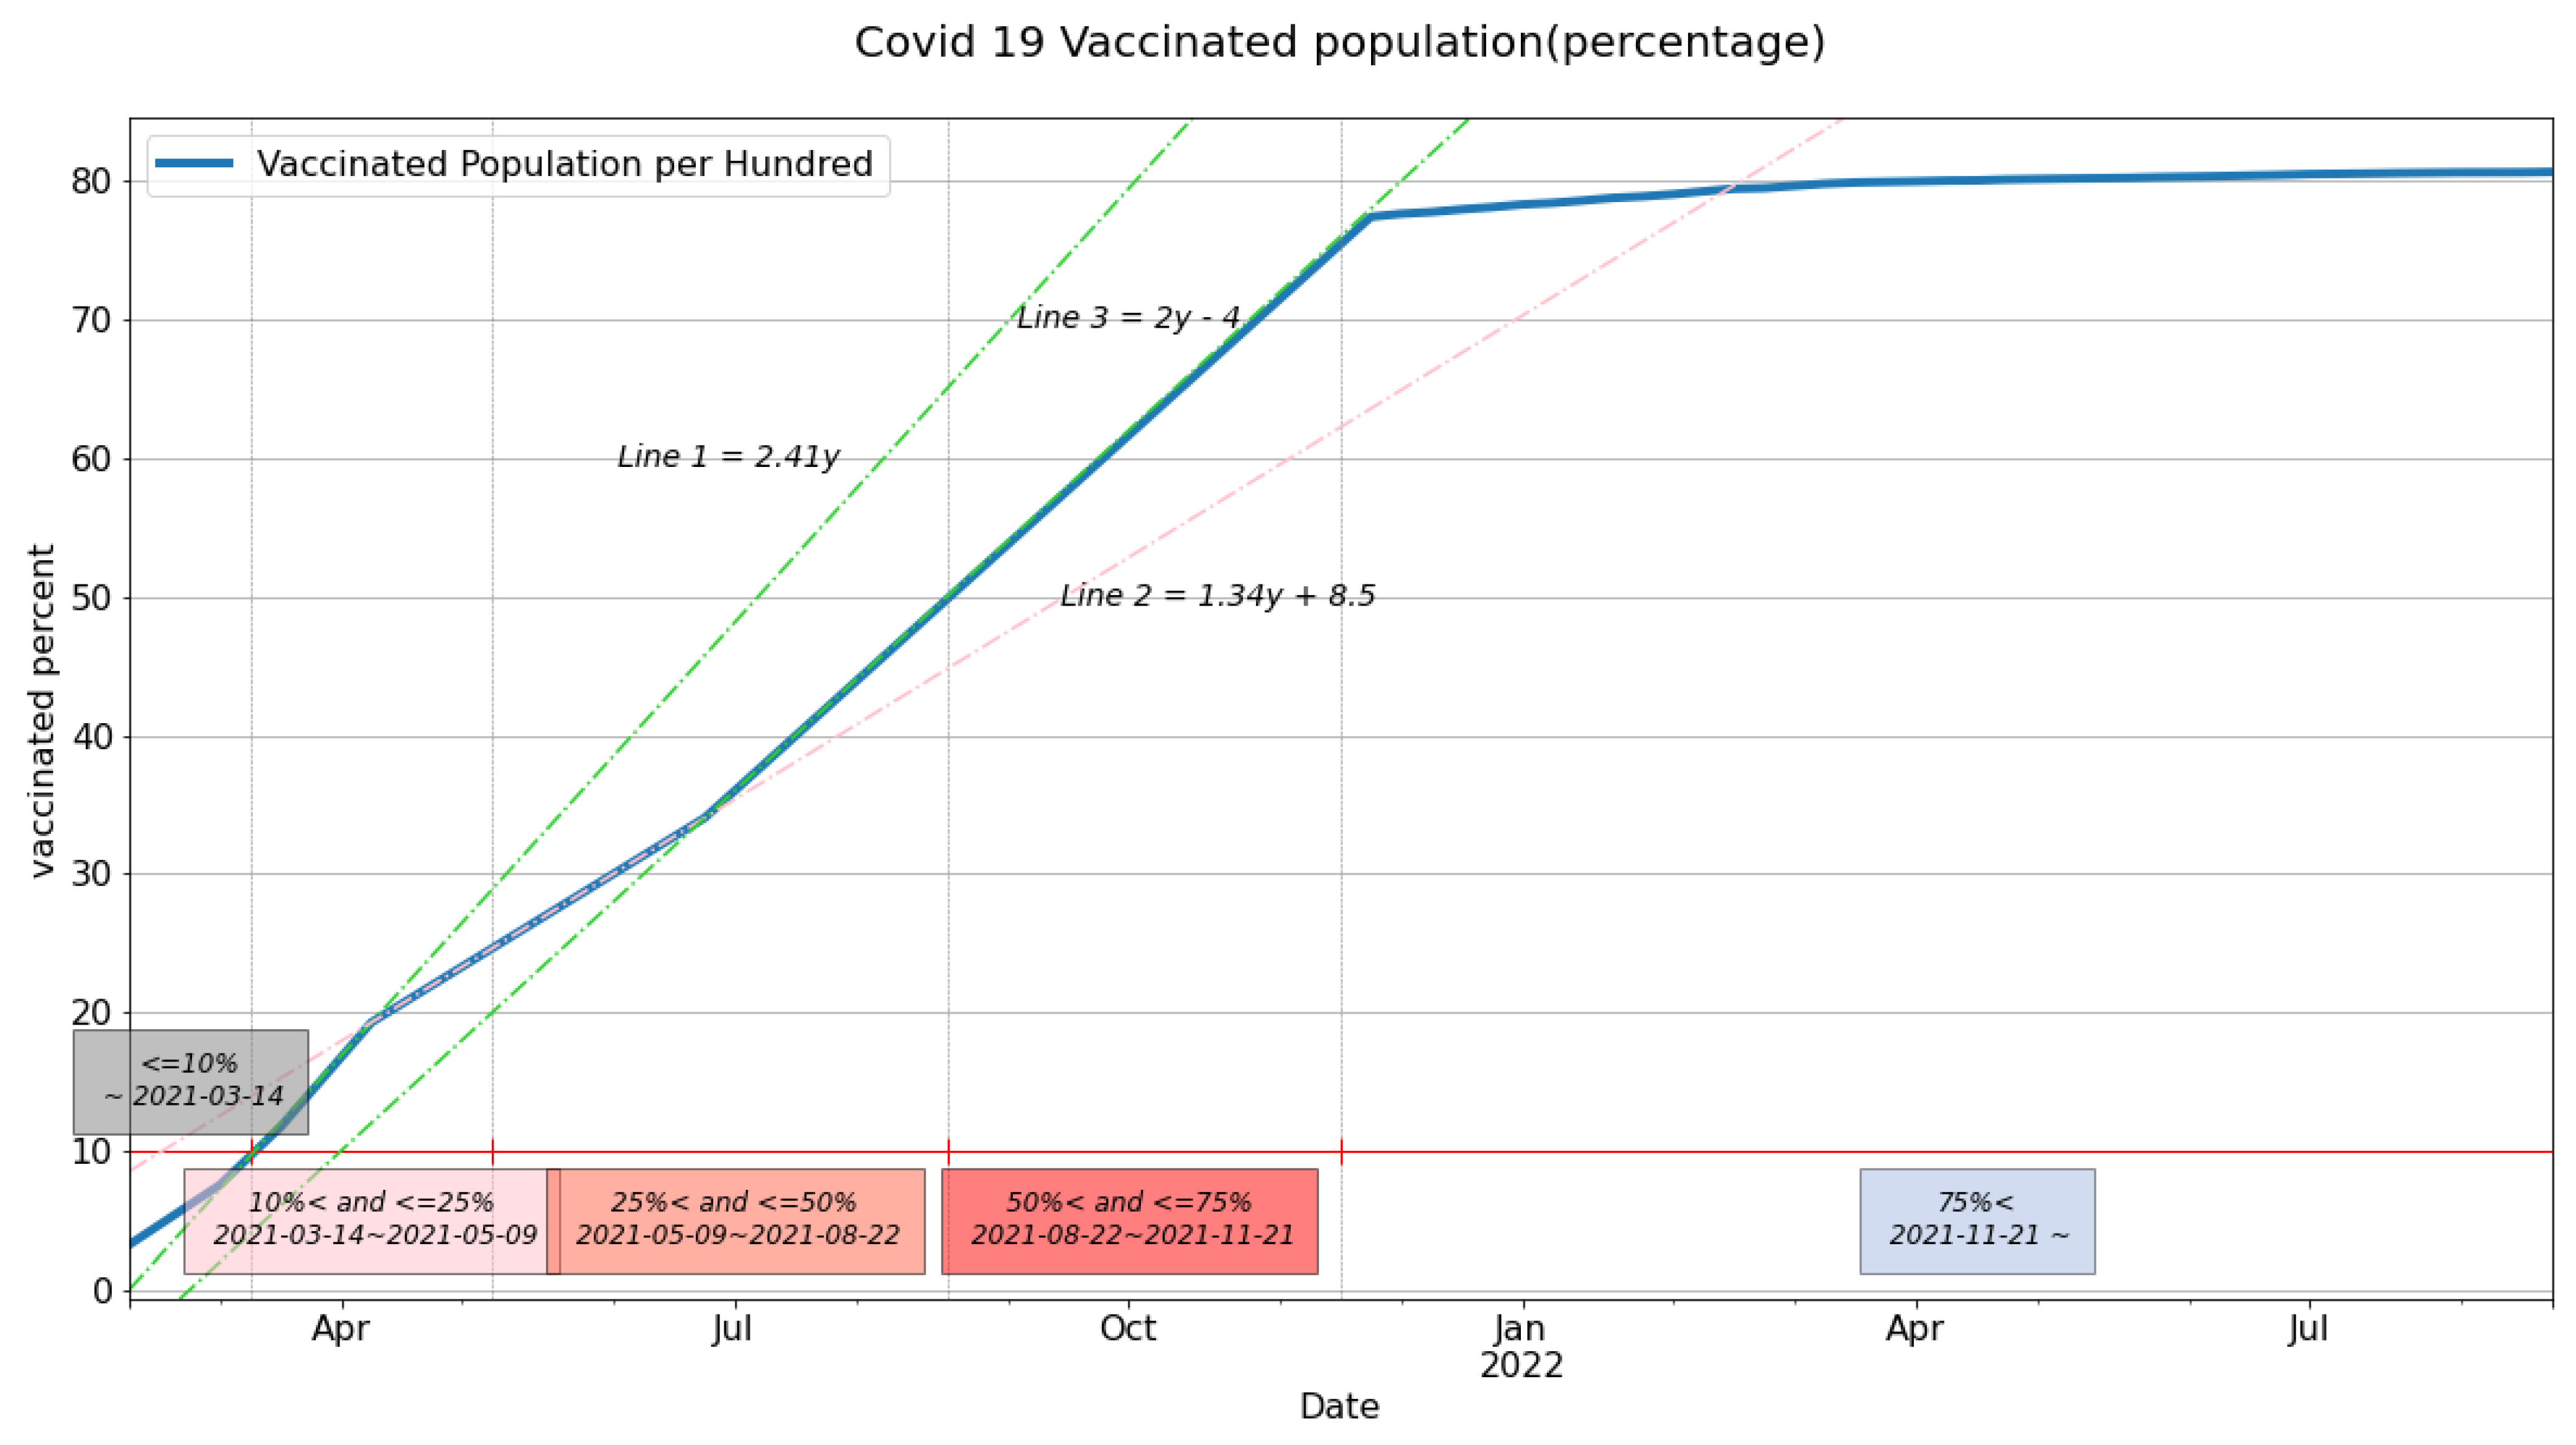
The steps outlined in Section 3.5 were implemented, with the RWC score adopted from [17], in order to detect the levels of division and conflict among users in the vaccine stance retweet social network. Then, Kuwait’s vaccinated population data were extracted from the “Our World in Data” website [46]; retweet network polarization was observed according these data. For this purpose, the dataset was divided into five periods based on vaccination percentage (less than 10%, between 10% and 25%, between 25% and 50%, between 50% and 75%, and greater than 75%).
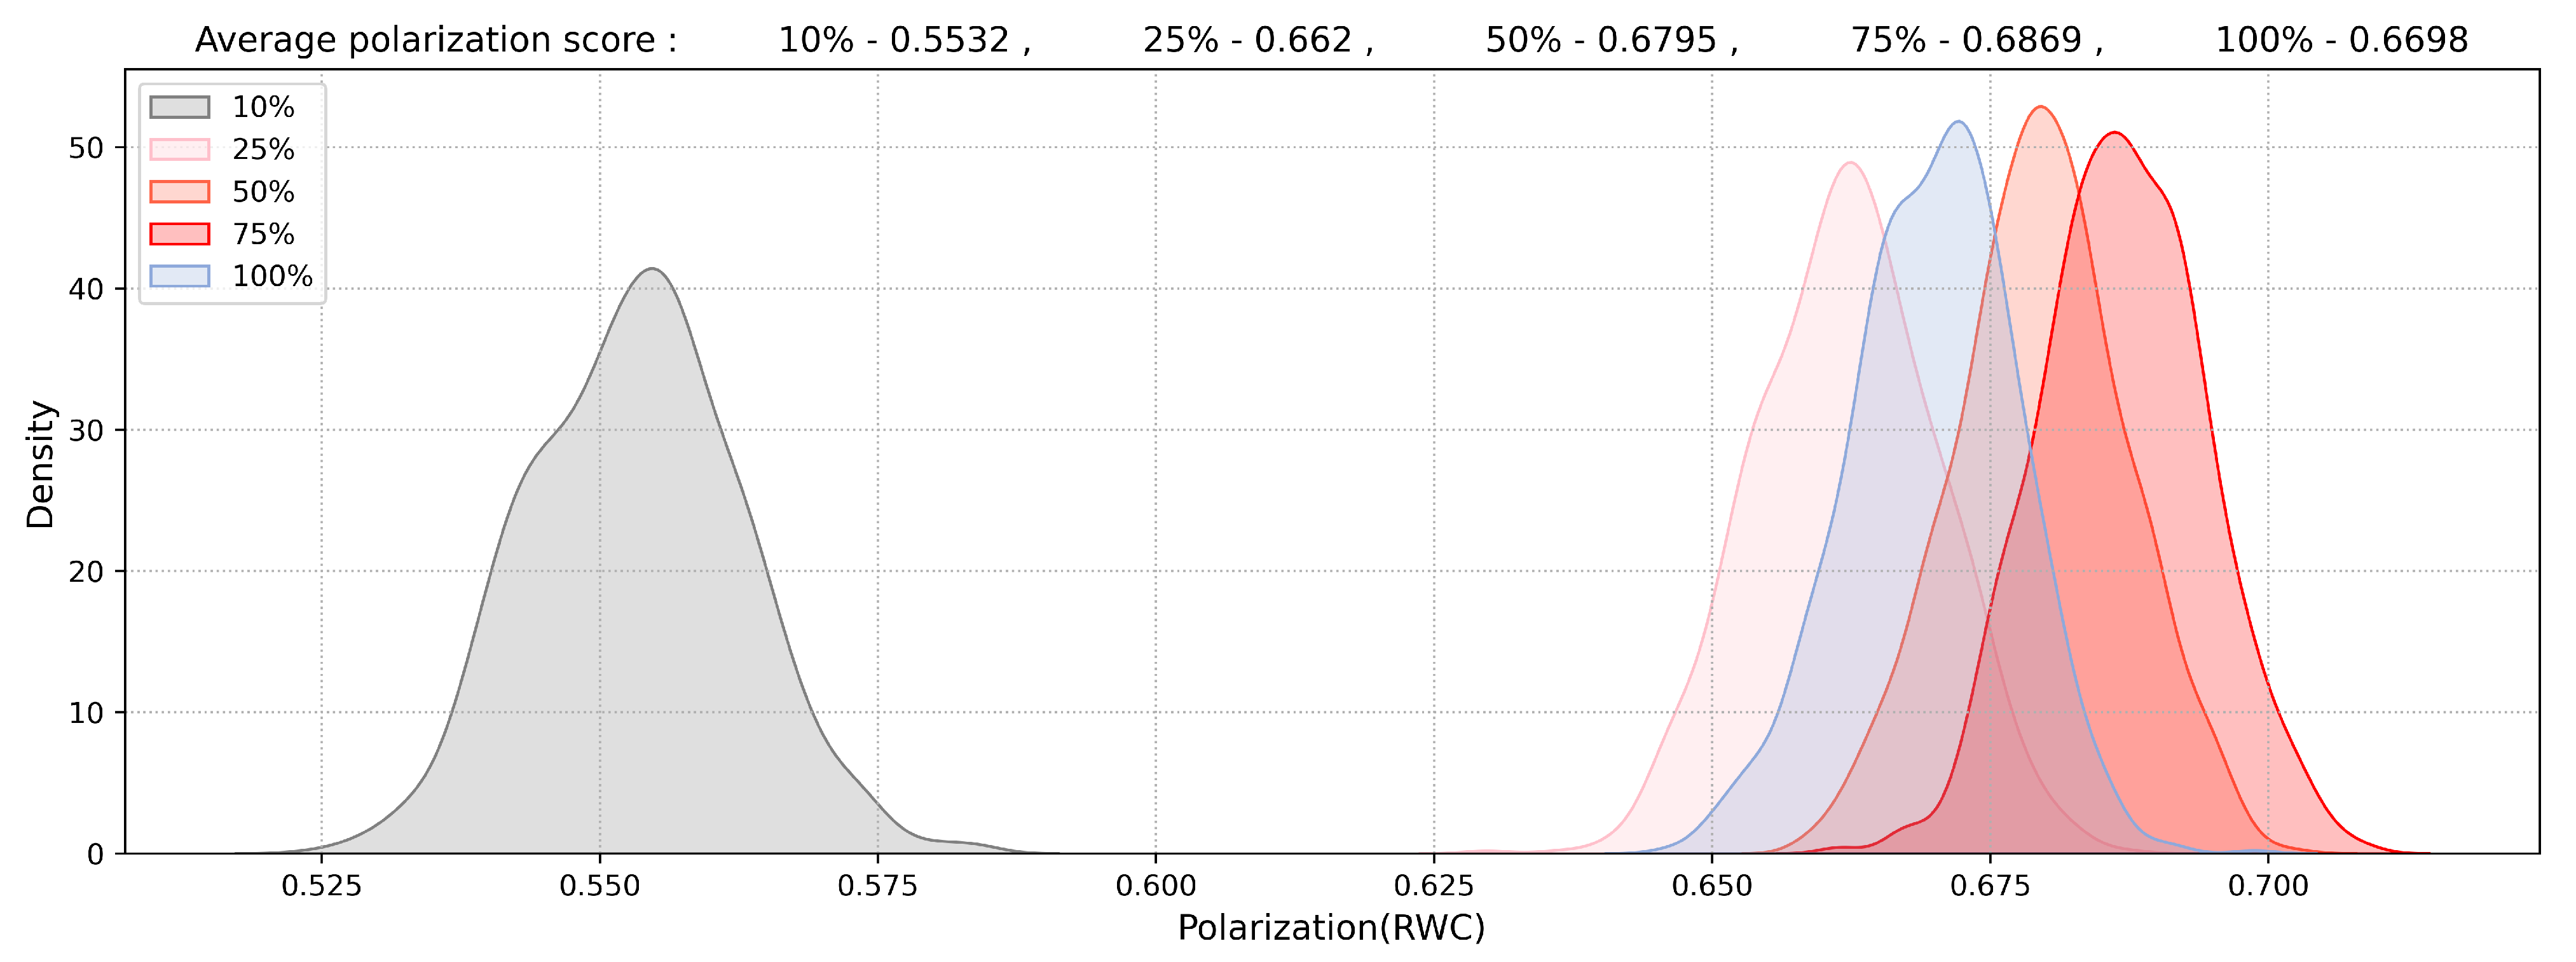
Figure 4 represents the percentage of vaccinated citizens in Kuwait. In the figure, lines 1, 2, and 3 were drawn to compare the slopes of the vaccinated population; the change in the slope can be used to detect the periods where vaccine rates became slower, indicating vaccine hesitancy. From the figure, we recognized that the slope of line 2, with a slope value of 1.34, is smaller than the other two lines’ slopes, which are around 2. From this value, we conclude that fewer people were getting vaccinated during those periods, indicating that vaccine hesitancy started between periods 2 and 3. Next, to further understand the reasoning and the level of division within the vaccine stance retweet social network graph, we measured network polarization using the RWC score, as explained in Section 3.5. Based on the five vaccination periods, Figure 5 shows that the RWC polarization score increased until 75% of the population was vaccinated, indicating that the two sides were in a continuous argument during those periods. However, after 75% of the population was vaccinated, arguments started to cool off between them. Figure 5 shows that the changes in the average polarization RWC score were the most pronounced in the periods between 10% and 25% vaccination, with average RWC values of 0.553 and 0.662, respectively. This significant change was during the first-dose vaccination period. During this period, the anti-vaccine group was very active in expressing their attitudes toward vaccines. At the same time, the pro-vaccine group aimed to raise awareness about the significance of getting vaccinated; the second most significant change in retweet network polarization was the change in the period between 25% and 50%, i.e., from 14 March 2021 to 22 August 2021, where the average RWC values were 0.662 and 0.679, respectively. Finally, the third largest change was between 50% and 75%, i.e., from 22 August 2021 to 21 November 2021, where the average RWC values were 0.679 and 0.686.

5. Discussion

To gain further insight, after analyzing Figure 6, we observed how polarization significantly increased during periods 2, 3, and 4 after vaccine hesitancy appeared. These periods were thus divided into ten smaller sub-periods, each spanning 3 weeks, starting from 17 April 2021, which, as shown in Figure 4, marks the starting point of vaccine hesitancy. Then, the RWC score was measured for each sub-period. Figure 6 shows the RWC score values for each sub-period; the results showed that the maximum increase in polarization was observed between periods 5 and 6 (July to August 2021), with an average increase of +0.1. This indicates that some new events or announcements took place during that period, leading to an increase in debates or arguments between users. The second largest average increase of +0.08 was observed between periods 8 and 9 (September to October 2021), and the third largest increase of +0.05 was observed between periods 3 and 4 (May to July 2021). The polarization RWC score was the lowest in period 10 at 0.523, indicating that people were no longer interested in discussing vaccines or that the announcements during that period were not compelling enough to spark debates.
To understand why social media users became divided on the topic of vaccination during specific periods, the official governmental COVID-19 announcements were examined. Specifically, the Twitter account of the Center for Government Communication, Kuwait (@CGCKuwait), was analyzed to identify the topics that sparked debate between those who were pro- and those who were anti-vaccine.
The government made several significant announcements during periods 5 and 6 (July to August 2021); these announcements included the following:
  • On 26 July, the government announced that all activities were open for vaccinated people. Non-vaccinated individuals could only visit supermarkets, food and grocery stores, hospitals, pharmacies, and government agencies. A screenshot of this post is shown in Figure 7.
  • On 27 July, the government announced new travel procedures for departures from and special measures for arrivals to Kuwait. The government maintained their ban on international travel for citizens who were not vaccinated against COVID-19. Additionally, specific vaccination requirements applied for arrivals.
  • On 11 August, the government announced that public schools would open on September 29th.
  • On 18 August, the government announced the initiation of direct commercial flights to India, Egypt, Bangladesh, Pakistan, Sri Lanka, and Nepal.
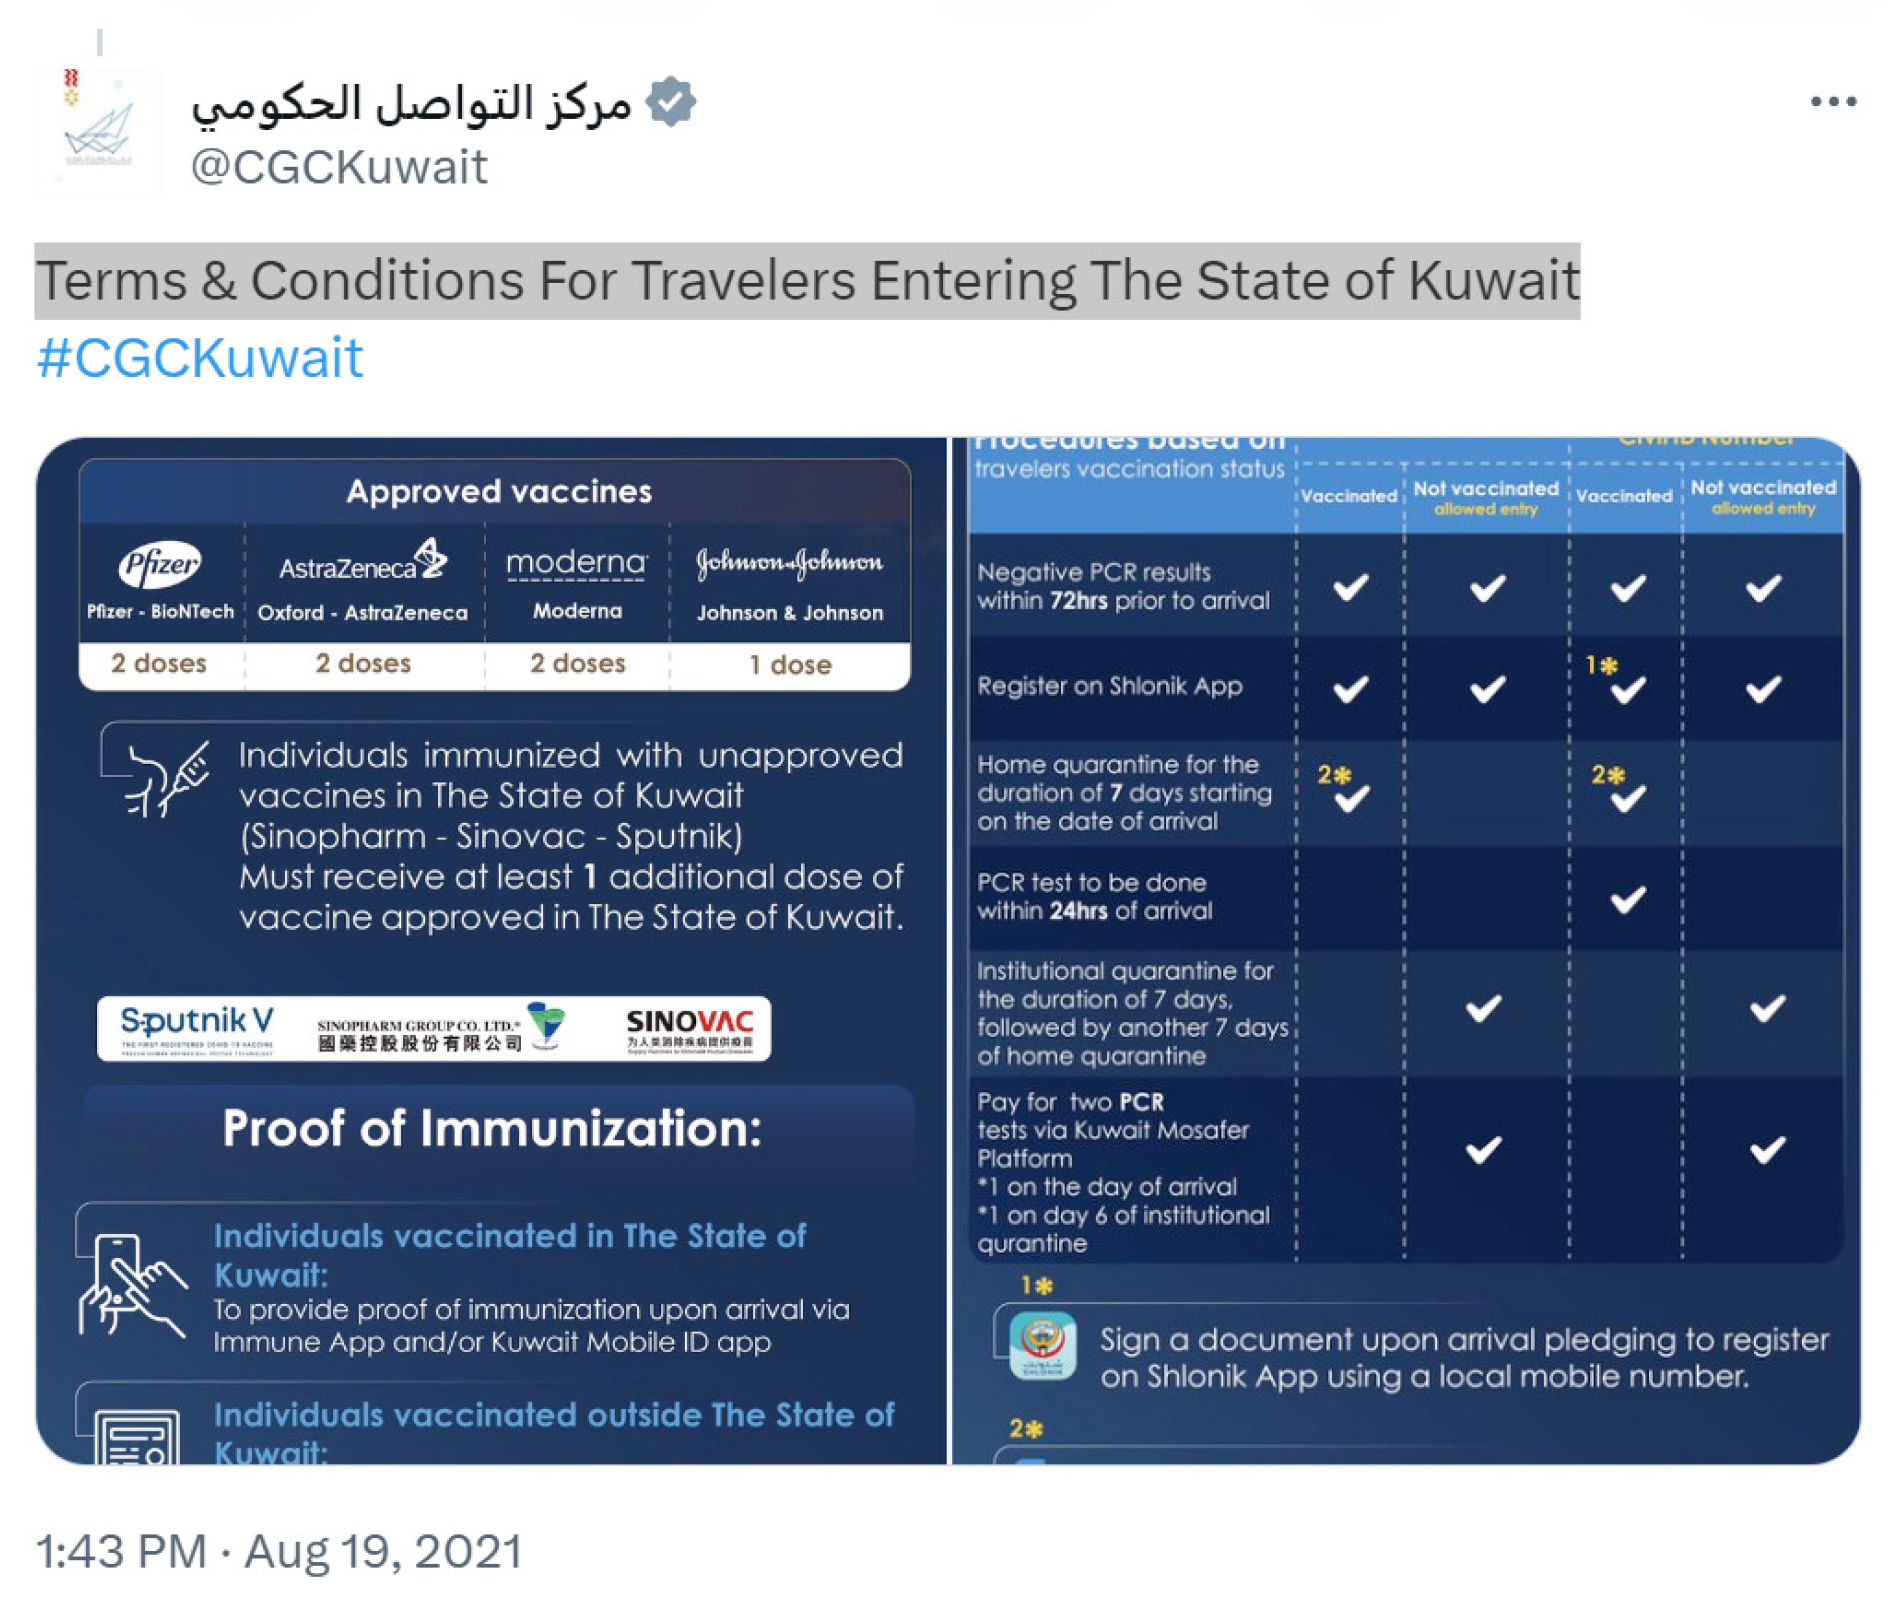
  • On 19 August, the government announced new terms and conditions for travelers entering Kuwait; a screenshot of this post is shown in Figure 8.
Based on these announcements, we concluded that the increase in controversy between the two sides was mainly related to the ban on non-vaccinated people traveling to or from Kuwait and the opening of all activities for vaccinated people. At the same time, non-vaccinated individuals were only allowed to visit certain places. To confirm our conclusion, we analyzed the bi- and trigram phrases related to the events mentioned above during periods 5 and 6. Examples of such phrases are included in Table 4.
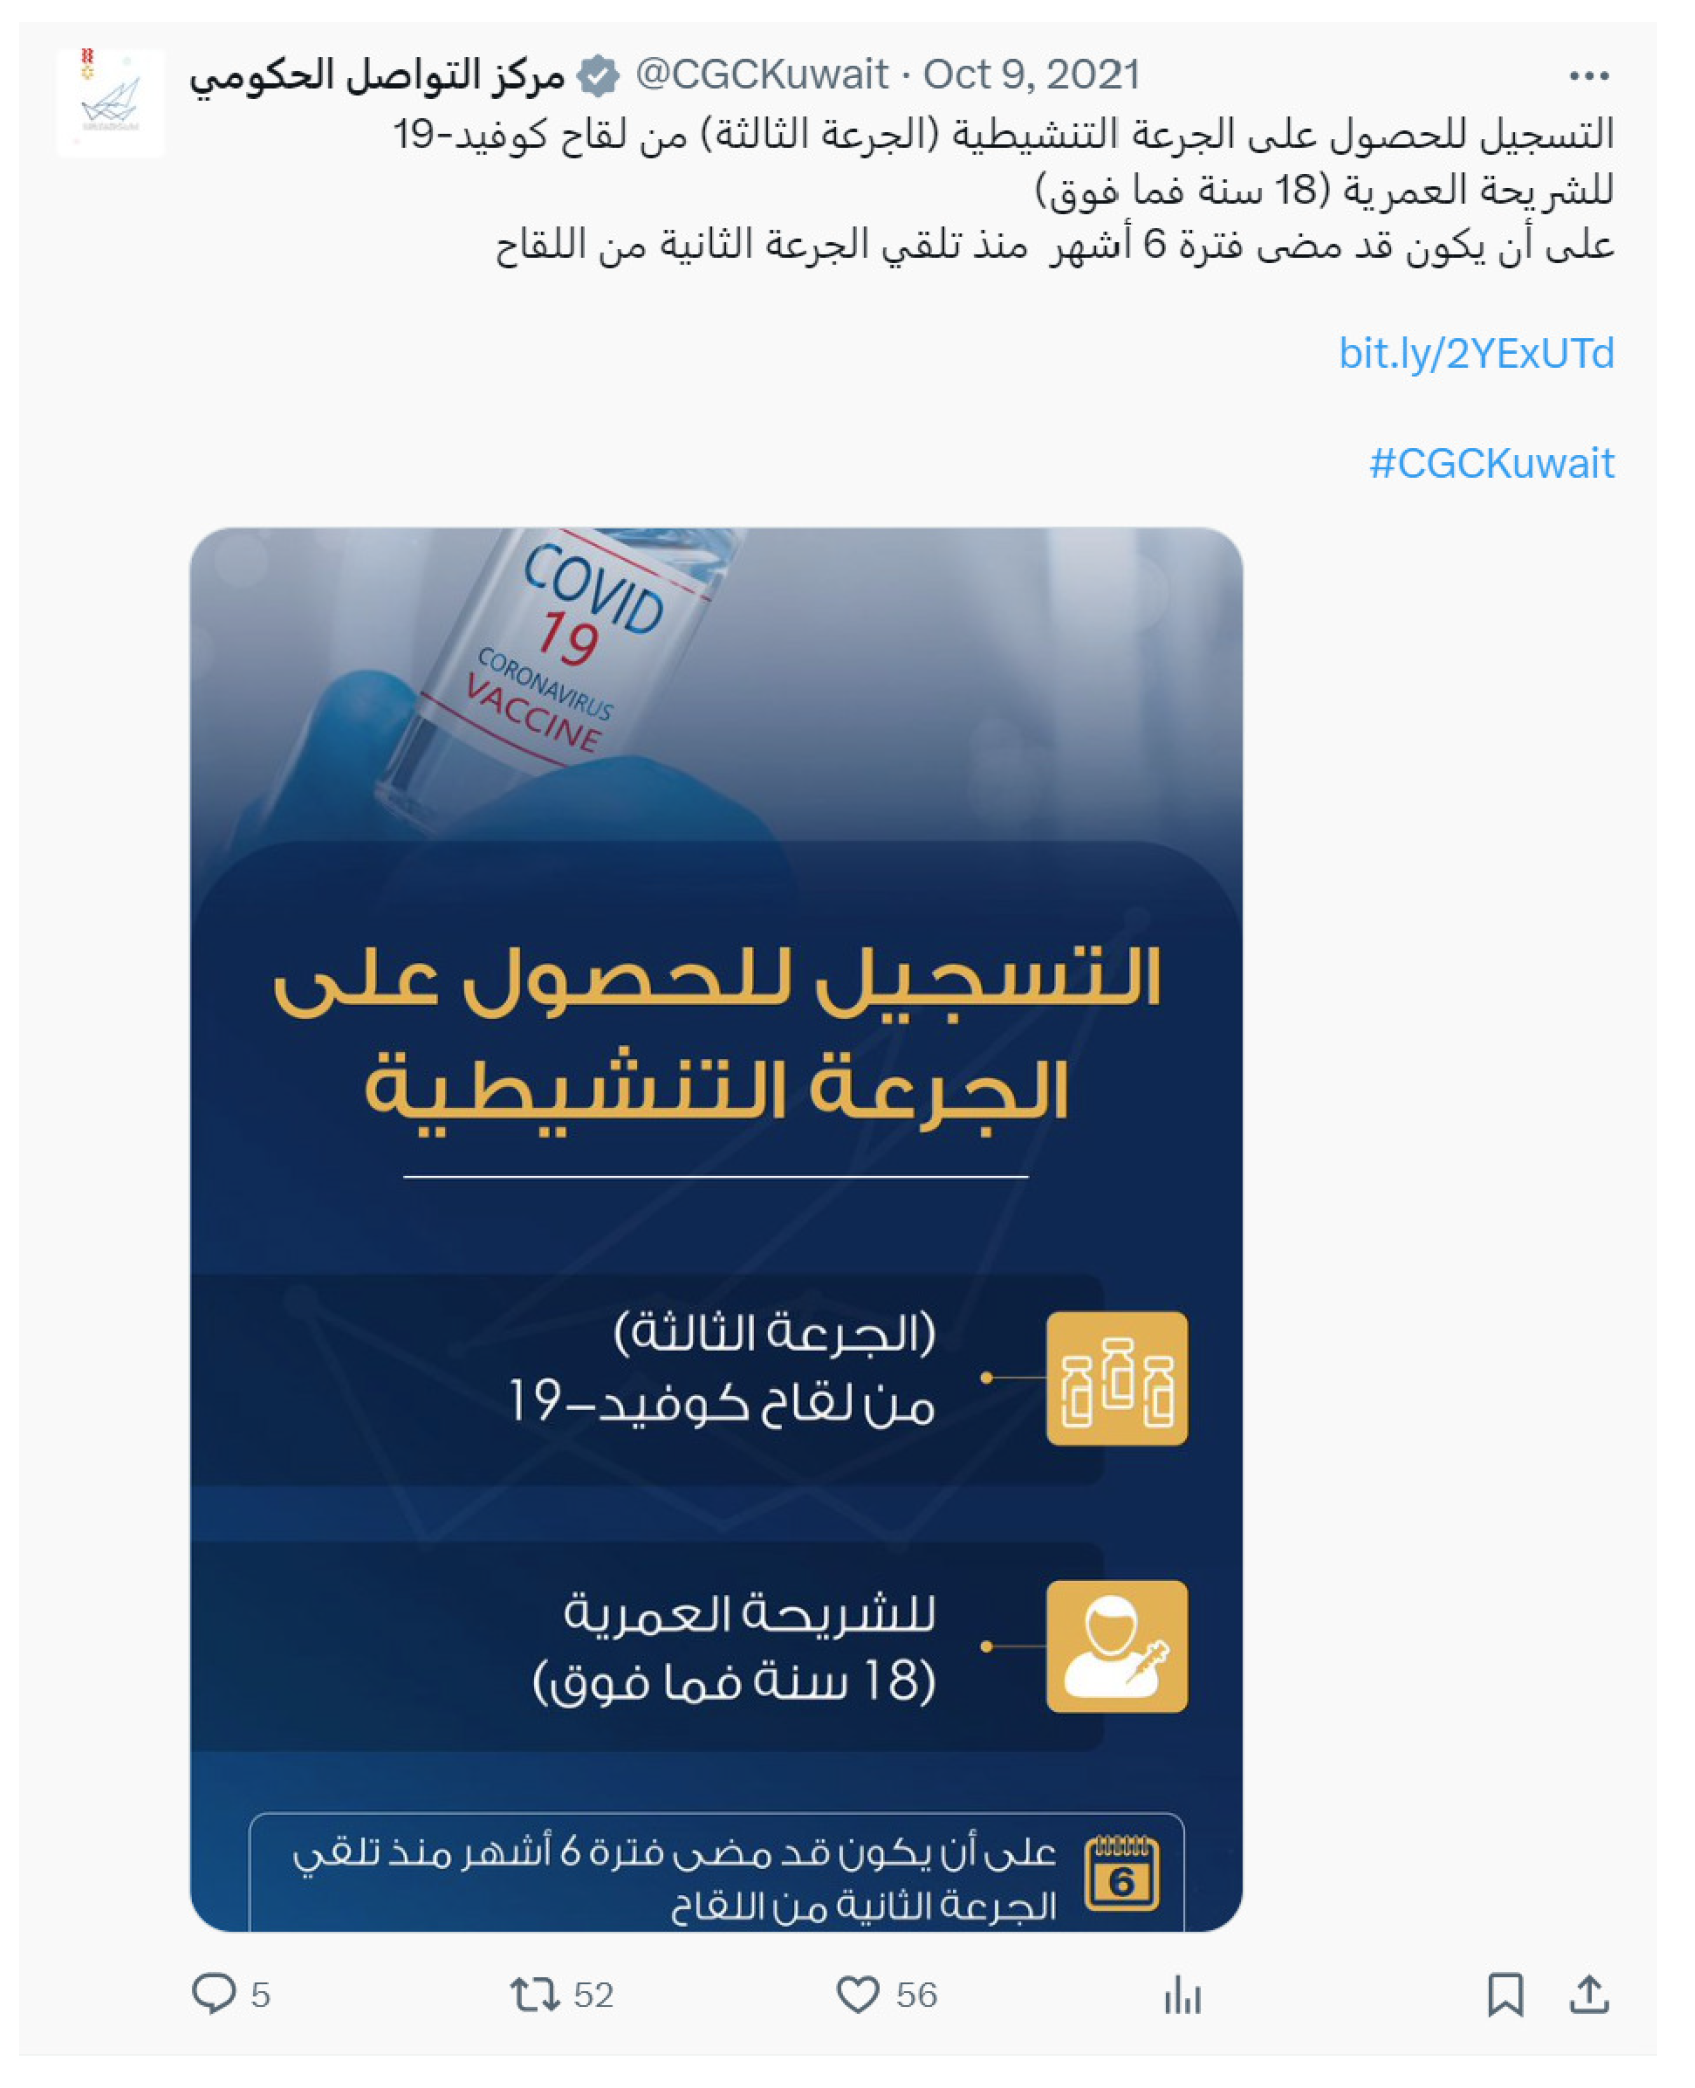
Next, between September and October 2021, two significant announcements were made during periods 8 and 9. In the first one on 9 October 2021, registration for the booster dose (third dose) was opened for all age groups from 18 years old and over, as shown in Figure 9; this announcement opened up the debate between anti- and pro-vaccine individuals. It led to an increase in polarization during this period. Additionally, many fully vaccinated individuals started to complain and question the usefulness of taking a third dose. We confirmed the occurrences of related words during periods 8 and 9 by analyzing the bi- and trigram phrases related to these events. Examples of such phrases are included in Table 5.
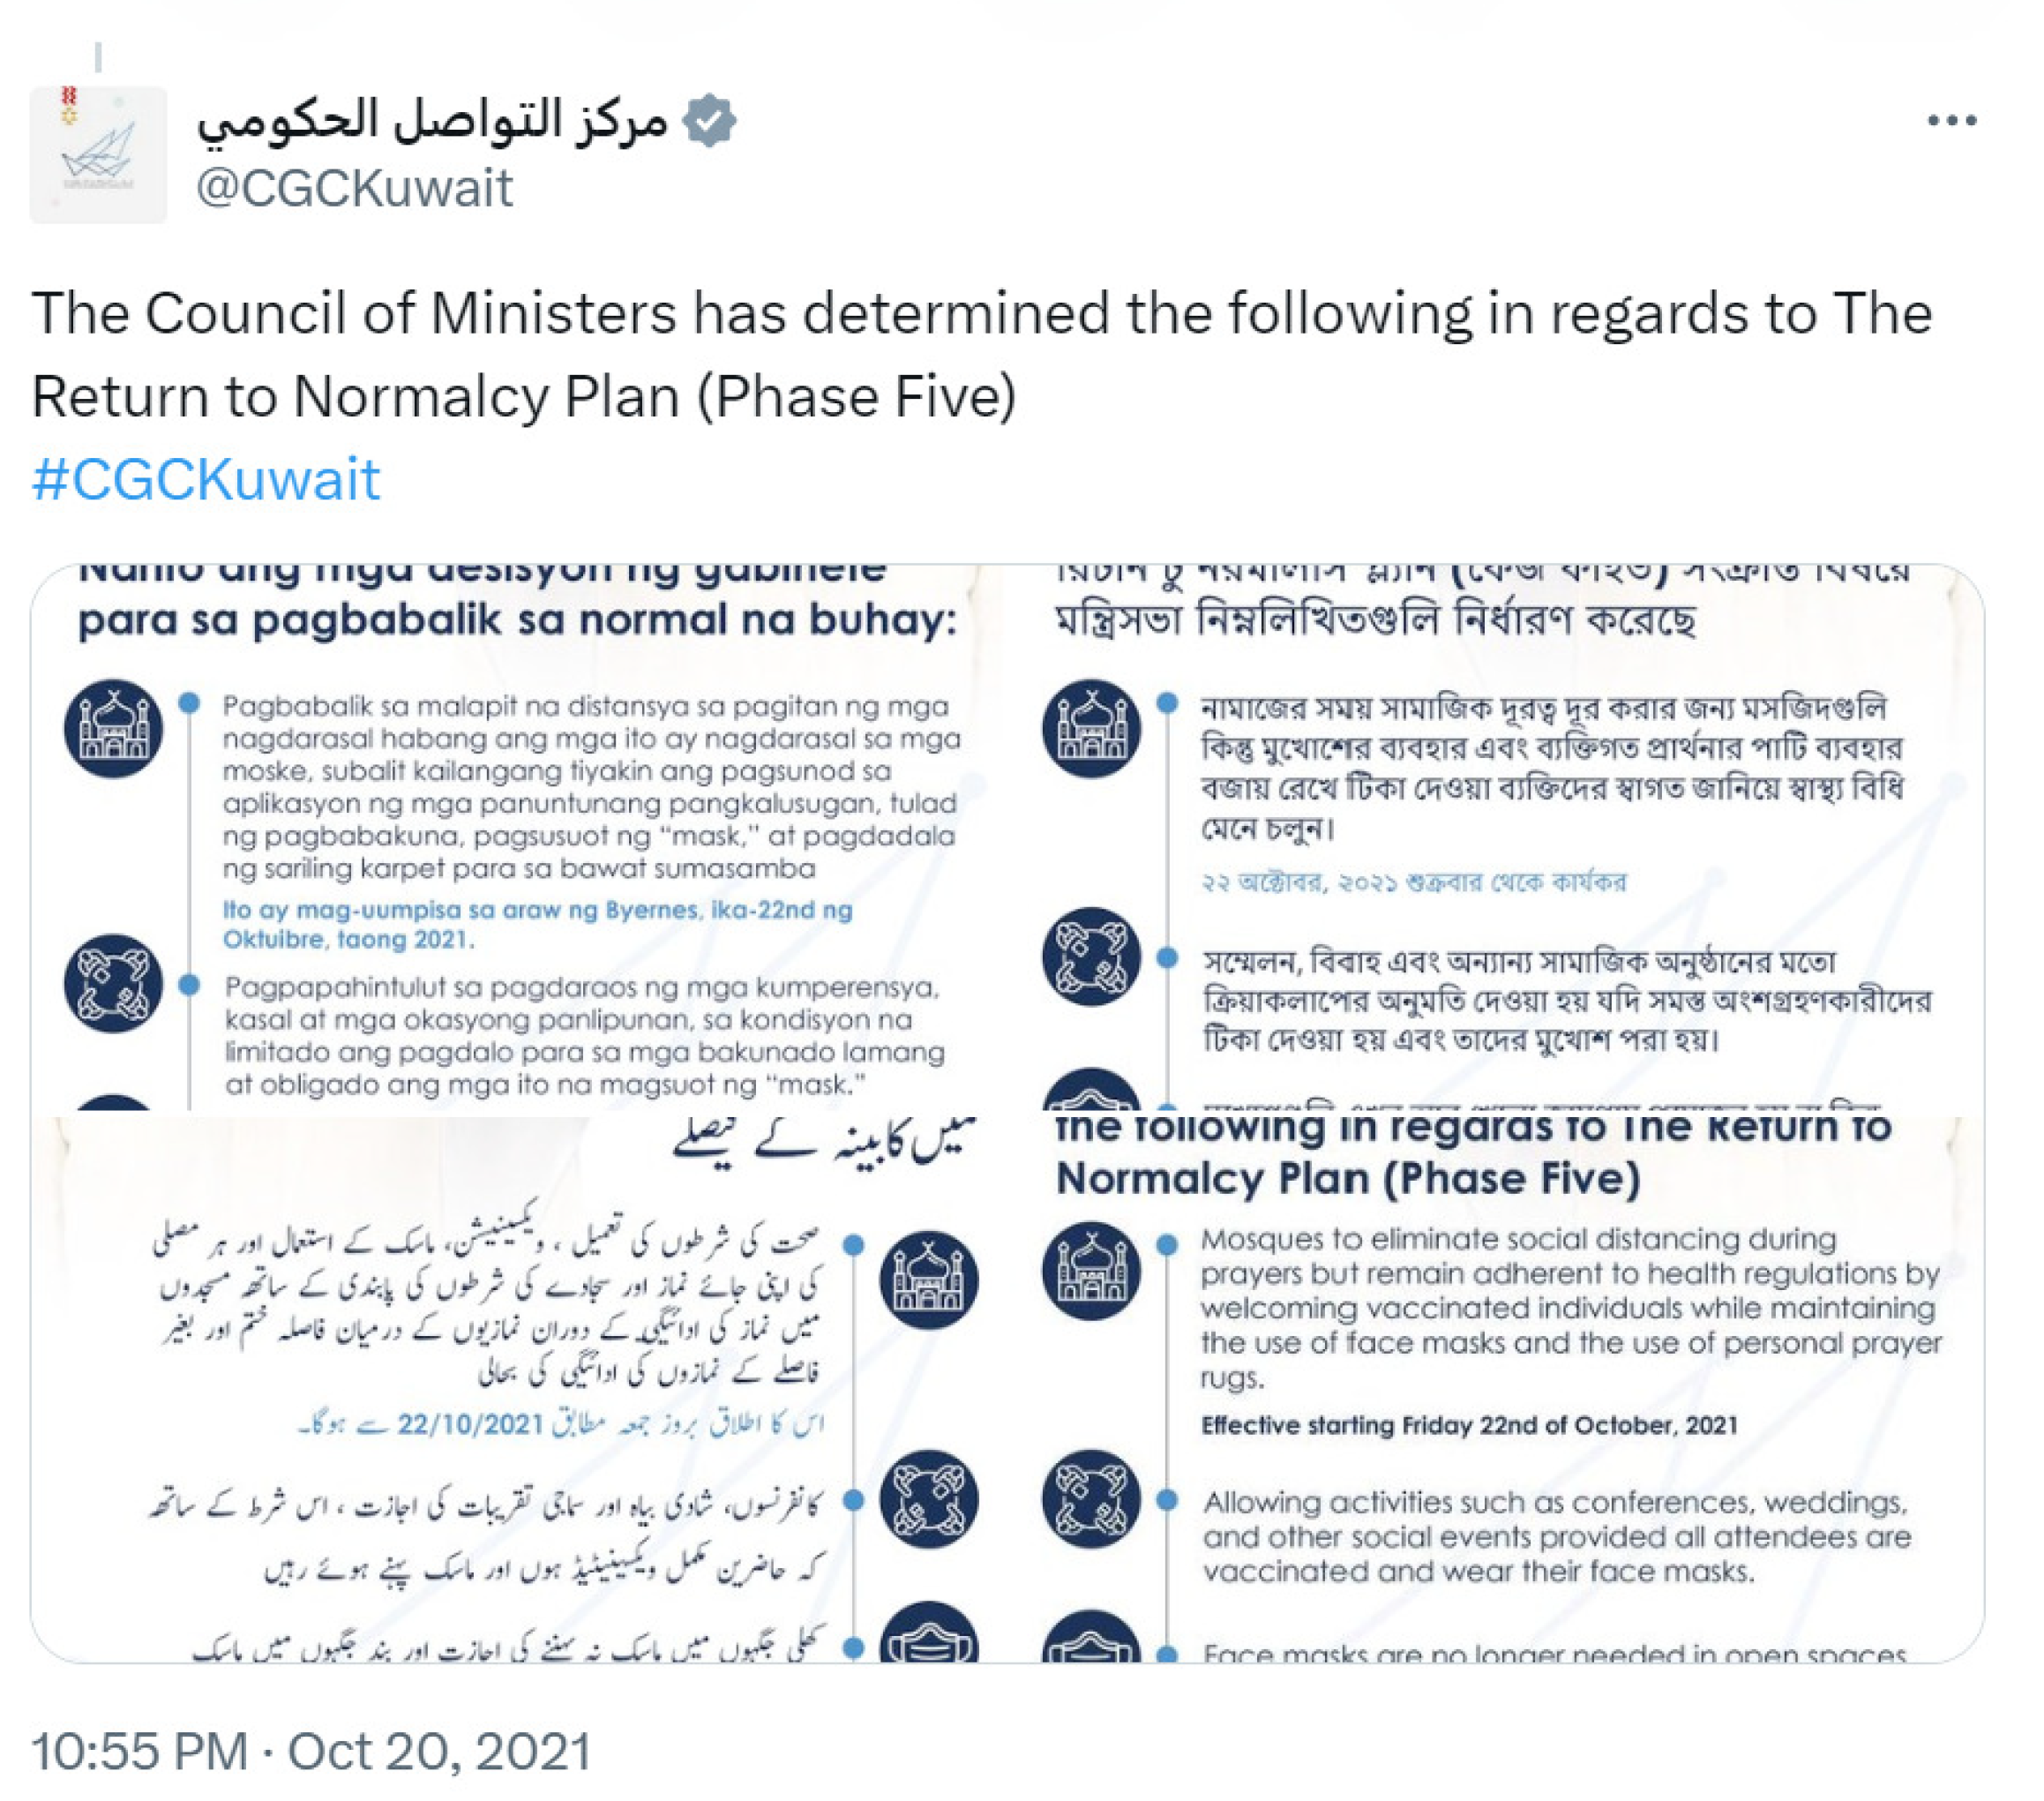
Later, on 20 October 2021, the last day of period 9, the council of ministers announced the return-to-normalcy plan (phase 5). As shown in Figure 10, according to the plan, all activities were allowed for vaccinated people, social distancing in mosques during prayer was eliminated, face masks were not required in open spaces but only in closed places, and the airport was working at full capacity. We assume that the effect of this announcement is reflected in period 10, where the polarization decreased significantly as pro-vaccine individuals started returning to their everyday lives and were no longer interested in debating or discussing topics related to vaccines.Meanwhile, the anti-vaccine group remained active and continued to retweet about their rights, guaranteed by the Kuwaiti constitution, to not be vaccinated and to perform their daily activities without restriction.
Finally, the Kuwaiti government made the following significant announcements during periods 3 and 4:
  • On 7 June 2021, the government announced the reopening of museums and cultural centers for vaccinated individuals and the continuation of direct flights to and from the United Kingdom.
  • On 8 June 2021, the government introduced regulations for 12th-grade high school final exams, requiring students to take written exams on school premises.
  • On 17 June 2021, the government announced that individuals who had received two doses of the COVID-19 vaccine could travel internationally. Additionally, fully vaccinated expats could enter the country after undergoing a PCR test.
  • On 24 June 2021, the government allowed vaccinated individuals, whose status appeared in green and orange on the Kuwait Mobile ID and Immune applications, to enter malls, restaurants, cafes, theaters, cinemas, cultural centers, gyms, and beauty salons.
The requirement for 12th-grade students to take exams in school, restricting travel for non-vaccinated individuals to or from Kuwait, and granting vaccinated individuals exclusive access to certain activities sparked substantial debate and public discourse. Many voiced their concerns and criticisms regarding the fairness and safety of these policies. To confirm these conclusions, we extensively analyzed the bi- and trigram phrases during periods 3 and 4, and the examples we found supported our assumptions included in Table 6.

6. Conclusions

In this study, we used social retweet network graphs and structured features to classify users into pro- or anti-vaccine stances. We employed a graph convolutional network and a feature propagation-based classification algorithm. We achieved the best accuracy of 96% using bigrams for the feature matrix; this approach was able to outperform the base model, which used the graph convolutional network with a label propagation-based classification algorithm. The random walk controversy (RWC) score was utilized as a social network polarization measure to examine the retweet network between pro- and anti-vaccine individuals in relation to Kuwait’s vaccinated population. The RWC polarization score increased until 75% of the population was vaccinated, indicating ongoing debates between the two sides during these periods. After 75% of the population was vaccinated, the polarization decreased, marking a point of divergence from the polarization measure. Furthermore, our analysis revealed that several governmental announcements, primarily those related to travel and activity restrictions for non-vaccinated individuals, led to increased debates between the pro- and anti-vaccine camps. To validate our assumptions regarding the impact of these announcements, bi- and trigram phrases were analyzed over the sub-periods, and related keywords for each triggering announcement were identified.
Our study demonstrates the effectiveness and high accuracy of a GCN and the FP classification algorithm in identifying vaccine stances on social networks. The polarization dynamics observed through the RWC score provide valuable insights into the impact of vaccination campaigns and related governmental policies on public discourse.
As a future research avenue, we plan to explore different types of retweet networks originating from Kuwait. Additionally, we want to incorporate bot detection in different datasets to assess the impact of bots on polarizing conversations between opposing groups. We plan to experiment with various graph convolutional networks to improve node classification performance and to extend the purposed approach to be capable of classifying more than two opinions.

7. Limitations

The first limitation of the proposed method is that it is only applicable within polarized social networks. Specifically, this method is designed to function effectively when two parties are engaged in opposition. However, real-life scenarios often feature instances where one party remains passive while the other is actively posting and retweeting. In such cases, our proposed method would fail to identify spikes in conversations, since these conversations will be single-sided. The second limitation is that the proposed method only applies to networks divided into two opinions, and is thus incapable of classifying more than two opinions.

Author Contributions

Conceptualization, Y.L., H.A. and H.D.; methodology, Y.L. and H.A.; software, Y.L. and H.A.; validation, Y.L. and H.A.; data curation, H.A.; writing—original draft preparation, Y.L.; writing—review and editing, H.A., Y.L. and H.D.; visualization, Y.L. and H.A. All authors have read and agreed to the published version of the manuscript.

Funding

This research received no external funding.

Data Availability Statement

The raw data supporting the conclusions of this article will be made available by the authors upon request.

Conflicts of Interest

The authors declare no conflicts of interest.

References

  1. Küçük, D.; Can, F. Stance Detection: Concepts, Approaches, Resources, and Outstanding Issues. In Proceedings of the 44th International ACM SIGIR Conference on Research and Development in Information Retrieval (SIGIR’21), Virtual, 11–15 July 2021; Association for Computing Machinery: New York, NY, USA, 2021; pp. 2673–2676. [Google Scholar] [CrossRef]
  2. ALDayel, A.; Magdy, W. Stance detection on social media: State of the art and trends. Inf. Process. Manag. 2021, 58, 102597. [Google Scholar] [CrossRef]
  3. Lai, M.; Cignarella, A.; Farías, D.; Bosco, C.; Patti, V.; Rosso, P. Multilingual stance detection in social media political debates. Comput. Speech Lang. 2020, 63, 101075. [Google Scholar] [CrossRef]
  4. Lee, Y.; Ozer, M.; Corman, S.R.; Davulcu, H. Detecting and Measuring the Polarization Effects of Adversarial Botnets on Twitter. In Proceedings of the 38th ACM/SIGAPP Symposium on Applied Computing, Tallinn, Estonia, 27–31 March 2023; pp. 1641–1649. [Google Scholar]
  5. Putra, C.B.P.; Purwitasari, D.; Raharjo, A.B. Stance detection on tweets with multi-task aspect-based sentiment: A case study of COVID-19 vaccination. Int. J. Intell. Eng. Syst. 2022, 15, 515–526. [Google Scholar] [CrossRef]
  6. Hardalov, M.; Arora, A.; Nakov, P.; Augenstein, I. A Survey on Stance Detection for Mis- and Disinformation Identification. In Proceedings of the Findings of the Association for Computational Linguistics: NAACL 2022, Seattle, WA, USA, 10–15 July 2022; Carpuat, M., de Marneffe, M.C., Meza Ruiz, I.V., Eds.; Association for Computational Linguistics: Seattle, WA, USA, 2022; pp. 1259–1277. [Google Scholar] [CrossRef]
  7. Li, Y.; He, H.; Wang, S.; Lau, F.C.M.; Song, Y. Improved Target-Specific Stance Detection on Social Media Platforms by Delving Into Conversation Threads. IEEE Trans. Comput. Soc. Syst. 2023, 10, 3031–3042. [Google Scholar] [CrossRef]
  8. Huang, W.; Wang, Y.; Yang, J.; Xu, Y. Stance detection based on user feature fusion. Comput. Intell. Neurosci. 2022, 2022, 5738404. [Google Scholar] [CrossRef]
  9. Liu, H.; Li, S.; Zhou, G. Two-target stance detection with target-related zone modeling. In Proceedings of the Information Retrieval: 24th China Conference, CCIR 2018, Guilin, China, 27–29 September 2018; Proceedings 24; pp. 170–182. [Google Scholar]
  10. Wei, P.; Lin, J.; Mao, W. Multi-target stance detection via a dynamic memory-augmented network. In Proceedings of the the 41st International ACM SIGIR Conference on Research & Development in Information Retrieval, Ann Arbor, MI, USA, 8–12 July 2018; pp. 1229–1232. [Google Scholar]
  11. Lai, M.; Tambuscio, M.; Patti, V.; Ruffo, G.; Rosso, P. Extracting graph topological information and users’ opinion. In Proceedings of the 8th International Conference of the CLEF Association, Dublin, Ireland, 11–14 September 2017; pp. 112–118. [Google Scholar] [CrossRef]
  12. Ghosh, S.; Singhania, P.; Singh, S.; Rudra, K.; Ghosh, S. Stance detection in web and social media: A comparative study. In Proceedings of the 10th International Conference of the CLEF Association, Lugano, Switzerland, 9–12 September 2019; pp. 75–87. [Google Scholar] [CrossRef]
  13. Hardalov, M.; Arora, A.; Nakov, P.; Augenstein, I. Few-shot cross-lingual stance detection with sentiment-based pre-training. In Proceedings of the AAAI Conference on Artificial Intelligence, Virtual, 22 February–1 March 2022; Volume 36, pp. 10729–10737. [Google Scholar]
  14. Chakraborty, R.; Bhavsar, M.; Dandapat, S.; Chandra, J. Detecting stance in tweets: A signed network based approach. arXiv 2022, arXiv:2201.07472. [Google Scholar] [CrossRef]
  15. Kipf, T.N.; Welling, M. Semi-supervised classification with graph convolutional networks. arXiv 2016, arXiv:1609.02907. [Google Scholar]
  16. Rossi, E.; Kenlay, H.; Gorinova, M.I.; Chamberlain, B.P.; Dong, X.; Bronstein, M.M. On the unreasonable effectiveness of feature propagation in learning on graphs with missing node features. In Proceedings of the Learning on Graphs Conference, Virtual, 9–12 December 2022; pp. 11:1–11:16. [Google Scholar]
  17. Garimella, K.; Morales, G.D.F.; Gionis, A.; Mathioudakis, M. Quantifying controversy on social media. ACM Trans. Soc. Comput. 2018, 1, 1–27. [Google Scholar] [CrossRef]
  18. Liao, J.; Tao, Q.; Yan, J. Density-aware hyper-graph neural networks for graph-based semi-supervised node classification. arXiv 2022, arXiv:2201.11511. [Google Scholar] [CrossRef]
  19. Wang, B.; Jia, J.; Gong, N. Semi-supervised node classification on graphs: Markov random fields vs. graph neural networks. Proc. Aaai Conf. Artif. Intell. 2021, 35, 10093–10101. [Google Scholar] [CrossRef]
  20. Wang, B.; Li, A.; Li, H.; Chen, Y. Graphfl: A federated learning framework for semi-supervised node classification on graphs. In Proceedings of the 22nd IEEE International Conference on Data Mining, Orlando, FL, USA, 28 November–1 December 2022. [Google Scholar] [CrossRef]
  21. Yao, H.; Zhang, C.; Wei, Y.; Jiang, M.; Wang, S.; Huang, J.; Chawla, N.; Li, Z. Graph few-shot learning via knowledge transfer. Proc. Aaai Conf. Artif. Intell. 2020, 34, 6656–6663. [Google Scholar] [CrossRef]
  22. Jasser, J.; Garibay, I.; Scheinert, S.; Mantzaris, A. Controversial information spreads faster and further than non-controversial information in reddit. J. Comput. Soc. Sci. 2021, 5, 111–122. [Google Scholar] [CrossRef]
  23. Zhang, J.; Xuan, Q.; Qiu, X.; Min, Y. A novel method detecting controversial interaction in the multiplex social comment network. Front. Phys. 2023, 10, 1107338. [Google Scholar] [CrossRef]
  24. Morales, A.; Borondo, J.; Losada, J.; Benito, R. Measuring political polarization: Twitter shows the two sides of venezuela. Chaos Interdiscip. J. Nonlinear Sci. 2015, 25, 033114. [Google Scholar] [CrossRef]
  25. Sepehri-Rad, H.; Barbosa, D. Identifying controversial wikipedia articles using editor collaboration networks. Acm Trans. Intell. Syst. Technol. 2015, 6, 1–24. [Google Scholar] [CrossRef]
  26. Poddar, S.; Mondal, M.; Misra, J.; Ganguly, N.; Ghosh, S. Winds of change: Impact of COVID-19 on vaccine-related opinions of twitter users. Proc. Int. Aaai Conf. Web Soc. Media 2022, 16, 782–793. [Google Scholar] [CrossRef]
  27. Blane, J.; Bellutta, D.; Carley, K. Social-cyber maneuvers during the COVID-19 vaccine initial rollout: Content analysis of tweets. J. Med. Internet Res. 2022, 24, e34040. [Google Scholar] [CrossRef] [PubMed]
  28. Fortunato, S. Community detection in graphs. Phys. Rep. 2010, 486, 75–174. [Google Scholar] [CrossRef]
  29. D’Andrea, E.; Ducange, P.; Bechini, A.; Renda, A.; Marcelloni, F. Monitoring the public opinion about the vaccination topic from tweets analysis. Expert Syst. Appl. 2019, 116, 209–226. [Google Scholar] [CrossRef]
  30. Tomaszewski, T.; Morales, A.; Lourentzou, I.; Caskey, R.; Liu, B.; Schwartz, A.; Chin, J. Identifying false human papillomavirus (hpv) vaccine information and corresponding risk perceptions from twitter: Advanced predictive models. J. Med. Internet Res. 2021, 23, e30451. [Google Scholar] [CrossRef]
  31. Lindelöf, G.; Aledavood, T.; Keller, B. Dynamics of the negative discourse toward COVID-19 vaccines: Topic modeling study and an annotated data set of twitter posts. J. Med. Internet Res. 2023, 25, e41319. [Google Scholar] [CrossRef] [PubMed]
  32. Lindelöf, G.; Aledavood, T.; Keller, B. Vaccine discourse on twitter during the COVID-19 pandemic. arXiv 2022, arXiv:2207.11521. [Google Scholar] [CrossRef]
  33. Alexander, C.; Wang, L.; Shah, V. Vaccine hesitancy, vaccine acceptance, and recommendations about the COVID-19 vaccines. Res. Rev. 2021, 4, 1599–1609. [Google Scholar] [CrossRef]
  34. Zaidi, Z.; Ye, M.; Samon, F.; Jama, A.; Gopalakrishnan, B.; Gu, C.; Karunasekera, S.; Evans, J.; Kashima, Y. Topics in antivax and provax discourse: Yearlong synoptic study of COVID-19 vaccine tweets. J. Med. Internet Res. 2022, 25, e45069. [Google Scholar] [CrossRef]
  35. Al-Ayyadhi, N.; Ramadan, M.; Al-Tayar, E.; Al-Mathkouri, R.; Al-Awadhi, S. Determinants of Hesitancy Towards COVID-19 Vaccines in State of Kuwait: An Exploratory Internet-Based Survey. Risk Manag. Healthc. Policy 2021, 14, 4967–4981. [Google Scholar] [CrossRef] [PubMed]
  36. Alsanafi, M.; Sallam, M. Psychological Determinants of COVID-19 Vaccine Acceptance Among Healthcare Workers in Kuwait: A Cross-Sectional Study Using the 5C and Vaccine Conspiracy Beliefs Scales. Vaccines 2021, 9, 701. [Google Scholar] [CrossRef]
  37. Alibrahim, J.; Awad, A. COVID-19 Vaccine Hesitancy Among the Public in Kuwait: A Cross-Sectional Survey. Int. J. Environ. Res. Public Health 2021, 18, 8836. [Google Scholar] [CrossRef] [PubMed]
  38. Burhamah, W.; Alkhayyat, A.; Oroszlányová, M.; AlKenane, A.; Jafar, H.; Behbehani, M.; Almansouri, A. The SARS-CoV-2 Vaccine Hesitancy Among the General Population: A Large Cross-Sectional Study From Kuwait. Cureus 2021, 13, e16261. [Google Scholar] [CrossRef] [PubMed]
  39. AlAwadhi, E.; Zein, D.; Mallallah, F.; Bin Haider, N.; Hossain, A. Monitoring COVID-19 vaccine acceptance in Kuwait during the pandemic: Results from a national serial study. Risk Manag. Healthc. Policy 2021, 14, 1413–1429. [Google Scholar] [CrossRef]
  40. Gruzd, A.; Mai, P. Communalytic: A Research Tool For Studying Online Communities and Online Discourse. Available online: https://Communalytic.org (accessed on 24 March 2024).
  41. Alostad, H.; Dawiek, S.; Davulcu, H. Q8VaxStance: Dataset Labeling System for Stance Detection towards Vaccines in Kuwaiti Dialect. Big Data Cogn. Comput. 2023, 7, 151. [Google Scholar] [CrossRef]
  42. Yang, Y.; Eisenstein, J. Overcoming language variation in sentiment analysis with social attention. Trans. Assoc. Comput. Linguist. 2017, 5, 295–307. [Google Scholar] [CrossRef]
  43. Boyd, D.; Golder, S.; Lotan, G. Tweet, tweet, retweet: Conversational aspects of retweeting on twitter. In Proceedings of the 2010 43rd Hawaii International Conference on System Sciences, Honolulu, HI, USA, 5–8 January 2010; pp. 1–10. [Google Scholar]
  44. Wong, F.M.F.; Tan, C.W.; Sen, S.; Chiang, M. Quantifying political leaning from tweets, retweets, and retweeters. IEEE Trans. Knowl. Data Eng. 2016, 28, 2158–2172. [Google Scholar] [CrossRef]
  45. Salloum, A.; Chen, T.H.Y.; Kivelä, M. Separating Polarization from Noise: Comparison and Normalization of Structural Polarization Measures. Proc. ACM Hum.-Comput. Interact. 2022, 6, 1–33. [Google Scholar] [CrossRef]
  46. Mathieu, E.; Ritchie, H.; Rodés-Guirao, L.; Appel, C.; Giattino, C.; Hasell, J.; Macdonald, B.; Dattani, S.; Beltekian, D.; Ortiz-Ospina, E.; et al. Coronavirus Pandemic (COVID-19). 2020. Available online: https://github.com/owid/covid-19-data/tree/master/public/data (accessed on 24 March 2024).
Figure 1. Social network data processing pipeline and system architecture. The yellow boxes represent dataset and data representations, the red boxes represents methods or algorithms.
Bdcc 08 00060 g001
Figure 2. Random walk controversy. The red represents the anti−vaccine group and the blue depicts the pro−vaccine group.
Bdcc 08 00060 g002
Figure 3. Network graph with pro- and anti-vaccine users.
Bdcc 08 00060 g003
Figure 4. COVID-19—vaccinated population in Kuwait (per 100 vaccinated people).
Bdcc 08 00060 g004
Figure 5. Social network polarization based on COVID-19 vaccination rates in Kuwait.
Bdcc 08 00060 g005
Figure 6. Polarization graph for sub-periods after the vaccine hesitancy starting point.
Bdcc 08 00060 g006
Figure 7. A tweet by @CGCKuwait announcing that the government opened all activities for vaccinated individuals.
Bdcc 08 00060 g007
Figure 8. A tweet by @CGCKuwait announcing about the new terms and conditions for travelers entering Kuwait.
Bdcc 08 00060 g008
Figure 9. A tweet by @CGCKuwait announcing the registration start for third dose, ages 18 and above.
Bdcc 08 00060 g009
Figure 10. A tweet by @CGCKuwait announcing the start of return- to-normalcy plan: phase 5.
Bdcc 08 00060 g010
Table 1. Feature matrix X: user x features.
(User × Features) feat 1 feat 2 feat n 1 feat n
u s e r 1 1110
u s e r 2 0100
u s e r 3 1110
−1−1−1−1
u s e r m 1101
Table 2. Accuracy of different epochs. The best model is marked with *.
EpochsAcc MeanAcc StdF1 MeanF1 StdAUC MeanAUC Std
500.95610.00830.9560.00840.95540.0086
1000.96240.00550.96240.00560.96220.0057
200 *0.96530.00420.96520.00420.96510.0042
3000.96530.00480.96520.00480.96510.0047
Table 3. Results from different feature matrices. The best model is marked with *.
AlgorithmFeaturesAcc MeanAcc StdF1 MeanF1 StdAUC MeanAUC Std
LP0.94480.00870.94550.00750.94570.0082
Tweet text0.95740.00660.95730.00660.95720.0067
Hashtags0.95870.00600.95870.00600.95820.0064
FPBigrams *0.96530.00420.96520.00420.96510.0042
Trigrams0.96110.00510.96100.00510.96080.0054
Domains0.95130.00610.95120.00610.95100.0060
Table 4. Sample bi- and trigrams from periods 5 and 6 related to controversial topics.
Bigram ArabicEnglish TranslationTrigram ArabicEnglish Translation
كويت مسافر Kuwait Mosahir App منع السفر لغير Travel ban for others
الطيران المدني Civil aviation السفر لغير المطعيین Traveling for non-vaccinated people
منع السفر Travel ban لربط السفر بالتطعيم To link travel to vaccination
دخول المجمعات Entering the malls ليس حقکم تحويل You do not have the right to transfer
منعهم الدخول Prevent them from entering تحويل البلد سجن Turning the country into a prison
Table 5. Sample bi- and trigrams from periods 8 and 9 related to controversial topics.
Bigram ArabicEnglish TranslationTrigram ArabicEnglish Translation
مسار الحرية Path of Freedom نرفض اللقاح الإجباري We reject compulsory vaccination
نرفض المسحه We reject PCR الجرعتين تطعيم الکورونا Two doses of Corona vaccination
للتطعيم الاجباری For compulsory vaccination انا اخذت الجرعتين I took both doses
ضد التطعيم Against vaccination الغير مطعمين انا I am the unvaccinated
ضد الاجبار Against coercion أمرا للتطعيم الاجباري An order for compulsory vaccination
Table 6. Sample bi- and trigrams from periods 3 and 4 related to controversial topics.
Bigram ArabicEnglish TranslationTrigram ArabicEnglish Translation
اعتصام طلاب Student protest أطفالنا خط أحمر Our children are a red line
وزارة الترية Ministry of Education اعتصام طلاب في Students protest in
الاختبارات الورقيه Paper tests تقييد حریة الناس Restricting people’s freedom
قرار منعهم The decision to ban them ارتياد الأماکن العامة Going to public places
منعهم الدخول Prevent them from entering قرار منعهم الدخول The decision to prevent them from entering
Disclaimer/Publisher’s Note: The statements, opinions and data contained in all publications are solely those of the individual author(s) and contributor(s) and not of MDPI and/or the editor(s). MDPI and/or the editor(s) disclaim responsibility for any injury to people or property resulting from any ideas, methods, instructions or products referred to in the content.