
Contextual Intelligence: An AI Approach to Manufacturing Skills’ Forecasting


Abstract
:1. Introduction
2. Literature Review
2.1. Manufacturing and Technology with Dependency on Skills
2.2. Occupational Forecasting—International Perspective
2.3. Occupational Forecasting—Local Perspective
2.4. Forecasting Techniques
3. Theoretical Framework
4. Materials and Methods
4.1. Data
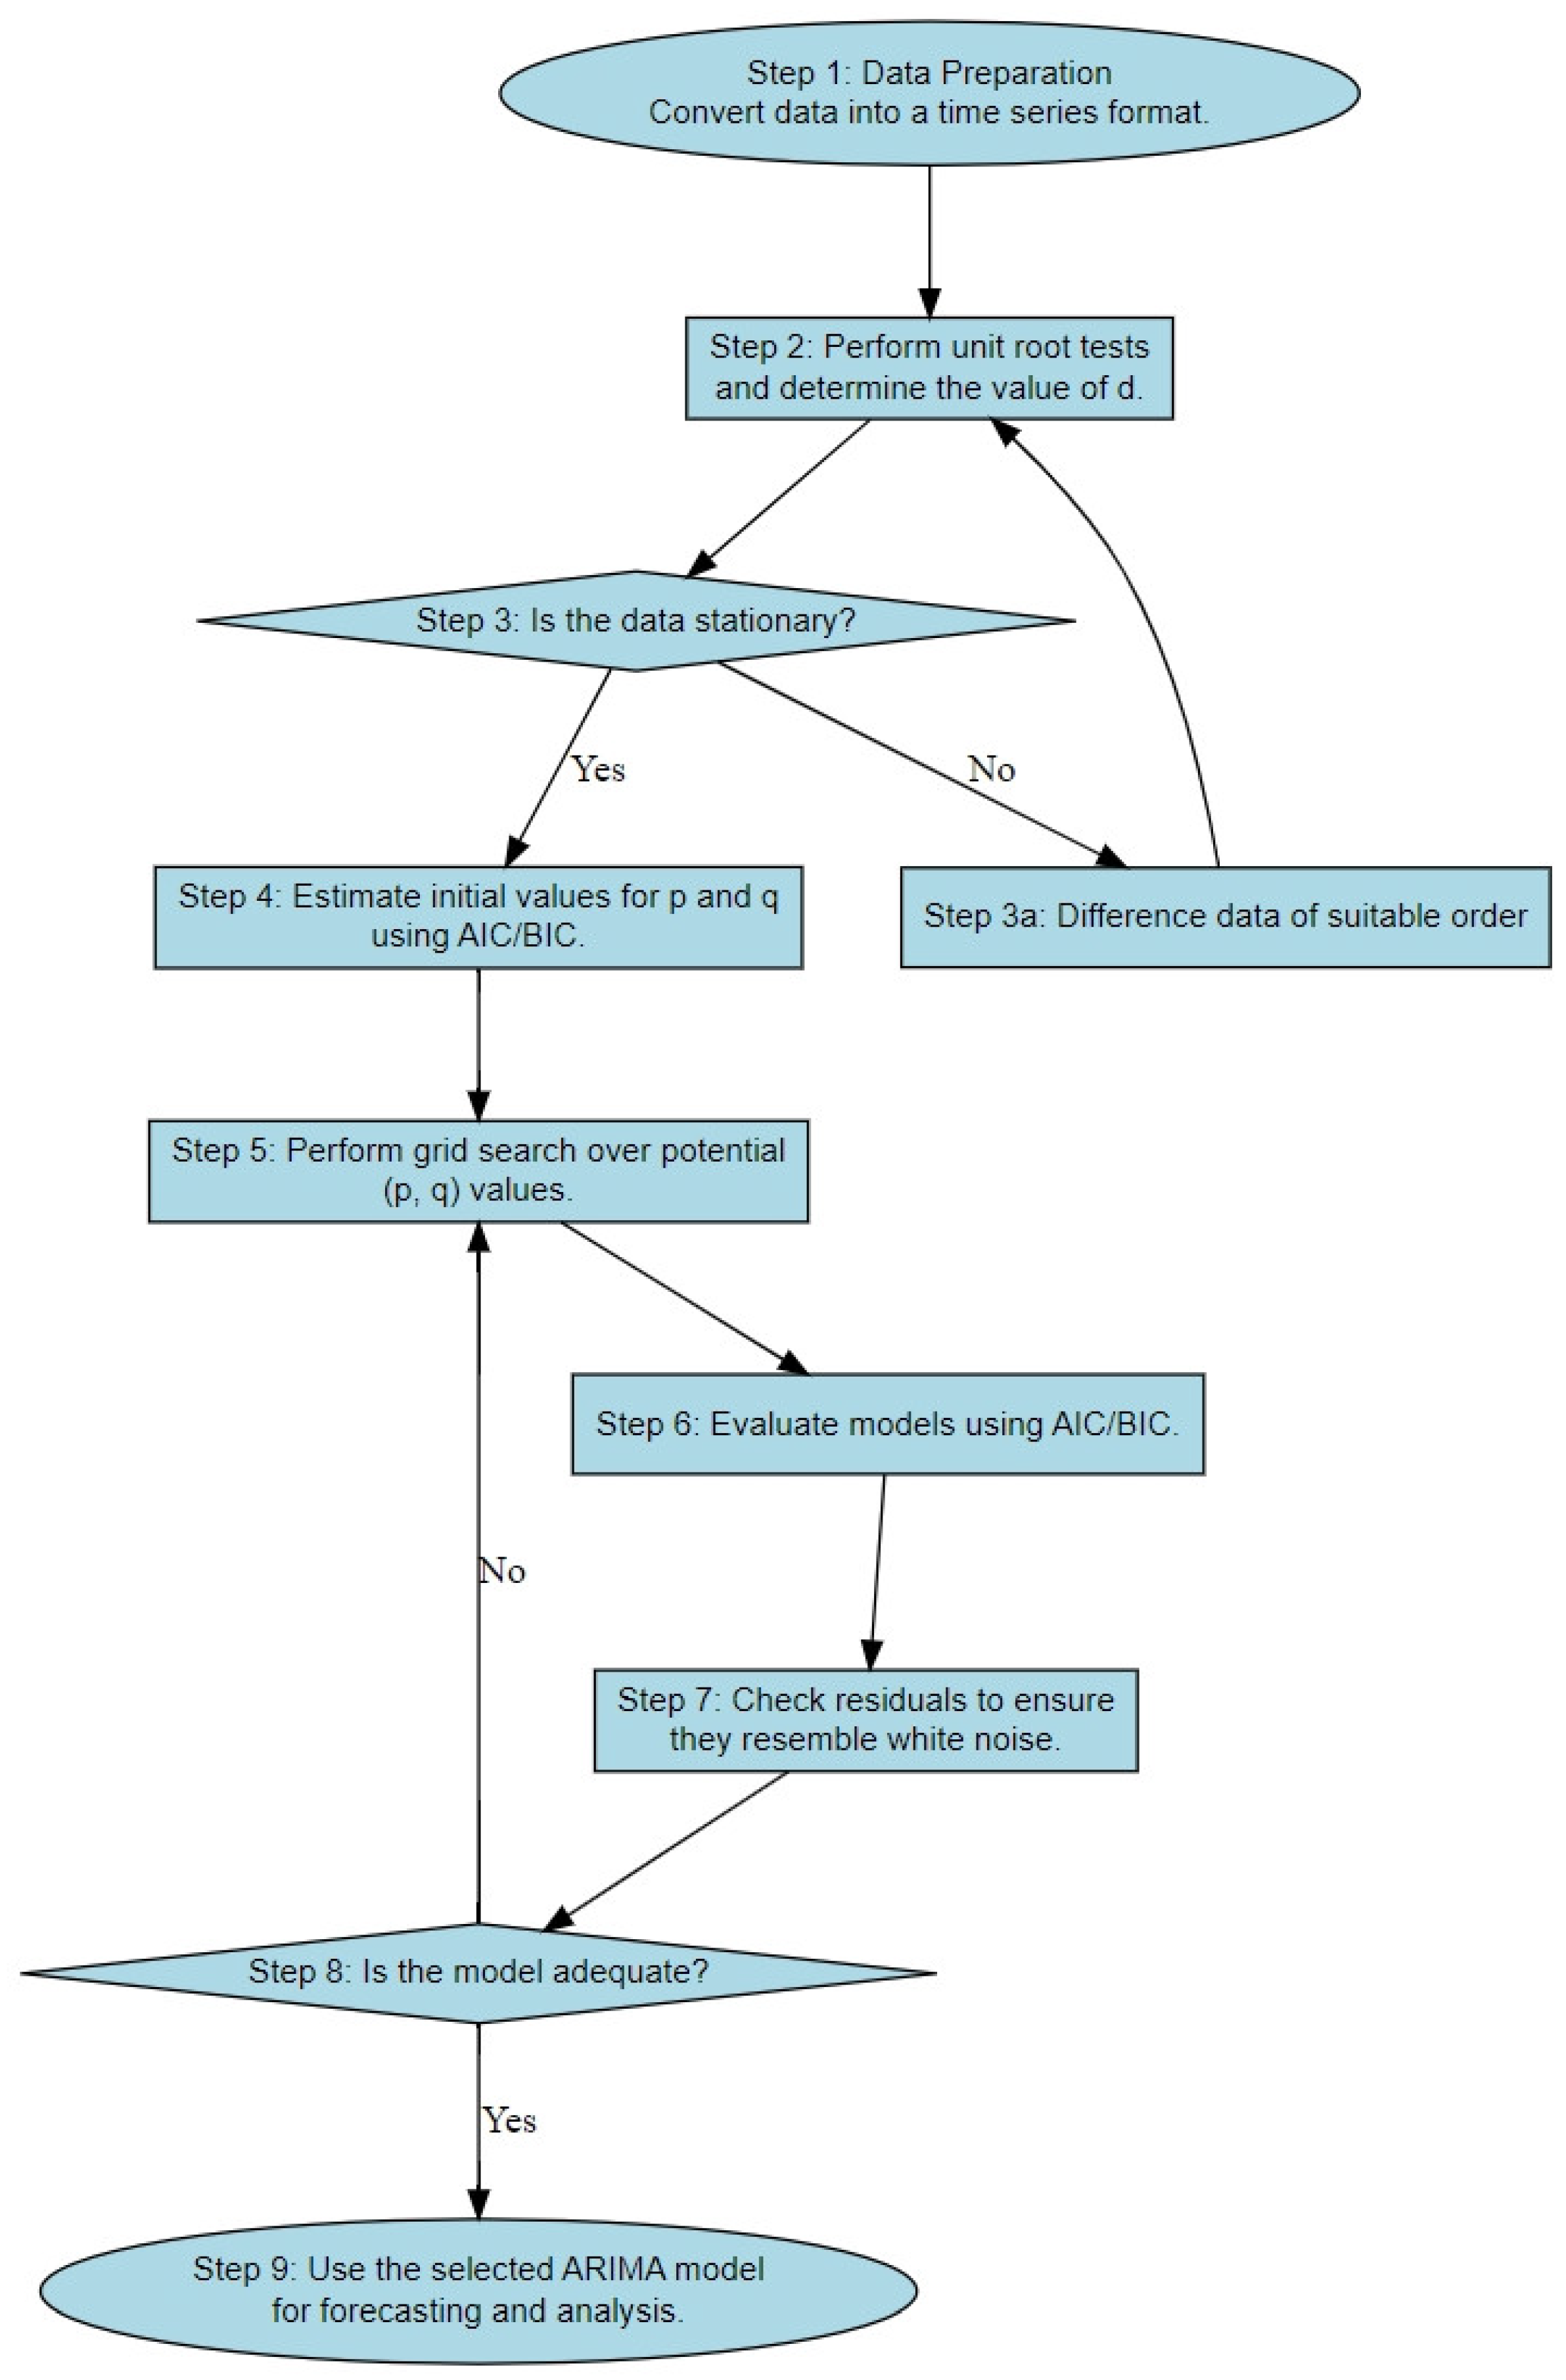
4.2. Analytics
- = the time series,
- = coefficients,
- = white noise.
4.2.1. Model Validation
4.2.2. Accuracy
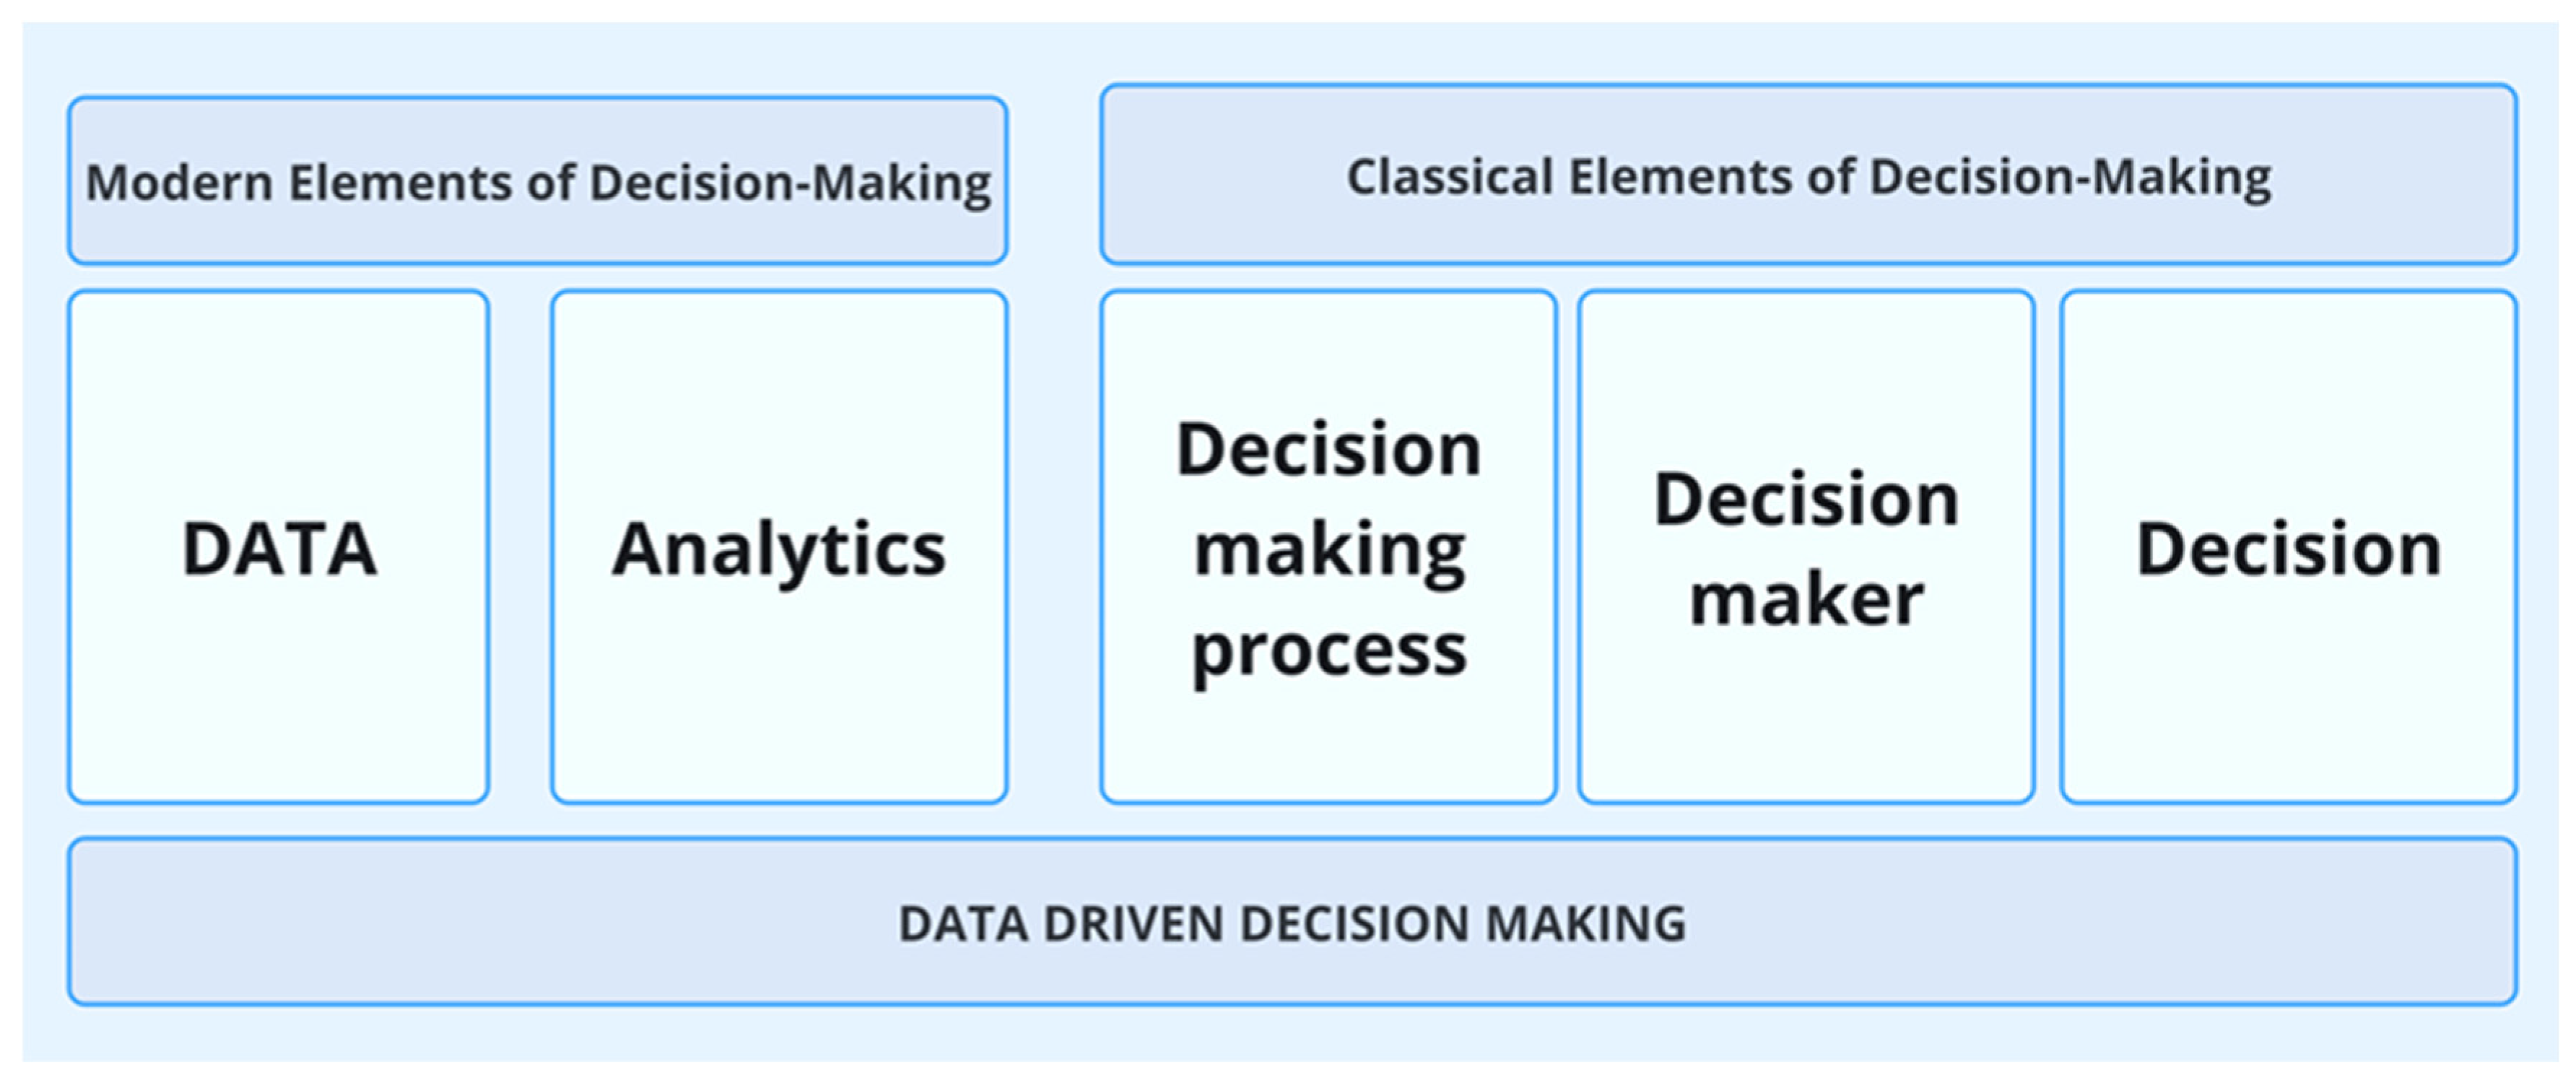
4.3. Decision-Making Process, Decision-Maker, and Decision
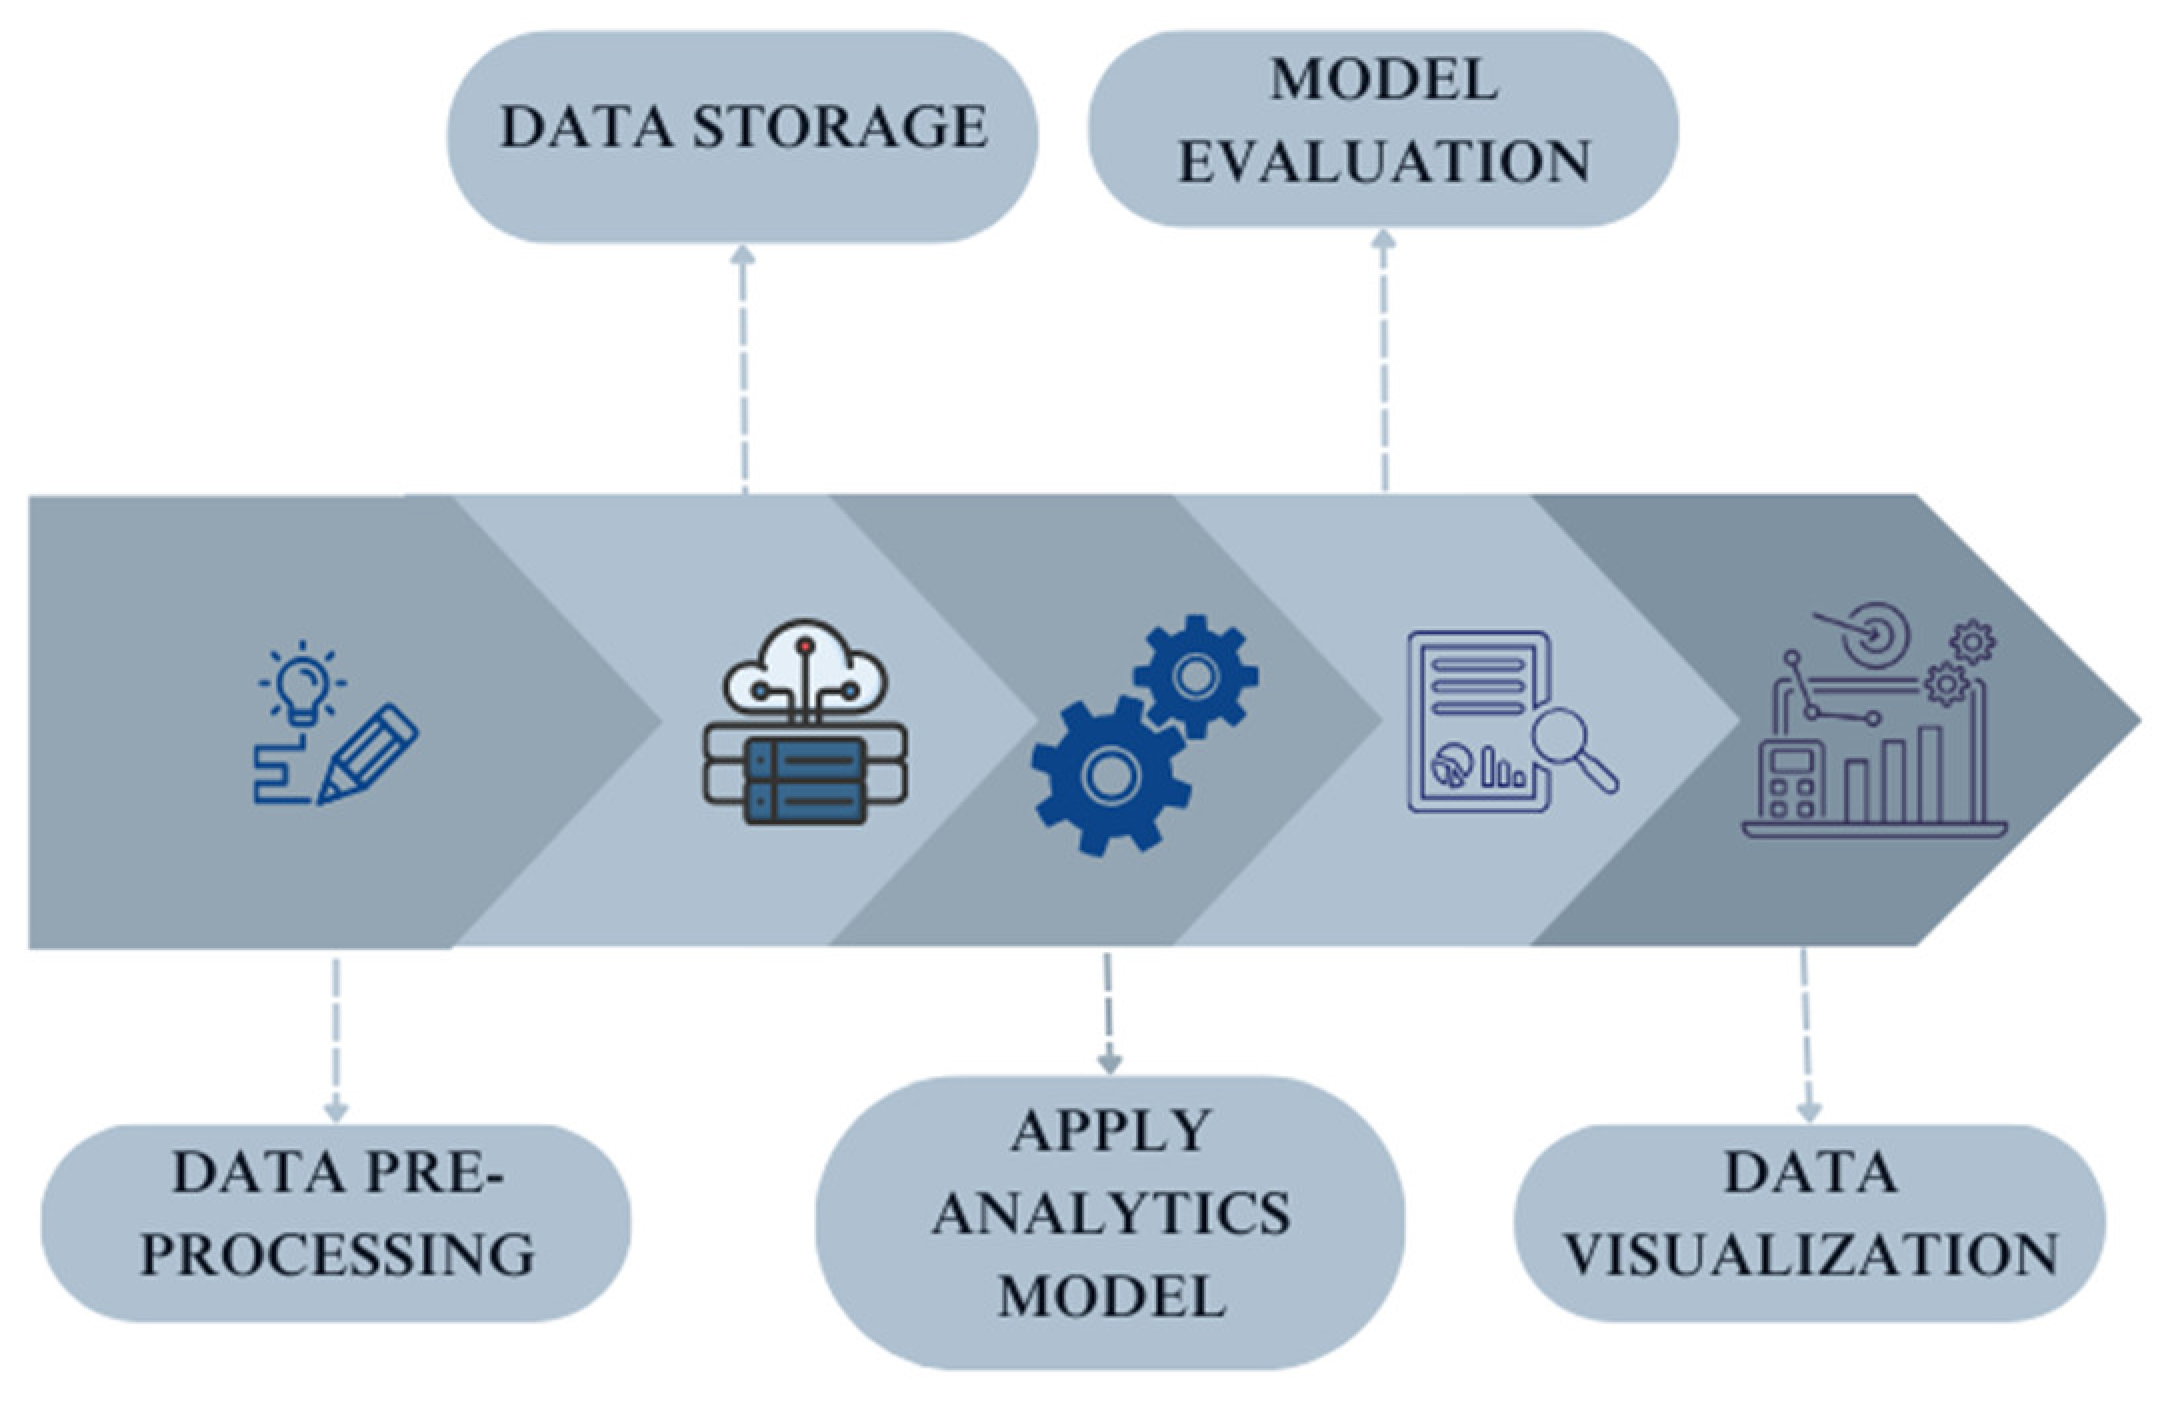
4.4. Methodology Summative
5. Results
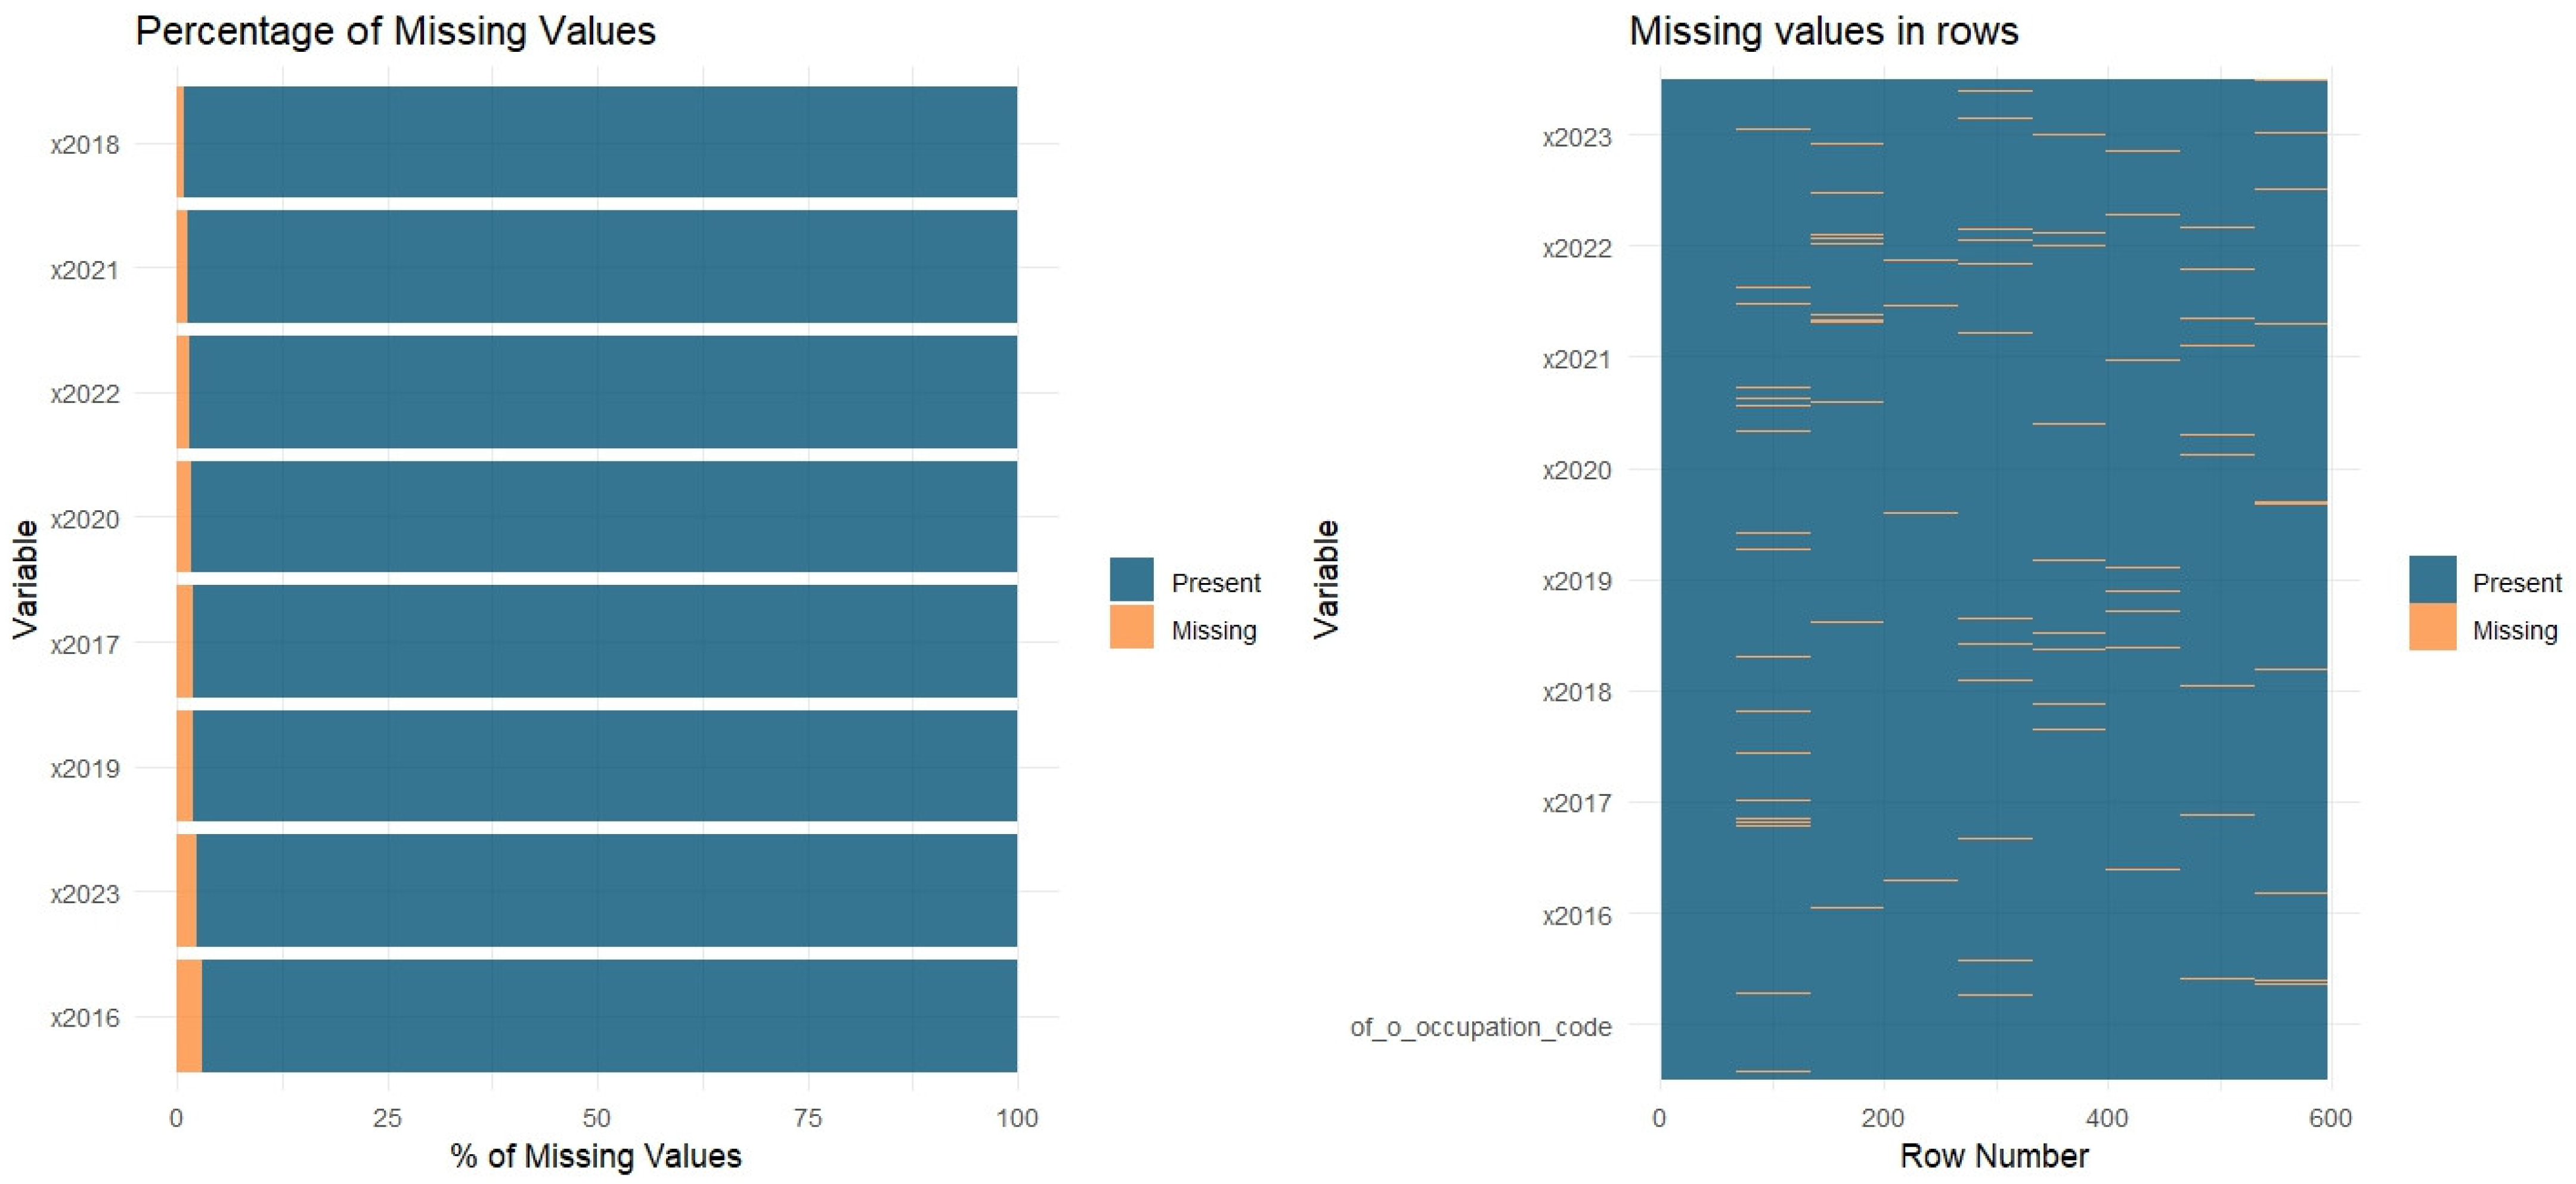
5.1. Pre-Processing
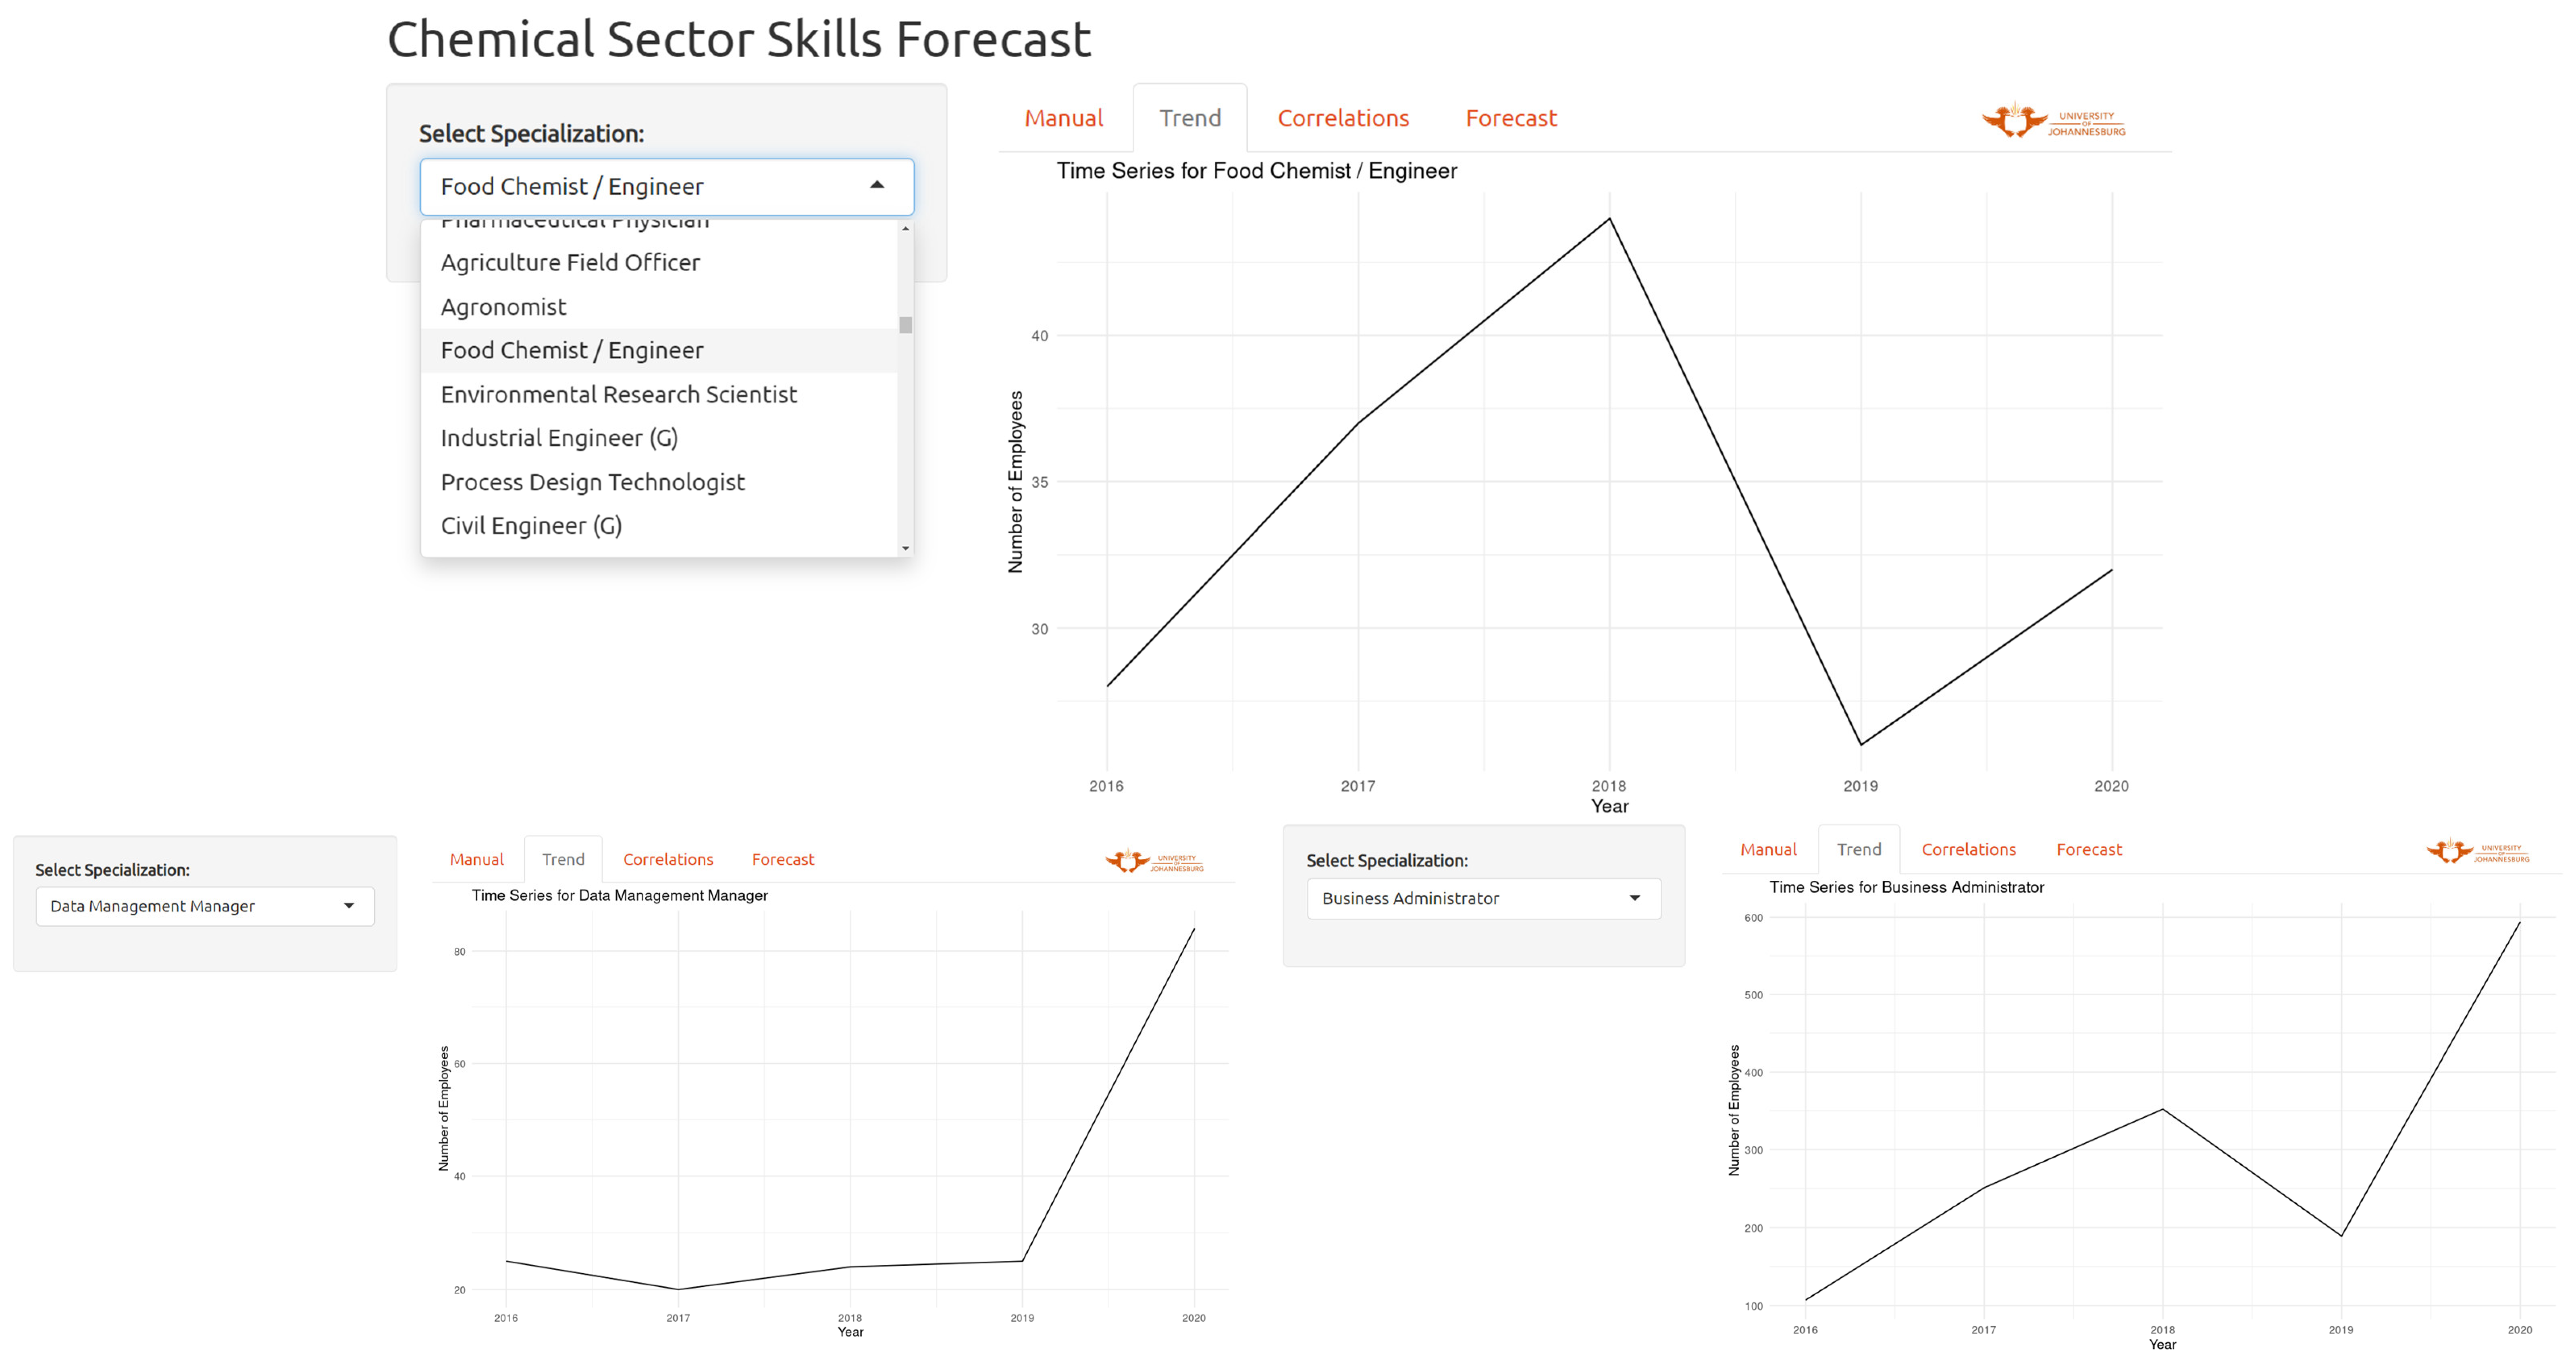
5.2. Trends
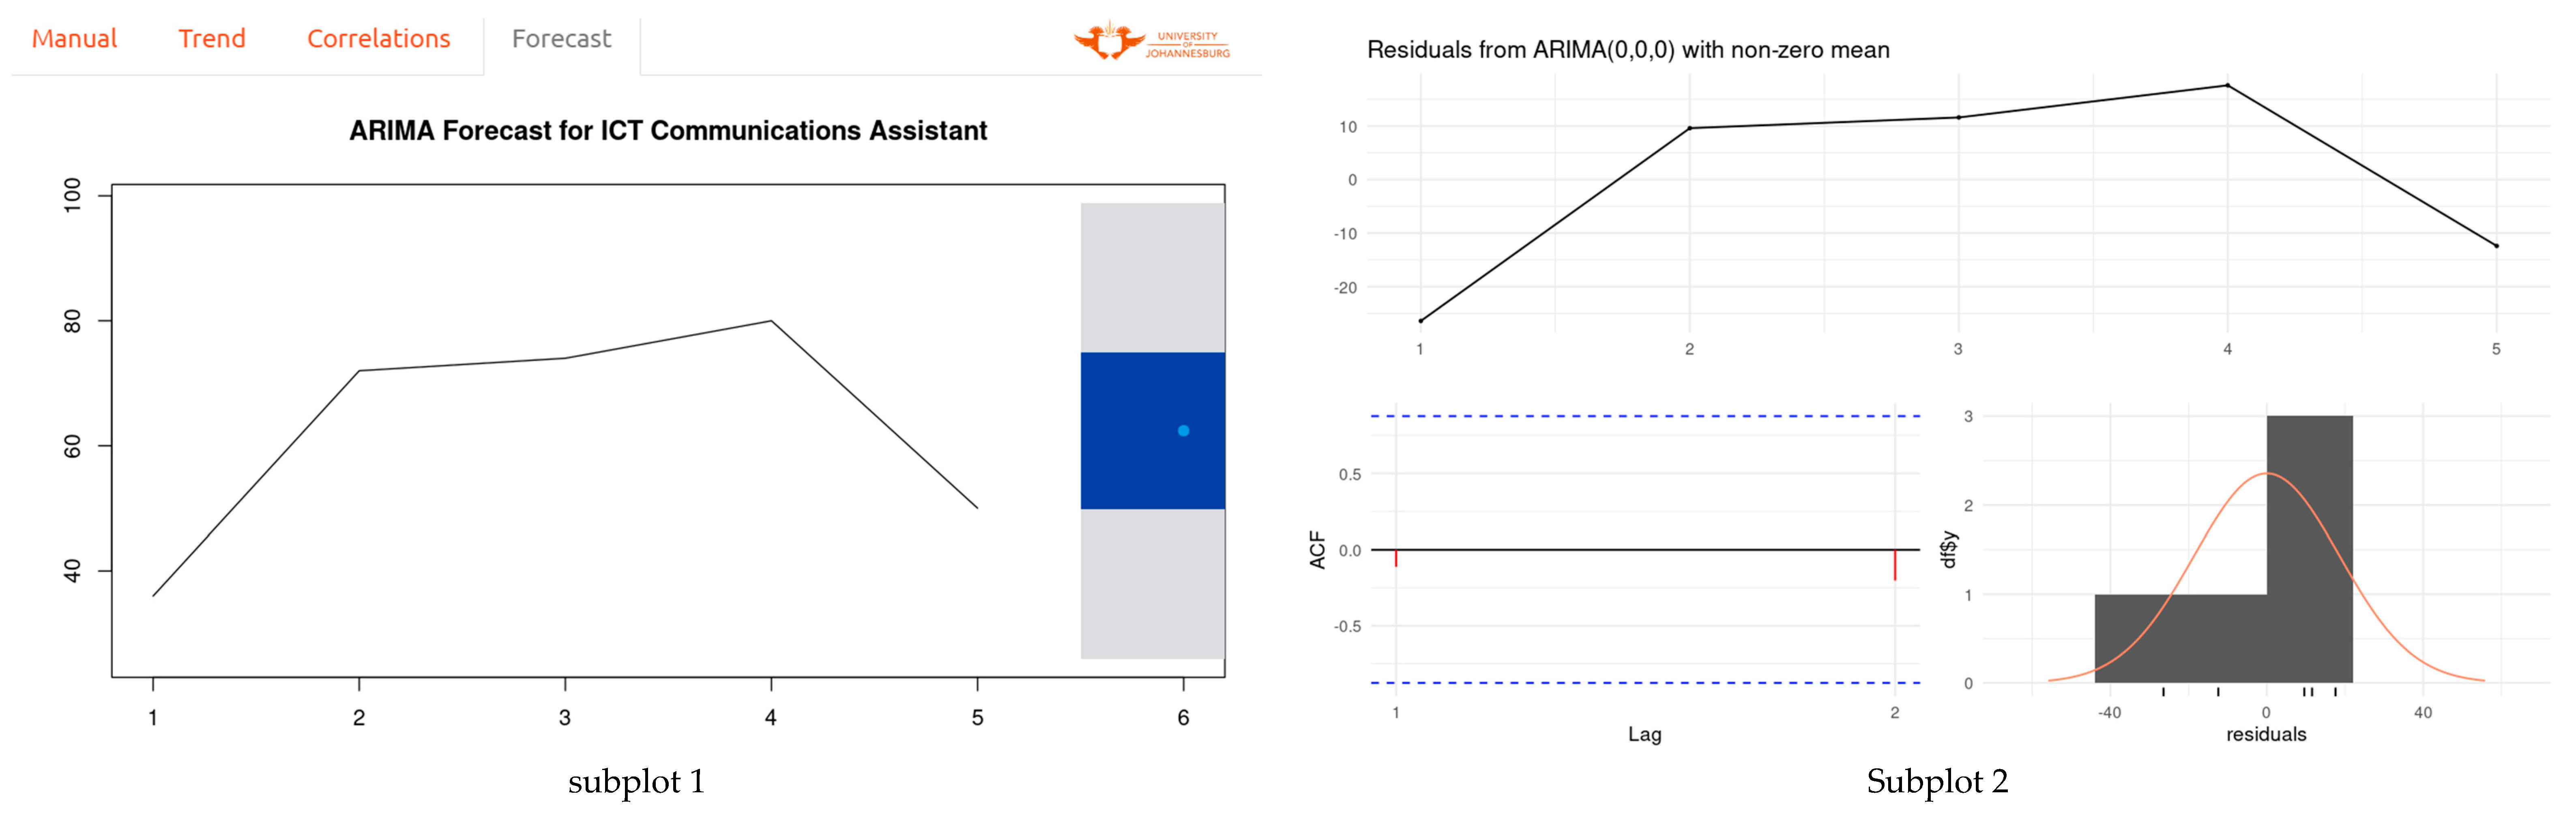
5.3. Forecasts
- The FoodBev dataset consisted of 713 occupations, of which 473 (66%) were predicted with 80% and above accuracy.
- The chemical sector consisted of 522 occupations, of which 474 (91%) were predicted with 80% and above accuracy.
6. Conclusions
7. Practical Implications
8. Future Work
Author Contributions
Funding
Institutional Review Board Statement
Informed Consent Statement
Data Availability Statement
Conflicts of Interest
References
- Wong, J.; Chan, A.; Chiang, Y.H. A critical review of forecasting models to predict manpower demand. Constr. Econ. Build. 2004, 4, 43–56. [Google Scholar] [CrossRef]
- Senthurvelautham, S.; Senanayake, N. A machine learning-based job forecasting and trend analysis system to predict future job markets using historical data. In Proceedings of the 2023 IEEE 8th International Conference for Convergence in Technology (I2CT), Lonavla, India, 7–9 April 2023; IEEE: New York, NY, USA, 2023; pp. 1–7. [Google Scholar]
- Wilson, R.A.; Woolard, I.; Lee, D. Developing a National Skills Forecasting Tool for South Africa; Institute for Employment Research, University of Warwick: Coventry, UK; DoL/HSRC: Pretoria, Africa, 2004. [Google Scholar]
- Arvan, M.; Fahimnia, B.; Reisi, M.; Siemsen, E. Integrating human judgement into quantitative forecasting methods: A review. Omega 2019, 86, 237–252. [Google Scholar] [CrossRef]
- Flostrand, A.; Pitt, L.; Bridson, S. The delphi technique in forecasting—A 42-year bibliographic analysis (1975–2017). Technol. Forecast. Soc. Chang. 2020, 150, 119773. [Google Scholar] [CrossRef]
- Ho, P.H.K. Labour and skill shortages in hong kong’s construction industry. Eng. Constr. Archit. Manag. 2016, 23, 533–550. [Google Scholar] [CrossRef]
- Calonge, D.S.; Shah, M.A. Moocs, graduate skills gaps, and employability: A qualitative systematic review of the literature. Int. Rev. Res. Open Distrib. Learn. 2016, 17, 67–90. [Google Scholar] [CrossRef]
- Corin, L. Job demands and job resources in human service managerial work an external assessment through work content analysis. Old Site Nord. J. Work. Life Stud. 2016, 6, 3–28. [Google Scholar] [CrossRef]
- Whiteford, A.; Hall, E.J. Sa Labour Market Trends and Future Work-Force Needs; HSRC Bookshop: Pretoria, South Africa, 1999; pp. 1998–2003. [Google Scholar]
- Woolard, I.; Kneebone, P.; Lee, D. Forecasting the demand for scarce skills, 2001–2006. Hum. Resour. Dev. Rev. 2003, 458–474. Available online: http://hdl.handle.net/20.500.11910/8092 (accessed on 30 June 2024).
- Thomas, J. Review of Best Practices in Labour Market Forecasting with an Application to the Canadian Aboriginal Population; Technical Report; Centre for the Study of Living Standards: Ottawa, ON, USA, 2015. [Google Scholar]
- Leit, P.; Geraldes, C.A.S.; Fernandes, F.P.; Badikyan, H. Analysis of the workforce skills for the factories of the future. In Proceedings of the 2020 IEEE Conference on Industrial Cyberphysical Systems (ICPS), Tampere, Finland, 10–12 June 2020; IEEE: New York, NY, USA, 2020; Volume 1, pp. 353–358. [Google Scholar]
- Pinzone, M.; Fantini, P.; Perini, S.; Garavaglia, S.; Taisch, M.; Miragliotta, G. Jobs and skills in industry 4.0: An exploratory research. In Advances in Production Management Systems. The Path to Intelligent, Collaborative and Sustainable Manufacturing, Proceedings of the IFIP WG 5.7 International Conference, APMS 2017, Hamburg, Germany, 3–7 September 2017; Proceedings, Part I; Springer: Berlin/Heidelberg, Germany, 2017; pp. 282–288. [Google Scholar]
- Jaschke, S. Mobile learning applications for technical vocational and engineering education: The use of competence snippets in laboratory courses and industry 4.0. In Proceedings of the 2014 International Conference on Interactive Collaborative Learning (ICL), Dubai, United Arab Emirates, 3–6 December 2014; IEEE: New York, NY, USA, 2014; pp. 605–608. [Google Scholar]
- Prifti, L.; Knigge, M.; Kienegger, H.; Krcmar, H. A competency model for “industrie 4.0” employees. In Proceedings of the Wirtschafts informatik (WI) 2017, St. Gallen, Switzerland, 12–15 February 2017. [Google Scholar]
- Sackey, S.M.; Bester, A. Industrial engineering curriculum in industry 4.0 in a south african context. S. Afr. J. Ind. Eng. 2016, 27, 101–114. [Google Scholar] [CrossRef]
- Chui, M.; Manyika, J.; Miremadi, M. Where Machines Could Replace Humans-and Where They Can’t (Yet); McKinsey & Company: Chicago, IL, USA, 2016. [Google Scholar]
- Maisiri, W.; Darwish, H.; Van Dyk, L. An investigation of industry 4.0 skills requirements. S. Afr. J. Ind. Eng. 2019, 30, 90–105. [Google Scholar] [CrossRef]
- Frey, C.B.; Osborne, M.A. The future of employment: How susceptible are jobs to computerisation? Technol. Forecast. Soc. Chang. 2017, 114, 254–280. [Google Scholar] [CrossRef]
- Charles, K.K.; Hurst, E.; Notowidigdo, M.J. Manufacturing decline, housing booms, and non-employment. Chic. Booth Res. Pap. 2013, 13–57. [Google Scholar] [CrossRef]
- Acemoglu, D.; Autor, D. Skills, tasks and technologies: Implications for employment and earnings. In Handbook of Labor Economics; Elsevier: Amsterdam, The Netherlands, 2011; Volume 4, pp. 1043–1171. [Google Scholar]
- Sandberg, J.; Holmstr, J.; Lyytinen, K. Digitization and phase transitions in platform organizing logics: Evidence from the process automation industry. Manag. Inf. Syst. Q. 2020, 44, 129–153. [Google Scholar] [CrossRef]
- MacCrory, F.; Westerman, G.; Alhammadi, Y.; Brynjolfsson, E. Racing with and Against the Machine: Changes in Occupational Skill Composition in an era of Rapid Technological Advance; Association for Information Systems: Atlanta, GA, USA, 2014. [Google Scholar]
- Rumberger, R.W.; Levin, H.M. Forecasting the impact of new technologies on the future job market. Technol. Forecast. Soc. Chang. 1985, 27, 399–417. [Google Scholar] [CrossRef]
- Hughes, G. An overview of occupational forecasting in oecd countries. Int. Contrib. Labour Stud. 1994, 4, 129–144. [Google Scholar]
- Bolli, T.; Zurlinden, M. Measurement of labour quality growth caused by unobservable characteristics. Appl. Econ. 2012, 44, 2297–2308. [Google Scholar] [CrossRef]
- Garner, C.; Harper, J.; Howells, T.F., III; Russell, M.; Samuels, J. New bea-bls estimates of the industry-level sources of us economic growth between 1987 and 2016. Int. Product. Monit. 2019, 187–203. Available online: https://coilink.org/20.500.12592/7ht6h5 (accessed on 30 June 2024).
- Khalaf, C.; Michaud, G.; Jolley, G.J. Predicting declining and growing occupations using supervised machine learning. J. Comput. Soc. Sci. 2023, 6, 757–780. [Google Scholar] [CrossRef]
- Cedefop. Future Skill Needs in Europe—Critical Labour Force Trends; Publications Office: Luxembourg, 2016. [Google Scholar]
- Cedefop. Skills Forecast—Trends and Challenges to 2030; Publications Office: Luxembourg, 2018. [Google Scholar]
- Nwokike, C.C.; Okereke, E.W. Comparison of the performance of the sann, sarima and arima models for forecasting quarterly gdp of nigeria. Asian Res. J. Math. 2021, 17, 1–20. [Google Scholar] [CrossRef]
- Sehrawat, P.K.; Vishwakarma, D.K. Comparative analysis of time series models on COVID-19 predictions. In Proceedings of the 2022 International Conference on Sustainable Computing and Data Communication Systems (ICSCDS), Erode, India, 7–9 April 2022; IEEE: New York, NY, USA, 2022; pp. 710–715. [Google Scholar]
- Noureen, S.; Atique, S.; Roy, V.; Bayne, S. A comparative forecasting analysis of arima model vs random forest algorithm for a case study of small-scale industrial load. Int. Res. J. Eng. Technol. 2019, 6, 1812–1821. [Google Scholar]
- Rady, E.H.; Fawzy, H.; Fattah, A.M.A. Time series forecasting using tree based methods. J. Stat. Appl. Probab. 2021, 10, 229–244. [Google Scholar]
- Zhang, D.; Chen, S.; Liwen, L.; Xia, Q. Forecasting agricultural commodity prices using model selection framework with time series features and forecast horizons. IEEE Access 2020, 8, 28197–28209. [Google Scholar] [CrossRef]
- Rublikova, E.; Lubyova, M. Estimating arima-arch model rate of unemployment in slovakia. Forecast. Pap. Progn. Pr. 2013, 5, 275–289. [Google Scholar]
- Weber, E.; Zika, G. Labour market forecasting in germany: Is disaggregation useful? Appl. Econ. 2016, 48, 2183–2198. [Google Scholar] [CrossRef]
- Adenomon, M.O. Modelling and forecasting unemployment rates in nigeria using arima model. FUW Trends Sci. Technol. J. 2017, 2, 525–531. [Google Scholar]
- Shobana, G.; Umamaheswari, K. Forecasting by machine learning techniques and econometrics: A review. In Proceedings of the 2021 6th International Conference on Inventive Computation Technologies (ICICT), Coimbatore, India, 20–22 January 2021; IEEE: New York, NY, USA, 2021; pp. 1010–1016. [Google Scholar]
- Elkamel, M.; Schleider, L.; Pasiliao, E.L.; Diabat, A.; Zheng, Q.P. Long-term electricity demand prediction via socioeconomic factors—A machine learning approach with florida as a case study. Energies 2020, 13, 3996. [Google Scholar] [CrossRef]
- Kim, T.-Y.; Cho, S.-B. Predicting residential energy consumption using cnn-lstm neural networks. Energy 2019, 182, 72–81. [Google Scholar] [CrossRef]
- Muralitharan, K.; Sakthivel, R.; Vishnuvarthan, R. Neural network based optimization approach for energy demand prediction in smart grid. Neurocomputing 2018, 273, 199–208. [Google Scholar] [CrossRef]
- Dacrema, M.F.; Cremonesi, P.; Jannach, D. Are we really making much progress? A worrying analysis of recent neural recommendation approaches. In Proceedings of the 13th ACM Conference on Recommender Systems, Copenhagen, Denmark, 16–20 February 2019; pp. 101–109. [Google Scholar]
- Mnyawami, Y.N.; Maziku, H.H.; Mushi, J.C. Comparative study of automl approach, conventional ensemble learning method, and knearest oracle-automl model for predicting student dropouts in sub-saharab african countries. Appl. Artif. Intell. 2022, 36, 2145632. [Google Scholar] [CrossRef]
- Noureen, S.; Atique, S.; Roy, V.; Bayne, S. Analysis and application of seasonal arima model in energy demand forecasting: A case study of small scale agricultural load. In Proceedings of the 2019 IEEE 62nd International Midwest Symposium on Circuits and Systems (MWSCAS), Dallas, TX, USA, 4–7 August 2019; IEEE: New York, NY, USA, 2019; pp. 521–524. [Google Scholar]
- Power, D.J.; Heavin, C.; Keenan, P. Decision systems redux. J. Decis. Syst. 2019, 28, 1–18. [Google Scholar] [CrossRef]
- Elgendy, N.; Elragal, A.; Päivärinta, T. Decas: A modern data-driven decision theory for big data and analytics. J. Decis. Syst. 2022, 31, 337–373. [Google Scholar] [CrossRef]
- Mandinach, E.B. A perfect time for data use: Using data-driven decision making to inform practice. Educ. Psychol. 2012, 47, 71–85. [Google Scholar] [CrossRef]
- Kumar, A.; Shankar, R.; Aljohani, N.R. A big data driven framework for demand-driven forecasting with effects of marketing-mix variables. Ind. Mark. Manag. 2020, 90, 493–507. [Google Scholar] [CrossRef]
- Venkatramanan, S.; Lewis, B.; Chen, J.; Higdon, D.; Vullikanti, A.; Marathe, M. Using data-driven agent-based models for forecasting emerging infectious diseases. Epidemics 2018, 22, 43–49. [Google Scholar] [CrossRef]
- Bourdeau, M.; Zhai, X.Q.; Nefzaoui, E.; Guo, X.; Chatellier, P. Modeling and forecasting building energy consumption: A review of data-driven techniques. Sustain. Cities Soc. 2019, 48, 101533. [Google Scholar] [CrossRef]
- Janssen, M.; Van Der Voort, H.; Wahyudi, A. Factors influencing big data decision-making quality. J. Bus. Res. 2017, 70, 338–345. [Google Scholar] [CrossRef]
- Elgendy, N.; Elragal, A. Big data analytics: A literature review paper. In Advances in Data Mining. Applications and Theoretical Aspects, Proceedings of the 14th Industrial Conference, ICDM 2014, St. Petersburg, Russia, 16–20 July 2014; Proceedings 14; Springer: Berlin/Heidelberg, Germany, 2014; pp. 214–227. [Google Scholar]
- Theodosiou, M. Forecasting monthly and quarterly time series using stl decomposition. Int. J. Forecast. 2011, 27, 1178–1195. [Google Scholar] [CrossRef]
- Amar, S.; Sudiarso, A.; Herliansyah, M.K. The accuracy measurement of stock price numerical prediction. J. Phys. Conf. Ser. 2020, 1569, 032027. [Google Scholar] [CrossRef]
- Frechtling, D. Forecasting Tourism Demand; Routledge: London, UK, 2012. [Google Scholar]
- Chan, K.-S.; Ripley, B.; Chan, M.K.-S.; Chan, S. Package ‘tsa’. R Package; Version 1; The Comprehensive R Archive Network (CRAN): Vienna, Austria, 2022. [Google Scholar]
- Svensson, R.B.; Feldt, R.; Torkar, R. The unfulfilled potential of data-driven decision making in agile software development. In Agile Processes in Software Engineering and Extreme Programming, Proceedings of the 20th International Conference, XP 2019, Montreal, QC, Canada, 21–25 May 2019; Proceedings 20; Springer: Berlin/Heidelberg, Germany, 2019; pp. 69–85. [Google Scholar]
- Van Buuren, S.; Groothuis-Oudshoorn, K. mice: Multivariate imputation by chained equations in r. J. Stat. Softw. 2011, 45, 1–67. [Google Scholar] [CrossRef]
- Pinheiro, J.C.; Mbates, D. Linear Mixed-Effects Models: Basic Concepts and Examples. In Mixed-Effects Models in S and S-Plus; Springer: Berlin/Heidelberg, Germany, 2000; pp. 3–56. [Google Scholar]
- Kvetan, V.; Wilson, R.; Zukersteinova, A. Cedefop’s skills supply and demand forecast: 2011 update and reflections on the approach. In Building on Skills Forecasts—Comparing Methods and Applications; Publications Office of the European Union: Luxembourg, 2021; p. 11. [Google Scholar]
- Woetzel, J.; Madgavkar, A.; Gupta, S. India’s Labour Market: A New Emphasis on Gainful Employment; McKinsey Report; McKinsey & Company: Chicago, IL, USA, 2017. [Google Scholar]
- Sievert, C. Interactive Web-Based Data Visualization with R, Plotly, and Shiny; CRC Press: Boca Raton, FL, USA, 2020. [Google Scholar]
- Hyndman, R.J.; Athanasopoulos, G. Forecasting: Principles and Practice; OTexts: Melbourne, Australia, 2018. [Google Scholar]
- Cleveland, W.S. Visualizing Data; Hobart Press: Troy, OH, USA, 1993. [Google Scholar]
- Shumway, R.H.; Stoffer, D.S. Time Series Analysis and Its Applications: With R Examples; Springer: Berlin/Heidelberg, Germany, 2006. [Google Scholar]


| Country | Model/Study | Capabilities/Description |
|---|---|---|
| USA | Bureau of Labor Statistics (BLS) | Long-term occupational projections and comprehensive economic sector analysis. |
| European Union | CEDEFOP | Skills forecast with quantitative estimates and cross-country analysis of occupational trends. |
| Canada | Canadian Occupational Projection System (COPS) | Ten-year labor market forecasts every two years. Projects labor supply and demand in order to balance potential occupational shortages or surpluses. |
| South Africa | Human Sciences Research Council (HSRC)—1999 | Analyzed formal employment trends in eight sectors over five years and developed a demand forecasting model for 1998–2003. |
| South Africa | EU, Department of Labor (South Africa), and Department of Trade and Industry—2001 | Investigated critical skill shortages and skills’ development using qualitative, quantitative, and meta-analytical techniques. |
| South Africa | Updated HSRC study from 1999 to 2003 | Provided updated labor market projections using labor demand and replacement models. |
| Value | |||
|---|---|---|---|
| Predictors | Estimates | CI | p |
| (Intercept) | −2090.81 | 7142.37–2960.74 | 0.417 |
| Random Effects | |||
| σ2 | 39,653.36 | ||
| τ 00 occupation code | 409,995.13 | ||
| N occupation code | 595 | ||
| Observations | 4673 | ||
| Marginal R2/Conditional R2 | 0.000/0.912 | ||
| Occupation | 2016 | 2017 | 2018 | 2019 | 2020 | 2021 | 2022 |
|---|---|---|---|---|---|---|---|
| Data Management Manager | 197 | 183 | 240 | 256 | 466 | 537 | 607 |
| Information Technology Manager | 109 | 119 | 87 | 107 | 127 | 170 | 156 |
| Business Administrator | 107 | 251 | 352 | 189 | 154 | 594 | 482 |
| Software Architect | 26 | 31 | 34 | 38 | 57 | 86 | 125 |
| Engineering Planner | 661 | 742 | 514 | 635 | 895 | 1079 | 1013 |
| Data Capturer | 190 | 192 | 129 | 196 | 188 | 212 | 206 |
| Computer Analyst | 169 | 187 | 172 | 159 | 221 | 492 | 499 |
| Communications Analyst (Computers) | 65 | 82 | 107 | 100 | 186 | 107 | 116 |
| Occupation | 2016 | 2017 | 2018 | 2019 | 2020 | 2021 | 2022 |
|---|---|---|---|---|---|---|---|
| Procurement Administrator | 800 | 740 | 772 | 820 | 595 | 575 | 594 |
| Administration Clerk/Officer | 3051 | 4707 | 3273 | 3073 | 2949 | 3126 | 2723 |
| Call Center Customer Service Representative | 203 | 295 | 195 | 240 | 54 | 52 | 29 |
| Pay Clerk | 208 | 190 | 186 | 177 | 168 | 183 | 174 |
| Aisle Controller | 1361 | 1629 | 1299 | 1307 | 1152 | 1090 | 1008 |
| Delivery Clerk | 2131 | 2833 | 2844 | 2453 | 1901 | 1982 | 1758 |
| Manufacturing Store person | 1868 | 1655 | 1848 | 1629 | 1398 | 1536 | 1749 |
| Front-End-Loader Driver | 488 | 108 | 101 | 474 | 230 | 197 | 136 |
| Front Desk Coordinator | 567 | 521 | 569 | 512 | 511 | 450 | 429 |
| Regulatory Affairs Administrator | 505 | 564 | 461 | 491 | 390 | 402 | 519 |
| Occupation Title | 2016 | 1017 | 2018 | 2019 | 2020 | 2021 | 2022 | 2023 | Predicted 2023 | MAPE | 2024 Forecast |
|---|---|---|---|---|---|---|---|---|---|---|---|
| General Manager Public Service | 17 | 6 | 6 | 40 | 19 | 23 | 63 | 46 | 40 | 13.32904 | 48 |
| Trade Union Representative | 29 | 37 | 48 | 37 | 19 | 38 | 31 | 28 | 26 | 8.013044 | 29 |
| Human Resource Manager | 358 | 310 | 341 | 344 | 421 | 453 | 434 | 452 | 388 | 14.1828 | 466 |
| Business Training Manager | 267 | 301 | 464 | 238 | 137 | 128 | 133 | 93 | 79 | 14.90708 | 96 |
| Chief Information Officer | 92 | 132 | 133 | 132 | 91 | 58 | 62 | 43 | 38 | 11.90166 | 46 |
| ICT Project Manager | 50 | 61 | 53 | 71 | 61 | 53 | 46 | 49 | 42 | 14.2755 | 50 |
| Data Management Manager | 25 | 20 | 24 | 25 | 70 | 84 | 83 | 76 | 64 | 15.46296 | 79 |
| Financial Markets Business Manager | 15 | 6 | 8 | 4 | 13 | 19 | 13 | 17 | 15 | 13.43848 | 18 |
| Laboratory Manager | 202 | 173 | 232 | 274 | 288 | 295 | 302 | 278 | 249 | 10.42141 | 284 |
| Operations Manager (Non-Manufacturing) | 106 | 154 | 179 | 81 | 178 | 238 | 210 | 183 | 157 | 14.32432 | 187 |
| Importer or Exporter | 67 | 46 | 58 | 54 | 47 | 53 | 65 | 39 | 35 | 10.43915 | 40 |
| Retail Manager (General) | 116 | 121 | 100 | 143 | 146 | 85 | 78 | 179 | 155 | 13.24364 | 184 |
| Manufacture Research Chemist | 50 | 79 | 87 | 72 | 112 | 100 | 70 | 119 | 103 | 13.55225 | 125 |
| Retail Pharmacist | 215 | 211 | 267 | 232 | 39 | 40 | 83 | 285 | 264 | 7.345125 | 298 |
| Market Research Analyst | 331 | 312 | 242 | 247 | 192 | 256 | 231 | 117 | 103 | 12.37104 | 123 |
| Communication Coordinator | 175 | 214 | 157 | 214 | 111 | 77 | 123 | 76 | 66 | 12.84006 | 78 |
| Sales Representative—Medical and Pharmaceutical | 2739 | 2668 | 2727 | 2595 | 2008 | 2620 | 2220 | 1838 | 1586 | 13.73677 | 1879 |
| ICT Systems Analyst | 164 | 179 | 172 | 159 | 221 | 492 | 499 | 493 | 411 | 16.57107 | 503 |
| Database Designer and Administrator | 110 | 67 | 78 | 70 | 107 | 118 | 548 | 126 | 110 | 12.42141 | 129 |
| Librarian | 14 | 20 | 33 | 36 | 15 | 15 | 17 | 15 | 13 | 13.0528 | 16 |
| Information Services Manager | 176 | 252 | 148 | 142 | 60 | 46 | 40 | 51 | 44 | 14.00231 | 54 |
| Technical Director | 24 | 208 | 28 | 32 | 19 | 17 | 24 | 22 | 19 | 11.84977 | 23 |
| Chemistry Technician | 2627 | 2737 | 2973 | 3552 | 2004 | 1996 | 2186 | 2306 | 1993 | 13.59102 | 2383 |
| Radiation Control Technician | 20 | 55 | 50 | 55 | 49 | 59 | 15 | 48 | 41 | 13.62571 | 51 |
| Electrical Engineering Technician | 293 | 405 | 536 | 551 | 264 | 286 | 398 | 486 | 420 | 13.59831 | 502 |
| Mechanical Engineering Technician | 665 | 522 | 434 | 451 | 483 | 587 | 730 | 768 | 665 | 13.42468 | 791 |
| Pressure Equipment Inspector | 110 | 58 | 73 | 74 | 96 | 82 | 115 | 92 | 78 | 15.21263 | 97 |
| Chemical Engineering Technician | 272 | 217 | 155 | 211 | 366 | 469 | 563 | 721 | 607 | 15.76788 | 760 |
| Draughtsperson | 141 | 169 | 248 | 192 | 172 | 174 | 162 | 153 | 132 | 13.60677 | 159 |
| Water Plant Operator | 28 | 46 | 72 | 29 | 39 | 36 | 37 | 77 | 67 | 12.89806 | 80 |
| Chemical Plant Controller | 5800 | 5818 | 5280 | 3458 | 5010 | 5290 | 5214 | 5347 | 4737 | 11.41503 | 5655 |
| Gas or Petroleum Controller | 1318 | 1164 | 1046 | 1637 | 607 | 627 | 907 | 523 | 450 | 14.05107 | 541 |
| Manufacturing Production Technicians | 66 | 95 | 275 | 247 | 669 | 768 | 468 | 442 | 399 | 9.622997 | 463 |
| Health Technical Support Officer | 4 | 13 | 3 | 2 | 31 | 43 | 52 | 19 | 16 | 13.17975 | 20 |
| Sales Representative—Building and Plumbing Supply | 82 | 3 | 36 | 61 | 49 | 100 | 50 | 60 | 50 | 16.22182 | 62 |
| Sales Representative—Personal and Household Goods | 191 | 384 | 197 | 380 | 314 | 680 | 489 | 157 | 138 | 12.38791 | 163 |
| Commercial Services Sales Agent | 14 | 8 | 19 | 15 | 25 | 11 | 31 | 51 | 44 | 12.84063 | 52 |
| Manufacturer’s Representative | 28 | 10 | 10 | 14 | 57 | 5 | 15 | 40 | 34 | 14.67164 | 41 |
| Chemical Sales Representative | 1101 | 1091 | 937 | 874 | 751 | 667 | 822 | 955 | 816 | 14.54156 | 988 |
| Property Manager | 21 | 22 | 56 | 64 | 17 | 12 | 14 | 15 | 13 | 14.4805 | 16 |
| Sales Representative—Business Services | 137 | 493 | 361 | 440 | 476 | 134 | 374 | 228 | 208 | 8.785947 | 234 |
| Waste Material Sorter and Classifier | 1 | 3 | 12 | 8 | 6 | 2 | 2 | 99 | 84 | 14.70158 | 104 |
| Handyperson | 467 | 630 | 331 | 3333 | 1159 | 2299 | 719 | 571 | 485 | 14.97975 | 603 |
| Chemical Mixer | 291 | 195 | 310 | 211 | 1114 | 596 | 169 | 155 | 129 | 16.48581 | 158 |
| Local Authority Manager | 11 | 6 | 7 | 4 | 25 | 46 | 6 | 37 | 32 | 12.56638 | 38 |
| Internal Audit Manager | 23 | 18 | 15 | 19 | 38 | 22 | 26 | 31 | 27 | 11.98061 | 32 |
| Recruitment Manager | 10 | 13 | 15 | 19 | 11 | 9 | 9 | 12 | 10 | 13.03594 | 12 |
| Quality Systems Manager | 470 | 354 | 329 | 330 | 382 | 324 | 255 | 234 | 197 | 15.81662 | 242 |
| Construction Site Manager | 73 | 56 | 54 | 39 | 52 | 45 | 43 | 61 | 55 | 9.414381 | 62 |
| Information Technology Manager | 70 | 75 | 58 | 76 | 127 | 170 | 156 | 120 | 108 | 9.865707 | 123 |
| Facilities Manager | 104 | 109 | 104 | 89 | 89 | 94 | 85 | 206 | 183 | 11.03695 | 215 |
| Electrical Specifications Writer | 15 | 11 | 15 | 19 | 16 | 9 | 13 | 6 | 5 | 14.37255 | 6 |
| Architect | 1 | 6 | 11 | 4 | 9 | 2 | 8 | 7 | 6 | 13.74234 | 7 |
Disclaimer/Publisher’s Note: The statements, opinions and data contained in all publications are solely those of the individual author(s) and contributor(s) and not of MDPI and/or the editor(s). MDPI and/or the editor(s) disclaim responsibility for any injury to people or property resulting from any ideas, methods, instructions or products referred to in the content. |
© 2024 by the authors. Licensee MDPI, Basel, Switzerland. This article is an open access article distributed under the terms and conditions of the Creative Commons Attribution (CC BY) license (https://creativecommons.org/licenses/by/4.0/).
Share and Cite
Maphisa, X.; Nkadimeng, M.; Telukdarie, A. Contextual Intelligence: An AI Approach to Manufacturing Skills’ Forecasting. Big Data Cogn. Comput. 2024, 8, 101. https://doi.org/10.3390/bdcc8090101
Maphisa X, Nkadimeng M, Telukdarie A. Contextual Intelligence: An AI Approach to Manufacturing Skills’ Forecasting. Big Data and Cognitive Computing. 2024; 8(9):101. https://doi.org/10.3390/bdcc8090101
Chicago/Turabian StyleMaphisa, Xolani, Mpho Nkadimeng, and Arnesh Telukdarie. 2024. "Contextual Intelligence: An AI Approach to Manufacturing Skills’ Forecasting" Big Data and Cognitive Computing 8, no. 9: 101. https://doi.org/10.3390/bdcc8090101