Article

Combining Semantic Matching, Word Embeddings, Transformers, and LLMs for Enhanced Document Ranking: Application in Systematic Reviews

1
Faculty of Computer Science and Engineering, Ss. Cyril and Methodius University, Rugjer Boshkovik 16, 1000 Skopje, North Macedonia
2
Magix.AI, Cyril and Methodius 3A, 1000 Skopje, North Macedonia
*
Authors to whom correspondence should be addressed.
Big Data Cogn. Comput. 2024, 8(9), 110; https://doi.org/10.3390/bdcc8090110
Submission received: 29 May 2024 / Revised: 19 August 2024 / Accepted: 23 August 2024 / Published: 4 September 2024
(This article belongs to the Special Issue Advances in Natural Language Processing and Text Mining)

Abstract

:
The rapid increase in scientific publications has made it challenging to keep up with the latest advancements. Conducting systematic reviews using traditional methods is both time-consuming and difficult. To address this, new review formats like rapid and scoping reviews have been introduced, reflecting an urgent need for efficient information retrieval. This challenge extends beyond academia to many organizations where numerous documents must be reviewed in relation to specific user queries. This paper focuses on improving document ranking to enhance the retrieval of relevant articles, thereby reducing the time and effort required by researchers. By applying a range of natural language processing (NLP) techniques, including rule-based matching, statistical text analysis, word embeddings, and transformer- and LLM-based approaches like Mistral LLM, we assess the article’s similarities to user-specific inputs and prioritize them according to relevance. We propose a novel methodology, Weighted Semantic Matching (WSM) + MiniLM, combining the strengths of the different methodologies. For validation, we employ global metrics such as precision at K, recall at K, average rank, median rank, and pairwise comparison metrics, including higher rank count, average rank difference, and median rank difference. Our proposed algorithm achieves optimal performance, with an average recall at 1000 of 95% and an average median rank of 185 for selected articles across the five datasets evaluated. These findings give promising results in pinpointing the relevant articles and reducing the manual work.

1. Introduction

The academic research environment is evolving quickly, and the volume of publications has rapidly grown [1]. Given the continuous advancements, keeping pace with the state of the art is essential and stimulating, yet it poses significant challenges. Moreover, navigating the vast array of publications to identify relevant and beneficial information to your research interests introduces another hurdle.
A systematic literature review (SLR) serves as a method for identifying, assessing, and interpreting all research findings pertinent to a specific research question, topic area, or phenomenon of interest [2]. Although SLRs are important, their financial cost in the current circumstances is significant [3]. Recently, novel review methodologies have emerged in response to the urgent need for information and the inadequacy of the traditional systematic review framework to meet these demands fully. Consequently, the rapid review has been introduced for instances where time is critical, and the scoping review for when a comprehensive summary is not needed, but rather an overview of a broad field [4]. Due to the increased number of publications, performing a systematic, scoping, or rapid review has become more challenging. While modern digital libraries provide certain search functionalities, the main burden and labor-intensive tasks remain with the researcher.
The exponential growth of information and documents has created unprecedented challenges for information and document retrieval across various sectors. This challenge extends beyond academia in fields like healthcare, law, and business, where professionals must review vast amounts of data in response to specific queries. The overwhelming volume of documents makes it difficult to ensure all relevant documents are considered, potentially leading to overlooked insights. Efficient document ranking and retrieval systems are essential to navigate this sea of information, enabling users to quickly access the most pertinent documents and significantly reducing the time and effort required to find crucial information.
A viable approach to overcome the challenges involves adopting automation and harnessing the capabilities of NLP and machine learning (ML). This study extends the previous research in [5,6]. Specifically, we developed a toolkit that indexes the following digital libraries: IEEE Xplore, Springer, MDPI, PubMed, and ScienceDirect. It operates based on user input, such as keywords, the search phrases used to query the digital libraries for potentially relevant articles, and properties, which are words or phrases that specify what we are looking for in the identified articles. The properties are grouped into thematic or semantic groups for a more comprehensive presentation of the results.
Our preceding research emphasized retrieving papers relevant to the user’s input and delivering a dataset of pertinent studies aligned with their search criteria. However, we observed that users continued to allocate significant time to assess the outcomes of this retrieval process. In response to this observation, the current study advances our methodology by incorporating a ranking system into the results. We compare different text similarity algorithms to enhance the paper’s relevance. This addition aims to further reduce the time researchers invest into evaluating the articles.
The primary aim of the current work is to refine the process of retrieving relevant articles for the users of this tool. This refinement is intended to bridge the gap between the vast array of available academic content and the specific informational needs of the users.
The remainder of this article is organized as follows: Section 2 presents the related work and different approaches for automating review papers. Section 3 delineates the framework we use for dataset collection, elaborates on the implemented algorithms for estimating similarity, and discusses the metrics and criteria for evaluating the algorithms. Section 4 offers a comprehensive overview of the datasets, presents a visual summary of the outcomes, and discusses the findings from the analysis. Finally, Section 5 concludes the paper and points out directions for future research.

2. Related Works

Conducting literature reviews can be challenging and can involve substantial manual effort. According to Carver et al. database searching and paper selection processes are among the most demanding and time-consuming aspects, with experts identifying these areas as most in need of tool support [7]. Consequently, the emergence of the automation and semi-automation of literature reviews are vital. Cohen et al. [8] represent one of the pioneering efforts in this direction, utilizing a voting perceptron-based system to categorize articles as relevant or irrelevant. Their findings suggest that, for certain datasets, the approach can save time and work, thereby facilitating the research interest in this field.
Over the years, numerous researchers have explored the area of automation of SLRs using NLP and text mining techniques. O’Mara-Eves et al. [9] investigated the evidence base for automating or semi-automating reviews, starting from the initial text mining application. Their study concluded that an average of 5.6 new papers are published annually, each exploring different approaches or classifiers. Van Dinter et al. [10] identified over a thousand papers but selected 41 high-quality studies for further analysis. They concluded that a stable number of high-quality papers are being published, focusing on automating the conduct of reviews. Sundaram et al. [11] found that the field has been active for the past decade and continues to attract significant research interest. This sustained interest is driven by the need to address existing gaps and the steady progress in the NLP field. In a recent study, Zala et al. [12] demonstrate that AI-driven SLR automation is continuously evolving, marked by the exploration of new techniques and improvements to existing algorithms and methodologies.
As promising NLP and ML techniques have surfaced to tackle these challenges, comprehensive software tools have been developed that integrate these advancements and improve user experience. Recently, Circo Jimenez et al. [13] conducted an extensive analysis, providing a detailed overview of the current computational tools available to support the conduct of SLRs. Furthermore, the Systematic Review Toolbox [14] includes information about tool characteristics, usage costs, and the specific stage of the review process that each tool targets.
Abstrackr is a tool where users can upload records retrieved from an electronic search, label the articles, and, after an adequate number of samples, receive predictions about their relevance [15]. Another tool, Rayyan, is a web and mobile application that allows users to label citations as excluded or included. Rayyan then employs an SVM classifier on the awaiting citations, outputting a score that indicates how closely they align with the labels [16]. Colandr [17] offers a different approach by utilizing an ML model that actively learns from user input to dynamically provide a ranked list of articles based on relevance, allowing users to decide when to conclude the process. Additionally, tools like EPPI-Reviewer [18], RobotAnalysis [19], AS review [20], and SWIFT [21] are among the most utilized in the field.
Automation in the literature review process can occur at various stages. Wagner et al. [22] demonstrate various AI-based tools applicable to each step of the literature review process and highlight their potential benefits. They propose a three-level agenda for advancing AI-based literature reviews (AILRs). This agenda emphasizes the need for smart search technologies to enhance quality assurance, the development of more effective and user-friendly methods and tools, and the standardization of the research process. Atkinson [23] discusses how AI and machine learning technologies (MLTs) can revolutionize SLRs by automating critical stages such as data synthesis and abstraction. Using Latent Dirichlet Allocation (LDA) topic modeling, the paper demonstrates how AI can streamline the coding, categorization, and summarization of data. However, our focus is primarily on the stages of database searching and paper selection.
Active learning is a supervised approach to ML that allows an algorithm to interactively request a user to label data with the desired outputs for the continuous improvement of the model. Within this methodology, the algorithm strategically chooses which subset of unlabeled data should be labeled next. Ma was the first to propose the inclusion of active learning in this process, arguing that expert input can improve the algorithm’s effectiveness [24]. Ros et al. suggest an integrated approach for the search and selection of papers that starts with training a classifier on an initial set of validated papers and then employs snowballing to extend the search [25]. However, Cohen et al. contend that reviewers prefer to maintain control over the SLR, and thus recommend the use of a ranking model [26]. Following this suggestion, Gonzalez-Toral et al. propose a ranking-based approach that supports the initial selection of primary studies in SLRs [27]. Diverging from the active learning paradigm, our approach prioritizes the ranking of papers based solely on the initial input provided by the user.
With the recent emergence of large language models (LLMs), there is a growing interest in their potential for automating SLRs. Kraisha et al. evaluated the capabilities of GPT-4, acknowledging its promise but also noting significant limitations and existing barriers to the practical use of LLMs [28]. Alshami et al. explored the application of ChatGPT and, while recognizing the potential of leveraging LLMs, they highlighted challenges such as limited access to real-time data and the requirement for longer prompts to achieve better results, which in turn demands more preparatory time from humans [29]. In their commentary, Qureshi et al. assess the GPT model’s application in SLRs and conclude that although the technology holds promise, it is still in its early stages and requires further development for reliable application [30]. Based on the findings of these studies and considering our objective for a cost-effective and rapid approach, we were initially hesitant to include LLMs in our methodology. However, we ultimately decided to evaluate both their performance and the time necessary for execution.

3. Methodology

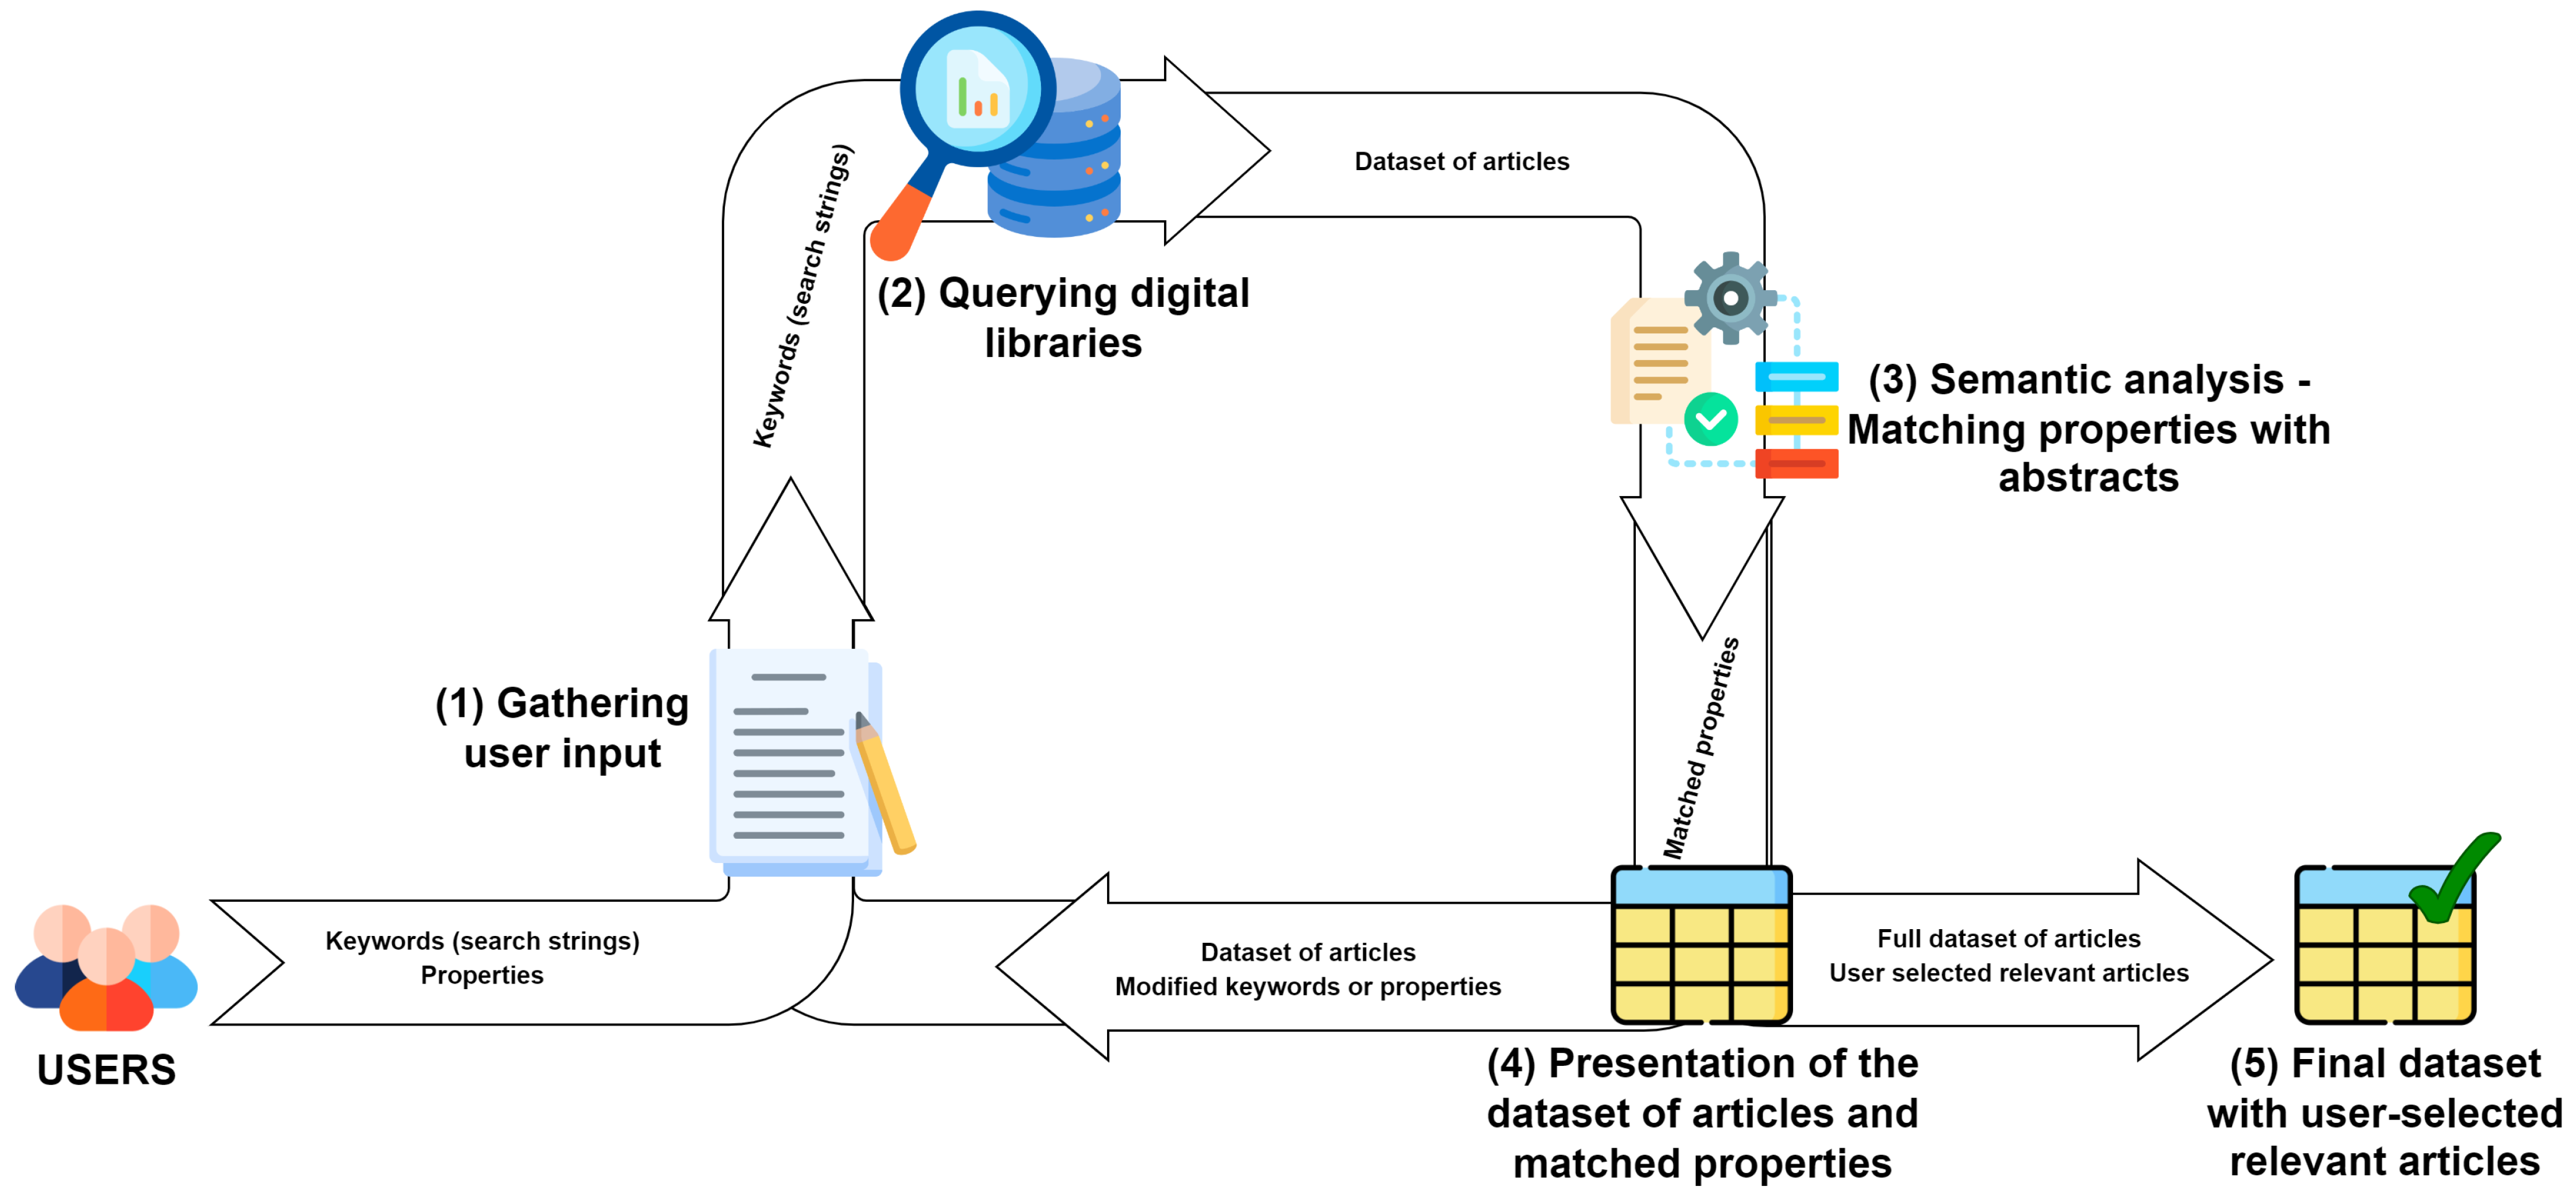
3.1. Framework for User-Driven Dataset Generation

This section discusses the systematic approach we use to generate the datasets for our study. At the core of this framework lies our tool for conducting systematic literature reviews. When a user successfully utilizes the tool, it produces a dataset that is invaluable for our study. The overview of this process is depicted in Figure 1 and consists of the following steps:
  • Gathering user input: The initial phase involves close collaboration with researchers who aim to conduct SLRs in specific domains. Leveraging their domain-specific knowledge and the topic of their investigation, these researchers first identify and define keywords, which serve as search strings to query digital libraries of articles. Subsequently, they provide us with properties and property groups. Properties consist of words or phrases that are used to search the titles and abstracts of articles to assess their relevance. Property groups are thematically or semantically organized collections of properties which enable a more comprehensive presentation of the results.
  • Dataset compilation: After collecting the user input, we proceed with querying the digital libraries of articles. Users can select which library options to query from, such as IEEE Xplore, Springer, MDPI, PubMed, and ScienceDirect. Using the keywords provided by the user, we construct search strings and the tool generates a dataset of articles in the form of an Excel file, including information like DOI, title, abstract, authors, affiliations, and other relevant details.
  • Semantic analysis: In this step, the title and the abstract of each paper in the dataset are subject to the tokenization of sentences [31,32], English stop words removal, stemming, and lemmatization [31] using the NLTK library [33] for Python. The exact process is applied to each defined property as well. Then, the stemmed and lemmatized properties are searched in the cleaned abstract and title, and the article is tagged with the properties it contains, as described in Section 3.2.1
  • Result presentation: The refined dataset is presented to the user, where the articles are in randomized order but supplemented with the properties found in the previous step available to be used as facet filters. These filters aid the user in easily and efficiently navigating the dataset, allowing them to sort and group the articles based on matched properties.
The steps from 1 to 4 constitute an iterative cycle that users can repeat as often as necessary, refining their inputs with each iteration to align with their research objectives more precisely. If users are not content with the current results, they can adjust the keywords or the properties used in the search. This allows them to start the process again, incorporating new or revised search criteria. They can continue this cycle as often as needed until they achieve satisfactory results that meet their research goals. Each iteration helps to progressively narrow down and refine the search, making it more targeted and relevant to their objectives.
5
Final user selection: The final step is where users provide feedback on the selected articles. This feedback is critical for our work to investigate and improve the relevance of the search results. In this step, users decide on the most relevant articles to their research objectives. Once this step is completed, we have a new dataset that includes all the provided articles and those specifically selected by the users.

3.2. Similarity Estimation Methods

This section introduces the algorithms we considered for estimating the similarities between the academic papers and the user-defined properties. Several criteria guided the selection of the methods. Firstly, we chose to explore algorithms that cover a diverse range of classes, ensuring a comprehensive analysis. Secondly, a critical factor in our selection was the speed and efficiency of the algorithms. The iterative nature of the review process necessitates fast execution, which enables frequent adjustments and refinement to obtain the desired results. The massive volume of articles processed in each iteration is another supportive point for the second criterion. Lastly, although the algorithms need to operate fast to accommodate multiple iterations, precision cannot be compromised. They have to aim to balance the speed and delivery of precise, valuable results.

3.2.1. Semantic Matching

Semantic matching is the foundational algorithm within our methodology and belongs to the rule-based approach class. This algorithm matches each entered property and its associated synonyms against the abstract of the articles. We tag each matched property and count the number of matches.
The algorithm implementation involves two counters: one for matched properties and another for matched property groups. To calculate the matched properties counter for an article, we check each property and increment the counter if the property is present in the abstract. This is illustrated in Equation (1), where M is the total number of defined properties, p i is the i t h property, and I s M a t c h e d ( p i ) returns 1 if the property is matched, returning 0 otherwise.
MatchedPropertyCount = i = 1 i = M I s M a t c h e d ( p i )
For the calculation of the matched property groups counter, we iterate over each property group and increment the counter only if there is at least one property that belongs in that group which can be found in the article’s abstract. We use Equation (2), where N is the total number of defined property groups, PG j is the j t h property group, p i is the i t h property, and I s M a t c h e d ( p i ) returns 1 if the property is matched, returning 0 otherwise.
MatchedPropertyGroupCount = j = 1 j = N 1 if p i P G j such that I s M a t c h e d ( p i ) = 1 , 0 otherwise
We rank the articles using the Matched Property Counter. In the event of identical match counts, the ranking proceeds with the Matched Property Group Counter. Rankings are in descending order, with higher counter values resulting in higher ranking positions.

3.2.2. TF-IDF

The Term Frequency–Inverse Document Frequency (TF-IDF) method is a statistical measure used to evaluate the importance of a word within a document concerning a corpus of documents. The underlying principle posits that words occurring frequently in a document but less so across multiple documents are more indicative of the document’s specificity [34,35].
In our case, the article’s abstract represents the document, the dataset of the identified articles is the corpus of documents, and the properties represent the query document. We build a TF-IDF model by providing the corpus as a training set. Then, we transform each abstract and the set of properties into document-term vectors. Each value in the vector is a TF-IDF score computed by Equation (3), where TF(w, d) is the term frequency (the number of times that word w appears in document d) and D is the corpus of documents.
T F - I D F ( w , d ) = T F ( w , d ) × log ( | D | | { d D : w d | } )
For each vector representing a document and for each vector derived from the query document, we calculate the cosine similarity using Equation (4), where d is the document vector and q is the query vector.
cosine _ similarity ( d , q ) = d · q d q
Ultimately, we rank the articles according to the similarity scores derived from their comparison with the query document, where higher scores correspond to better rankings.

3.2.3. N-Gram

The N-gram model is another technique that considers N consecutive words in a sequence as a single entity. These N-grams capture the contextual information and relationships between this sequence of words. The Bigram and Trigram approaches can capture complex details in phrases that single-word methods may overlook. Bigrams analyze sequences of two words, while Trigrams analyze sequences of three words.
In our study, we experimented with Bigram and Trigram models, given that some properties within our datasets are phrases consisting of multiple words rather than isolated terms. By employing these methods, we aim to capture the complete meaning of these phrases, making our analysis more thorough. We do not include longer N-gram models, as our analysis showed that around 98% of the user-provided properties were phrases containing three or fewer words.
To implement this, in addition to using unigrams (single words), we use bigrams (pairs of consecutive words) or trigrams (triplets of consecutive words). We then apply Equation (3) to obtain vectors with values, where w represents the chosen sequence instead of only a single word. We also construct a different query document. For bigrams, if the property phrase is one or two words, it remains unchanged. If it is more than two words, we construct multiple bigrams using a sliding window of one word. For trigrams, if the property phrase is less than three words, it remains unchanged. If it is more than three words, we construct multiple trigrams using a sliding window of one word. Additionally, we use cosine similarity from Equation (4) to obtain similarity scores which serve us in ranking the articles. In the further presentation of our work, we chose to use only one of these models (trigram) as the results we obtained for both models were similar.

3.2.4. SpaCy Word Embeddings

SpaCy [36] is a library for advanced NLP in Python. It provides high performance and offers a plethora of pre-trained models for a wide range of NLP tasks. Word embeddings transform words into vectors within a high-dimensional space, making it possible to quantify the semantic relationships and distinctions among words.
We opt for a word embedding model from the SpaCy library, selecting the en-core-web-md, a pre-trained medium-sized processing model for the English language designed for general-purpose tasks and trained on diverse web-based texts. It contains more than 20,000 unique vectors. We transform the abstracts by converting the words or tokens into their multi-dimensional meaning representation using the integrated word2vec algorithm. Consequently, each abstract is represented by an average vector derived from all its token vectors. Additionally, we formulate a query vector from the user-defined properties using the same rules applied to the abstracts. To compare the articles with these properties, we utilize SpaCy’s internal function for similarity, which uses internal implementation for cosine similarity by default. The scores obtained from this metric are used to rank the articles accordingly.

3.2.5. MiniLM v2

MiniLM is a distilled language model designed to compress pre-trained transformer models by training a smaller model (student) to emulate the self-attention component of a larger model (teacher) [37]. This compression enables MiniLM to maintain a high level of understanding and inference capabilities similar to its larger counterparts but with significantly reduced computational requirements.
MiniLM v2 introduces improved distillation techniques for a more effective knowledge transfer from the teacher to the student model, faster processing times, and fewer computational resources [38].
We utilize the paraphrase-MiniLM-L6-v2 model [39] to map the abstracts and the properties as a query document into a 384-dimensional dense vector space. We apply cosine similarity from Equation (4) to the vectors. We use the derived scores from the metric to order the articles, assigning higher rankings to articles with higher scores.

3.2.6. E5 Mistral-7B

Mistral-7B is an open-source large language model (LLM) developed by Mistral AI. It features 7 billion parameters and leverages advanced attention mechanisms, including grouped-query attention (GQA) and sliding-window attention (SWA). GQA accelerates inference speed and reduces memory requirements during decoding, allowing for larger batch sizes and increased throughput. Additionally, SWA effectively manages longer sequences at a reduced computational cost, addressing a common limitation in large language models [40].
In our experiments, we employ the E5-Mistral-7B-Instruct model, which is initialized from the pre-trained Mistral-7B and further fine-tuned on a diverse set of multilingual datasets [41]. The model architecture comprises 32 layers. For the purpose of document representation, we encode the abstracts into a dense vector space with 4096 dimensions. Similarly, the query document is transformed into a query vector using the same model. To determine the relevance of documents, we compute the cosine similarity between the query vector and the document vectors, following the same approach employed with MiniLM.

3.2.7. Weighted Semantic Matching + MiniLM

After evaluating the initial results from all methods, we observed that Semantic Matching and MiniLM performed better than the other methods. In collaboration with the researchers who have used this tool in the past, we concluded that not all properties they provided had the same level of importance. Consequently, some articles were potentially ranked higher due to their similarity to less significant properties.
To address this concern, we introduced the hybrid method of “WSM + MiniLM”, where we use Semantic Matching for the most significant properties. However, to ensure that all properties are considered and to resolve the ranking ties created, we use MiniLM on all provided properties. With this combination, we assign more value to the most important factors while still including all properties in the process.
The proposed method for improving the retrieval of relevant articles combines Semantic Matching described in Section 3.2.1 and MiniLM described in Section 3.2.5. We acknowledge that there is variation in the importance of the properties that the user provides. Thus, we introduce binary weights where the user assigns 1 for higher importance and 0 for lower importance to each specified property.
In the initial phase, we apply the Semantic Matching algorithm and keep track of all matched properties. Then, we compute the Weight-Matching score using Equation (5), where M is the total number of defined properties, p i is the i t h property, I ( p i ) is the importance for the i t h property (1 or 0), and I s M a t c h e d ( p i ) returns 1 if the property is matched, returning 0 otherwise.
Weight - Matching score = i = 1 i = M I ( p i ) × I s M a t c h e d ( p i )
In the second phase, we compute the MiniLM score, which is the same score as the one in Section 3.2.5.
Lastly, we rank the articles where the Weight-Matching score is the first criterion and the MiniLM score is the second criterion.

3.3. Evaluation Metrics

For evaluating our methods, we employ a set of metrics divided into the following two main categories: global evaluation metrics for a comprehensive assessment across all algorithms and specific metrics for pairwise comparisons.

3.3.1. Global Metrics

The global metrics provide a way to assess the performance of multiple algorithms simultaneously. Since our goal is to present to the user a list where the more relevant papers are higher on the list, all of these metrics focus on the ranking position of the papers that the user marked as relevant.

Top at K

This metric measures how many selected papers are ranked in the top K places by each algorithm. If the user selected N papers and only M of them are in the top K places, the value for this metric is M.

Precision at K

This metric assesses the proportion of relevant papers in the top K recommendations. If the user selected N papers and only M of them are in the top K places, the value for this metric is
Precision @ K = M K

Recall at K

With this, we evaluate the ability of the algorithm to retrieve relevant papers within the top K ranks. If the user selected N papers and only M of them are in the top K places, the value for this metric is
Recall @ K = M N

Average Rank

To calculate the average rank, we obtain the ranking position of each selected paper and then compute the mean value. If the user selected N papers, the value for this metric is defined as follows:
Average Rank = i = 1 i = N Rank ( P a p e r i ) N

Median Rank

For the median rank computation, we also obtain the ranking position of each selected paper and then calculate the median value. If the user selected N papers, the value for this metric is calculated as
Median Rank = N + 1 2 t h term if N is odd , N 2 t h term + N + 1 2 t h term 2 if N is even .
For the first three metrics (Top@K, Precision@K, and Recall@K), one algorithm performs better if it has a higher value for them, indicating the algorithm’s ability to identify and rank relevant items correctly at the top of the list. The values for the average and median ranks are preferable when lower, reflecting the algorithm’s ability to place relevant papers closer to the top.

3.3.2. Pairwise Algorithm Comparison

In addition to evaluating the algorithms’ performance using global metrics, we proceed with evaluation metrics for pairwise algorithm comparison. We use these metrics to demonstrate a head-to-head comparison of the better-performing methods from the global metrics.
Because all of the following metrics are defined to work with two algorithms, we refer to the algorithms as algorithm A and algorithm B.

Higher Rank Count

This metric counts instances where one algorithm ranks a paper higher than the other. We use two values, Higher Rank Count A and Higher Rank Count B. Both counters start at 0, and for each selected paper, we compare the rank given by algorithm A and the rank given by algorithm B. If the first algorithm provides a rank with a lower value (closer to the top), then the Higher Rank Count A value is incremented by 1, and vice versa.

Average Rank Difference

The average rank difference determines the average difference in the ranking positions assigned by the two algorithms. If the user selected N papers, to compute the average rank difference, we follow these steps:
For each selected paper,
(i)
Obtain rank A (given by algorithm A) and rank B (given by algorithm B).
(ii)
Calculate the difference between rank A and B ( R a n k A R a n k B ). This equation may produce positive and negative values. A positive value means algorithm B performs better, and a negative value means that algorithm A performs better.
Then,
(iii)
Calculate the average value of all rank differences computed in step (ii) using the following equation:
Average Rank Difference = i = 1 i = N RankDifference ( Paper i ) N
The final value can be either positive or negative. If the value is positive, it means algorithm B performs better, and if the value is negative, then algorithm A performs better. The magnitude of the value refers to how much better one algorithm performs. The higher the magnitude value, the more significant the difference between the performance.

Median rank difference

This metric computes the median of the rank position differences. If the user selected N papers, to calculate the median rank difference, we do as follows:
(i)
Complete step (i) and step (ii) precisely as we do for average rank difference.
(ii)
Calculate the median for all rank differences using the same equation (Equation (9)) as we use for Median Rank.
For the median rank difference, we use the same interpretation of the sign and the same magnitude of the value as we use for the average rank difference.

4. Results and Discussion

In this section, we focus on the specifics of the datasets utilized in our study and present a comprehensive analysis of the obtained experimental results. We provide an overview of the characteristics and scope of each dataset and their applicability to the research objective. Furthermore, the results section discusses the outcomes of our experiments, highlighting the insights from the analysis.

4.1. Datasets

We implemented the proposed methodologies in Python and applied them to five unique datasets. Each dataset represents a published comprehensive literature review successfully conducted using the tool [6]. Domain-specific experts utilized our tool, which provided them with a corpus of articles. These researchers invested significant manual effort in evaluating the identified articles, and eventually selected the relevant ones for their studies. This effort can be considered as a data-labelling effort for the current study and provides the ground truth of relevant articles. Table 1 outlines the datasets, including the number of papers made available to the researchers and the number of papers selected as relevant for their research purposes.
In this subsection, we describe the datasets that we use:
  • Driving healthcare monitoring with IoT and wearable devices: A systematic review—This dataset is obtained from a systematic review aimed at exploring the use of the IoT and wearable devices in monitoring drivers’ health.
  • Ambient Assisted Living (AAL): Scoping Review of Artificial Intelligence (AI) Models, Domains, Technology, and Concerns [42]—This dataset originates from a comprehensive scoping review to identify, analyze, and extract the literature on AI models in AAL.
  • Mobile and wearable technologies for the analysis of Ten Meter Walk Test: A concise, systematic review [43]—This dataset is derived from a concise, systematic review related to the use of mobile or wearable devices to measure physical parameters while administering the Ten Meter Walk Test for the analysis of the performance of the test.
  • Venture Capital: A Bibliometric Analysis—This dataset is derived from a meticulous bibliometric and structural review, emphasizing three primary topical areas: environment, social, governance (ESG), innovation, and exit strategies.
  • Automating feature extraction from Entity-Relation models: Experimental evaluation of machine learning methods for relational learning [44]—This dataset is curated following a study that included a comprehensive review of the existing literature in the field of relational learning and proceeded with further exploring.

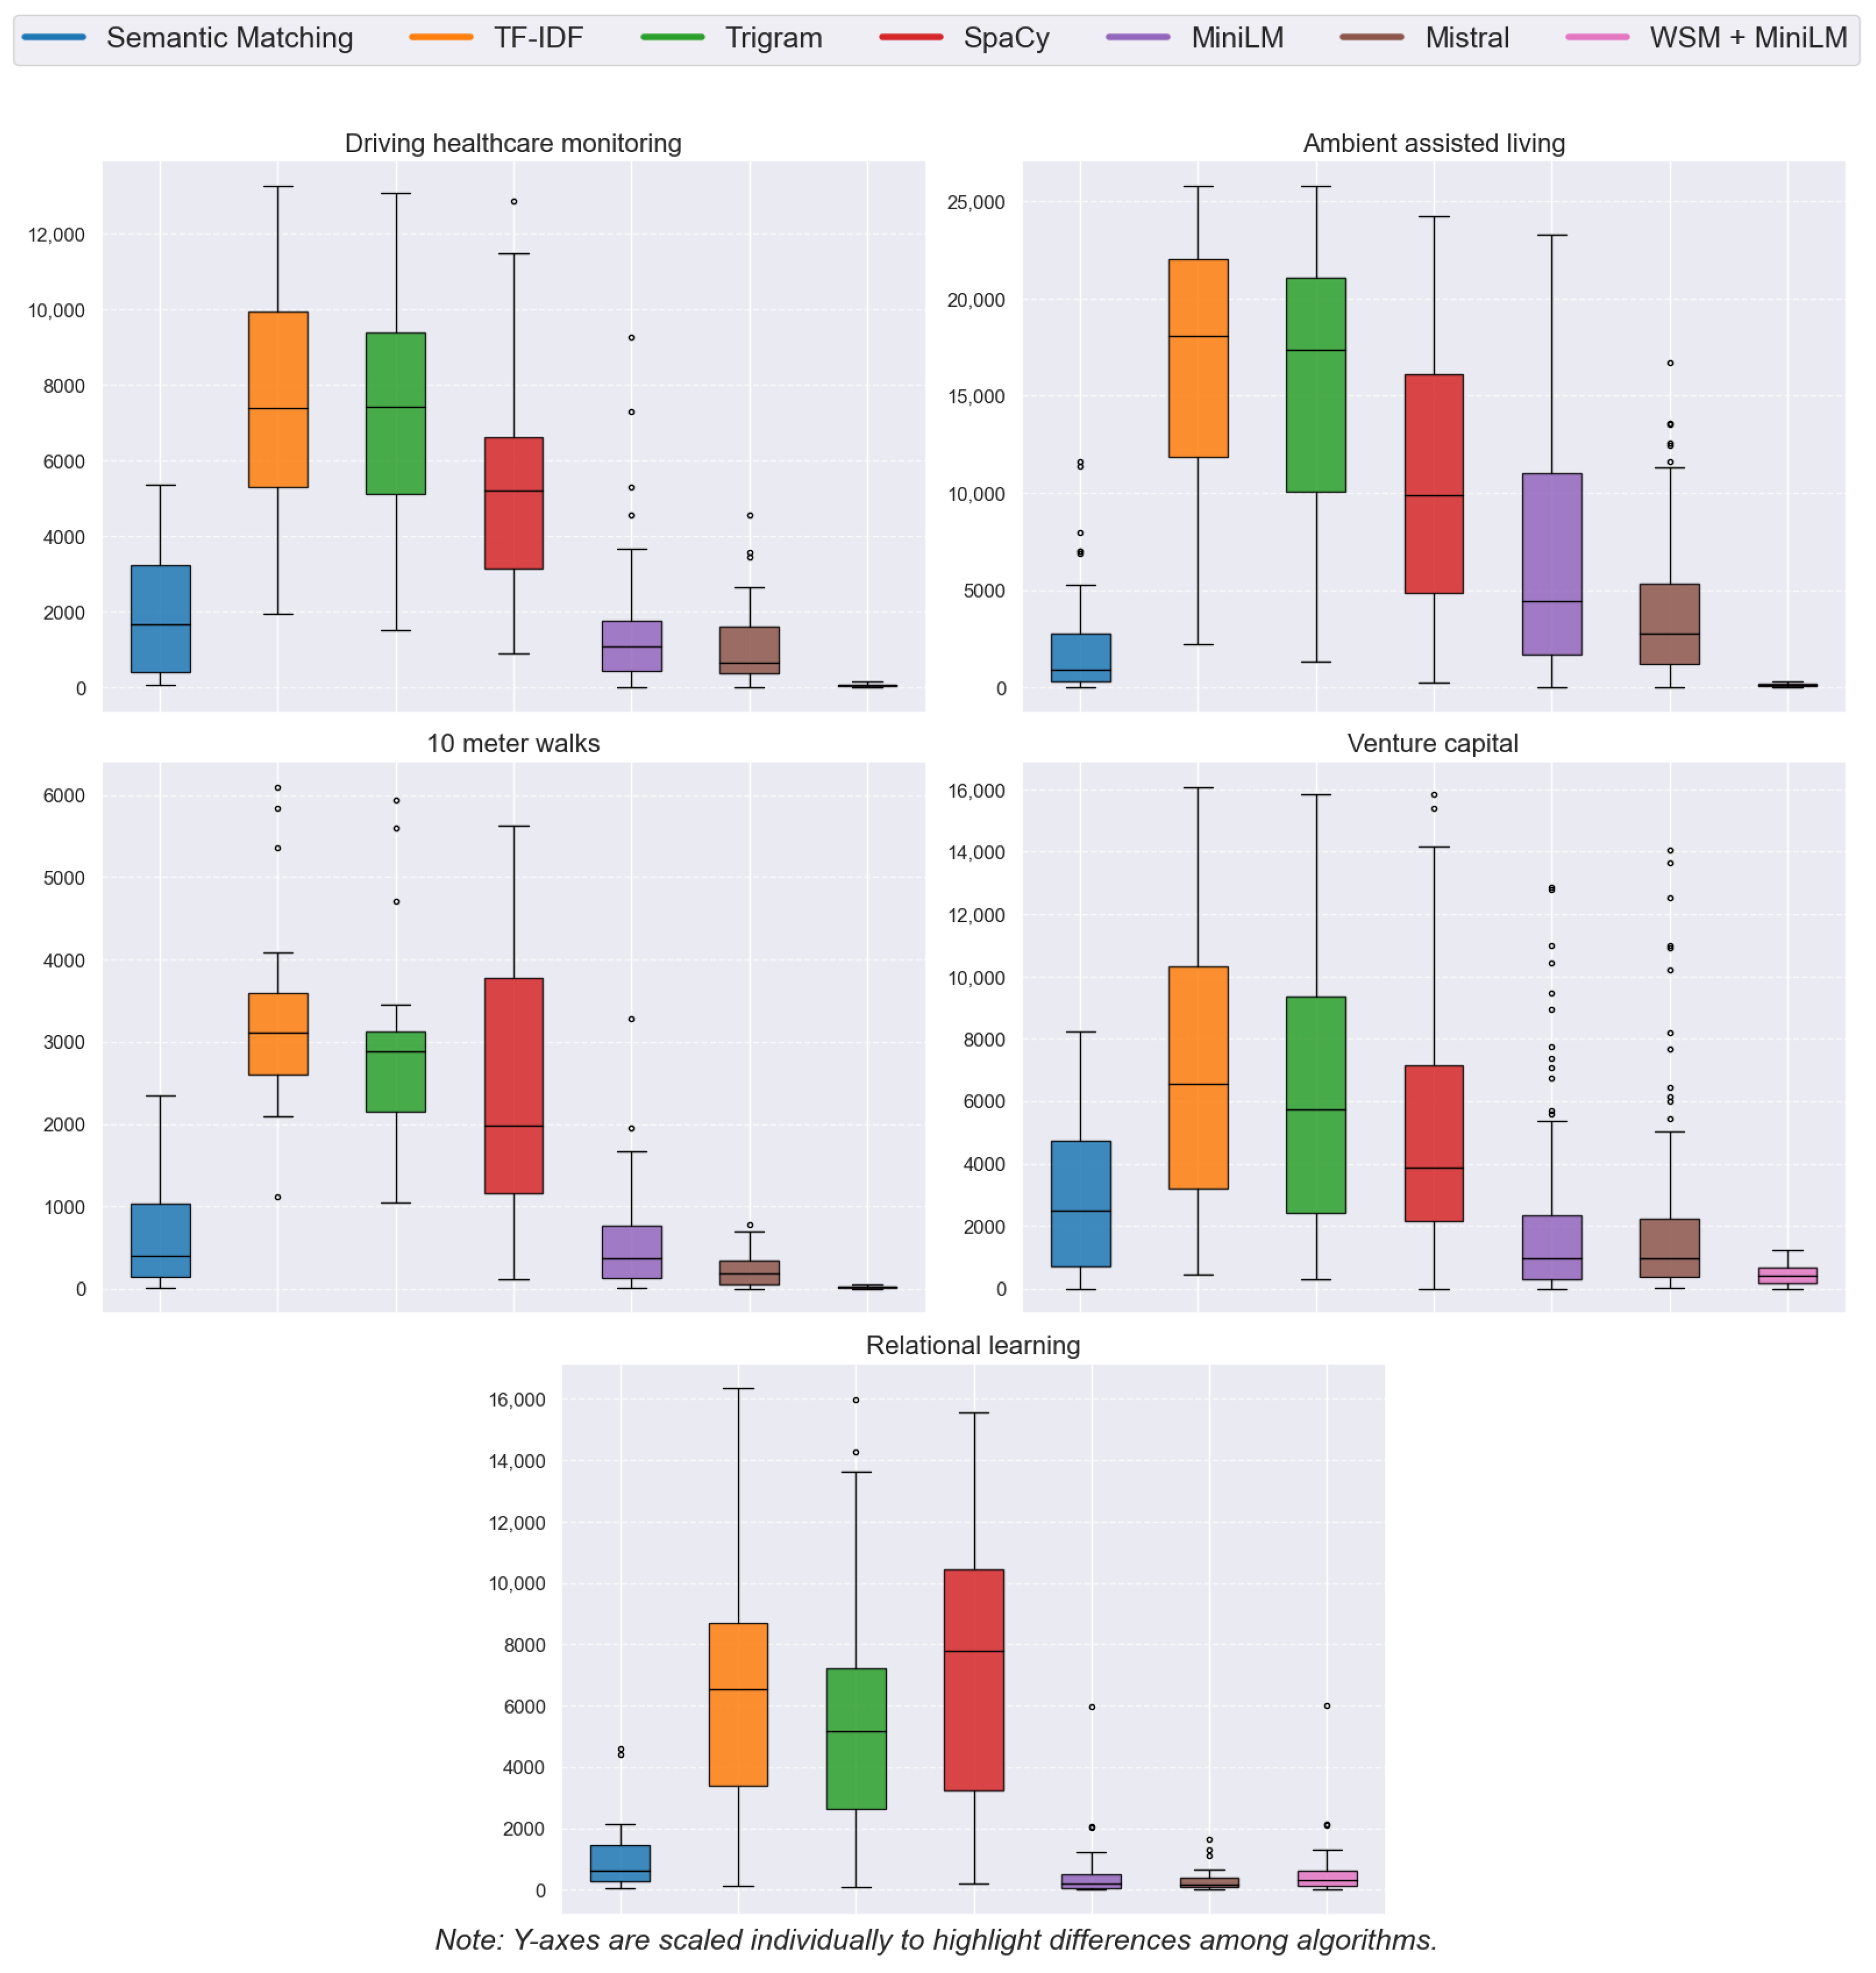
4.2. Rank Distribution
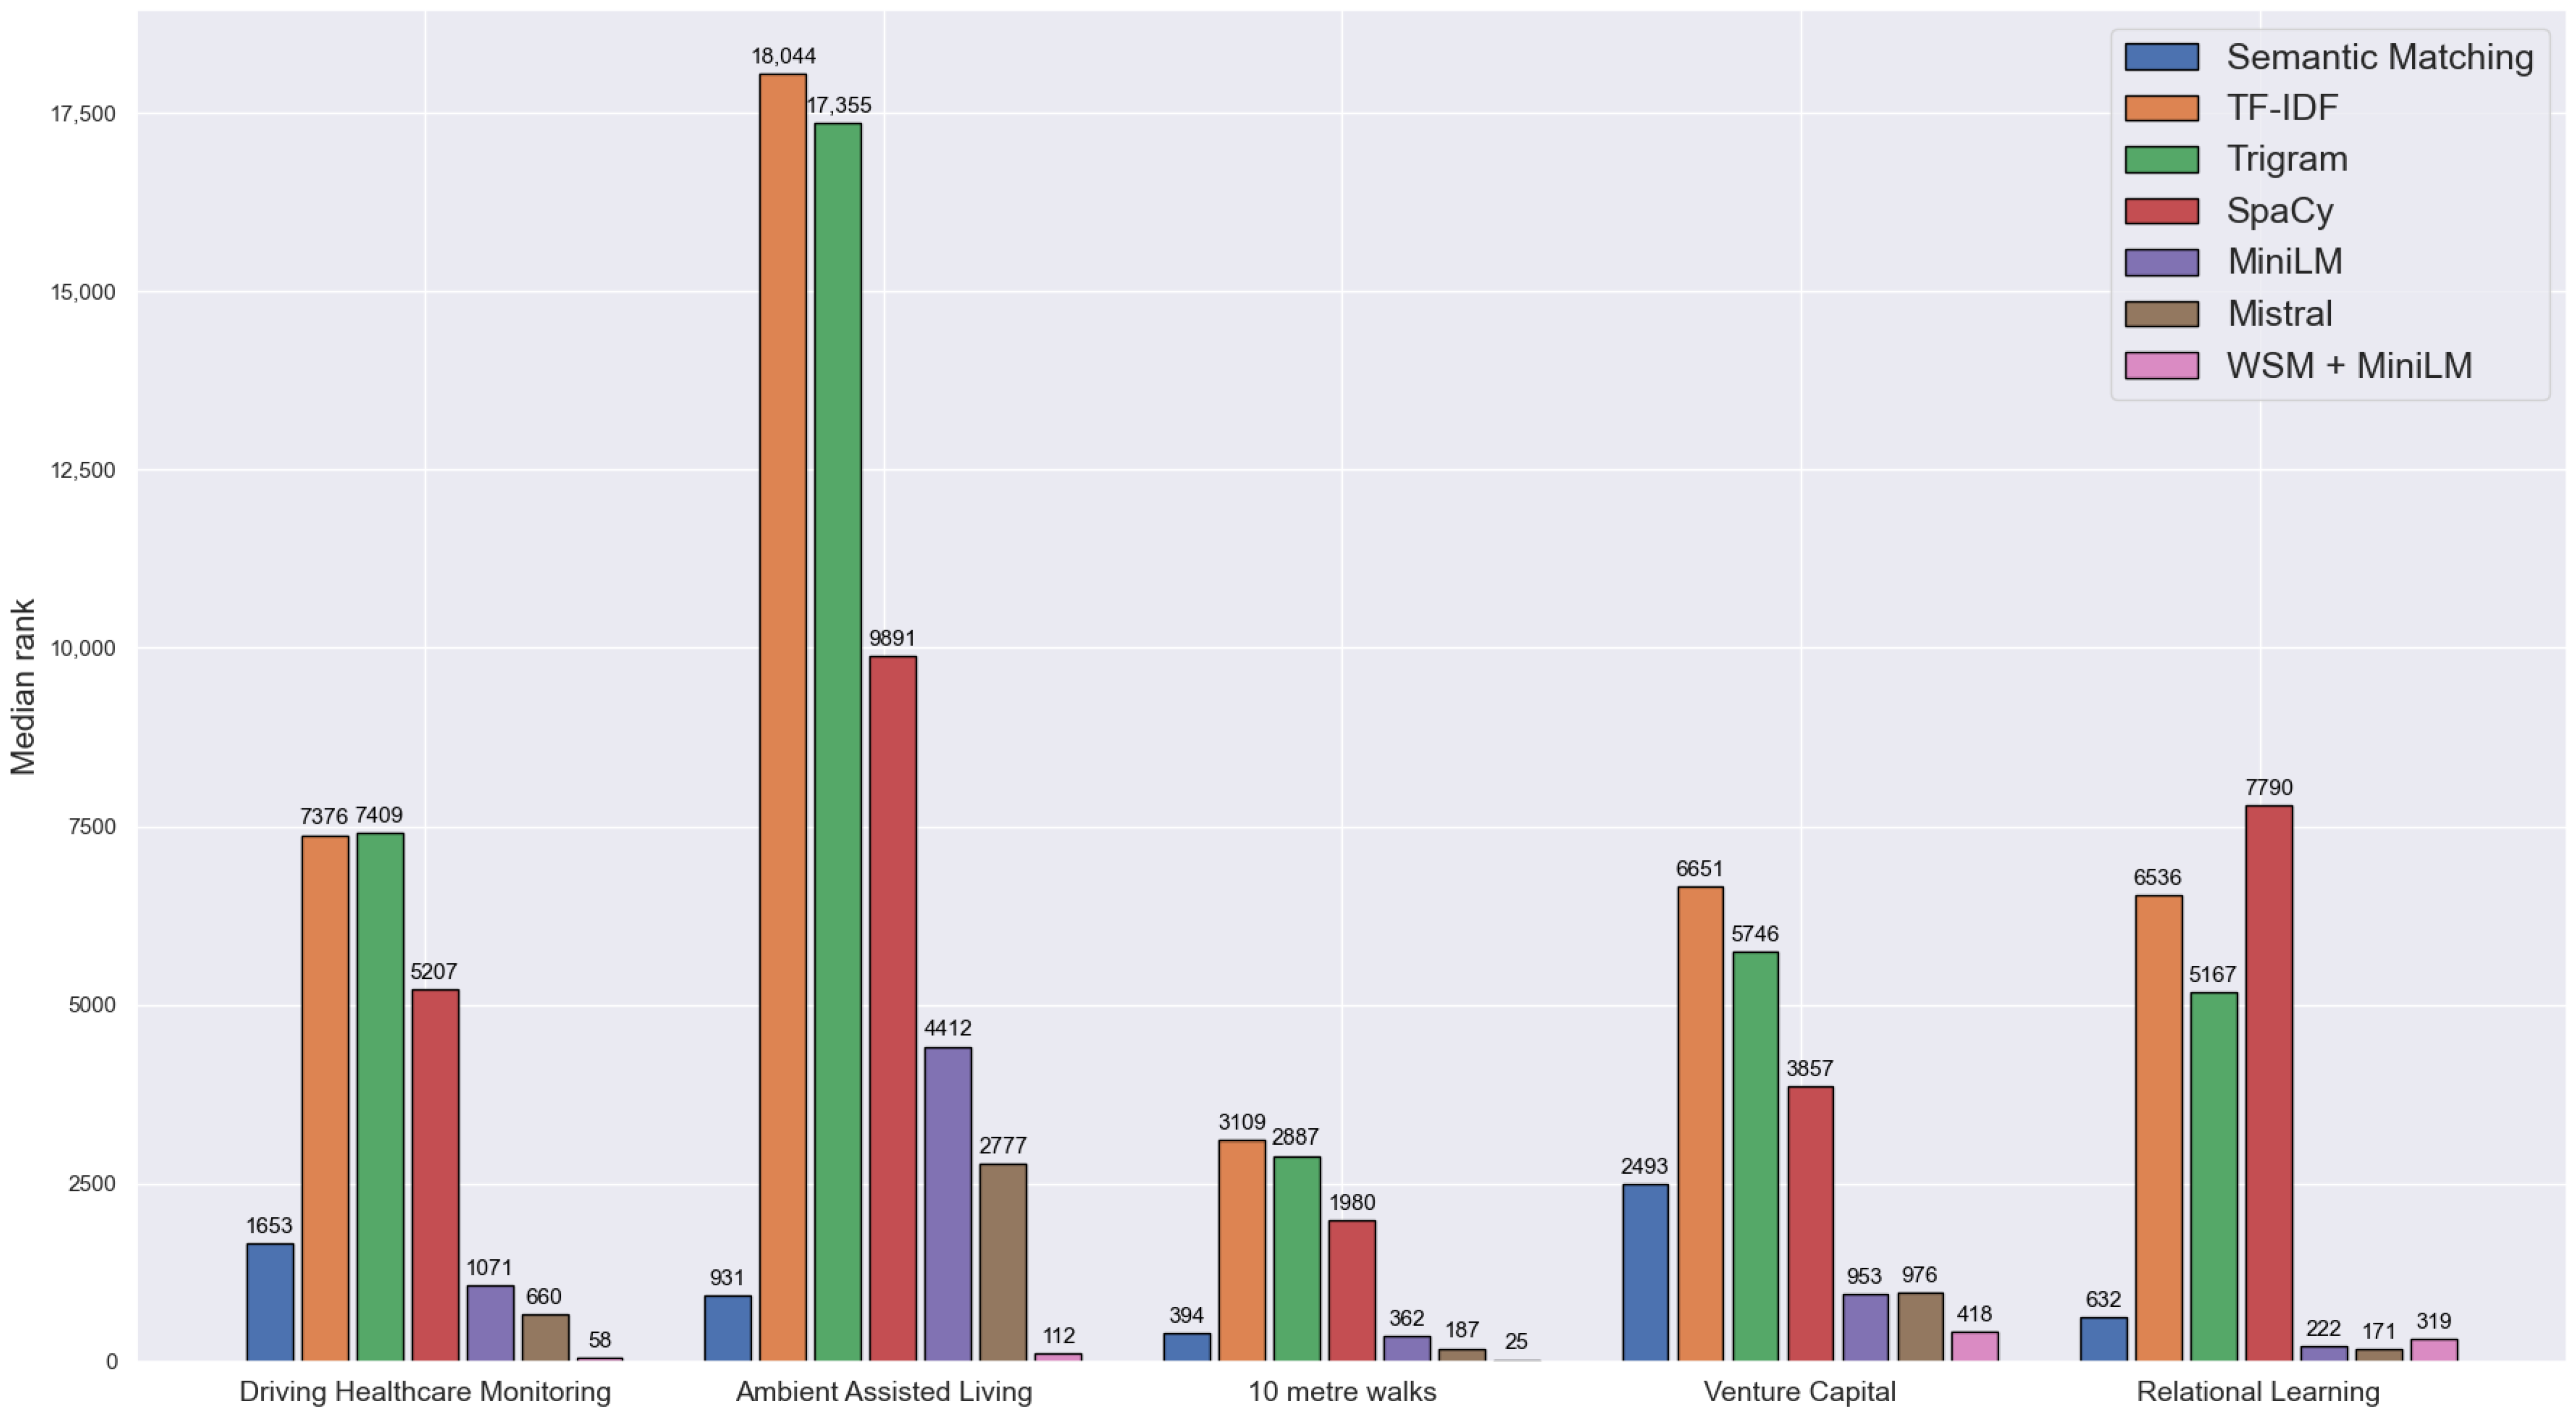
In the initial phase of our experimental analysis, our attention is centered on the distribution of the rankings for the chosen papers within the datasets. Accordingly, Figure 2 showcases the box plot representations of these rank distributions across the five datasets for each algorithm under examination. The figure includes five distinct box plot visualizations, each corresponding to a separate dataset. The x-axes display seven box plots representing each algorithm, while the y-axes detail the ranking numbers. It is essential to highlight that the rank numbers on the y-axes are scaled individually for each dataset to accentuate the comparative differences among the algorithms.
The visual representation reveals that the box plots corresponding to Semantic Matching, MiniLM, Mistral, and WSM + MiniLM display a narrower distribution, indicative of a more stable and consistent ranking. Additionally, the rankings are positioned towards the lower end of the scale, signifying that the selected papers tend to receive some of the best rankings. Conversely, the algorithms TF-IDF, Trigram, and SpaCy demonstrate fluctuation in their rankings, typically performing less favorably than the other algorithms.

4.3. Median Rank

In the next part of our analysis, we focus on the median rank of the selected papers. We introduce a clustered bar chart in Figure 3. This figure comprises five bar charts, one for each dataset containing six bars. The bars depict the median rank achieved by each algorithm.
The bar chart complements the box plot analysis, showcasing that the bars representing the Semantic Matching, MiniLM, Mistral, and WSM + MiniLM algorithms are closer to the top rankings, with the latter performing the best.

4.4. Metrics

4.4.1. Global Metrics

In the concluding phase of our analysis, we evaluate the algorithms’ performance using the global metrics outlined in Section 3.3.1. The findings from this comprehensive analysis are displayed in Table 2 and Table 3, where the highlighted cells show the best performing algorithm per metric and dataset.
In our analysis, we experimented with values of 100, 500, and 1000 for K when evaluating the metrics Top @ K, Precision @ K, and Recall @ K. Table 2 presents these three metrics for K values of 100 and 500. The results indicate that WSM + MiniLM outperforms other methodologies across four out of five datasets, while MiniLM and E5 Mistral share the top position in the Relational Learning dataset. The WSM + MiniLM algorithm achieves a recall rate of 100% for Recall @ 500 in three datasets and approximately 60% in the remaining two. E5 Mistral emerges as the second best performer, with recall rates at K = 500 ranging from 70–80% in the best cases to 30% in the worst. Following this, MiniLM and Semantic Matching exhibit recall rates at K = 500 ranging from 50–60% in the best scenarios to 20–30% in the worst.
Table 3 displays the outcomes of Top @ K, Precision @ K, and Recall @ K with K set to 1000, along with the metrics AverageRank and MedianRank. The results indicate that WSM + MiniLM excels in the first three metrics, achieving a perfect recall rate of 100% in three datasets and around 80–90% in the remaining two. Moreover, Semantic Matching, E5 Mistral, and MiniLM also demonstrate strong performance, with E5 Mistral matching WSM + MiniLM in the Ten Meter Walks dataset and slightly outperforming it in the Relational Learning dataset.
Furthermore, in the assessment of Average Rank and Median Rank metrics, the WSM + MiniLM algorithm surpasses the competing algorithms, except for the Relational Learning dataset, where E5 Mistral exhibits superior performance. The analysis indicates that for three datasets, the metrics approximate a value of 100, suggesting that a significant proportion of the selected papers are ranked within the top 100 positions. The performance falls within the 200 to 400 range for the remaining two datasets, which is still beneficial.
It is important to highlight the distinction in computational resources used for the different experiments conducted in this study. All experiments, except those involving the Mistral model, were performed on a local machine equipped with 64 GB of RAM and an Intel Core i9-9900K [email protected]. These experiments are executed efficiently, typically requiring only a few minutes to complete. In contrast, the Mistral experiments demanded significantly more computational time. For instance, processing the smallest dataset Ten Meter Walks took approximately 20 h on the same machine. Moreover, estimations indicated that processing the larger datasets could take 2 to 3 days per dataset.
Due to the computational intensity of the Mistral model experiments, we utilized a virtual machine on Google Cloud equipped with an NVIDIA A100 GPU. This GPU features 640 Tensor Cores, 6912 CUDA Cores, and up to 40 GB of high-bandwidth memory (HBM). Despite the powerful resources, these experiments required substantial execution times as follows: approximately 2 h for the Ambient Assisted Living dataset, 1 h each for the Relational Learning, Driver Healthcare Monitoring, and Venture Capital datasets, and about 30 min for the Ten Meter Walks dataset.

4.4.2. Pairwise Algorithm Comparison

Drawing from the insights provided by the visualizations and the results from the global performance metrics, it is evident that the Semantic Matching, MiniLM, E5 Mistral, and WSM + MiniLM algorithms outperform the others. Consequently, we employ the pairwise algorithm comparison metrics established in Section 3.3.2 to understand their comparative effectiveness better. The outcomes of this comparative analysis are presented in Table 4, where the performance of these four algorithms is examined in pairs.
The pairwise comparison between Semantic Matching and MiniLM shows that MiniLM outperforms across three datasets for all evaluated metrics. Semantic Matching is better in one dataset, while the performance is comparable in another. In other comparisons among the standalone methods, E5 Mistral outperforms both MiniLM and Semantic Matching in four out of five datasets, with Semantic Matching leading in the Ambient Assisted Living dataset and MiniLM holding a slight advantage in the Venture Capital dataset. When comparing all standalone methods to WSM + MiniLM, it is clear that the latter consistently demonstrates superior performance. The only exception is the Relational Learning dataset, where MiniLM and E5 Mistral hold an advantage.

4.5. Dataset Availability

The datasets we utilize in this study are openly available on https://gitlab.com/magix.ai/article-analysis-meta-study/-/tree/main/datasets (accessed on 10 August 2024).

5. Conclusions and Future Work

Throughout this paper, we investigated several approaches and methodologies for text similarity, aiming to optimize the writing process of review papers by introducing rankings and prioritizing the more relevant articles. In addition, we presented a novel custom algorithm, WSM + MiniLM, which integrates elements of two separate algorithms. We employed evaluation metrics tailored to assess the ranking accuracy of the selected articles accurately.
We can conclude that in four out of five datasets tested, the WSM + MiniLM algorithm surpassed the performance of competing algorithms across all assessed metrics. In the case of the fifth dataset, its performance was comparable to that of the E5 Mistral algorithm. This outcome significantly improved our initial study, which relied on a Semantic Matching algorithm without article ranking capabilities. Incorporating WSM + MiniLM into our toolkit enhances the automation process and reduces the time researchers need to dedicate to further article exploration.
While we recognize the potential of LLM models for processing articles and conducting SLRs—and even experimented with one model—we ultimately decided against incorporating additional models due to several key factors. Firstly, the speed and efficiency of the algorithms were crucial factors in our methodology selection. The iterative nature of the review process necessitates fast execution, which enables frequent adjustments and refinements to achieve the desired results. Our exploration of the current literature concerning using LLMs for SLRs and our own experiences highlighted certain limitations and challenges, particularly in cost and processing time. Although LLMs possess advanced capabilities, they did not align with our primary objectives of efficiency and affordability within this context. However, we plan to conduct a comprehensive study to evaluate the contributions of various LLM models to this problem, and we intend to integrate them into the fine-tuning phase of our approach in the future.
Although this study primarily focused on improving the retrieval and ranking of scientific articles, the methodologies and techniques developed broadly apply to various documents across different organizations.
Recognizing that our study relies on five datasets, we intend to expand our research to encompass additional and varied datasets. Moreover, we aim to refine our custom algorithm by shifting from binary to continuous weights, allowing for more detailed analysis. We also plan to evaluate new algorithms either for comprehensive analysis or specifically for fine-tuning the results. Additionally, we are considering introducing a feature that enables users to input complete sentences in the properties section rather than just words and phrases.

Author Contributions

Conceptualization, G.M. (Goran Mitrov), S.G. and E.Z.; methodology, G.M. (Goran Mitrov), S.G. and E.Z.; software, G.M. (Goran Mitrov) and B.S.; validation, B.S., G.M. (Georgina Mirceva) and S.G.; formal analysis, S.G. and E.Z.; investigation, G.M. (Goran Mitrov); resources, G.M. (Georgina Mirceva) and S.G.; data curation, G.M. (Goran Mitrov), B.S. and E.Z.; writing—original draft preparation, G.M. (Goran Mitrov) and B.S.; writing—review and editing, G.M. (Goran Mitrov), S.G., G.M. (Georgina Mirceva) and E.Z.; visualization, G.M. (Goran Mitrov) and B.S.; supervision, S.G. and E.Z.; project administration, G.M. (Georgina Mirceva), S.G. and E.Z.; funding acquisition, G.M. (Georgina Mirceva), S.G. and E.Z. All authors have read and agreed to the published version of the manuscript.

Funding

This work was partially financed by the Faculty of Computer Science and Engineering at the Ss. Cyril and Methodius University in Skojpe, Macedonia.

Data Availability Statement

The datasets we utilize in this study are openly available on https://gitlab.com/magix.ai/article-analysis-meta-study/-/tree/main/datasets (accessed on 10 August 2024).

Conflicts of Interest

The authors declare no conflict of interest.

References

  1. Bornmann, L.; Haunschild, R.; Mutz, R. Growth rates of modern science: A latent piecewise growth curve approach to model publication numbers from established and new literature databases. Humanit. Soc. Sci. Commun. 2021, 8, 224. [Google Scholar] [CrossRef]
  2. Kitchenham, B.; Charters, S. Guidelines for Performing Systematic Literature Reviews in Software Engineering; University of Durham: Durham, UK, 2007. [Google Scholar]
  3. Michelson, M.; Reuter, K. The significant cost of systematic reviews and meta-analyses: A call for greater involvement of machine learning to assess the promise of clinical trials. Contemp. Clin. Trials Commun. 2019, 16, 100443. [Google Scholar] [CrossRef] [PubMed]
  4. Moher, D.; Stewart, L.; Shekelle, P. All in the Family: Systematic reviews, rapid reviews, scoping reviews, realist reviews, and more. Syst. Rev. 2015, 4, 183. [Google Scholar] [CrossRef] [PubMed]
  5. Alla, A.; Zdravevski, E.; Trajkovik, V. Framework for Aiding Surveys by Natural Language Processing. In Proceedings of the ICT Innovations 2017Web Proceedings, Skopje, Macedonia, 18–23 September 2017; pp. 11–21. [Google Scholar]
  6. Zdravevski, E.; Lameski, P.; Trajkovik, V.; Chorbev, I.; Goleva, R.; Pombo, N.; Garcia, N.M. Automation in Systematic, Scoping and Rapid Reviews by an NLP Toolkit: A Case Study in Enhanced Living Environments. In Enhanced Living Environments: Algorithms, Architectures, Platforms, and Systems; Ganchev, I., Garcia, N.M., Dobre, C., Mavromoustakis, C.X., Goleva, R., Eds.; Springer International Publishing: Cham, Switzerland, 2019; pp. 1–18. [Google Scholar] [CrossRef]
  7. Carver, J.C.; Hassler, E.; Hernandes, E.; Kraft, N.A. Identifying Barriers to the Systematic Literature Review Process. In Proceedings of the 2013 ACM/IEEE International Symposium on Empirical Software Engineering and Measurement, Baltimore, MD, USA, 10–11 October 2013; pp. 203–212. [Google Scholar] [CrossRef]
  8. Cohen, A.; Hersh, W.; Peterson, K.; Yen, P.Y. Reducing Workload in Systematic Review Preparation Using Automated Citation Classification. J. Am. Med Informatics Assoc. 2006, 13, 206–219. [Google Scholar] [CrossRef] [PubMed]
  9. O’Mara-Eves, A.; Thomas, J.; McNaught, J.; Miwa, M.; Ananiadou, S. Using text mining for study identification in systematic reviews: A systematic review of current approaches. Syst. Rev. 2015, 4, 5. [Google Scholar] [CrossRef]
  10. van Dinter, R.; Tekinerdogan, B.; Catal, C. Automation of systematic literature reviews: A systematic literature review. Inf. Softw. Technol. 2021, 136, 106589. [Google Scholar] [CrossRef]
  11. Sundaram, G.; Berleant, D. Automating Systematic Literature Reviews with Natural Language Processing and Text Mining: A Systematic Literature Review. arXiv 2022. [Google Scholar] [CrossRef]
  12. Zala, K.; Acharya, B.; Mashru, M.; Palaniappan, D.; Gerogiannis, V.C.; Kanavos, A.; Karamitsos, I. Transformative Automation: AI in Scientific Literature Reviews. Int. J. Adv. Comput. Sci. Appl. 2024, 15. [Google Scholar] [CrossRef]
  13. Cierco Jimenez, R.; Lee, T.; Rosillo, N.; Cordova, R.; Cree, I.A.; Gonzalez, A.; Indave Ruiz, B.I. Machine learning computational tools to assist the performance of systematic reviews: A mapping review. BMC Med. Res. Methodol. 2022, 22, 322. [Google Scholar] [CrossRef]
  14. Johnson, E.E.; O’Keefe, H.; Sutton, A.; Marshall, C. The Systematic Review Toolbox: Keeping up to date with tools to support evidence synthesis. Syst. Rev. 2022, 11, 258. [Google Scholar] [CrossRef]
  15. Gates, A.; Johnson, C.; Hartling, L. Technology-assisted title and abstract screening for systematic reviews: A retrospective evaluation of the Abstrackr machine learning tool. Syst. Rev. 2018, 7, 45. [Google Scholar] [CrossRef] [PubMed]
  16. Ouzzani, M.; Hammady, H.; Fedorowicz, Z.; Elmagarmid, A. Rayyan—A web and mobile app for systematic reviews. Syst. Rev. 2016, 5, 210. [Google Scholar] [CrossRef] [PubMed]
  17. Cheng, S.; Augustin, C.; Bethel, A.; Gill, D.; Anzaroot, S.; Brun, J.; DeWilde, B.; Minnich, R.; Garside, R.; Masuda, Y.; et al. Using machine learning to advance synthesis and use of conservation and environmental evidence. Conserv. Biol. 2018, 32, 762–764. [Google Scholar] [CrossRef] [PubMed]
  18. Thomas, J.; Brunton, J.; Graziosi, S. EPPI-Reviewer 4.0: Software for research synthesis. In EPPI-Centre Software; Social Science Research Unit, Institute of Education: London, UK, 2010. [Google Scholar]
  19. Przybyła, P.; Brockmeier, A.J.; Kontonatsios, G.; Le Pogam, M.; McNaught, J.; von Elm, E.; Nolan, K.; Ananiadou, S. Prioritising references for systematic reviews with RobotAnalyst: A user study. Res. Synth. Methods 2018, 9, 470–488. [Google Scholar] [CrossRef] [PubMed]
  20. van de Schoot, R.; de Bruin, J.; Schram, R.; Zahedi, P.; de Boer, J.; Weijdema, F.; Kramer, B.; Huijts, M.; Hoogerwerf, M.; Ferdinands, G.; et al. An open source machine learning framework for efficient and transparent systematic reviews. Nat. Mach. Intell. 2021, 3, 125–133. [Google Scholar] [CrossRef]
  21. Howard, B.E.; Phillips, J.; Tandon, A.; Maharana, A.; Elmore, R.; Mav, D.; Sedykh, A.; Thayer, K.; Merrick, B.A.; Walker, V.; et al. SWIFT-Active Screener: Accelerated document screening through active learning and integrated recall estimation. Environ. Int. 2020, 138, 105623. [Google Scholar] [CrossRef]
  22. Wagner, G.; Lukyanenko, R.; Paré, G. Artificial intelligence and the conduct of literature reviews. J. Inf. Technol. 2022, 37, 209–226. [Google Scholar] [CrossRef]
  23. Atkinson, C.F. Cheap, Quick, and Rigorous: Artificial Intelligence and the Systematic Literature Review. Soc. Sci. Comput. Rev. 2024, 42, 376–393. [Google Scholar] [CrossRef]
  24. Ma, Y. Text classification on imbalanced data: Application to systematic reviews automation. Masters Abstr. Int. 2007, 46, 1578. [Google Scholar] [CrossRef]
  25. Ros, R.; Bjarnason, E.; Runeson, P. A Machine Learning Approach for Semi-Automated Search and Selection in Literature Studies. In Proceedings of the 21st International Conference on Evaluation and Assessment in Software Engineering, New York, NY, USA, 15–16 June 2017; EASE ’17. pp. 118–127. [Google Scholar] [CrossRef]
  26. Cohen, A.; Ambert, K.; McDonagh, M. Cross-Topic Learning for Work Prioritization in Systematic Review Creation and Update. J. Am. Med Informatics Assoc. 2009, 16, 690–704. [Google Scholar] [CrossRef]
  27. Gonzalez-Toral, S.; Freire, R.; Gualán, R.; Saquicela, V. A ranking-based approach for supporting the initial selection of primary studies in a Systematic Literature Review. In Proceedings of the 2019 XLV Latin American Computing Conference (CLEI), Panama City, Panama, 30 September–4 October 2019; pp. 1–10. [Google Scholar] [CrossRef]
  28. Khraisha, Q.; Put, S.; Kappenberg, J.; Warraitch, A.; Hadfield, K. Can large language models replace humans in systematic reviews? Evaluating GPT-4’s efficacy in screening and extracting data from peer-reviewed and grey literature in multiple languages. Res. Synth. Methods 2024, 15, 616–626. [Google Scholar] [CrossRef] [PubMed]
  29. Alshami, A.; Elsayed, M.; Ali, E.; Eltoukhy, A.E.E.; Zayed, T. Harnessing the Power of ChatGPT for Automating Systematic Review Process: Methodology, Case Study, Limitations, and Future Directions. Systems 2023, 11, 351. [Google Scholar] [CrossRef]
  30. Qureshi, R.; Shaughnessy, D.; Gill, K.; Robinson, K.; Li, T.; Agai, E. Are ChatGPT and large language models "the answer" to bringing us closer to systematic review automation? Syst. Rev. 2023, 12, 72. [Google Scholar] [CrossRef]
  31. Manning, C.; Surdeanu, M.; Bauer, J.; Finkel, J.; Bethard, S.; McClosky, D. The Stanford CoreNLP Natural Language Processing Toolkit. In Proceedings of the 52nd Annual Meeting of the Association for Computational Linguistics: System Demonstrations, Baltimore, MD, USA, 23–24 June 2014; Bontcheva, K., Zhu, J., Eds.; pp. 55–60. [Google Scholar] [CrossRef]
  32. Webster, J.J.; Kit, C. Tokenization as the initial phase in NLP. In Proceedings of the 14th Conference on Computational Linguistics, Nantes, France, 14–16 August 1992; Association for Computational Linguistics: Stroudsburg, PA, USA, 1992. [Google Scholar] [CrossRef]
  33. Loper, E.; Bird, S. NLTK: The Natural Language Toolkit. arXiv 2002. [Google Scholar] [CrossRef]
  34. Sammut, C.; Webb, G.I. (Eds.) TF–IDF. In Encyclopedia of Machine Learning; Springer: Boston, MA, USA, 2010; pp. 986–987. [Google Scholar] [CrossRef]
  35. Ramos, J.E. Using TF-IDF to Determine Word Relevance in Document Queries. In Proceedings of the First Instructional Conference on Machine Learning, Los Angeles, CA, USA, 23–24 June 2003. [Google Scholar]
  36. Honnibal, M.; Montani, I. spaCy 2: Natural language understanding with Bloom embeddings, convolutional neural networks and incremental parsing. Appear 2017, 7, 411–420. [Google Scholar]
  37. Wang, W.; Wei, F.; Dong, L.; Bao, H.; Yang, N.; Zhou, M. MiniLM: Deep Self-Attention Distillation for Task-Agnostic Compression of Pre-Trained Transformers. arXiv 2020. [Google Scholar] [CrossRef]
  38. Wang, W.; Bao, H.; Huang, S.; Dong, L.; Wei, F. MiniLMv2: Multi-Head Self-Attention Relation Distillation for Compressing Pretrained Transformers. arXiv 2020. [Google Scholar] [CrossRef]
  39. Reimers, N.; Gurevych, I. Sentence-BERT: Sentence Embeddings using Siamese BERT-Networks. In Proceedings of the 2019 Conference on Empirical Methods in Natural Language Processing; Association for Computational Linguistics: Stroudsburg, PA, USA, 2019. [Google Scholar]
  40. Jiang, A.Q.; Sablayrolles, A.; Mensch, A.; Bamford, C.; Chaplot, D.S.; de las Casas, D.; Bressand, F.; Lengyel, G.; Lample, G.; Saulnier, L.; et al. Mistral 7B. arXiv 2023. [Google Scholar]
  41. Wang, L.; Yang, N.; Huang, X.; Yang, L.; Majumder, R.; Wei, F. Improving Text Embeddings with Large Language Models. arXiv 2024. [Google Scholar]
  42. Jovanovic, M.; Mitrov, G.; Zdravevski, E.; Lameski, P.; Colantonio, S.; Kampel, M.; Tellioglu, H.; Florez-Revuelta, F. Ambient Assisted Living: Scoping Review of Artificial Intelligence Models, Domains, Technology, and Concerns. J. Med. Internet Res. 2022, 24, e36553. [Google Scholar] [CrossRef]
  43. Gabriel, C.L.; Pires, I.M.; Coelho, P.J.; Zdravevski, E.; Lameski, P.; Mewada, H.; Madeira, F.; Garcia, N.M.; Carreto, C. Mobile and wearable technologies for the analysis of Ten Meter Walk Test: A concise systematic review. Heliyon 2023, 9, e16599. [Google Scholar] [CrossRef]
  44. Stanoev, B.; Mitrov, G.; Kulakov, A.; Mirceva, G.; Lameski, P.; Zdravevski, E. Automating Feature Extraction from Entity-Relation Models: Experimental Evaluation of Machine Learning Methods for Relational Learning. Big Data Cogn. Comput. 2024, 8, 39. [Google Scholar] [CrossRef]
Figure 1. Overview of the process of user-driven dataset generation.
Bdcc 08 00110 g001
Figure 2. Box plot representing rank distribution for selected papers across multiple datasets.
Bdcc 08 00110 g002
Figure 3. Median rank of selected papers across review papers.
Bdcc 08 00110 g003
Table 1. Datasets summary information.
DatasetPapers ProvidedPapers Selected
Driving Healthcare Monitoring13,51830
Ambient Assisted Living [42]26,331108
10 Metre Walks [43]670822
Venture Capital17,133150
Relational Learning [44]18,71123
Table 2. Global performance metrics across datasets—part 1.
DatasetAlgorithmTop 100Precision@100Recall@100Top 500Precision@500Recall@500
Driving Healthcare MonitoringSemantic Matching10.010.03390.0180.3
TF-IDF000000
Trigram000000
SpaCy000000
MiniLM30.030.180.0160.266
E5 Mistral10.010.033100.020.333
WSM + MiniLM250.250.833300.061
Ambient Assisted LivingSemantic Matching80.080.074390.0780.361
TF-IDF000000
Trigram000000
SpaCy00010.0020.009
MiniLM40.040.037150.030.138
E5 Mistral50.050.046110.0220.102
WSM + MiniLM500.450.4621080.2161
10 m WalksSemantic Matching50.050.227130.0260.59
TF-IDF000000
Trigram000000
SpaCy00010.0020.045
MiniLM40.040.181120.0240.545
E5 Mistral70.070.318170.0340.773
WSM + MiniLM220.221220.0441
Venture CapitalSemantic Matching50.050.033260.0520.173
TF-IDF00020.0040.013
Trigram00050.010.033
SpaCy30.030.02120.0240.08
MiniLM190.190.126540.1080.36
E5 Mistral90.090.06450.090.3
WSM + MiniLM310.310.206870.1740.58
Relational LearningSemantic Matching10.010.043100.020.434
TF-IDF00030.0060.13
Trigram10.010.04330.0060.13
SpaCy00010.0020.043
MiniLM70.070.3170.0340.739
E5 Mistral60.060.261180.0360.783
WSM + MiniLM20.020.086130.0260.565
For all metrics, bigger numbers mean better performance for the algorithm.
Table 3. Global performance metrics across datasets—part 2.
DatasetAlgorithmTop 1000Precision@1000Recall@1000AverageRankMedianRank
Driving Healthcare MonitoringSemantic Matching120.0120.419581653
TF-IDF00074797376
Trigram00072487409
SpaCy10.0010.0355785207
MiniLM150.0150.517641071
E5 Mistral170.0170.5671171660
WSM + MiniLM300.0316058
Ambient Assisted LivingSemantic Matching560.0560.5181884931
TF-IDF00016,57318,044
Trigram00015,59417,355
SpaCy60.0060.05510,7949891
MiniLM200.020.18566454412
E5 Mistral230.0230.21339142777
WSM + MiniLM1080.1081128112
10 m WalksSemantic Matching160.0160.727645394
TF-IDF00032923109
Trigram00029602887
SpaCy50.0050.22725301980
MiniLM190.0190.864631362
E5 Mistral220.0221257187
WSM + MiniLM220.02212425
Venture CapitalSemantic Matching440.0440.29329642493
TF-IDF80.0080.05369966561
Trigram120.0120.0862555746
SpaCy200.020.13348583857
MiniLM770.0770.5131878953
E5 Mistral760.0760.5071921976
WSM + MiniLM1380.1380.92454418
Relational LearningSemantic Matching130.0130.5651149632
TF-IDF30.0030.13069386536
Trigram30.0030.13060145167
SpaCy10.0010.04373767790
MiniLM190.0190.826686222
E5 Mistral200.020.87354171
WSM + MiniLM190.0190.826761319
For Top 1000, Precision@1000, and Recall@1000, bigger numbers mean better performance for the algorithm. For AverageRank and MedianRank, smaller numbers mean better performance for the algorithm.
Table 4. Pairwise algorithm comparison across datasets.
Algorithm AAlgorithm BDatasetHRC AHRC BARDMRD
Driving Healthcare Monitoring1218+193+219
Ambient Assisted Living8127−4761−2902
Semantic MatchingMiniLM10 m Walks1111+13−38
Venture Capital49101+1086+1067
Relational Learning815+462+351
Driving Healthcare Monitoring822+786+354
Ambient Assisted Living8523−2031−1758
Semantic MatchingE5 Mistral10 m Walks517+387+178
Venture Capital46104+1042+1030
Relational Learning320+794+524
Driving Healthcare Monitoring1416+593+201
Ambient Assisted Living4068+2730+1352
MiniLME5 Mistral10 m Walks616+374+188
Venture Capital7971−44−38
Relational Learning1013+331+119
Driving Healthcare Monitoring030+1898+1600
Ambient Assisted Living998+1756+875
Semantic MatchingWSM + MiniLM10 m Walks022+620+374
Venture Capital20130+2509+2101
Relational Learning914+388+250
Driving Healthcare Monitoring030+1704+1013
Ambient Assisted Living0108+6516+4300
MiniLMWSM + MiniLM10 m Walks022+606+337
Venture Capital4146+1423+535
Relational Learning212−75−95
Driving Healthcare Monitoring030+1111+581
Ambient Assisted Living2106+3786+2666
E5 MistralWSM + MiniLM10 m Walks220+232+172
Venture Capital26124+1466+545
Relational Learning167−407−217
HRC = Higher Rank Count. ARD (Average Rank Difference) = AVG( R a n k A R a n k B ); (-) -> A is better; (+) -> B is better. MRD (Median Rank Difference) = MEDIAN( R a n k A R a n k B ); (-) -> A is better; (+) -> B is better.
Disclaimer/Publisher’s Note: The statements, opinions and data contained in all publications are solely those of the individual author(s) and contributor(s) and not of MDPI and/or the editor(s). MDPI and/or the editor(s) disclaim responsibility for any injury to people or property resulting from any ideas, methods, instructions or products referred to in the content.

